 Open Access Article
A DNAzyme-mediated signal amplification biosensor for ultrasensitive detection of lead ions based on SERS tags†
Wanqing
Teng
ab,
Jing
Zhao
b,
Qi
Li
b,
Pengfei
Shi
 b,
Jing
Zhang
a,
Mei
Yan
 *a and
Shusheng
Zhang
 *ab
*ab
aSchool of Chemistry and Chemical Engineering, University of Jinan, Jinan, 250022, PR China. E-mail: chm_yanm@126.com
bShandong Provincial Key Laboratory of Detection Technology for Tumor Markers, School of Chemistry and Chemical Engineering, Linyi University, Linyi 276000, Shandong, PR China. E-mail: shushzhang@126.com
First published on 20th October 2022
Abstract
The accumulation of trace heavy metals in the human body can be extremely damaging. Especially in the rapidly developing modern industrial society, heavy metal pollutants in the water environment are becoming more and more serious. Therefore, it is urgent to establish a rapid, accurate, effective and low-cost method for the detection of trace heavy metals. In this work, we propose a trace lead ion (Pb2+) detection strategy combining surface-enhanced Raman spectroscopy (SERS) with nucleic acid rolling circle amplification (RCA) for multiple signal amplification. Lead ions can specifically bind with Pb2+-dependent DNAzyme to achieve efficient cleavage of the substrate. Then, trace Pb2+ can be ultrasensitively detected by RCA and SERS based on biological barcoding techniques. Finally, we obtained a limit of detection (LOD, at a signal-to-noise ratio 3) of 3.1 × 10⁻¹⁷ M for Pb2+ and a linear relationship in the range of 10−16–2 × 10⁻¹² M. Additionally, the results of the interferometric test showed that the method is not affected by other metal ions and has good selectivity. Meanwhile, the formula provides a new and effective idea for the detection of heavy metal ions, which is also of great significance for ecological protection and environmental monitoring.
Introduction
In recent years, with the development of industry and the progress of society, environmental problems have become increasingly prominent. As is well-known, heavy metal pollutants have become one of the main sources of pollution in the water environment.1–4 Metallic pollutants released from industrial sources and domestic emissions accumulate gradually in the human body through the food chain. Excessive internal heavy metal ions will lead to many physical problems of humans.5 The lead ion (Pb2+) is one of the heavy metal pollutants. It is a heavy metal element with neurotoxic properties.6,7 It is well known that lead is not automatically metabolized and degraded in the body. Therefore, trace levels of Pb2+ in the human body will cause a variety of diseases.8 It can cause developmental delays to children, affect their growth and development, and even cause visual impairment.9 For adults, lead poisoning may cause bellyache, diarrhoea, headaches, agrypnia, somnolence and even coma, anaemia, kidney failure, and other diseases. Further Pb2+ can cause great damage to the human body at a very small amount (e.g. 10−6 levels). Therefore, it has become urgent to establish and develop a cost-saving, convenient, sensitive and specific method for the detection of trace Pb2+.Traditional methods for the analysis of Pb2+ include inductively coupled plasma mass spectrometry (ICP-MS), atomic absorption spectrophotometry (AAS), and atomic fluorescence spectrometry (AFS).10 ICP-MS has high cost and complex operation, so it is not suitable for analysis on scene.11,12 AAS mainly uses the colorimetric principle, and it has the advantages of high detection specificity and easy operation.13 However, most operations contain a color change process, which can cause errors because of the interference of the background color resulting in reduced sensitivity. AFS can also be used to detect low concentrations of analyses, but nucleic acid or enzyme sensors are more expensive. Colorimetric, fluorometric and electrochemical methods for the detection of heavy metal ions are convenient, fast and inexpensive.14,15 Nevertheless, some of them still face problems of non-specific aggregation of particles, signal burst and photo-bleaching, cross-sensitivity to other metal ions or lack of sensitivity.16 Therefore, the development of highly sensitive, selective, easy-to-operate, stable and portable detection methods is still very much needed.17
Currently, surface-enhanced Raman scattering (SERS) is one of the most popular detection techniques, offering prominent advantages in terms of enhanced Raman intensity against photo-bleaching and spectral multiplexing.18 With high sensitivity and selectivity, SERS has a wide range of applications in the detection of biologically active small molecules, nucleic acids, proteins, bacteria and cells. This technique utilizes rough metal surfaces as SERS signal enhancement substrates, such as colloidal particles (e.g. gold and silver nanoparticles). Although silver nanoparticles (AgNPs) have a strong SERS enhancement capability, their toxicity may hinder their clinical application. For gold nanoparticles (AuNPs), which are intrinsically non-toxic, the enhancement ability is relatively weak but can be compensated for by signal amplification strategies. Gold nanoparticles based on this reason were chosen as the SERS signal enhancement substrate for our work.19,20 In this article, we constructed biosensors to detect trace Pb2+ combining SERS and rolling circle amplification (RCA) techniques. The biosensor is characterized by its high sensitivity, fast sensing speed, low cost and the possibility of continuous detection, which can be beneficial for the highly sensitive, specific, simple and rapid detection of heavy metal ions in the environment. Among the recognition components of biosensing systems, nucleic acid aptamers are the best choice for biosensing systems because of their unique advantages such as high specificity, small molecular mass, stable structure, a wide range of target molecules, flexible signal output mechanism, easy synthesis and modification, which can effectively replace traditional enzymes and antibodies.21 DNAzyme is a functional nucleic acid molecule that has been screened in vitro.22,23 It is famous for its high stability, simplicity of synthesis and low cost. These DNAzymes possess a high affinity and specificity for specific metal ions.24,25 For example, the first reported DNAzyme was 400![[thin space (1/6-em)]](https://www.rsc.org/images/entities/char_2009.gif) 000-fold selective for Pb2+ than other interfering metal ions.26 In the presence of lead ions, DNAzyme can exhibit high specificity and faster reaction rates. Therefore, DNAzyme could be an effective platform for the detection of Pb2+. According to existing articles, simple, rapid, low-cost and highly sensitive methods for trace Pb2+ detection still need a breakthrough, especially with a lower limit of detection below 1 pM. Up to now, there are few studies on the detection of Pb2+ by SERS and RCA technology. Thereby, an amplification strategy combining SERS with nucleic acid signal magnification should be designed to significantly improve the sensitivity of trace Pb2+ detection.
000-fold selective for Pb2+ than other interfering metal ions.26 In the presence of lead ions, DNAzyme can exhibit high specificity and faster reaction rates. Therefore, DNAzyme could be an effective platform for the detection of Pb2+. According to existing articles, simple, rapid, low-cost and highly sensitive methods for trace Pb2+ detection still need a breakthrough, especially with a lower limit of detection below 1 pM. Up to now, there are few studies on the detection of Pb2+ by SERS and RCA technology. Thereby, an amplification strategy combining SERS with nucleic acid signal magnification should be designed to significantly improve the sensitivity of trace Pb2+ detection.
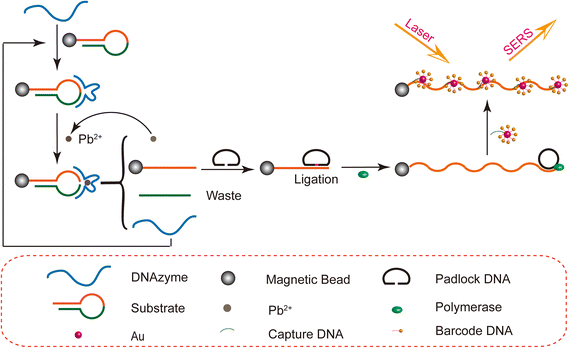
In this study, we use the DNAzyme cleavage cycle and biobarcoding technique, and cleverly combine SERS and RCA for multiple signal amplification to achieve ultrasensitive detection of Pb2+. As shown in Scheme 1, in the presence of Pb2+, DNAzyme efficiently cleaved the hairpin DNA. The resulting single DNA strands were amplified by rolling circle amplification to form the long single strands. Then, a large number of SERS probes were incubated with long single-stranded DNA to make samples. Finally, the concentration of Pb2+ is detected by measuring the intensity of the Raman signal.
Our SERS biosensor has good sensitivity and can detect trace Pb2+ in the range of 10−16–2 × 10⁻¹² M with a lower limit of detection of 3.1 × 10⁻¹⁷. It is also showed good selectivity and reproducibility with detection of Pb2+.
Materials and methods
Chemicals and materials
The main oligonucleotides used in the experiments were Rox-DNA, Capture DNA, padlock DNA and 17 × 10−2 (9 + 9) DNAzyme. The above oligonucleotides were ordered from Sangon Biotech (Shanghai) Co., Ltd. The oligonucleotide sequences are shown in Table S1.† Deoxynucleotide solution mixture (dNTPs, 10 mM), Phi29 DNA polymerase and T4 DNA ligase were ordered from New England Biolabs. Carboxy-modified magnetic beads (MBs) were purchased from Shanghai Carfee Biomedical Technology Co., Ltd. 1-Ethyl-3-(3-dimethylaminopropyl) carbodiimide (EDC), N-hydroxytryptamine (NHS), sodium citrate, and tetrachloroauric acid (HAuCl4·4H2O) were received from Sinopharm Chemical Reagent Co., Ltd. Ultrapure water (18.2 MΩ, Millipore) was used in the study. And all reagents are analytically pure.Instrumentation
The experiments were greatly assisted by a microscopic confocal laser Raman spectrometer (Renishaw inVia, England), a transmission electron microscope (JEOL JEM-2000, Japan) and a Cary 50 series spectrophotometer (Agilent Technologies, USA).Preparation of gold nanoparticles (AuNPs)
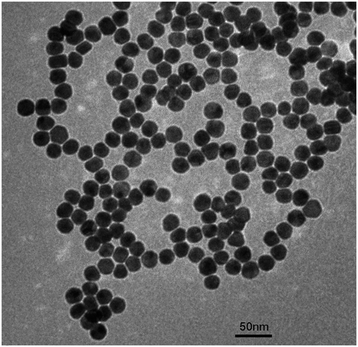
AuNPs were prepared according to previous reports.27 First, 50 mL of 0.01% HAuCl4 solution was transferred to a cleaned and dried three-neck flask. Then the three-neck flask was placed in an oil bath and heated while stirring. When the solution was refluxed, 2.6 mL of 1% aqueous sodium citrate was quickly added to the three-neck flask. Within 5 min, the colour of the solution changed from yellow to deep red. After the system had been refluxed continuously for 30 min, a stable deep red solution was obtained. The heating was stopped and the solution was cooled naturally to room temperature. This resulted in AuNPs with a concentration of 4 nM and a diameter of approximately 20 nm. Finally, the prepared solution was transferred to a clean brown glass container and stored at 4 °C.Fabrication of the biobarcode probe
Referring to the method described in a report.28 Firstly, 4 μL of 100 μM terminal sulfhydryl modified Rox-DNA and 6 μL of 1 μM capture DNA were added to 100 μL of freshly synthesized AuNPs and mixed absolutely. Afterwards, the mixture was frozen for two hours at −20 °C in a refrigerator protected from light. At the end of the freezing period, the samples were thawed naturally at room temperature. The sample was then centrifuged at 12![[thin space (1/6-em)]](https://www.rsc.org/images/entities/char_2009.gif) 000 rpm for 20 minutes three times to remove unbound free DNA from the supernatant and re-dispersed in ultrapure water.
000 rpm for 20 minutes three times to remove unbound free DNA from the supernatant and re-dispersed in ultrapure water.
Immobilization of hairpin DNA onto MBs
Immobilization of hairpin DNA onto MBs was referred to previous reports.29 Firstly, the carboxyl modified magnetic bead suspension (MBs) was sonicated for 5 min. Then, 70 μL MBs were placed in a 1.5 mL centrifuge tube. After being washed three times with 200 μL imidazole hydrochloric acid buffer (0.1 M, pH = 6.8), the supernatant was removed by magnetic separation. After this step, EDC and NHS (0.1 M, prepared with 0.1 M imidazole hydrochloric acid buffer) were added (200 μL) into the 1.5 mL centrifuge tube sample respectively, and gently shaken for 30 minutes in a shaker to activate MBs. Then MBs were rinsed three times with 70 μL PBS (0.1 M, pH = 7.4). Next 200 μL 1.0 × 10⁻⁶ M Hairpin DNA was incubated in PCR for 4 h. Then, the incubated Hairpin DNA was dropped on the activated MBs and incubated at 37 °C for 12 h. Finally, the extra hairpin DNA was removed by magnetic separation. Hairpin DNA immobilized on the MBs was washed three times with 200 μL 0.01 M PBS (pH = 7.4). Then the precipitate was dispersed in 200 μL PBS buffer (0.01 M, pH = 7.4). And it was stored at 4 °C for later use.Sample preparation
Firstly, 5 μL 10 μM 17 × 10−2 (9 + 9) DNAzyme was added to 10 μL Hairpin DNA-modified MB suspension and hybridized in a gas bath shaker at 37 °C for 1 h. Subsequently, 5 μL Pb2+ solutions and HEPES buffer (25 mM) were added and incubated with gentle shaking at 37 °C for 1 h. Generally, the mixed solution was washed with PBS buffer three times. Then padlock DNA (10 μL, 10 μM), T4 DNA ligase (1 μL, 100 U μL−1), T4 DNA ligase buffer were added to the system and reacted at room temperature for 2 hours. So, the padlock DNA was linked into a loop and captured by the DNA modified on the MBs. Then the free padlock DNA was removed by magnetic separation. Afterwards 5 μL 10 mM dNTPs, 0.5 μL 10 U μL−1 Phi29 DNA polymerase, 5 μL 10× Phi29 DNA polymerase buffer were added and reacted in a 37 °C air bath shaker for 1 h to complete the RCA reaction. Subsequently, the RCA product was mixed with 6 μL of freshly prepared biobarcode, shaken and reacted for 2 h at 37 °C. The unreacted biobarcode was removed using a magnetic separation rack. The precipitate was washed with 20 μL 0.01 M PBS three times. Finally, they were re-dispersed in PBS buffer (0.01 M, pH = 7.4).Raman detection analysis
Finally, 1.5 μL of sample was added to the gold chip and air dried at room temperature before Raman analysis. The Raman detection was carried out using a point sweep method, with a Raman shift range from 500 to 2200 cm−1. A laser with 633 nm wavelength and 5 mW power was used. Furthermore, the SERS spectra are available with a resolution of cm−1 or better. The Raman acquisition time was 10 s.Results and discussion
Working principle of the SERS detection system
In this study, it's the first time to detect heavy metal ions via combining DNA amplification and SERS technology. The SERS detection system consists of a DNA enzyme cycle, rolling circle amplification (RCA) and biobarcode of SERS activity which relies on AuNPs to amplify the Raman signal. As shown in Scheme 1, we made the biobarcode (SERS probes) by modifying Rox-DNA with capture DNA through Au–S bonds on the surface of freshly formulated gold nanoparticles. The hairpin DNA in the experiments is modified with an amino group, and the MBs are modified with a carboxyl functional group. A MBs–DNA conjugate can be formed based on the amidation reaction. Subsequently, the DNAzyme (DNA1) is mixed with the MBs–DNA and it will hybridize with the hairpin DNA of its complementary hybridization region. Afterwards, the dropped lead ions will be specifically captured by DNA1. In the presence of the lead ions, the DNAzyme acts as a shear at the recognition site of the hairpin DNA. As a result, the hairpin DNA is broken and numerous single-stranded DNA ligated with MBs (DNA2) are released as RCA primers. At the same time the unreacted DNAzyme is released back into the solution and the shearing reaction continues. Thus, a complementary–shearing–complementary cycle was formed. At the end of the reaction, the mixture is separated by a magnetic frame. The system yields massive DNA2 with a sequence complementary to the padlock DNA. The padlock DNA is gradually ligated into a loop by the action of T4 ligase. Afterwards, the system undergoes a rolling circle reaction (RCA) with Phi29 DNA polymerase and dNTPs. This process produces a lot of long single strands of DNA that can bind to biobarcode probes. The SERS probe hybridizes with these long single strands of DNA by capture DNA. Finally, surface-enhanced Raman spectroscopy (SERS) detection is performed under laser irradiation. Ultimately, the concentration of Pb2+ could be detected by Raman signal peak intensity.Characterization
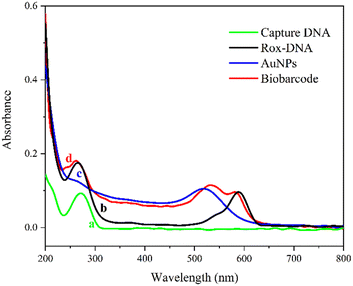
The prepared AuNPs were characterized by transmission electron microscopy (TEM). As shown in Fig. 1. The AuNPs were evenly distributed in the shape of spheres. The average diameter was approximately 20 nm. And we have also characterized the morphology of the magnetic beads (MBs) by TEM. From Fig. S5,† the MBs were spherical particles with an average diameter of 150 nm. In addition, the SERS probes were characterized by a UV-vis spectrometer. As illustrated in Fig. 2, curve a shows the characteristic absorbance of capture DNA at around 260 nm. Curve b is the UV-vis spectrum of Rox-DNA. It did not only exhibit the absorption peak of DNA at 260 nm, but also showed the characteristic absorbance of modified rhodamine molecules at 500–600 nm. This curve trend was consistent with previous reports.30,31 Curve c exhibits the characteristic absorbance of AuNPs at 520 nm. Obviously, curve d shows the characteristic absorbance of both DNA and rhodamine as well as AuNPs, which directly prove that capture DNA and Rox-DNA were labeled onto AuNPs. It indicated that the biobarcode (SERS probe) was prepared successfully.Feasibility validation
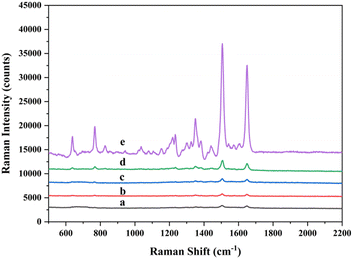
According to previous methods,30,32 the intensity of the characteristic Raman peak at 1499 cm−1 of Rox was selected as the detection intensity. And the inset figure (see the ESI†) shows the molecular structure of Rox. In order to verify the feasibility of our experimental, a series of control experiments were carried out. Except for the reagent as a variable, the reaction conditions of control experiments were absolutely the same. The concentration of Pb2+ was 10 fM in the control experiments. The SERS spectra obtained are shown in Fig. 3. Curve a shows the blank experiment. Because of the absence of lead ions, the DNAzyme cleavage reaction cannot be activated. So, the SERS spectra had a very low SERS signal. Curve b shows the case with Pb2+ but without DNAzyme under the same conditions as experiment a. In the absence of DNAzyme, hairpin DNA could not cleavage and the biobarcode was unreactive with it. There was no doubt that we have obtained a spectrum with a low Raman signal. Curve c shows the absence of hairpin DNA on the MBs. As can be seen from the graph, the intensity of the SERS signal for curve c was similar to blank experiment a. Because the enzymatic cleavage cycle could not be carried out in the system, there was no RCA primer. Therefore, it affected the RCA reaction. Besides, curve d shows the presence of Pb2+, DNAzyme and hairpin DNA on the MBs, but the lack of polymerase. The DNA strand obtained by the enzymatic cleavage cycle cannot be subjected to the RCA reaction due to the absence of polymerase. Therefore, the SERS assay had a small peak intensity. It was clear from the strong SERS signal that the whole cycle can only be carried out in the presence of Pb2+, DNAzyme, polymerase and hairpin DNA immobilized on MBs (curve e). In addition, the results indicated the feasibility of the experiment.Sensitivity test
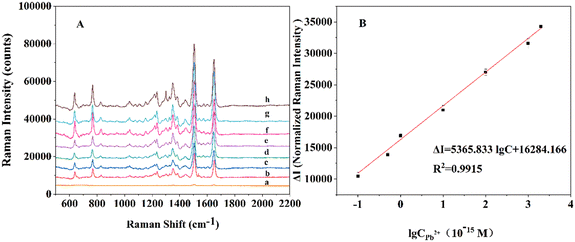
Under the optimal experimental conditions (see the ESI†), the sensitivity of the SERS biosensor to Pb2+ detection was verified. In Fig. 4A, with the increase of Pb2+ concentration, the SERS intensity of the characteristic peak at 1499 cm−1 enhanced. In Fig. 4B, the SERS signal intensity showed a good linear relationship with the Pb2+ concentration, and the regression equation was obtained as ΔI = 5365.833![[thin space (1/6-em)]](https://www.rsc.org/images/entities/char_2009.gif) lg
lg![[thin space (1/6-em)]](https://www.rsc.org/images/entities/char_2009.gif) C + 16284.166 (C is the concentration of Pb2+, ΔI = I − I0, I is the Raman intensity in the presence of Pb2+, I0 is the Raman intensity in the absence of Pb2+, R = 0.9915). The limit of detection (LOD) was calculated by equation LOD = 3σ/k, in which k is the slope of the linear curve, and σ is the standard deviation of blank samples. From this we can calculate our detection limit which was 3.1 × 10⁻¹⁷ M. In addition, the analytical performance of the method was compared with various recently published methods for Pb2+ detection and the results are shown in Table 1. The results displayed that our biosensor had a more sensitive detection limit than previously reported methods.
C + 16284.166 (C is the concentration of Pb2+, ΔI = I − I0, I is the Raman intensity in the presence of Pb2+, I0 is the Raman intensity in the absence of Pb2+, R = 0.9915). The limit of detection (LOD) was calculated by equation LOD = 3σ/k, in which k is the slope of the linear curve, and σ is the standard deviation of blank samples. From this we can calculate our detection limit which was 3.1 × 10⁻¹⁷ M. In addition, the analytical performance of the method was compared with various recently published methods for Pb2+ detection and the results are shown in Table 1. The results displayed that our biosensor had a more sensitive detection limit than previously reported methods.
| No. | Detection method | Detection limit | Linear range | Ref. |
|---|---|---|---|---|
| 1 | Colorimetric method | 602 pM | 0.2–30 nM | 33 |
| 2 | Colorimetric method | 1 nM | 10–800 nM | 34 |
| 3 | Colorimetric method | 1.8 μM | 0.1–1 mM | 35 |
| 4 | Fluorescence | 4.1 nM | 0–50 nM | 36 |
| 5 | Fluorescence | 0.6 nM | 9.9–435 nM | 37 |
| 6 | Fluorescence | 200 pM | 200 pM–20 nM | 38 |
| 7 | Electrochemical detection | 3.3 fM | 10 fM–200 nM | 39 |
| 8 | Electrochemical detection | 312 pM | 0.6–50 nM | 40 |
| 9 | Electrochemical detection | 18 pM | 50 pM–1000 nM | 41 |
| 10 | SERS | 0.42 pM | 1 pM–100 nM | 42 |
| 11 | SERS | 5 pM | 0.01–1.0 nM | 43 |
| 12 | SERS | 4.31 pM | 10 pM–100 nM | 44 |
| 13 | SERS | 3.1 × 10⁻¹⁷ M | 10−16–2 × 10⁻¹² M | This work |
Reproducibility
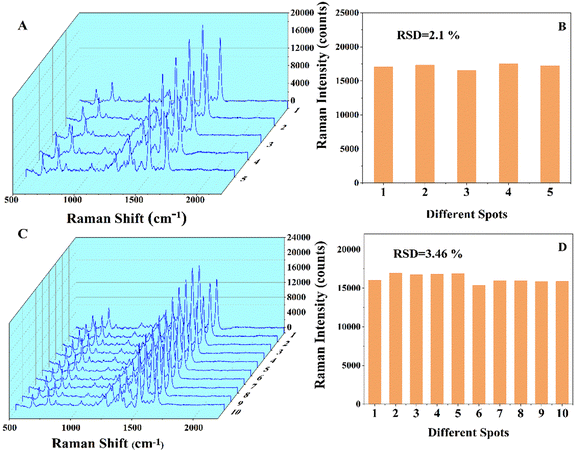
The reproducibility of the SERS biosensor for this experiment was tested under optimal experimental conditions and the concentration of Pb2+ is 1 fM. Fig. 5A shows the Raman spectra of five parallel SERS aptasensors, and the relative standard deviation (RSD) is 3.46% (Fig. 5B). In addition, Fig. 5C shows the Raman spectra of 10 random spots on a SERS aptasensor with an RSD of 2.1% (Fig. 5D). The results indicate that the SERS biosensor is capable of detecting Pb2+ with good reproducibility.Selectivity
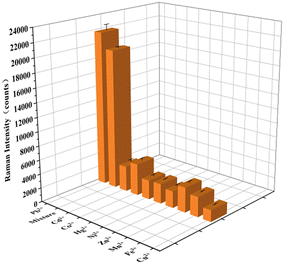
Finally, the selectivity of the designed SERS biosensor for the detection of Pb2+was verified. The Raman signals were detected for the same concentrations (10 fM) of Cd2+, Co2+, Hg2+, Ni2+, Zn2+, Mn2+, Fe3+, Cu2+ and all the interfering ions mixed with Pb2+. All the tests were performed under the optimal experimental conditions. Fig. 6 was compared the SERS intensities of the eight non-specific metal ions with the same concentration of lead ions. Obviously, the SERS signal of Pb2+ (10 fM) was much higher than other interfering metal ions. The experimental test results show that the SERS aptasensor has good specificity for lead ions.Actual sample detection
In order to test the practicality of the designed SERS biosensor, we performed Pb2+ detection in a real water environment. We added different concentrations of Pb2+ (5,50 and 100 fM) to tap water. And the recovery results are shown in Table 2. Relative standard deviations (RSDs) are within 6.9% and the recovery rate ranged from 95.8% to 109.8%. Therefore, the designed SERS biosensor can be well used for Pb2+ detection in a real water environment.| Samples | Added (fM) | Found | Recovery | RSD |
|---|---|---|---|---|
| 1 | 5 | 4.79 | 95.8–109.8% | 6.9% |
| 2 | 50 | 48.86 | 97.7–104.9% | 4.1% |
| 3 | 100 | 107.4 | 97.5–107.4% | 4.9% |
Conclusions
In this study, we firstly combined the rolling circle amplification and surface-enhanced Raman spectroscopy techniques, which greatly enhanced the signal strength and realized trace Pb2+ detection. The strategy is based on the dual signal amplification of DNAzyme-mediated nucleic acid signal amplification and SERS signal enhancement. The DNAzyme is added to the assembled MBs–DNA–biobarcode Raman probe conjugate. After the cycling reaction, the DNAzyme continuously participated in the reaction and the signal was amplified. Finally, ultra-sensitive detection of trace Pb2+ is achieved by surface-enhanced Raman spectroscopy (SERS). AuNPs provide a relatively large specific surface area for the signal-labeled groups. The enzymatic cycle allows the signal to be continuously amplified with the help of a certain concentration of DNA enzyme. Therefore, this method has a very high sensitivity. The minimum detection concentration of Pb2+ was found to be 3.1 × 10⁻¹⁷ M. The linear regression equation is ΔI = 5365.833![[thin space (1/6-em)]](https://www.rsc.org/images/entities/char_2009.gif) lg
lg![[thin space (1/6-em)]](https://www.rsc.org/images/entities/char_2009.gif) C + 16284.166, R2 = 0.9915. The relative standard deviations (RSDs) for the determination of Pb2+ in environmental samples using the established method are within 6.9%. And the recovery rate ranged from 95.8% to 109.8%. In addition, the experiments used surface-enhanced Raman spectroscopy (SERS) as a method of detection with high precision and efficiency. The combination of recycling amplification and SERS spectroscopy can provide a simpler and faster way to achieve high sensitivity for the detection of other heavy metal ions. In the future, it is also expected to contribute to environmental detection and ecological protection.
C + 16284.166, R2 = 0.9915. The relative standard deviations (RSDs) for the determination of Pb2+ in environmental samples using the established method are within 6.9%. And the recovery rate ranged from 95.8% to 109.8%. In addition, the experiments used surface-enhanced Raman spectroscopy (SERS) as a method of detection with high precision and efficiency. The combination of recycling amplification and SERS spectroscopy can provide a simpler and faster way to achieve high sensitivity for the detection of other heavy metal ions. In the future, it is also expected to contribute to environmental detection and ecological protection.
Conflicts of interest
There are no conflicts to declare.Acknowledgements
The present work was supported by the National Natural Science Foundation of China (22076073, 52173168, 22007038), a project of the Taishan Scholars Program (TSQN 20161036), the Shandong Provincial Natural Science Foundation (ZR2020LFG009).Notes and references
- D.-P. Häder, A. T. Banaszak, V. E. Villafañe, M. A. Narvarte, R. A. González and E. W. Helbling, Sci. Total Environ., 2020, 713, 136586 CrossRef PubMed.
- J. Dalmieda and P. Kruse, Sensors, 2019, 19, 5134 CrossRef CAS PubMed.
- M. B. Gumpu, S. Sethuraman, U. M. Krishnan and J. B. B. Rayappan, Sens. Actuators, B, 2015, 213, 515–533 CrossRef CAS.
- Y. Zhou, L. Tang, G. Zeng, C. Zhang, Y. Zhang and X. Xie, Sens. Actuators, B, 2016, 223, 280–294 CrossRef CAS.
- Y. Guo, J. Li, X. Zhang and Y. Tang, Analyst, 2015, 140, 4642–4647 RSC.
- Y. Zhang, C. Wu, H. Liu, M. R. Khan, Z. Zhao, G. He, A. Luo, J. Zhang, R. Deng and Q. He, J. Hazard. Mater., 2021, 406, 124790 CrossRef CAS PubMed.
- Y. Peng, Y. Li, L. Li and J.-J. Zhu, J. Hazard. Mater., 2018, 359, 121–128 CrossRef CAS PubMed.
- S. Dolati, M. Ramezani, K. Abnous and S. M. Taghdisi, Sens. Actuators, B, 2017, 246, 864–878 CrossRef CAS.
- Z. Wang, B. Chen, J. Duan, T. Hao, X. Jiang, Z. Guo and S. Wang, J. Anal. Chem., 2015, 70, 339–345 CrossRef CAS.
- K. Li, H. Yang, X. Yuan and M. Zhang, Microchem. J., 2021, 160, 105726 CrossRef CAS.
- J. Ding, Y. Liu, D. Zhang, M. Yu, X. Zhan, D. Zhang and P. Zhou, Microchim. Acta, 2018, 185, 545 CrossRef PubMed.
- Q. Zhu, L. Liu, Y. Xing and X. Zhou, J. Hazard. Mater., 2018, 355, 50–55 CrossRef CAS PubMed.
- N. Karachi, O. Azadi, R. Razavi, A. Tahvili and Z. Parsaee, J. Photochem. Photobiol., A, 2018, 360, 152–165 CrossRef CAS.
- S. Li, L. Xu, W. Ma, H. Kuang, L. Wang and C. Xu, Small, 2015, 11, 3435–3439 CrossRef CAS PubMed.
- X. Song, B. Fu, Y. Lan, Y. Chen, Y. Wei and C. Dong, Spectrochim. Acta, Part A, 2018, 204, 301–307 CrossRef CAS PubMed.
- J. Li, W. Wang, H. Zhang, Z. Lu, W. Wu, M. Shu and H. Han, Anal. Chem., 2020, 92, 4900–4907 CrossRef CAS PubMed.
- S. Sowmiyha, V. V. Kumar, J. Pitchaimani, V. Madhu, R. Thiagarajan, N. S. Subramanian and S. P. Anthony, J. Lumin., 2018, 203, 42–49 CrossRef CAS.
- Y. Wang, X. Zhao, Z. Yu, Z. Xu, B. Zhao and Y. Ozaki, Angew. Chem., Int. Ed., 2020, 59, 18822 CrossRef CAS.
- D. Lu, X. Lin, C. Chen, Y. Lu, S. Feng, Z. Huang, R. You, J. Chen and Y. Wu, Anal. Chim. Acta, 2020, 1138, 150–157 CrossRef CAS PubMed.
- M. R. Shattique and M. Stepanova, Plasmonics, 2020, 15, 427–434 CrossRef CAS.
- Z. Huang, A. Zhang, Q. Zhang and D. Cui, J. Mater. Chem. B, 2019, 7, 3755–3774 RSC.
- L. Li, X. Ma, W. Dong, P. Miao and Y. Tang, Bioconjugate Chem., 2018, 29, 1021–1024 CrossRef CAS PubMed.
- Y. Zhu, D. Deng, L. Xu, Y. Zhu, L. Wang, B. Qi and C. Xu, Anal. Methods, 2015, 7, 662–666 RSC.
- W. Yun, D. Cai, J. Jiang, P. Zhao, Y. Huang and G. Sang, Biosens. Bioelectron., 2016, 80, 187–193 CrossRef CAS PubMed.
- J. Liu, A. K. Brown, X. Meng, D. M. Cropek, J. D. Istok, D. B. Watson and Y. Lu, Proc. Natl. Acad. Sci., 2007, 104, 2056–2061 CrossRef CAS PubMed.
- T. Lan and Y. Lu, in Interplay between Metal Ions and Nucleic Acids, ed. A. Sigel, H. Sigel and R. K. O. Sigel, Springer Netherlands, Dordrecht, 2012, pp. 217–248 Search PubMed.
- K. C. Grabar, P. C. Smith, M. D. Musick, J. A. Davis, D. G. Walter, M. A. Jackson, A. P. Guthrie and M. J. Natan, J. Am. Chem. Soc., 1996, 118, 1148–1153 CrossRef CAS.
- B. Liu and J. Liu, J. Am. Chem. Soc., 2017, 139, 9471–9474 CrossRef CAS PubMed.
- S. Zhang, Y. Yan and S. Bi, Anal. Chem., 2009, 81, 8695–8701 CrossRef CAS PubMed.
- Y. Lu, G. L. Liu and L. P. Lee, Nano Lett., 2005, 5, 5–9 CrossRef CAS PubMed.
- J. Hu and C.-Y. Zhang, Anal. Chem., 2010, 82, 8991–8997 CrossRef CAS PubMed.
- A. M. Michaels, M. Nirmal and L. E. Brus, J. Am. Chem. Soc., 1999, 121, 9932–9939 CrossRef CAS.
- S. M. Taghdisi, N. M. Danesh, P. Lavaee, A. S. Emrani, M. Ramezani and K. Abnous, RSC Adv., 2015, 5, 43508–43514 RSC.
- H. Sun, L. Yu, H. Chen, J. Xiang, X. Zhang, Y. Shi, Q. Yang, A. Guan, Q. Li and Y. Tang, Talanta, 2015, 136, 210–214 CrossRef CAS PubMed.
- Y. Yu, S. S. Naik, Y. Oh, J. Theerthagiri, S. J. Lee and M. Y. Choi, J. Hazard. Mater., 2021, 420, 126585 CrossRef CAS PubMed.
- Y. Wang, M. Lv, Z. Chen, Z. Deng, N. Liu, J. Fan and W. Zhang, Front. Chem., 2020, 8 Search PubMed.
- Z. S. Qian, X. Y. Shan, L. J. Chai, J. R. Chen and H. Feng, Biosens. Bioelectron., 2015, 68, 225–231 CrossRef CAS PubMed.
- W. Li, Y. Yang, J. Chen, Q. Zhang, Y. Wang, F. Wang and C. Yu, Biosens. Bioelectron., 2014, 53, 245–249 CrossRef CAS PubMed.
- M. Qing, Y. Yuan, W. Cai, S. Xie, Y. Tang, R. Yuan and J. Zhang, Sens. Actuators, B, 2018, 263, 469–475 CrossRef CAS.
- S. M. Taghdisi, N. M. Danesh, P. Lavaee, M. Ramezani and K. Abnous, Sens. Actuators, B, 2016, 234, 462–469 CrossRef CAS.
- H. Jin, D. Zhang, Y. Liu and M. Wei, RSC Adv., 2020, 10, 6647–6653 RSC.
- Y. Wu, C. Fu, J. Xiang, Y. Cao, Y. Deng, R. Xu, H. Zhang and W. Shi, Anal. Chim. Acta, 2020, 1127, 106–113 CrossRef CAS PubMed.
- W. Xu, A. Zhao, F. Zuo, R. Khan, H. M. J. Hussain and J. Li, Anal. Bioanal. Chem., 2020, 412, 4565–4574 CrossRef CAS PubMed.
- Q. He, Y. Han, Y. Huang, J. Gao, Y. Gao, L. Han and Y. Zhang, Sens. Actuators, B, 2021, 341, 130031 CrossRef CAS.
Footnote |
| † Electronic supplementary information (ESI) available. See DOI: https://doi.org/10.1039/d2sd00147k |
| This journal is © The Royal Society of Chemistry 2023 |

