
 Open Access Article
 This Open Access Article is licensed under a Creative Commons Attribution-Non Commercial 3.0 Unported Licence
An expeditive and green chemo-enzymatic route to diester sinapoyl-L-malate analogues: sustainable bioinspired and biosourced UV filters and molecular heaters†
Benjamin
Rioux‡
 a,
Louis M. M.
Mouterde‡
a,
Jimmy
Alarcan‡
b,
Temitope T.
Abiola‡
cd,
Matthias J. A.
Vink‡
e,
Jack M.
Woolley‡
c,
Aurélien A. M.
Peru
a,
Matthieu M.
Mention
a,
Fanny
Brunissen
a,
Giel
Berden
e,
Jos
Oomens
*e,
Albert
Braeuning
*b,
Vasilios G.
Stavros
*cf and
Florent
Allais
*a
a,
Louis M. M.
Mouterde‡
a,
Jimmy
Alarcan‡
b,
Temitope T.
Abiola‡
cd,
Matthias J. A.
Vink‡
e,
Jack M.
Woolley‡
c,
Aurélien A. M.
Peru
a,
Matthieu M.
Mention
a,
Fanny
Brunissen
a,
Giel
Berden
e,
Jos
Oomens
*e,
Albert
Braeuning
*b,
Vasilios G.
Stavros
*cf and
Florent
Allais
*a
aURD Agro-Biotechnologies Industrielles (ABI), CEBB, AgroParisTech, 51110, Pomacle, France. E-mail: florent.allais@agroparistech.fr
bDepartment of Food Safety, German Federal Institute for Risk Assessment, Max-Dohrn-Str. 8-10, 10589, Berlin, Germany. E-mail: albert.braeuning@bfr.bund.de
cDepartment of Chemistry, University of Warwick, Gibbet Hill Road, CV4 7AL, Coventry, UK. E-mail: v.stavros@warwick.ac.uk
dDepartment of Chemistry, Lash Miller Chemical Laboratories, 80 St. George Street, Toronto, ON M5S 3H6, Canada
eInstitute for Molecules and Materials, FELIX Laboratory, Radboud University, Toernooiveld 7, 6525ED, Nijmegen, Netherlands. E-mail: j.oomens@science.ru.nl
fSchool of Chemistry, University of Birmingham, Edgbaston, Birmingham B15 2TT, UK. E-mail: v.stavros@bham.ac.uk
First published on 21st November 2023
Abstract
Sinapoyl malate, naturally present in plants, has proved to be an exceptional UV filter and molecular heater for plants. Although there are nowadays industrially relevant sustainable synthetic routes to sinapoyl malate, its incorporation into certain cosmetic formulations, as well as its adsorption on plant leaves, is limited by its hydrophilicity. To overcome these obstacles, it is important to find a way to effectively control the hydrophilic–lipophilic balance of sinapoyl malate to make it readily compatible with the cosmetic formulations and stick on the waxy cuticle of leaves. To this end, herein, we describe a highly regioselective chemo-enzymatic synthesis of sinapoyl malate analogues possessing fatty aliphatic chains of variable length, enabling the lipophilicity of the compounds to be modulated. The potential toxicity (i.e., mutagenicity, carcinogenicity, endocrine disruption, acute and repeated-dose toxicity), bioaccumulation, persistence and biodegradability potential of these new analogues were evaluated in silico, along with the study of their transient absorption spectroscopy, their photostability as well as their photodegradation products.
1. Introduction
Solar radiation supplies light, ultraviolet radiation (UVR), warmth, and energy needed to support life in biological systems, including plants. Although UVR is essential to plant development, it is also harmful if the plant is overexposed to it.1,2 Indeed, UV wavelengths (100–400 nm), which are the most energetic rays from solar emission reaching the surface of the Earth, can disrupt the photosynthetic machinery, especially because they are responsible for the generation of reactive oxygen species (ROS), examples being O2˙−, H2O2, HO˙, 1O2.3–5 Although they are known to be reactive towards lipids, proteins and DNA, these entities have been shown to play a role in cellular events (e.g., proliferation, differentiation, metabolic adaptation).6–8 When ROS are generated, their levels in the aforementioned matrices increase leading to the dysfunction of the general homeostasis.6 To avoid these detrimental processes, plants have developed biosynthetic pathways leading to metabolites that can absorb UVR as natural UV filters, that also act as free radical scavengers.Phenylpropanoids are prominent amongst UV filters; plants can biosynthesize flavonoids or p-hydroxycinnamic acid derivatives in their leaves.9–11p-Hydroxycinnamic acid derivatives, notably the sinapate ester sinapoyl-L-malate (SM), function as sunscreen molecules in thale cress (Arabidopsis thaliana).12,13 When overexposed to UVR, the biosynthesis of sinapate esters, mediated via the phenylpropanoid pathway,10 is upregulated to accumulate the latter into the vacuoles of cells in the upper epidermis of leaves, thus increasing UVR protection.2,13–15 Sinapate esters were identified as being able to dissipate excess energy, accumulated from exposure to UVR, as heat.16–18 Very recently, Abiola et al. highlighted the ability of some p-hydroxycinnamic acid derivatives to convert light to heat, i.e., photothermal effect.18 This insight is paving the way for a new generation of UV filters with antioxidant and photothermal properties that would be advantageous in cosmetics as well as plant and crop protection. For example, sinapate esters incorporated in a foliar spray could supplement the natural UVR protection against overexposure to UVR as well as scavenging ROS. In addition, the generated heat would provide thermal energy to the biological system allowing successful crop growth in cooler geographical regions and offering protection against sudden daytime frost damage. Frost damage alone is estimated to cost Europe €3.3 billion per annum in reduced harvests. Although naturally occurring SM could be a good candidate for such an application, its solubility in water makes it easily washable by the rain, rendering its effectiveness dependent on the weather. Therefore, developing molecules that interact with, say, the waxy cuticle of the plant leaves, would be a tantalising prospect towards realising the aforementioned application.
In the quest for new and innovative bioactive compounds, Nature is a formidable source of inspiration for research scientists. Building on SM, biomimetics is a powerful strategy to design de novo biobased and bioinspired UV filters,19 with SM (and derivatives thereof) the front-runner to replacing petrosourced UV filters – such as avobenzone, octocrylene, oxybenzone or Octinoxate™ – which have been banned for use in cosmetic products on some pacific islands like Hawaii because of their toxicity to coral reef (i.e., bleaching, toxic degradation products).20–24 Moreover, the carbon footprint of humans on Nature must be drastically reduced. Thus, the use of biobased compounds instead of their petroleum-based counterparts is not only highly sought after, but also crucial for the environment. It is therefore essential to use (bio)synthetic processes with low ecological impacts inspired by the Green Chemistry Principles.25
In this context, the valorization of agricultural coproducts and waste, such as lignin and lignans, appears as an exceptional source of natural and sustainable building blocks and allows one to obtain p-hydroxybenzaldehydes (i.e. vanillin, syringaldehyde)26,27 that can give access to a countless number of biobased compounds with a wide range of properties, such as antioxidant,28–30 anti-UV,31–35 antimicrobial,36–38 anticancer,39–41 anti-inflammatory,42–44 antiviral,45–47 as well as anti-tyrosinase activities.48–50p-Hydroxycinnamic acid derivatives can be readily obtained through the Knoevenagel and Knoevenagel–Doebner condensations of the corresponding p-hydroxybenzaldehydes. These two condensation reactions, that involve the use of pyridine as solvent and aniline or piperidine as amine catalysts,51 have been known for more than a century and many procedures were published highlighting several major advancements using green procedures such as reducing reaction times with microwave activation,52,53 non-hazardous solvents54–56 or catalysts.57–59 Recently, more sustainable synthetic pathways were described with the catalyst-free Knoevenagel condensation in water30,33,60 and the proline-mediated Knoevenagel–Doebner condensation in ethanol.36,61,62
In the present work, starting from natural and sustainable syringaldehyde, and according to the aforementioned sustainable Knoevenagel–Doebner condensation, we have developed a new generation of eight biobased SM derivatives, bearing fatty chains (Fig. 1) to enhance their hydrophobic interactions with the waxy cuticle of leaves, as well as to facilitate their formulations for sunscreen applications. To evaluate the potential of these novel lipophilic compounds as molecular heaters or alternatives to current petroleum-based UV-filters, we have (i) investigated the photophysical properties of SM derivatives using steady-state and ultrafast transient absorption spectroscopies to gain insight into the light-to-heat generating pathways, (ii) explored the photodegradation of dioctyl sinapoyl-L-malate (DOSM, the most promising of the SM derivatives tested) and its byproducts formation, and (iii) studied the environmental impact and potential toxicity on human of all compounds through in silico approaches.
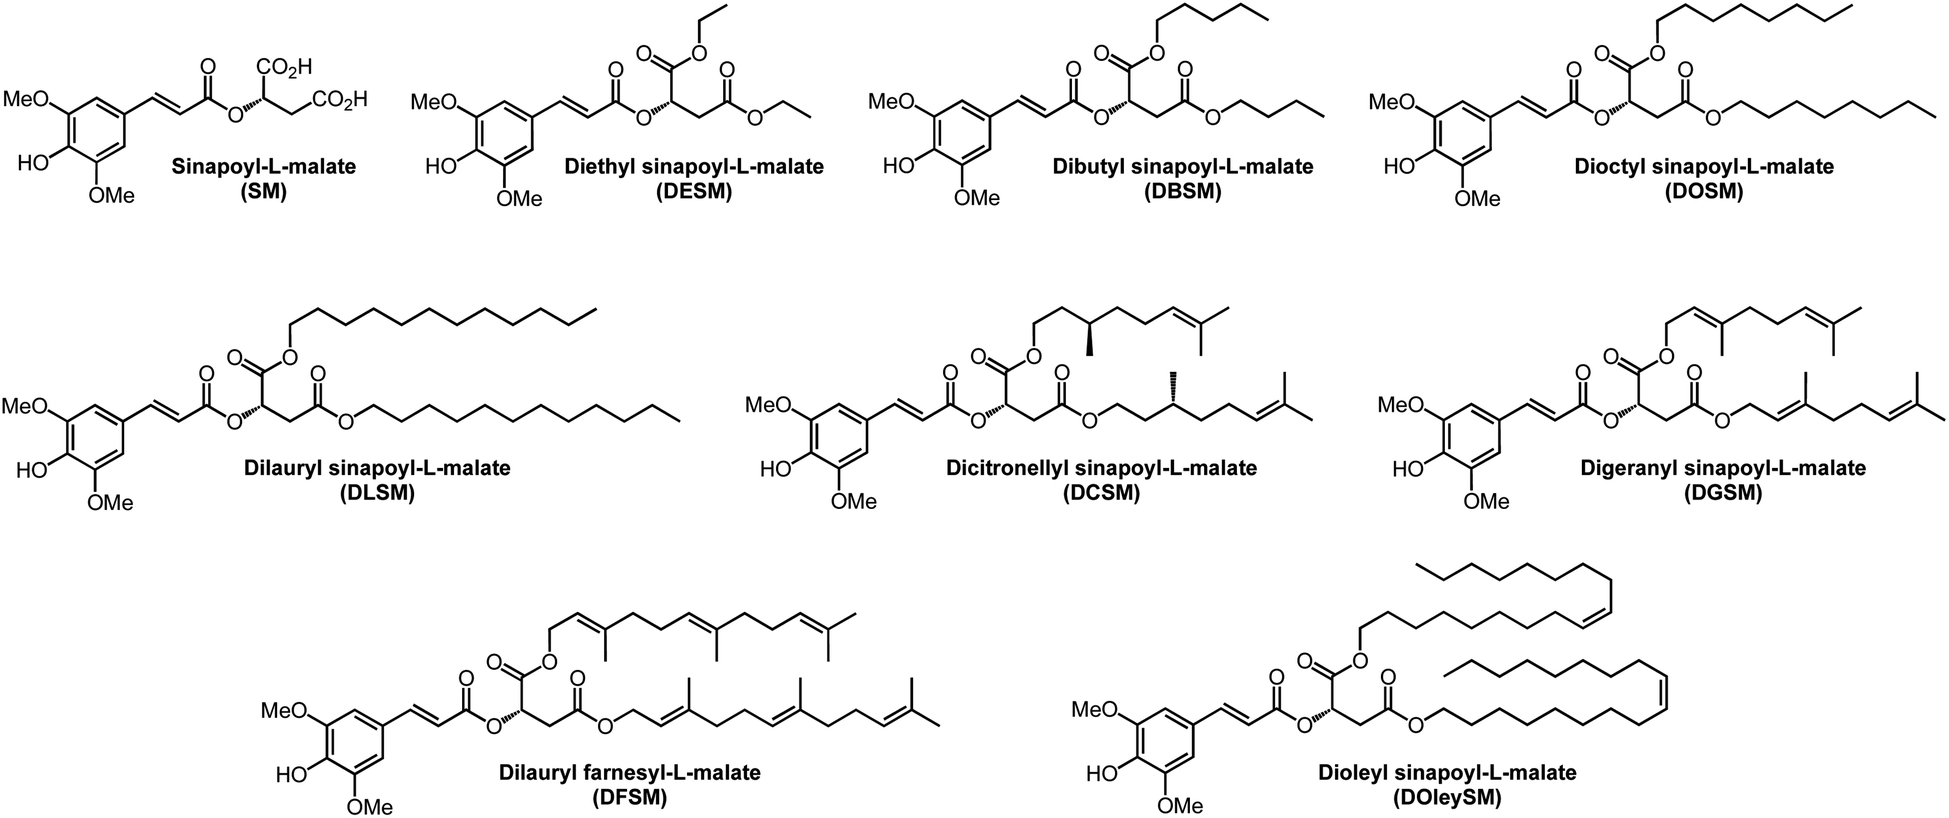 | ||
| Fig. 1 Structures of sinapoyl-L-malate (SM) and its biobased fatty esters derivatives synthesized and studied in this work. | ||
2. Experimental
2.1. General
All reagents were purchased from Sigma-Aldrich, TCI, Merck or VWR and used as received. Solvents were purchased from Thermo Fisher Scientific and VWR. Deuterated dimethyl sulfoxide (DMSO-d6 < 0.02% H2O), acetone (acetone-d6 < 0.02% H2O) and chloroform (CDCl3-d < 0.02% H2O) were purchased from Euriso-top. Immobilized Candida antarctica lipase B (Novozym® 435, N435, 10![[thin space (1/6-em)]](https://www.rsc.org/images/entities/char_2009.gif) 000 PLU per g) was obtained from Univar Solutions SAS.
000 PLU per g) was obtained from Univar Solutions SAS.
2.2. NMR analyses
NMR spectra were recorded on a Bruker Fourier 300 (Billerica, MA, USA). 1H NMR spectra were recorded in DMSO-d6 (residual peak at δ = 2.50 ppm), acetone-d6 (residual peak at δ = 2.05 ppm) or chloroform-d (residual peak at δ = 7.26 ppm) at 300 MHz. Chemical shifts were reported in parts per million relatives to the solvent residual peak. Data are reported as follows: integration, chemical shift (δ ppm), multiplicity (s = singlet, d = doublet and dd = doublet of doublets), coupling constant (Hz) and assignment. 13C NMR spectra of samples were recorded at 75 MHz in DMSO-d6 (residual signal at δ = 39.52 ppm), acetone-d6 (residual peaks at δ = 29.82 and 206.03 ppm) or chloroform-d (residual peak at δ = 77.06 ppm). Data are reported as follows: chemical shift (δ ppm) and assignment. All 1H and 13C NMR spectra are available in the ESI (Fig. S1–S16†).2.3. HRMS analyses
High-resolution mass spectrometry (HRMS) was performed on an Agilent Technologies 1290 system, equipped with a 6545 Q-TOF mass spectrometer (Wilmington, DE, USA) and a PDA UV detector. The source was equipped with a JetStream electrospray ionisation ESI probe operating at atmospheric pressure. HRMS spectra are reported in the ESI (Fig. S17–S24†).2.4. UV-filtering property and photostability
UV/visible absorption spectra of SM derivatives in ethanol were recorded using a UV/visible Cary 60 Agilent Technologies spectrometer at a concentration of 10 μM. For the photostability study, samples (20 μM, EtOH) were irradiated for 1 hour with a Rayonet© RPR-200 (λ = 300 nm, P = 8.32 W m−2, stirring, T = 35 °C) using 14 RPR-3000A lamps (SNE Ultraviolet Co Branford Ct USA RPR-3000A). UV spectra were subsequently recorded and the absorbance loss was calculated as a percentage at the λmax. UV photostability spectra are reported in the ESI (Fig. S25–S32†).2.5. Antiradical activities
Antiradical activities of the SM derivatives were determined via 2,2-diphenyl-1-picrylhydrazyl (DPPH) assay. These tests involve adding potential antiradical molecule solution in ethanol at different concentrations to homogeneous DPPH solution. The study was performed under stirring for 7 h 25 min on the following concentrations: 400, 200, 100, 50, 25, and 12.5 μM. Every 5 min, the absorbance was measured at 520 nm. In the end, the percentage curves of DPPH (blue) and reduced DPPH (green) were plotted in Regressi® software using an average of the last six points. The amount needed to reduce the initial number of DPPH free radicals by half (i.e., EC50) is provided by the crossing point of %DPPH (blue) and %reduced DPPH (green). Antiradical measurement spectra are reported in the ESI (Fig. S33–S43†).2.6. Specific optical rotatory power
Optical activities of the SM derivatives were determined in methanol (or ethanol for dioleylyl derivative of SM) at 0.02 g mL−1 on a Bellingham + Stanley ADP410 single wavelength polarimeter.2.7. Transient absorption spectroscopy
The femtosecond (fs) transient electronic absorption spectroscopy setup used to explore the photodynamics of the SM derivatives in solution has been detailed previously,31,35,63–65 and only information specific to the present experiments is reported here. Separate samples of SM derivatives were prepared to 1 mM concentration in an oil-based solvent, caprylic capric triglyceride, to enhance the solubility. In all cases, the pump excitation wavelength was chosen to match the relevant λmax. The sample was delivered through a demountable Harrick Scientific flow-through cell equipped with two CaF2 windows separated by 100 μm polytetrafluoroethylene (PTFE), thereby defining the optical path length of the sample. The samples were circulated using a diaphragm pump (SIMDOS, KNF) recirculating from a 25 mL sample reservoir to ensure each pump-probe pulse interacts with a fresh sample, with a maximum pump-probe delay of 2 nanoseconds (ns). The collated spectra reflect changes in optical density (ΔOD) and are chirp corrected for visual purposes using the KOALA software program.66 To gain insight into the dynamical process following photoexcitation and extract the excited state kinetic information from the TEA spectra obtained for each molecule, a global sequential fitting procedure implemented through the Glotaran software package was employed.67,68
2.8. LC-MS-IRIS study on solar degradation product of DOSM
We used the QIT-MS to determine elution times of features of interest for degradation product fractionation. The divert valve was programmed to temporarily store the effluent for the InfraRed Ion Spectroscopy (IRIS) experiment by diverting the flow at the observed elution time into an LC vial or 80 μL sample loop. The LC vial was used to allow spiking the sample with a CsCl solution to study the cesium adducts of the molecules of interest, where the sample loop was backflushed into the MS using a syringe pump for IRIS using a Hamilton 250 μL syringe.71,72
 | (1) |
 | (2) |
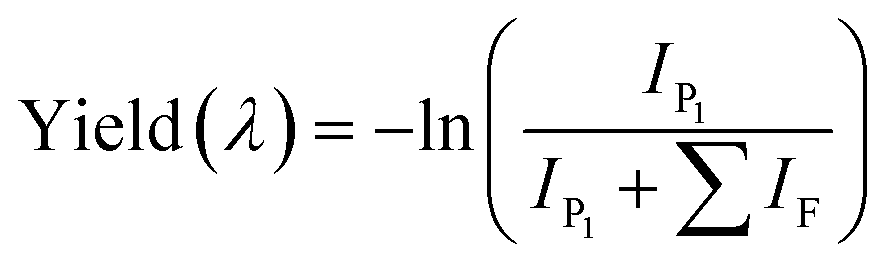
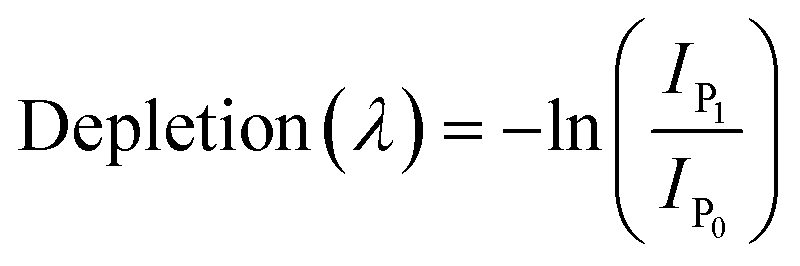
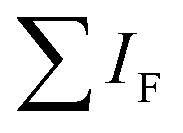 is the sum of all IRMPD-induced fragments; if no fragments are observed, e.g., because they fall below the low-mass cut-off of the QIT, we use eqn (2), where IP0 is the precursor ion intensity without IR irradiation. To obtain the IR ion spectrum of the synthesized di-octyl-2-hydroxy succinate (DO2HS) external reference standard synthesized in-house, a 10 mM solution of DO2HS was made in a mixture of MeOH and water (80/20; v/v%), which was further diluted in MeOH containing 10% FA to a concentration of 30 μM. A similar procedure was followed for the di-geraniol-2-hydroxy succinate (DG2HS) external reference standard, also synthesized in-house.
2.9. In silico toxicology
An important aspect in the development of new bioactive compounds is the investigation of their potential toxicity and fate in the environment. In an early stage of development, in silico tools constitute a good strategy to gain initial information and screen potential lead molecules without the use of expensive and time-consuming animal testing. Based on experimental data and the relationships between structure and activity, in silico models allow not only predictions for known compounds (e.g. filling of data gaps), but also virtual compounds (i.e., not yet synthesized).75–77The arithmetic mean of the different generated prediction scores was calculated and plotted in a diagram, divided into three zones according to the overall predictions: a score higher than 0.66 means a positive prediction (mutagenic/carcinogenic) with good reliability, while a score lower than 0.33 means a negative prediction (mutagenic/carcinogenic) with good reliability. A score between 0.33 and 0.66 is considered equivocal. This includes the score range between 0.33 and 0.5, which is regarded as a negative prediction (not persistent) with insufficient reliability, as well as the score range between 0.5 and 0.66, regarded as a positive prediction (persistent) with insufficient reliability.
BCF > 3.3) as bioaccumulative, while a substance with a BCF higher than 5000 (or logBCF > 3.7) is considered very bioaccumulative.
Similar to the mutagenicity/carcinogenicity score, the arithmetic mean of the different generated prediction scores was calculated and interpreted as follows: a score higher than 0.66 means a positive prediction (persistent) with good reliability; a score lower than 0.33 means a negative prediction (not persistent) with good reliability; a score between 0.33 and 0.66 is considered equivocal. This includes the score range between 0.33 and 0.5, which is regarded a negative prediction (not persistent) with insufficient reliability, as well as the score range between 0.5 and 0.66, regarded a positive prediction (persistent) with insufficient reliability.
3. Results & discussions
3.1. Synthesis
Diethyl sinapoyl-L-malate (DESM) was prepared following the two-step procedure that Peyrot et al.36 reported for the synthesis of SM. Nevertheless, for this Knoevenagel–Doebner condensation step, we decided to replace the hazardous pyridine/aniline couple with the eco-friendly ethanol/L-proline couple.28 DESM was thus obtained from diethyl-L-malate and lignin-derived syringaldehyde, in two steps, with only one purification during the final step (Scheme 1).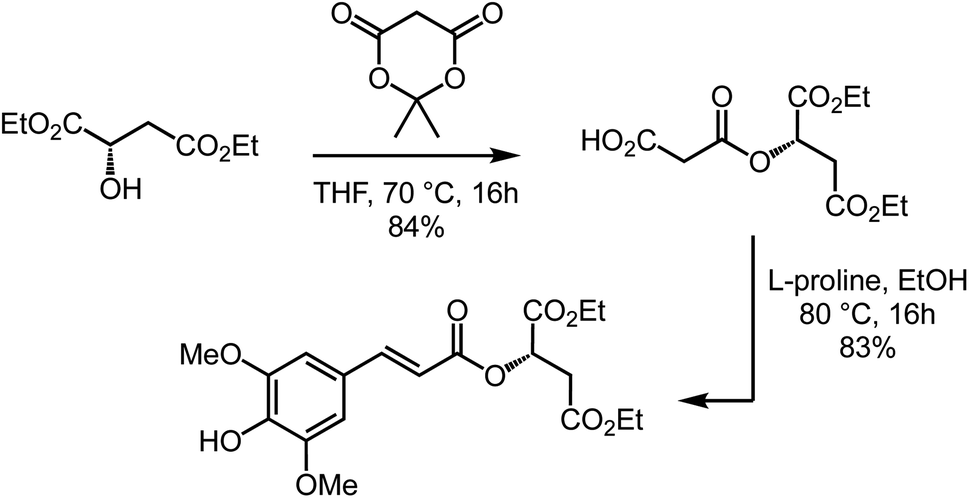 | ||
| Scheme 1 Two-step synthesis of DESM. | ||
Using the aforementioned procedure, di-n-butyl-sinapoyl-L-malate (DBSM) was prepared in 83% yield starting from di-n-butyl-L-malate, readily obtained from malic acid and ethanol using Fischer esterification. Unfortunately, this procedure proved unsuccessful for the synthesis of di-n-octyl-sinapoyl-L-malate (DOSM) as the Fischer esterification of malic acid with n-octanol was not quantitative, thus resulting in a mixture of several products for which flash chromatography purification proved too complex as none of them absorb in the UV-Vis. It is noteworthy to mention that we faced the very same issue with alcohols carrying longer chains (e.g., dodecanol, citronellol). Another strategy was thus needed to access DOSM, and other SM diester analogues, with minimal synthetic and purification steps. Still aiming at achieving the greenest process, we decided to study and optimize the biocatalyzed transesterification of DESM in the presence of supported Candida antarctica lipase B (also known as Novozym 435®, CALB or N435) for which high efficiency has been observed.83–85 Indeed, in this strategy, the goal was to take advantage of the low reactivity of N435 toward both the phenol moiety and the α,β-unsaturated ester, and determine whether it would result in a regioselective transesterification toward DESM that possesses two types of esters: the α,β-unsaturated ester that would remain untouched, and the two saturated esters from the malate moiety that would undergo transesterification without having to protect, and subsequently deprotect, the phenol moiety. To our delight, this strategy proved successful as the transesterification proceeds in almost total regioselectivity, exceeding all our expectations. This procedure was then optimized for the synthesis of DOSM (Table 1, Scheme 2) and subsequently implemented to the other desired sinapoyl malate diester with similar regioselectivity and yields (88–99%) (Table 2). It is worth mentioning that this synthetic procedure was successfully implemented at the kilo-scale.
| DESM (eq.) | Octanol (eq.) | N435 (mg mmol−1) | T (°C) | Time (h) | P (mbar) | Isolated yield (%) |
|---|---|---|---|---|---|---|
| 1 | 2.5 | 120 | 80 | 16 | 30 | 95 |
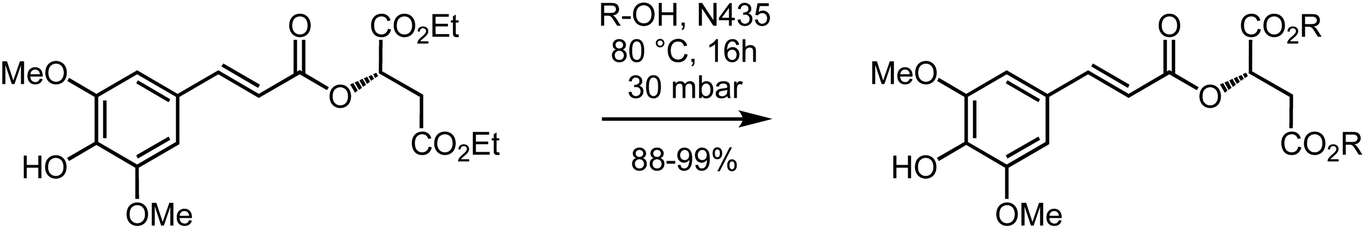 | ||
| Scheme 2 Highly regioselective N435-catalyzed transesterification of DESM into the corresponding SM diesters. | ||
| Alcohol | Compound | Yield (%) |
|---|---|---|
| Octanol | Dioctyl SM (DOSM) | 95 |
| Lauric alcohol (dodecanol) | Dilauryl SM (DLSM) | 99 |
| Citronellol | Dicitronellyl SM (DCSM) | 97 |
| Geraniol | Digeranyl SM (DGSM) | 91 |
| Farnesol | Difarnesyl SM (DFSM) | 94 |
| Oleic alcohol | Dioleylyl SM (DOleySM) | 88 |
3.2. UV-filtering properties and photostability
To explore the UV-filtering properties of the SM derivatives, UV analyses were carried out in ethanol (10−5 M, Fig. 2). In comparison with SM's UV spectrum (λmax = 332 nm, Table 3), all SM derivatives showed very similar properties (λmax ≈ 335 nm, Table 3), indicating that the additional fatty chains on the carboxylic acid functions do not disturb the UV-filtering potential of these new SM analogues.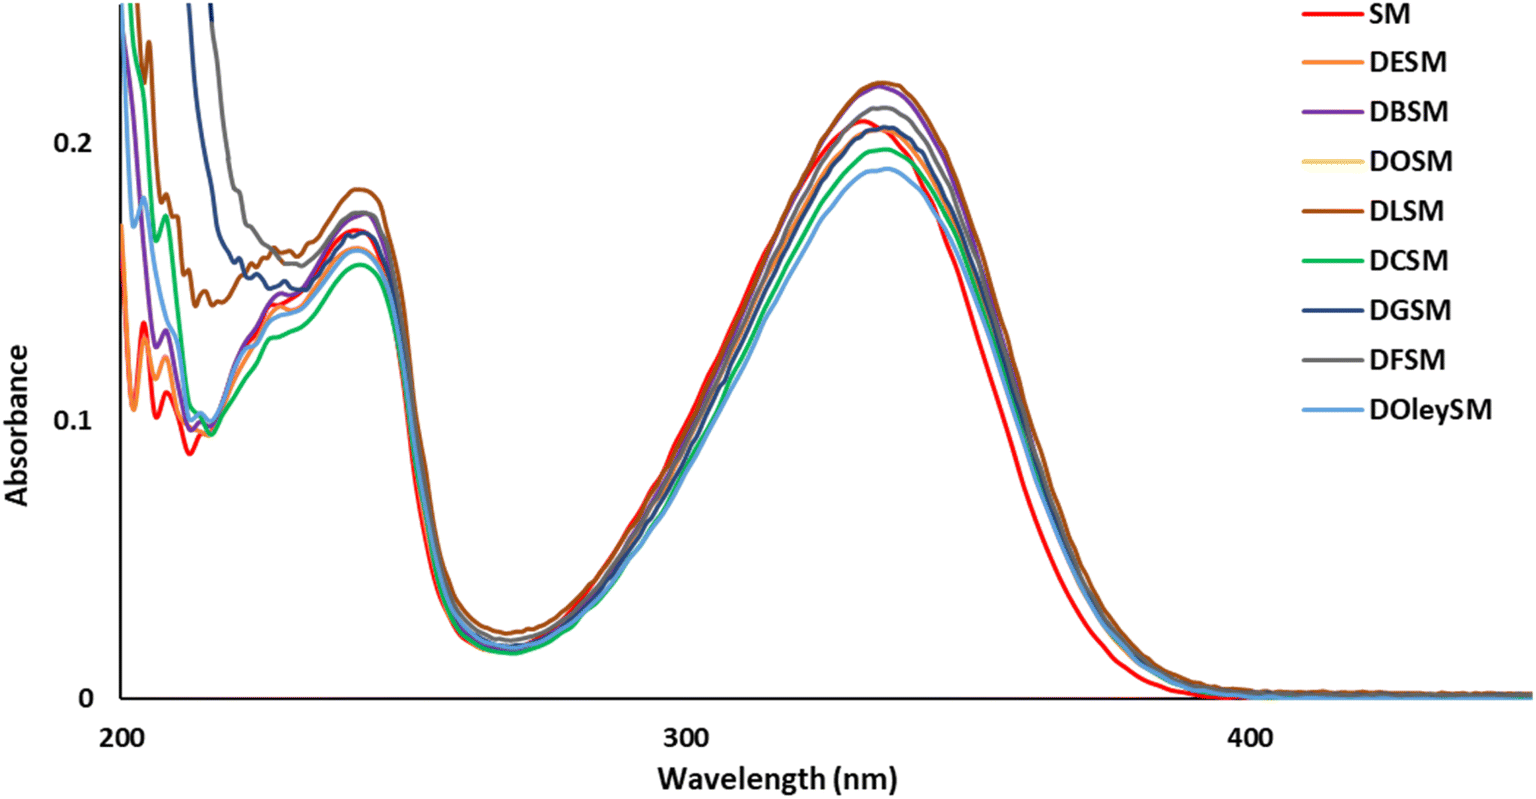 | ||
| Fig. 2 UV spectra of SM and SM diesters in EtOH. | ||
| Compounds | λ (nm) | Abs. loss (%) | ε (L mol−1 cm−1) |
|---|---|---|---|
| SM | 332 | 25 | 20814 |
| DESM | 334 | 26 | 20482 |
| DBSM | 334 | 25 | 22063 |
| DOSM | 335 | 27 | 23045 |
| DLSM | 335 | 23 | 22184 |
| DCSM | 336 | 18 | 19776 |
| DGSM | 335 | 17 | 20555 |
| DFSM | 336 | 16 | 21254 |
| DOleySM | 336 | 15 | 19091 |
| Octinoxate™ | 310 | 27 | 24046 |
Photostability is a key parameter for a UV-filter;31 an efficient filtering compound should not lose its absorbance (at λmax) during exposure to UVR. To assess photostability, we performed irradiation at 300 nm (P = 8.32 W m−2) for one hour (t60) at T = 35 °C and recorded the change in absorbance with UV spectroscopy. The UV spectrum after one hour of irradiation was then compared to the spectrum recorded before irradiation (t0) and the loss in absorbance was measured at the λmax. As an example, Fig. 3 highlights the photostability of DCSM, in which, post-UV irradiation, there is an 18% loss in absorbance at its λmax. Photostability data in Table 3 were benchmarked against those of SM and Octinoxate™, the latter of which is a widely used and controversial UV-B filter contained in many sunscreen formulations.86 SM had a loss of absorbance of 25% whilst DESM, DBSM, DOSM, and DLSM showed commensurate losses with 26, 25, 27, and 23% respectively. On the other hand, DCSM, DGSM, DFSM, and DOleySM exhibited smaller losses of 18, 17, 16 and 15%, respectively. It is noteworthy to mention that, under these specific photostability assay conditions, Octinoxate™ loss of absorbance was about 27%, as previously described.28 Except for DOSM, all the new compounds exhibited better photostability than Octinoxate™ and could be considered as interesting alternatives to this controversial compound for anti-UV applications.
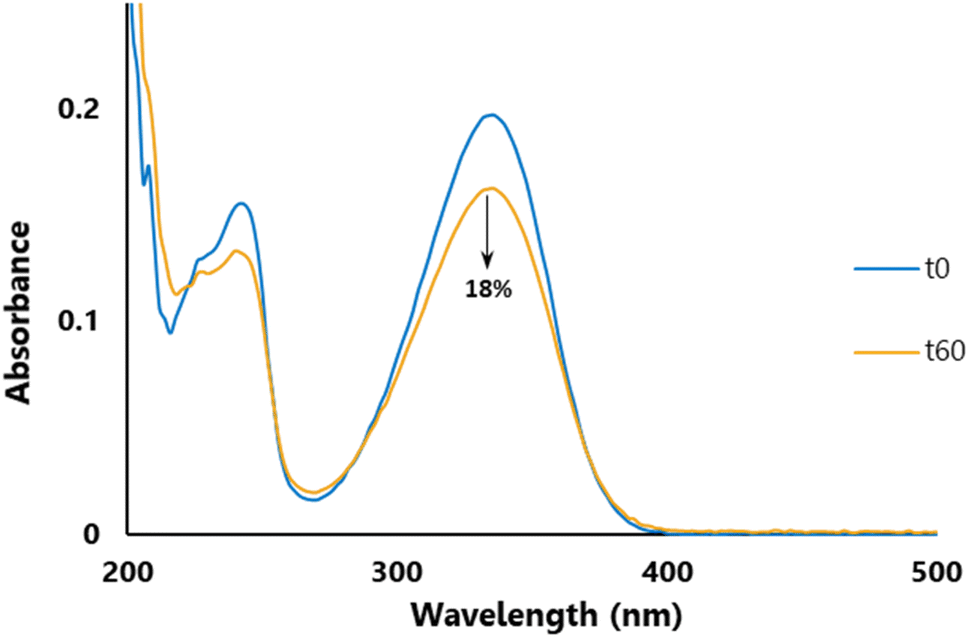 | ||
| Fig. 3 UV photostability of DCSM. | ||
Under UV exposure, photo-active α,β-unsaturated esters, such as the ones herein, are prone to form a cyclobutane ring (that does not exhibit any UV-filtering activity) with another neighbouring α,β-unsaturated ester through [2+2] photocyclization.87 An efficient way to limit this photocyclization, and thus improve the photostability, is to increase the steric hindrance of the α,β-unsaturation.28,31,33,34,88 Here, the introduction of aliphatic and non-ramified chains in DESM, DBSM, DOSM and DLSM, did not lead to better photostability (ca. 25% of absorbance loss, similar to that of SM), suggesting that the length of the additional group, even with C-8 and C-12 chains, is not enough to efficiently improve the steric hindrance, and therefore the photostability. Additionally, the introduction of citronellol and geraniol, both C-8 chains (DCSM and DGSM), bearing two methyl ramifications and double bond(s), led to an enhancement of the photostability (18% and 17% absorbance loss, respectively), highlighting the efficiency of the methyl ramifications and the double bond(s). This effect is confirmed with DFSM (C-12 chain, 3 methyl ramifications and 3 double bonds). The presence of these double bonds, leading to a folding back and not a linear part, promotes the intermolecular repulsions and therefore the photostability of the α,β-unsaturated moiety of the molecule (16% absorbance loss). Finally, DOleySM possesses the best photostability of the library with an absorbance loss of 15%. The two C-18 fatty chains, with a folding back due to the Z-configured C![[double bond, length as m-dash]](https://www.rsc.org/images/entities/char_e001.gif) C between the carbons 9 and 10, provide a very efficient shield to the sensitive α,β-unsaturated double bond. Compared to SM, the data demonstrate an enhanced photostability for the SM derivatives.
C between the carbons 9 and 10, provide a very efficient shield to the sensitive α,β-unsaturated double bond. Compared to SM, the data demonstrate an enhanced photostability for the SM derivatives.
3.3. Antiradical activities
While direct protection against overexposure to UVR is crucial to ensure good development for crops, the use of multifunctional molecules can be a major asset by offering multiple properties and therefore, reducing the number of compounds used in a formulation. ROS are free radicals with high reactivity, produced by diverse metabolic pathways and involved in plant development.89 ROS are also produced under stress conditions, such as excessive UVR exposure. An unregulated level of those free radicals can induce irreversible cellular damages (i.e., enzyme inactivation, membranes destruction) leading to cell death.90 One way to prevent the negative impacts linked to high concentration of ROS is the presence of antiradical molecules, such as p-hydroxycinnamic derivatives, bearing a free phenol able to inhibit those radicals. In this regard, the antiradical properties of SM and its diester derivatives were assessed and benchmarked against references conventionally used, namely BHA (butylated hydroxyanisol) and BHT (butylated hydroxytoluene), by comparing their EC50 (half-maximum effective concentration). EC50 is defined as the amount (nmol) of antiradical compound needed to reduce half of DPPH free radicals; lower values correlate with higher antiradical properties. In addition, the kinetics of the radical scavenging was determined for each compound by using the EC50 value to obtain the time needed to reach steady-state (TEC50) of radical inhibition. This parameter is used to sort antiradical properties in three behaviours: slow (TEC50 > 1800 s), intermediate (300 < TEC50 < 1800 s) and rapid (TEC50 < 300 s) as previously described by Sánchez-Moreno et al.91 The results are summarized in Table 4. The introduction of ester moieties in place of the two free carboxylic acids proved to have a negative impact as, from a general point of view, all diester derivatives exhibited lower antiradical activity (i.e., higher EC50) than the base SM. Focussing only on the analogues, the nature of the ester moiety had little impact on the activity towards free radicals – which is in accordance with a previous study on p-hydroxycinnamic derivatives32 – as EC50 values were in the same range (11.2–15.7 nmol), with the exception of DESM (18.3 nmol). Regarding their kinetics, all compounds reached a steady-state of radical inhibition under 60 s, exhibiting rapid activity, which was significantly better than BHA and BHT references. Despite exhibiting higher EC50 values than both references, SM diester derivatives make viable antiradicals with dual activity by combining swift inhibition of free radicals and UV filter properties.| Compound | EC50 (nmol) | T EC50 (s) | Kinetic |
|---|---|---|---|
| SM | 8.5 ± 0.2 | <60 | Rapid |
| DESM | 18.3 ± 0.4 | <60 | Rapid |
| DBSM | 12.8 ± 0.3 | <60 | Rapid |
| DOSM | 15.7 ± 0.9 | <60 | Rapid |
| DLSM | 13.1 ± 0.3 | <60 | Rapid |
| DCSM | 11.2 ± 0.1 | <60 | Rapid |
| DGSM | 13.4 ± 0.2 | <60 | Rapid |
| DFSM | 13.3 ± 0.3 | <60 | Rapid |
| DOleySM | 14.3 ± 0.5 | <60 | Rapid |
| BHA | 4.3 ± 0.1 | 380 ± 13 | Intermediate |
| BHT | 7.6 ± 0.2 | >1800 | Slow |
3.4. Transient absorption spectroscopy
The transient electronic absorption (TEA) spectra obtained for SM and its derivatives following photoexcitation at their respective UV absorption λmax in caprylic capric triglyceride are reported in Fig. 4. The observed TEA spectra are similar in all cases, each having three spectral features. First is the negative feature at the blue edge of the probe window (∼350 nm) of the TEA spectra; we assign this feature to the ground state bleach (GSB) through comparison with the steady-state UV/visible spectra (see Fig. 2) and previously reported works on SM.12,16 Second is an intense positive feature centered at ∼430 nm which we attribute to the excited-state absorption (ESA) in line with the literature. Lastly, on closer inspection, there is a broad and weaker ESA feature that begins at ∼470 nm and extends to the end of our probe window (700 nm). While all the aforementioned spectral features seem to have decayed to baseline within pump-probe delay time of 100 picoseconds (ps) through visual inspection, the 2 ns transient data presented in ESI Fig. S45† revealed that a residual GSB and ESA at ∼430 nm persists. We return to discuss the implication of this persistent feature on the dynamics and suitability of SM derivatives in molecular heater applications.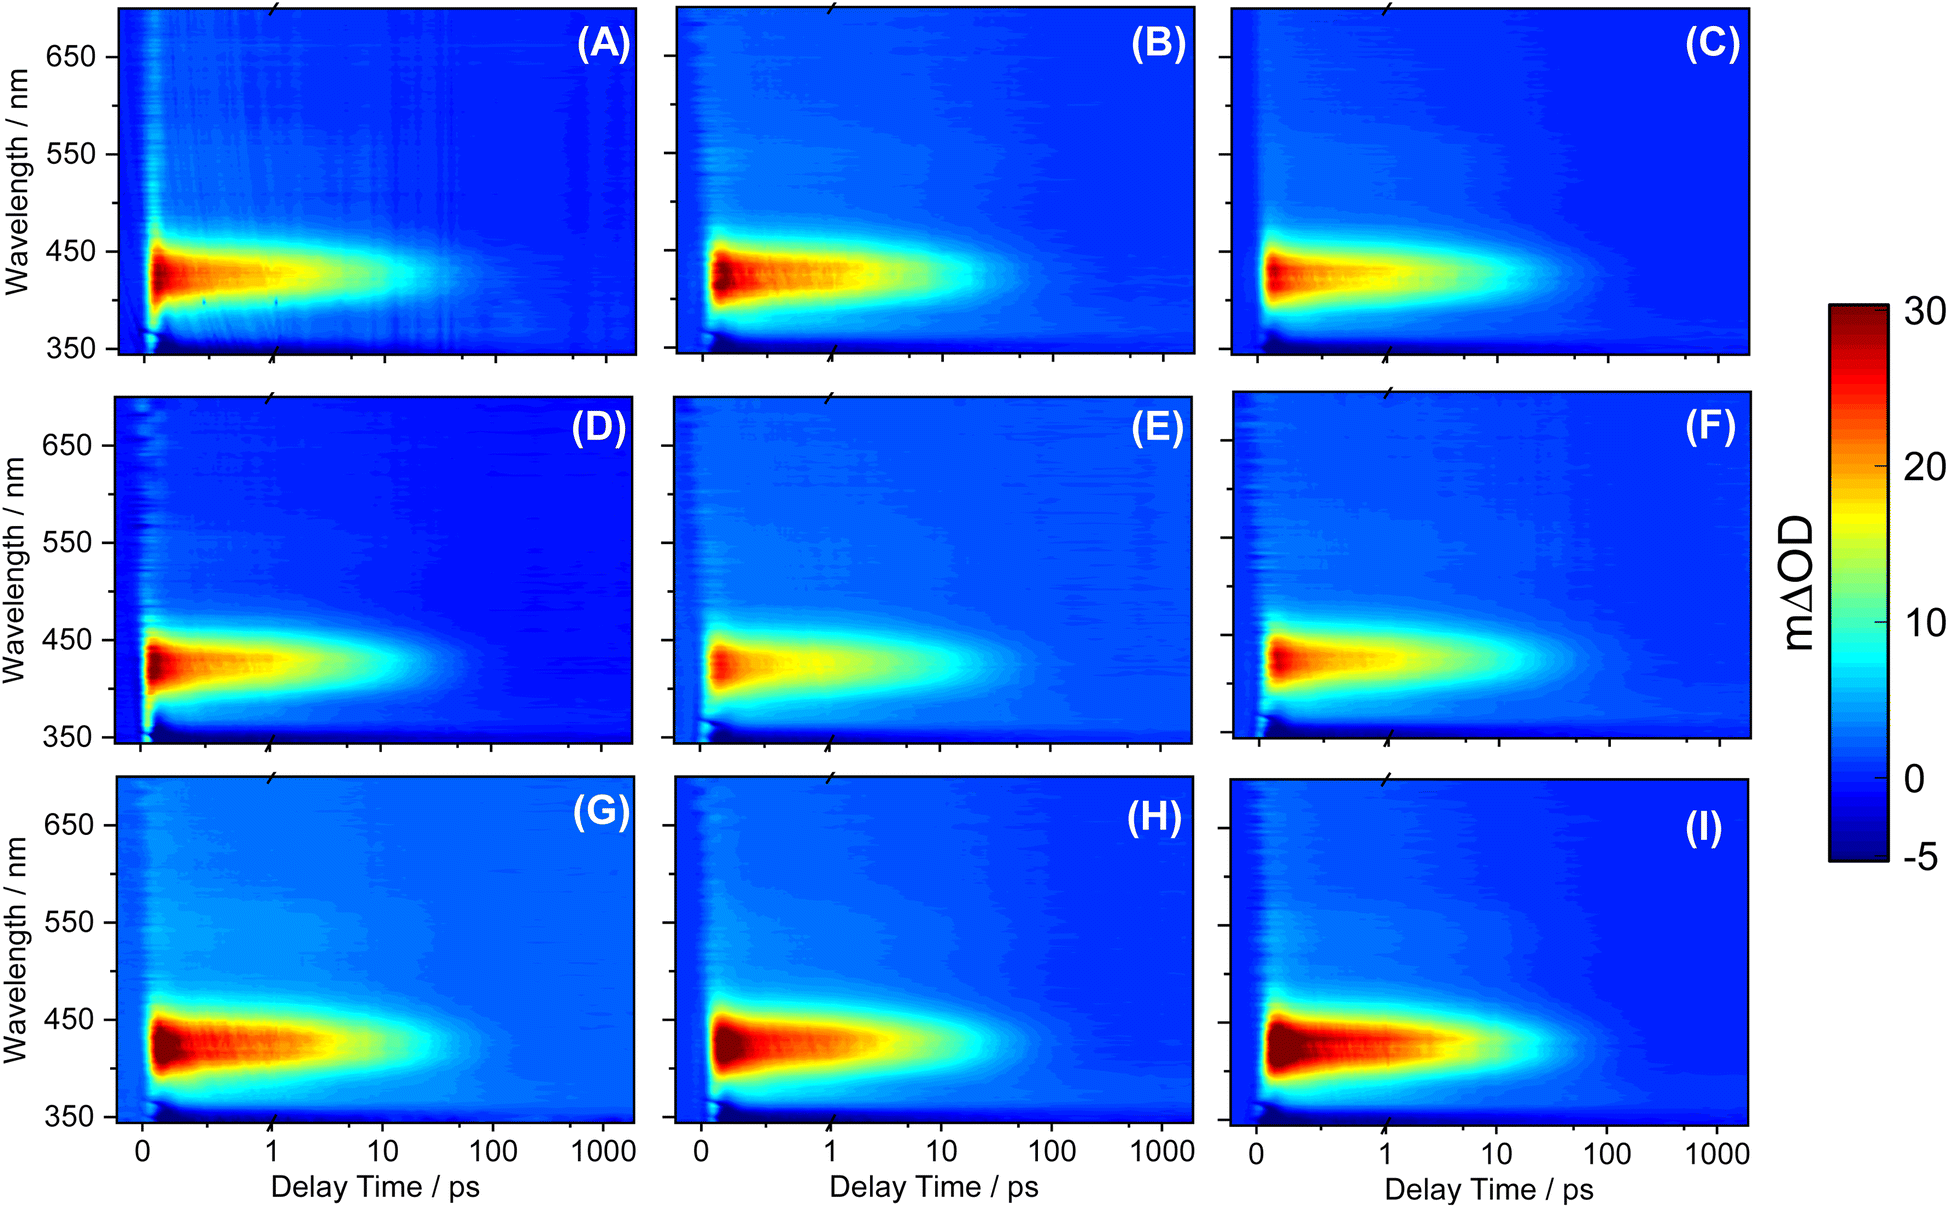 | ||
| Fig. 4 TEA spectra in caprylic capric triglyceride bulk solution for (A) SM, (B) DESM, (C) DBSM (D) DOSM, (E) DLSM, (F) DCSM, (G) DGSM, (H) DFSM, and (I) DOleySM in the form of a false colour heat map indicating change in optical density (ΔOD). In all cases, the delay time is presented on a linear plot until 1 ps and then as a logarithmic scale between 1 ps and 2 ns. | ||
To gain insight into the dynamical process and extract the excited state kinetic information from the presented TEA spectra of each molecule, a global sequential fitting procedure  implemented through the Glotaran software package was employed. The extracted time constants and associated errors returned by the fitting software to twice the standard errors are reported in Table 5. The evolution associated difference spectra (EADS) for each fit are also shown in the ESI Fig. S46.† The quality of the fits is better evaluated by inspecting the associated residuals from the fit, reported in Fig. S47.† Where the returned standard error was shorter than the instruments response time, the error is quoted as half of the instrument response (as determined through the solvent-only scan presented in Fig. S48†).
| Compounds | τ 1 (fs) | τ 2 (fs) | τ 3 (ps) | τ 4 (ns) |
|---|---|---|---|---|
| SM | 100 ± 60 | 550 ± 60 | 20.1 ± 0.2 | >2 |
| DESM | 120 ± 60 | 970 ± 60 | 19.3 ± 0.1 | >2 |
| DBSM | 110 ± 60 | 950 ± 60 | 19.8 ± 0.1 | >2 |
| DOSM | 100 ± 60 | 830 ± 60 | 20.0 ± 0.2 | >2 |
| DLSM | 110 ± 60 | 930 ± 60 | 21.7 ± 0.2 | >2 |
| DCSM | 100 ± 60 | 850 ± 60 | 21.3 ± 0.2 | >2 |
| DGSM | 110 ± 60 | 1070 ± 60 | 21.8 ± 0.2 | >2 |
| DFSM | 110 ± 60 | 1040 ± 60 | 22.8 ± 0.1 | >2 |
| DOleySM | 130 ± 60 | 1260 ± 60 | 23.8 ± 0.1 | >2 |
We now assign dynamical processes to the extracted time constants reported in Table 5, and discuss their implications drawing on previous studies on SM.12,92–95 The similarity between the information extracted from SM and its derivatives in the current work is an indication that the relaxation mechanism likely remains largely unchanged upon the addition of a long chain fatty acid. Hence, we assign the dynamical processes to the extracted time constants as a collective. The first dynamical process defined by τ1 occurs on a time-constant between 100 and 130 femtoseconds (fs) in all the molecules. Previous work on SM and its derivatives has assigned a number of mechanisms to this initial process following photoexcitation to the 11ππ* state, this includes rapid geometry and vibrational relaxation out of the Franck–Condon region and solvent rearrangement. We, therefore, attribute τ1 to the aforementioned dynamical processes. It is worth noting that τ1 for SM returned a short time constant of 70 fs which is within the IRF, however this time component is needed for the accurate fitting of the data.
Two different mechanisms have been previously assigned to the dynamical process associated with the time constant denoted τ2.12 The first is the internal conversion (IC) of the 11ππ* state to the 21ππ* state through 11ππ*/21ππ* conical intersection (CI). The second is the evolution of the S1 population along the potential energy surface towards the 11ππ*/S0 CI. Recent computational studies favour the latter mechanism; the 11ππ*/21ππ* CI is either absent or inaccessible.96 Hence, we suggest that τ2 extracted from our study corresponds to the evolution of the 11ππ* population towards the S1/S0 CI. The dynamical process associated with τ3 is attributed to the 11ππ* population traversing the S1/S0 CI to the ground state along the trans–cis isomerization coordinate along with subsequent vibrational cooling. This dynamical process results in a fraction of the excited state population returning to the ground state in the form of the starting trans-isomer. The second fraction completes the isomerization along the CC allylic bond twist to generate the cis-isomer as a photoproduct. Although, the EADS (see Fig. S45†) and the resulting time constants from our fitting model suggests that the ground state formation of the starting trans-isomer and cis-isomer product following relaxation from the excited state are achieved in a single process (EADS3, τ3), there is the possibility that both the processes occur on different timescales that are not separable by our experimental method. Indeed, previous time-resolved vibrational spectroscopy on ethyl sinapate, a derivative of sinapoyl malate, revealed that the relaxation of the starting trans-isomer is achieved on a faster time constant of ∼10 ps compared to the cis-isomer product with a time constant of ∼20 ps in the ground electronic state.97 The signature of the cis-isomer photoproduct is evident in EADS4 (Fig. S45†) with a positive absorption band at ∼370 nm and having a time-constant greater than 2 ns.12 Assignment of EADS4, to the cis-isomer photoproduct, is supported through a comparison of the Δt = 2 ns transient absorption profile shown in Fig. S45† to those reported for SM and its derivatives previously, which show an identical feature in the spectral region of interest.12
In summary, the dynamical process reported for SM and its derivatives implies that the absorbed light by the UV filters is efficiently dissipated non-radiatively as heat to the surrounding solvent bath, strongly suggesting that SM derivatives are suitable for application as a molecular heater.
3.5. LC-MS-IRIS study
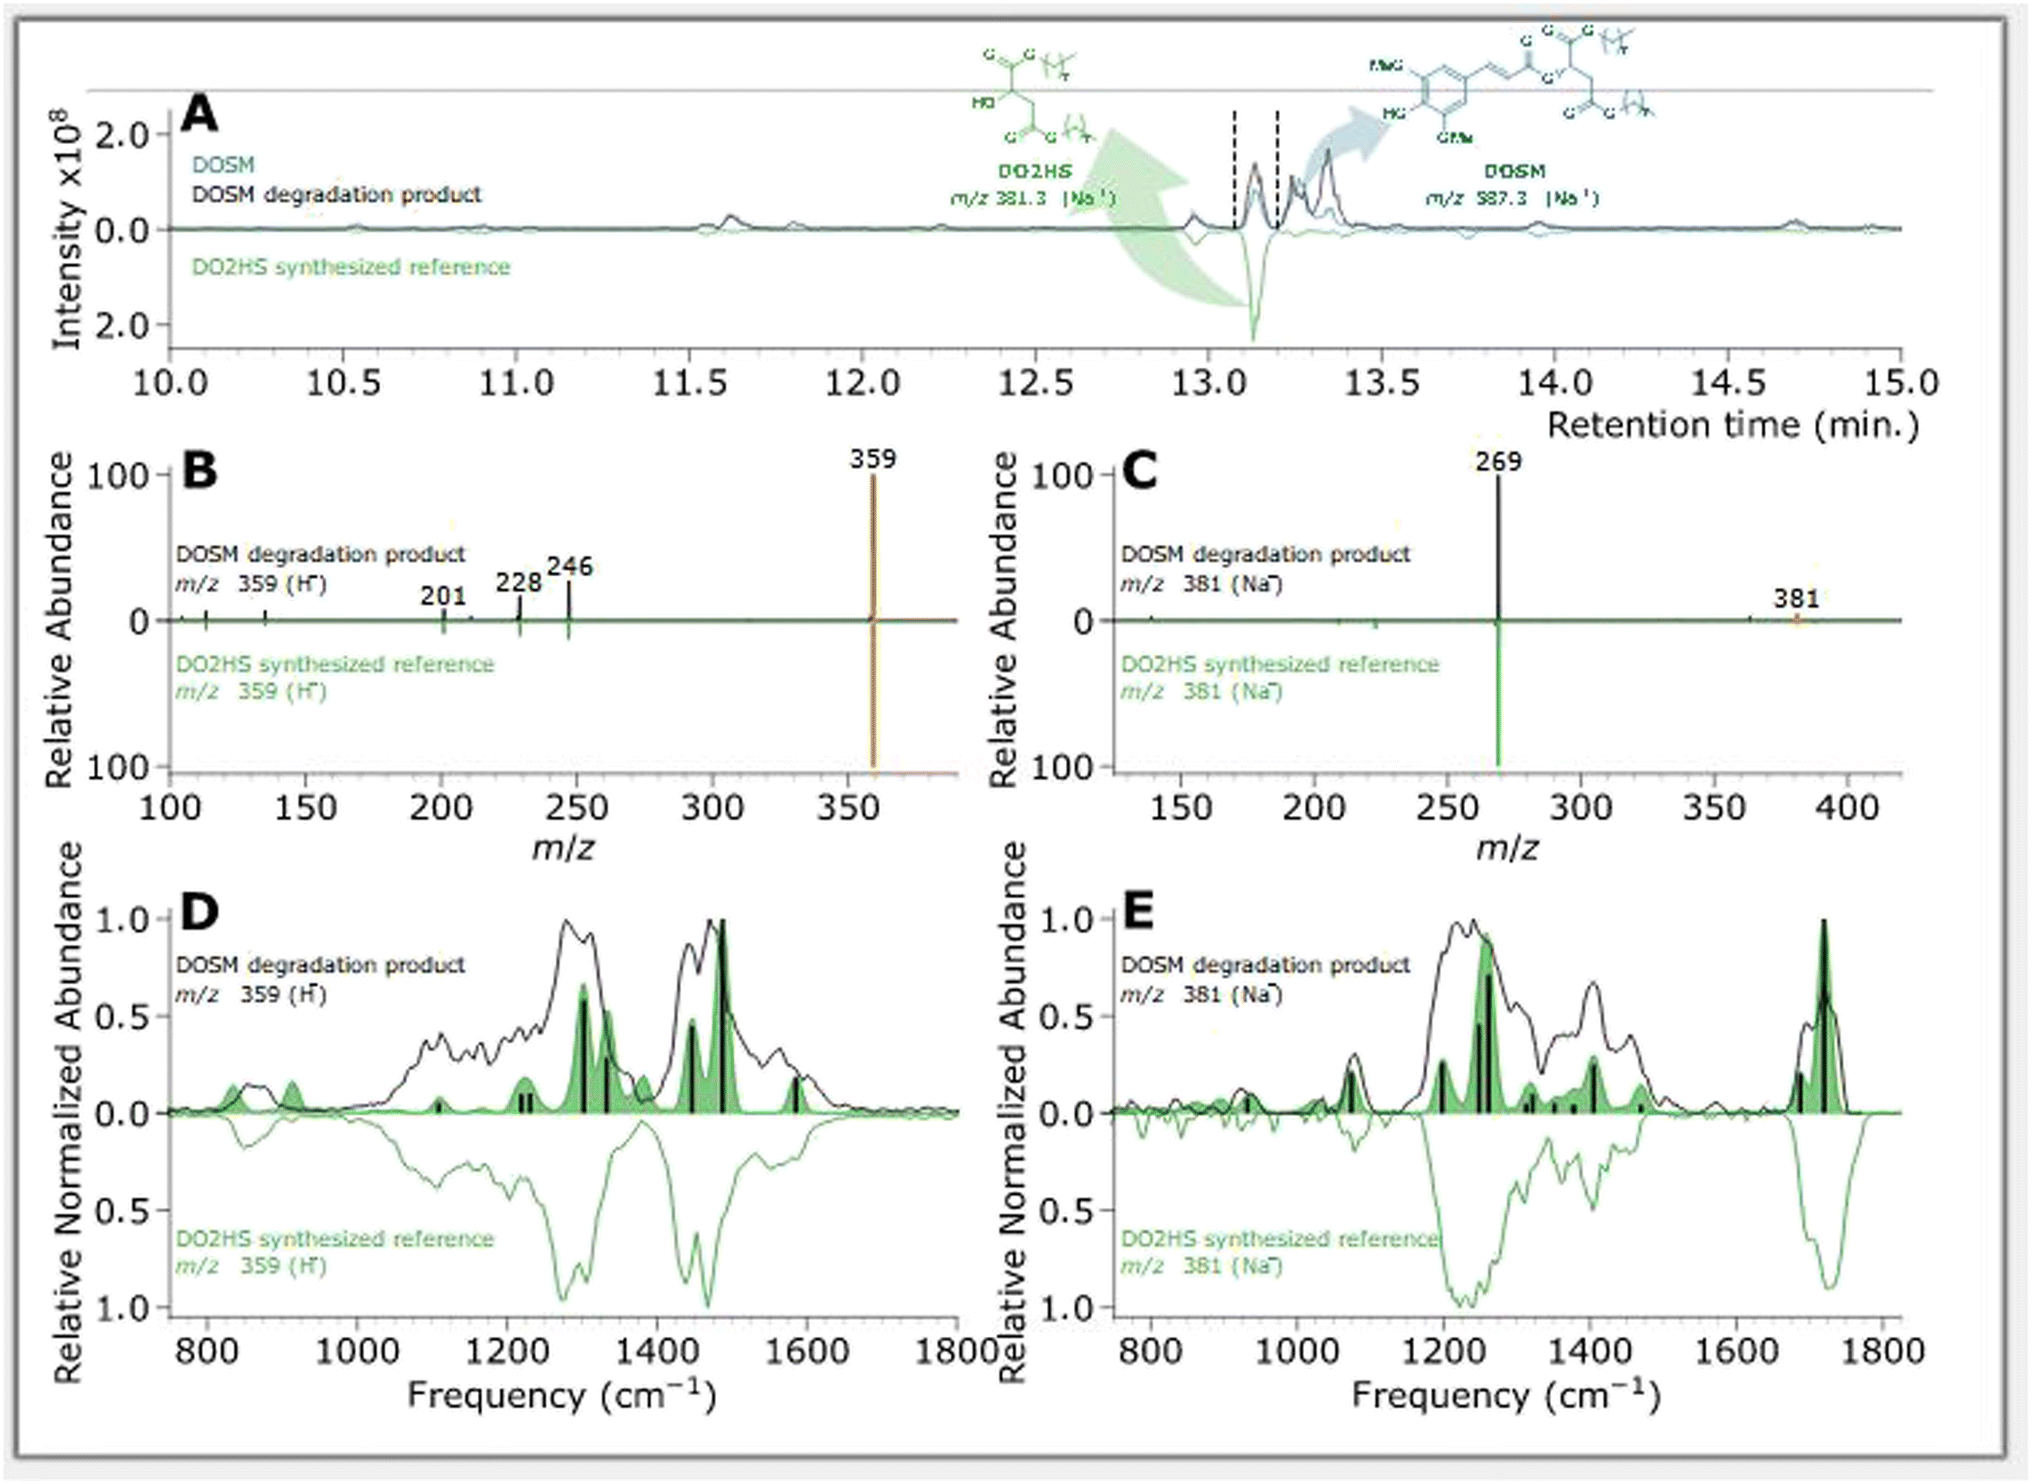 | ||
| Fig. 5 Feature of interest characterization of a DOSM degradation product compared with DO2HS synthesized reference. (A) BPC chromatograms of samples, where non-degraded DOSM is plotted in blue, degraded DOSM in black, and the DO2HS standard in green. (B) MS/MS fragmentation pattern of DOSM degradation product at m/z 359 in black and the DO2HS standard in green, where orange indicates the m/z 359 precursor. (C) MS/MS fragmentation pattern of DOSM degradation product at m/z 381 in black and the DO2HS standard in green, where orange indicates the m/z 381 precursor. (D) IR ion spectrum of DOSM degradation product at m/z 359 in black and the protonated DO2HS standard in green. The green-filled curve represents the DFT predicted IR spectrum with absorption lines discussed in the text as vertical black bars. (E) IR ion spectrum of DOSM degradation product at m/z 381 in black and the protonated DO2HS standard in green. The green-filled curve represents the DFT predicted IR spectrum with absorption bands discussed in the ESI† as vertical black bars. | ||
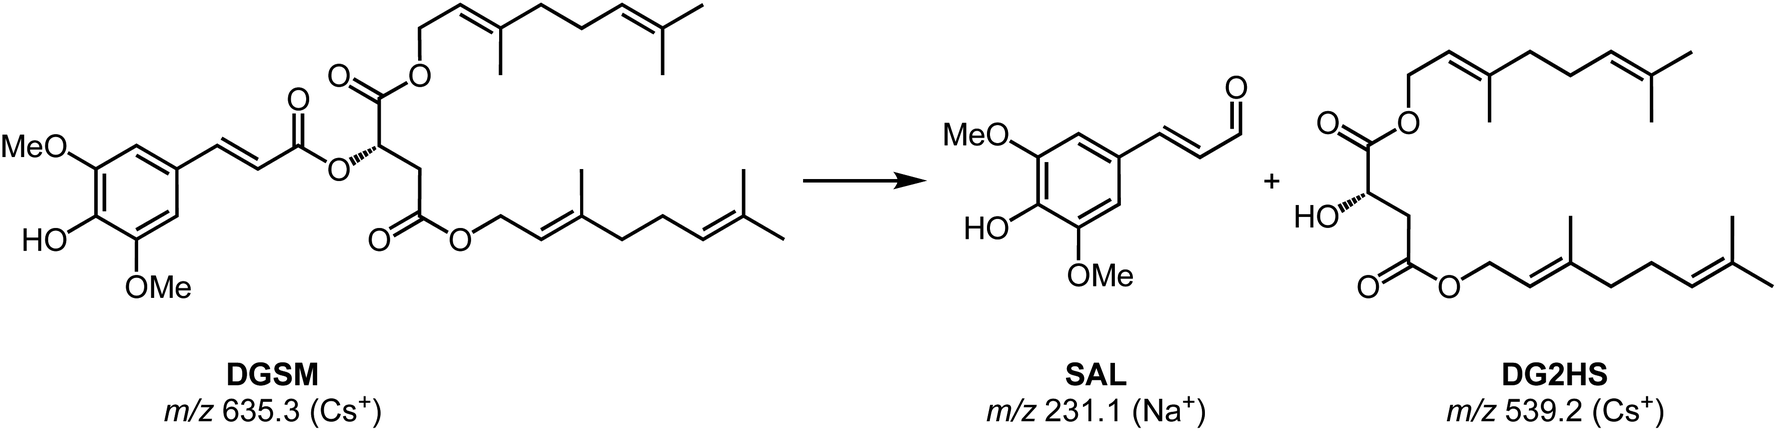
The first feature elutes at 13.35 min at an m/z of 587; the same m/z is observed in the non-irradiated DOSM but at a retention time (RT) of 13.25 min as a baseline-separated feature. Additionally, we note that both features' MS/MS fragmentation patterns are identical. In the non-degraded DOSM sample, this m/z is attributed to the sodium adduct of DOSM. As DOSM is synthesized as a pure trans-isomer and we know that the modus operandi of the photomolecular heater is based on isomerization reactions, we attribute the newly generated feature to the cis-isomerized form of DOSM.
A second feature is observed at 13.12 minutes with an m/z of 381, which is assumed to be a sodium adduct since the protonated feature at m/z 359 is also observed, but not as the base peak in the chromatogram. Considering the molecular structure of DOSM, the observed m/z value could correspond to the fragment remaining after cleaving off the ester group from the sinapoyl moiety, leaving it as an aldehyde. The complementary fragment is presumably di-octyl-2-hydroxy succinate (DO2HS), as depicted in Scheme 3. CID fragmentation of the m/z 381 ion yields a primary product at m/z 269, which can then be rationalized as expulsing one of the octyl groups. We do not observe the complementary DOSM degradation product, indicated as SAL in Scheme 3. This fragment could be obscured by in-source fragmentation forming an acylium ion (SALOX) that is observed as an ion at m/z 207, which is seen for all peaks containing the sinapoyl moiety.98–100 Alternatively, the highly reactive oxonium ion formation may explain the absence of SAL in the chromatographic analysis. Some additional degradation products at significantly lower abundances are observed, which we shall not further discuss here.
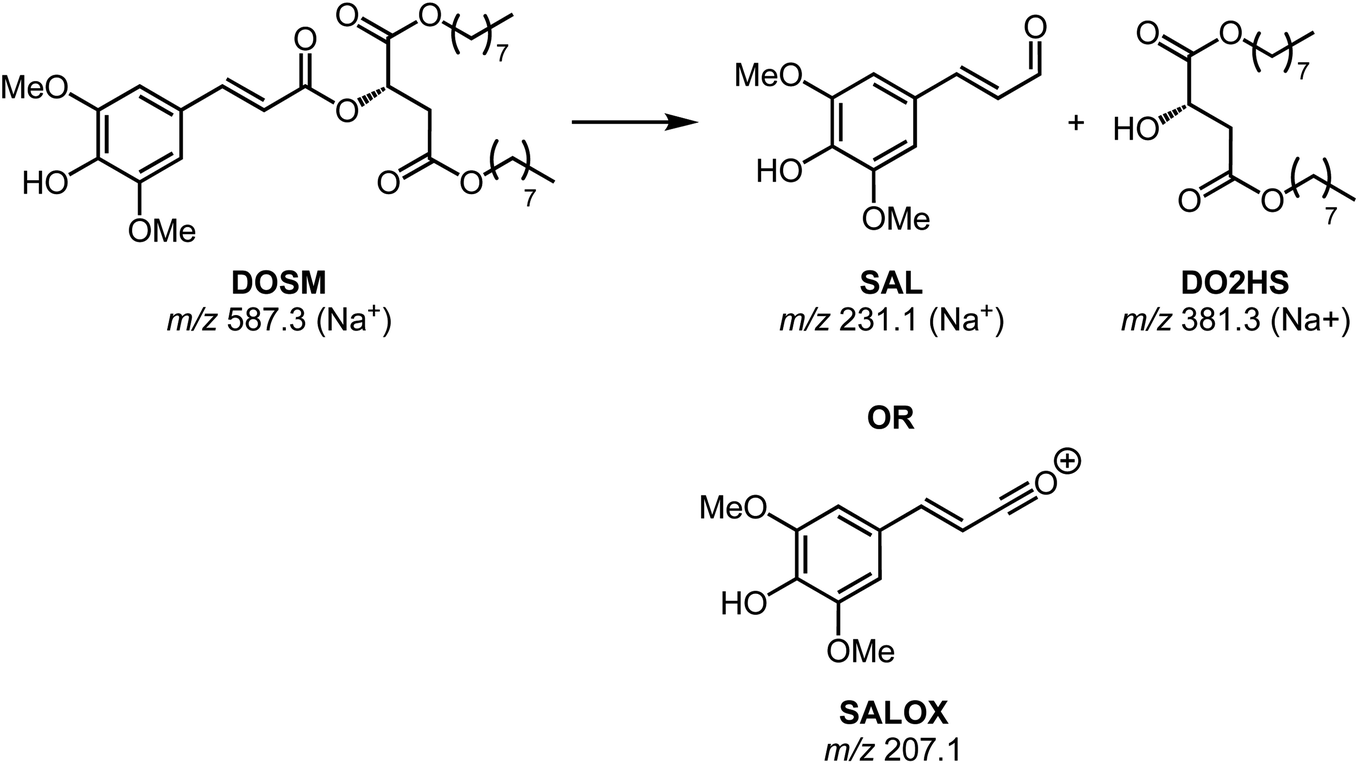 | ||
| Scheme 3 Proposed degradation product formation of DOSM. The suggested degradation reaction results in the ester cleavage of DOSM into a sinapoyl aldehyde fragment (SAL) and an alcoholic di-octyl-2-hydroxy succinate (DO2HS). | ||
Chromatograms, MS/MS, and IRIS spectra for both the photoproduct and the synthesized DO2HS reference standard are plotted in Fig. 5. The positive y-axis represents the photoproduct, while the negative axis represents the reference standard. Fig. 5D and E show the IRIS spectra for both the protonated and sodiated species. The IR photodissociation yield spectrum (eqn (1)) is shown for the protonated species. No characteristic fragments were observed for the sodiated species, unlike in CID. This suggests that the sodium ion is detached during IRMPD but remains undetected since m/z 23 is below the low-mass cut-off of the QIT.74 The depletion spectrum obtained using eqn (2) is slightly noisier. We observe a reasonable match for both spectra with the IR spectrum of DO2HS predicted by density functional theory (DFT) for the protonated and sodiated species. Therefore, we tentatively assign the DO2HS structure to the detected degradation product; a reference DO2HS standard was then synthesized in-house to evaluate whether the UV-photoproduct indeed corresponds to the suggested DO2HS candidate.
The chromatographic analysis in Fig. 5A indicates that DO2HS retention matches the feature found in the degradation sample. The MS/MS fragmentation pattern for both the protonated and sodiated adducts, shown in Fig. 5B and C, are identical for the DO2HS reference standard and the degradation feature, providing a confident LC-MS/MS match. The tentative structure assignment based on IRIS facilitated a targeted comparison with the reference standard. We can also match the IRIS spectra for the degradation product and the synthesized DO2HS reference; see Fig. 5D and E. All spectral features match peak position and relative intensity, confirming our structural identification. Based on the DFT match, absorption bands in the IRIS spectrum can be assigned to specific vibrational normal modes, as indicated with vertical sticks and discussed in more detail in the ESI.†
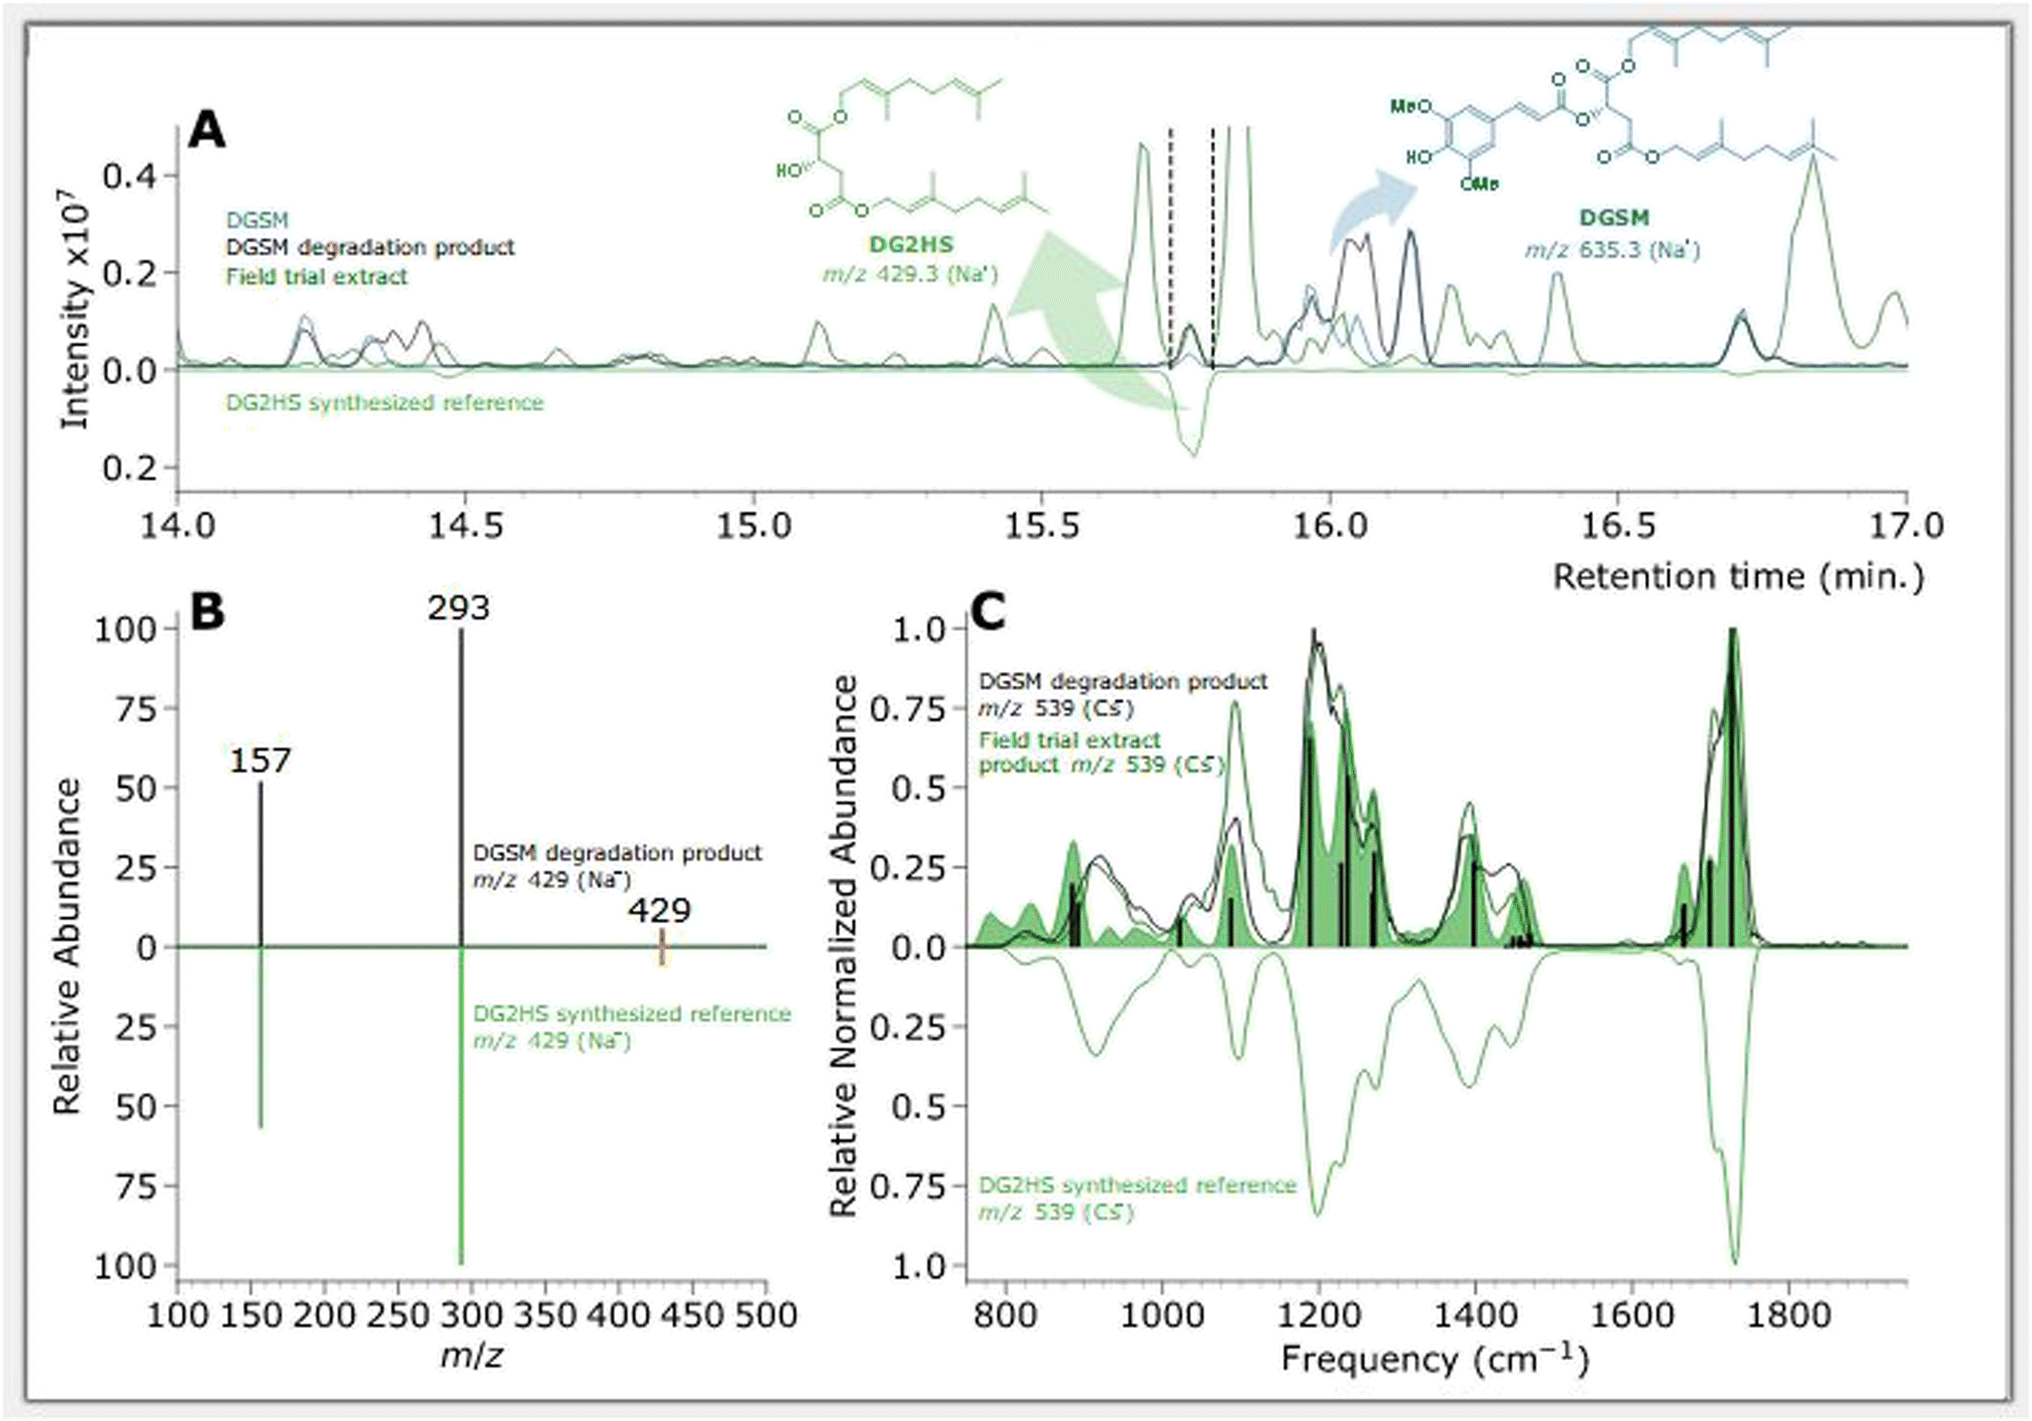 | ||
| Fig. 6 Feature of interest characterizing a DGSM degradation product compared with DG2HS synthesized reference. (A) BPC chromatograms of samples, where non-degraded DGSM is plotted in blue, degraded DGSM in black, field trial extract EU08 (cucumber DGSM (BC-05-16 2.5 L ha−1)) in dark green, and the DG2HS standard in green (inverted). (B) MS/MS fragmentation pattern of DGSM degradation product at m/z 429 in black and the DG2HS standard in green, where orange indicates the m/z 429 precursor. (C) IR ion spectrum of DGSM degradation product at m/z 539 in black, field trial extract EU08 (cucumber DGSM (BC-05-16 2.5 L ha−1)) in dark green, and the cesium ion DG2HS standard in green (inverted). The green-filled curve represents the DFT-predicted IR spectrum with absorption bands discussed in the ESI† as vertical black bars. | ||
Chromatographic features of interest are identified by comparing degraded and non-degraded DGSM. DGSM elutes at 16.00 min at m/z of 635 as the sodiated ion. After degradation, similar to what was observed in DOSM, we found an isomeric feature at 16.05 min, which is attributed to the cis-isomerized product of DGSM. More interestingly, we observe an additional feature at 15.75 min with an m/z of 429, which was also encountered in the field trial extracts, indicating that the feature is formed in vitro and in vivo. The accurate mass value of the m/z 429 ion suggests an ester cleavage product similar to DO2HS. The alcoholic di-geraniol-2-hydroxy succinate (DG2HS) that is hypothesized to form in this case is depicted in Scheme 4. We investigated this ion further using IRIS spectroscopy, as shown in Fig. 6.
 | ||
| Scheme 4 Schematic of proposed degradation product formation of DGSM. | ||
Fig. 6C depicts the IRIS spectrum of the Cs+-adduct of DG2HS along with a DFT-predicted IR spectrum. The cesium ion adduct gave a better quality spectrum than the Na+ adduct (recorded in depletion; see above for the DO2HS). As compared to Na+, the weaker binding energy of Cs+ often generates cleaner IRMPD spectra, where the cesium ion acts as a weakly-bound messenger tag,101–105 and moreover, Cs+ is easier to detect in the QIT-MS due to its higher mass. The match between the experimental and theoretical spectra is sufficiently convincing for a tentative assignment based on the features above 1000 cm−1, and warranted the synthesis of a reference standard of DG2HS.
The top part of Fig. 6A shows the chromatograms of the photoproduct from the solar simulation and field trial extract, with the reference standards results displayed as an inverted curve. Fig. 6B depicts the MS/MS spectrum of the field trial extract at m/z 429 and the reference standard in the inverted axes. This figure shows that the feature of interest and the DG2HS reference standard have the same retention time and MS/MS fragmentation pattern, which strongly suggests that they are the same molecule. In addition, we compared the IR ion spectrum of the photoproduct in the solar simulation, the field trial extract, and the DG2HS reference standard – also synthesized in-house – presented in Fig. 6C. This comparison confirms the assignment and enables us to confidently associate specific vibrational modes with the observed spectral characteristics, as further detailed in the ESI.†
3.6. In silico predictions
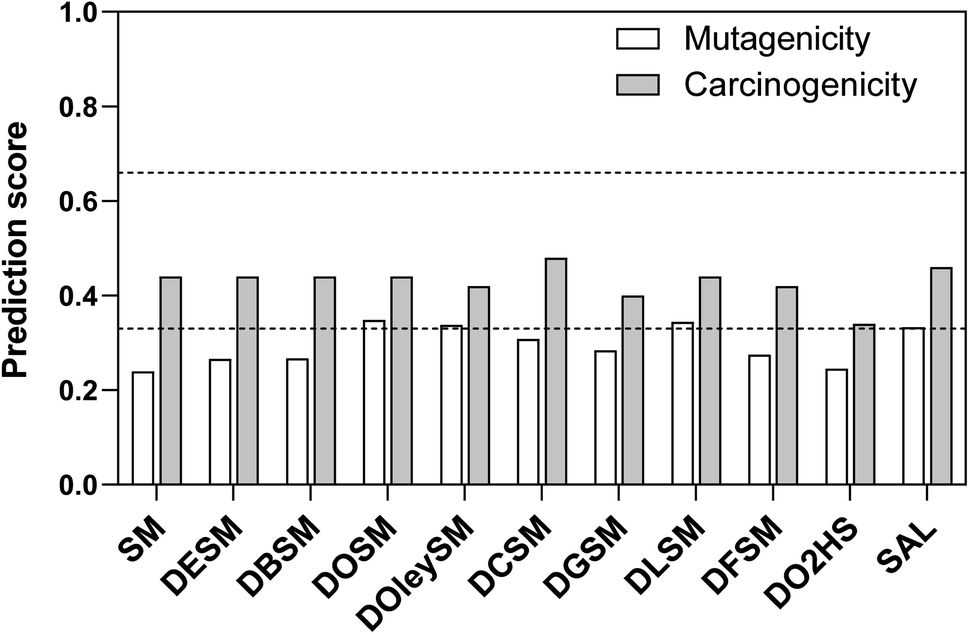 | ||
| Fig. 7 Schematic presentation of the results of the in silico analysis with regard to the endpoint mutagenicity, and carcinogenicity. The test compounds are listed by their average prediction score on the y axis. In addition, the prediction scores were divided in three different groups (dashed lines): the probable mutagens/carcinogens with scores greater than 0.66, the probably non-mutagens/non-carcinogens with scores smaller than 0.33, and the remaining equivocal predictions with scores between 0.33 and 0.66. | ||
Regarding endocrine toxicity, all test compounds were predicted to have binding affinity for the estrogen receptor, but the reliability was low (Table S4†). Besides, all of them were predicted inactive with regards to estrogen receptor-mediated effects (all predictions with good reliability except for DGSM being of moderate reliability). Moreover, they were all predicted inactive with regards to the androgen receptor, with moderate reliability. None of the test compounds were predicted to exert effects via thyroid receptors (all predictions with good reliability). In regards to the DOSM degradation products, DO2HS was predicted to have binding affinity for the estrogen receptor (with low reliability) but was predicted inactive with good reliability for all other receptors. SAL was predicted to be active towards androgen receptor with low reliability while inactive towards all other receptors (with good or low reliability).
600 mg kg−1 body weight (bw) (Table S5†). The estimated NOAELs ranged between 60 and 1050 mg kg−1 bw per day.
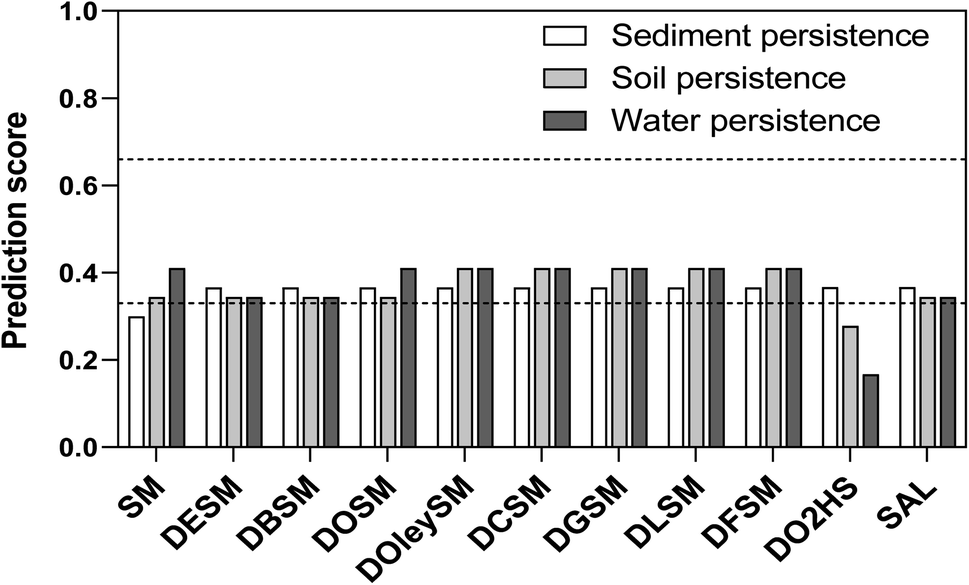 | ||
| Fig. 8 Schematic presentation of the results of the in silico analysis with regard to the endpoint persistence (sediment, soil, and water). The test compounds are shown with their average prediction score. In addition, the prediction scores were divided in three different groups (dashed lines): the probable persistent substances with scores greater than 0.66, the probably non-persistent substances with scores smaller than 0.33, and the remaining equivocal predictions with scores between 0.33 and 0.66. | ||
In summary, we used a battery of different in silico models to gain information on both toxicity and environmental aspects. The outcomes of the different predictions did not show a critical potential for toxicity (especially mutagenicity) or environmental persistence. Thus, in view of the preliminary in silico data, no particular alert prohibits from further development of the test compounds regarding their use as molecular heaters. However, it is important to stress out that in silico approaches do not replace in vitro and/or in vivo toxicological testing. For admission of the test compounds to the market, a wide toxicological examination will be required to constitute a proper submission dossier. Such examination is, nonetheless, beyond the scope of this study.
4. Conclusions
Herein, we have reported a high-yielding (88–99%) and highly selective green biocatalytic pathway to bio-based fatty chains-bearing SM derivatives. These latest molecules exhibit similar UV-filtering properties to SM (λmax ≈ 335 nm), indicating that the additional fatty chains do not disrupt the UV-filtering potential of these new analogues. Their photostability showed that, with the omission of DOSM (27%), all the new analogues exhibited better photostability (i.e., loss of absorbance) than Octinoxate™ (15–26% vs. 27%). It is noteworthy to mention that analogues bearing unsaturated fatty chains (DCSM, DGSM, DFSM and DOleySM) exhibited the strongest photostabilities (15–18%). These compounds might thus be considered as a valuable bio-based alternative to the controversial and petroleum based commercial UV filters. Conversely, the addition of ester moieties in place of the two free carboxylic acids proved to have a negative impact on the antioxidant activity. Although all SM derivatives exhibited higher EC50 (11.2–18.3 nmol) than SM (8.5 nmol), these antioxidant activities still remain interesting for five compounds (DBSM, DLSM, DCSM, DGSM and DFSM, EC50: 11.2–13.4 nmol).The photophysics of these SM derivatives following absorption of UV radiation has also been studied through ultrafast transient absorption spectroscopy. The results showed that the relaxation mechanism in these molecules is the same as that of SM, returning to the ground state on an ultrafast time scale. The relaxation mechanism has been determined to be initiated by geometry relaxation out of the Franck–Condon region, followed by S1/S0 internal conversion resulting in the formation of both starting trans isomer and cis isomer photoproduct. This relaxation process results in the dissipation of the absorbed energy to the solvent environment as vibrational energy (i.e., heat), thereby making these SM derivatives suitable for application where efficient light-to-heat conversion is required.
In order to evaluate the toxicological properties of the test compounds, we ran a battery of in silico analyses to cover key endpoints such as mutagenicity, carcinogenicity, or oral acute toxicity. Environmental aspects (e.g., bioaccumulation, persistence) were also covered. No critical potential for toxicity (especially mutagenicity) or environmental persistence were noticed for the test compounds and analysis for the two degradation products of DOSM also showed no alerts. These in silico predictions should be confirmed by adequate in vitro and/or in vivo testing as computational modelling is not yet able to replace classical testing methodologies.
Considering their green synthesis, UV filtering activity, photostability, photophysics, lack of critical toxicity, lack of persistence and bioaccumulation and ability to interact with waxy cuticle of plants, and to be readily incorporated in cosmetic formulations, the SM derivatives studied in this work are promising for application as UV filters in cosmetics, as well as molecular heaters in crop protection through incorporation in a foliar spray.
Data availability
The data that support the findings of this study are available upon request.Author contributions
F. A., V. G. S., A. B., and J. O. conceived the original research and acquired funding. B. R., L. M. M. M., M. M. M., A. A. M. P. and F. B. performed the synthesis, characterizations, UV and photostabilities analysis, and antiradical analysis. T. T. A. acquired and analyzed the transient absorption data. T. T. A. acquired and analyzed the steady-state spectroscopy data with assistance from J. M. W. J. A. conducted and analyzed the in silico toxicology studies. M. J. A. V. performed the LC-MS-IRIS study on the solar degradation product of DOSM. G. B. and J. O. contributed in the interpretation and analysis of the LC-MS-IRIS study. B. R., L. M. M. M., M. M. M., T. T. A., M. J. A. V., J. M. W. and J. A. contributed to writing the manuscript. F. A., A. B., G. B., J. O. and V. G. S. reviewed and corrected the manuscript.Conflicts of interest
There are no conflicts to declare.Acknowledgements
The authors acknowledge the FET-Open grant BoostCrop (grant agreement 828753) and the entire BoostCrop (https://boostcrop.eu/) team for their interest in the work. T. T. A. thanks the University of Warwick for a PhD studentship through the Chancellor Scholarship. B. R., L. M. M. M., M. M. M., A. A. M. P., F. B. and F. A. thank the Agence Nationale de la Recherche (grant number ANR-17-CE07-0046), as well as the Grand Reims, Conseil Départemental de la Marne, and the Grand Est region for financial support. V. G. S. thanks the Royal Society for a Royal Society Industry Fellowship. M. J. A. V., G. B., and J. O. acknowledge the Nederlandse Organisatie voor Wetenschappelijk Onderzoek (NWO) for the support of the FELIX laboratory and the NWO domain Science for computational time (grant number 2021.055). Additionally, we would like to acknowledge Marise Borja, Dirk Schulz, and Verena Wanders for their contribution to formulation development, coordination and sampling of the field trials enabling analysis of the crops with LC-MS.References
- H. Jin, E. Cominelli, P. Bailey, A. Parr, F. Mehrtens, J. Jones, C. Tonelli, B. Weisshaar and C. Martin, EMBO J., 2000, 19, 6150–6161, DOI:10.1093/emboj/19.22.6150.
- L. A. Baker, B. Marchetti, T. N. V. Karsili, V. G. Stavros and M. N. R. Ashfold, Chem. Soc. Rev., 2017, 46, 3770–3791, 10.1039/C7CS00102A.
- C. Barta, T. Kálai, K. Hideg, I. Vass and É. Hideg, Funct. Plant Biol., 2004, 31, 23–28, DOI:10.1071/FP03170.
- G. I. Jenkins, Annu. Rev. Plant Biol., 2009, 60, 407–431, DOI:10.1146/annurev.arplant.59.032607.092953.
- H. Frohnmeyer and D. Staiger, Plant Physiol., 2003, 133, 1420–1428, DOI:10.1104/pp.103.030049.
- A. Glasauer and N. S. Chandel, Curr. Biol., 2013, 23, R100–R102, DOI:10.1016/j.cub.2012.12.011.
- A. Glasauer and N. S. Chandel, Biochem. Pharmacol., 2014, 92, 90–101, DOI:10.1016/j.bcp.2014.07.017.
- R. Mittler, Trends Plant Sci., 2017, 22, 11–19, DOI:10.1016/j.tplants.2016.08.002.
- J. Li, T. M. Ou-Lee, R. Raba, R. G. Amundson and R. L. Last, Plant Cell, 1993, 5, 171–179, DOI:10.1105/tpc.5.2.171.
- V. Yadav, Z. Wang, C. Wei, A. Amo, B. Ahmed, X. Yang and X. Zhang, Pathogens, 2020, 9, 312, DOI:10.3390/pathogens9040312.
- A. Sharma, B. Shahzad, A. Rehman, R. Bhardwaj, M. Landi and B. Zheng, Molecules, 2019, 24, 2452, DOI:10.3390/molecules24132452.
- L. A. Baker, M. D. Horbury, S. E. Greenough, F. Allais, P. S. Walsh, S. Habershon and V. G. Stavros, J. Phys. Chem. Lett., 2016, 7, 56–61, DOI:10.1021/acs.jpclett.5b02474.
- C. M. Fraser and C. Chapple, Arabidopsis, 2011, 9, e0152, DOI:10.1199/tab.0152.
- R. A. Dixon, L. Achnine, P. Kota, C.-J. Liu, M. S. S. Reddy and L. Wang, Mol. Plant Pathol., 2002, 3, 371–390, DOI:10.1046/j.1364-3703.2002.00131.x.
- L. A. Baker and V. G. Stavros, Sci. Prog., 2016, 99, 282–311, DOI:10.3184/03685016X14684992086383.
- M. D. Horbury, W. D. Quan, A. L. Flourat, F. Allais and V. G. Stavros, Phys. Chem. Chem. Phys., 2017, 19, 21127–21131, 10.1039/C7CP04070A.
- K. Osakabe and Y. Osakabe, eLS, 2012, DOI:10.1002/9780470015902.a0001319.pub2.
- T. T. Abiola, B. Rioux, J. M. Toldo, J. Alarcan, J. M. Woolley, M. A. P. Turner, D. J. L. Coxon, M. Telles do Casal, C. Peyrot, M. M. Mention, W. J. Buma, M. N. R. Ashfold, A. Braeuning, M. Barbatti, V. G. Stavros and F. Allais, Chem. Sci., 2021, 12, 15239–15252, 10.1039/D1SC05077J.
- A. Jesus, E. Sousa, M. T. Cruz, H. Cidade, J. M. S. Lobo and I. F. Almeida, Pharmaceuticals, 2022, 15, 263, DOI:10.3390/ph15030263.
- L. Ouchene, I. V. Litvinov and E. Netchiporouk, J. Cutaneous Med. Surg., 2019, 23, 648–649, DOI:10.1177/1203475419871592.
- S. Suh, C. Pham, J. Smith and N. A. Mesinkovska, Int. J. Dermatol., 2020, 59, 1033–1042, DOI:10.1111/ijd.14824.
- K. U. Schallreuter, J. M. Wood, D. W. Farwell, J. Moore and H. G. M. Edwards, J. Invest. Dermatol., 1996, 106, 583–586, DOI:10.1111/1523-1747.ep12344991.
- R. D. Kouchi, A Bill for an Act Relating to Water Pollution, https://www.capitol.hawaii.gov/Archives/measure_indiv_Archives.aspx?billnumber=132%26billtype=SB%26year=2021, accessed February 23rd 2022 Search PubMed.
- D. Vuckovic, I. Tinoco Amanda, L. Ling, C. Renicke, R. Pringle John and A. Mitch William, Science, 2022, 376, 644–648, DOI:10.1126/science.abn2600.
- P. Anastas and J. Warner, Green Chemistry: Theory and Practice, Oxford Univ Press, 1998 Search PubMed.
- W. Setyaningsih, I. E. Saputro, C. A. Carrera and M. Palma, Food Chem., 2019, 288, 221–227, DOI:10.1016/j.foodchem.2019.02.107.
- D. Rais and S. Zibek, Adv. Biochem. Eng./Biotechnol., 2019, 166, 469–518, DOI:10.1007/10_2017_6.
- B. Rioux, C. Peyrot, M. M. Mention, F. Brunissen and F. Allais, Antioxidants, 2020, 9, 331, DOI:10.3390/antiox9040331.
- L. M. M. Mouterde, A. A. M. Peru, M. M. Mention, F. Brunissen and F. Allais, J. Agric. Food Chem., 2020, 68, 6998–7004, DOI:10.1021/acs.jafc.0c02183.
- B. Rioux, M. M. Mention, J. Alarcan, T. T. Abiola, C. Peyrot, F. Brunissen, A. Braeuning, V. G. Stavros and F. Allais, Green Chem. Lett. Rev., 2022, 15, 114–125, DOI:10.1080/17518253.2021.2022219.
- M. D. Horbury, E. L. Holt, L. M. M. Mouterde, P. Balaguer, J. Cebrian, L. Blasco, F. Allais and V. G. Stavros, Nat. Commun., 2019, 10, 1–8, DOI:10.1038/s41467-019-12719-z.
- C. Peyrot, M. M. Mention, F. Brunissen and F. Allais, Antioxidants, 2020, 9, 782, DOI:10.3390/antiox9090782.
- C. Peyrot, M. M. Mention, F. Brunissen, P. Balaguer and F. Allais, Molecules, 2020, 25, 2178, DOI:10.3390/molecules25092178.
- M. M. Mention, A. L. Flourat, C. Peyrot and F. Allais, Green Chem., 2020, 22, 2077–2085, 10.1039/d0gc00122h.
- T. T. Abiola, N. d. N. Rodrigues, C. Ho, D. J. L. Coxon, M. D. Horbury, J. M. Toldo, M. T. do Casal, B. Rioux, C. Peyrot, M. M. Mention, P. Balaguer, M. Barbatti, F. Allais and V. G. Stavros, J. Phys. Chem. Lett., 2021, 12, 337–344, DOI:10.1021/acs.jpclett.0c03004.
- C. Peyrot, M. M. Mention, R. Fournier, F. Brunissen, J. Couvreur, P. Balaguer and F. Allais, Green Chem., 2020, 22, 6510–6518, 10.1039/D0GC02763D.
- J. Ashraf, E. U. Mughal, A. Sadiq, M. Bibi, N. Naeem, A. Ali, A. Massadaq, N. Fatima, A. Javid, M. N. Zafar, B. A. Khan, M. F. Nazar, A. Mumtaz, M. N. Tahir and M. Mirzaei, J. Biomol. Struct. Dyn., 2021, 39, 7107–7122, DOI:10.1080/07391102.2020.1805364.
- M. Balakrishna, S. S. Kaki, M. S. L. Karuna, S. Sarada, C. G. Kumar and R. B. N. Prasad, Food Chem., 2017, 221, 664–672, DOI:10.1016/j.foodchem.2016.11.121.
- B. Rioux, A. Pinon, A. Gamond, F. Martin, A. Laurent, Y. Champavier, C. Barette, B. Liagre, C. Fagnère, V. Sol and C. Pouget, Eur. J. Med. Chem., 2021, 222, 113586, DOI:10.1016/j.ejmech.2021.113586.
- B. Rioux, C. Pouget, C. Fidanzi-Dugas, A. Gamond, A. Laurent, J. Semaan, A. Pinon, Y. Champavier, D. Y. Leger, B. Liagre, J.-L. Duroux, C. Fagnere and V. Sol, Bioorg. Med. Chem. Lett., 2017, 27, 4354–4357, DOI:10.1016/j.bmcl.2017.08.024.
- B. Rioux, C. Pouget, G. M. A. Ndong-Ntoutoume, R. Granet, A. Gamond, A. Laurent, A. Pinon, Y. Champavier, B. Liagre, C. Fagnere and V. Sol, Bioorg. Med. Chem. Lett., 2019, 29, 1895–1898, DOI:10.1016/j.bmcl.2019.05.056.
- G. Seelinger, I. Merfort and C. M. Schempp, Planta Med., 2008, 74, 1667–1677, DOI:10.1055/s-0028-1088314.
- M. Funakoshi-Tago, K. Nakamura, K. Tago, T. Mashino and T. Kasahara, Int. Immunopharmacol., 2011, 11, 1150–1159, DOI:10.1016/j.intimp.2011.03.012.
- R. Ginwala, R. Bhavsar, D. G. I. Chigbu, P. Jain and Z. K. Khan, Antioxidants, 2019, 8, 35, DOI:10.3390/antiox8020035.
- W. Fan, S. Qian, P. Qian and X. Li, Virus Res., 2016, 220, 112–116, DOI:10.1016/j.virusres.2016.04.021.
- S. L. Badshah, S. Faisal, A. Muhammad, B. G. Poulson, A. H. Emwas and M. Jaremko, Biomed. Pharmacother., 2021, 140, 111596, DOI:10.1016/j.biopha.2021.111596.
- A. Di Petrillo, G. Orrù, A. Fais and M. C. Fantini, Phytother. Res., 2022, 36, 266–278, DOI:10.1002/ptr.7309.
- L. Minsat, C. Peyrot, F. Brunissen, J.-H. Renault and F. Allais, Antioxidants, 2021, 10, 512, DOI:10.3390/antiox10040512.
- J. Liu, C. Chen, F. Wu and L. Zhao, Chem. Biol. Drug Des., 2013, 82, 39–47, DOI:10.1111/cbdd.12126.
- S. Y. Lee, N. Baek and T.-g. Nam, J. Enzyme Inhib. Med. Chem., 2016, 31, 1–13, DOI:10.3109/14756366.2015.1004058.
- E. Knoevenagel, Ber. Dtsch. Chem. Ges., 1894, 27, 2345–2346, DOI:10.1002/cber.189402702229.
- L. M. M. Mouterde and F. Allais, Front. Chem., 2018, 6, 426, DOI:10.3389/fchem.2018.00426.
- P. Singh and M. Kaur, Chem. Commun., 2011, 47, 9122–9124, 10.1039/C1CC12668G.
- J. K. Rajput and G. Kaur, Chin. J. Catal., 2013, 34, 1697–1704, DOI:10.1016/S1872-2067(12)60646-9.
- X. Hu, C. Ngwa and Q. Zheng, Curr. Org. Synth., 2016, 13, 101–110, DOI:10.2174/1570179412666150505185134.
- D. C. Forbes, A. M. Law and D. W. Morrison, Tetrahedron Lett., 2006, 47, 1699–1703, DOI:10.1016/j.tetlet.2006.01.059.
- K. Isobe, T. Hoshi, T. Suzuki and H. Hagiwara, Mol. Diversity, 2005, 9, 317–320, DOI:10.1007/s11030-005-8107-0.
- J. van Schijndel, L. A. Canalle, D. Molendijk and J. Meuldijk, Green Chem. Lett. Rev., 2017, 10, 404–411, DOI:10.1080/17518253.2017.1391881.
- G. Thirupathi, M. Venkatanarayana, P. K. Dubey and Y. B. Kumari, Org. Chem. Int., 2012, 2012, 191584, DOI:10.1155/2012/191584.
- G. Kaupp, M. R. Naimi-Jamal and J. Schmeyers, Tetrahedron, 2003, 59, 3753–3760, DOI:10.1016/S0040-4020(03)00554-4.
- C. Peyrot, A. A. M. Peru, L. M. M. Mouterde and F. Allais, ACS Sustainable Chem. Eng., 2019, 7, 9422–9427, DOI:10.1021/acssuschemeng.9b00624.
- B. Rioux, C. Peyrot, M. M. Mention, F. Brunissen and F. Allais, Antioxidants, 2020, 9, 331, DOI:10.3390/antiox9040331.
- M. D. Horbury, L. A. Baker, N. D. N. Rodrigues, W.-D. Quan and V. G. Stavros, Chem. Phys. Lett., 2017, 673, 62–67, DOI:10.1016/j.cplett.2017.02.004.
- S. E. Greenough, M. D. Horbury, J. O. F. Thompson, G. M. Roberts, T. N. V. Karsili, B. Marchetti, D. Townsend and V. G. Stavros, Phys. Chem. Chem. Phys., 2014, 16, 16187–16195, 10.1039/C4CP02424A.
- S. E. Greenough, G. M. Roberts, N. A. Smith, M. D. Horbury, R. G. McKinlay, J. M. Żurek, M. J. Paterson, P. J. Sadler and V. G. Stavros, Phys. Chem. Chem. Phys., 2014, 16, 19141–19155, 10.1039/C4CP02359E.
- M. P. Grubb, A. J. Orr-Ewing and M. N. R. Ashfold, Rev. Sci. Instrum., 2014, 85, 064104, DOI:10.1063/1.4884516.
- J. J. Snellenburg, S. Laptenok, R. Seger, K. M. Mullen and I. H. M. van Stokkum, J. Stat. Software, 2012, 49, 1–22, DOI:10.18637/jss.v049.i03.
- K. M. Mullen and I. H. M. van Stokkum, J. Stat. Software, 2007, 18, 1–46, DOI:10.18637/jss.v018.i03.
- S. Chaudhary, H. Lu, A. M. Müller, C. J. Bardeen and M. Ozkan, Nano Lett., 2007, 7, 1973–1979, DOI:10.1021/nl070717l.
- M. Theelen, K. Bakker, H. Steijvers, S. Roest, P. Hielkema, N. Barreau and E. Haverkamp, JoVE, 2018, e55897, DOI:10.3791/55897.
- R. E. van Outersterp, K. J. Houthuijs, G. Berden, U. F. Engelke, L. A. J. Kluijtmans, R. A. Wevers, K. L. M. Coene, J. Oomens and J. Martens, Int. J. Mass Spectrom., 2019, 443, 77–85, DOI:10.1016/j.ijms.2019.05.015.
- R. E. van Outersterp, U. F. H. Engelke, J. Merx, G. Berden, M. Paul, T. Thomulka, A. Berkessel, M. C. D. G. Huigen, L. A. J. Kluijtmans, J. Mecinović, F. P. J. T. Rutjes, C. D. M. van Karnebeek, R. A. Wevers, T. J. Boltje, K. L. M. Coene, J. Martens and J. Oomens, Anal. Chem., 2021, 93, 15340–15348, DOI:10.1021/acs.analchem.1c02896.
- J. Martens, G. Berden, C. R. Gebhardt and J. Oomens, Rev. Sci. Instrum., 2016, 87, 103108, DOI:10.1063/1.4964703.
- G. Berden, M. Derksen, K. J. Houthuijs, J. Martens and J. Oomens, Int. J. Mass Spectrom., 2019, 443, 1–8, DOI:10.1016/j.ijms.2019.05.013.
- G. J. Myatt, E. Ahlberg, Y. Akahori, D. Allen, A. Amberg, L. T. Anger, A. Aptula, S. Auerbach, L. Beilke, P. Bellion, R. Benigni, J. Bercu, E. D. Booth, D. Bower, A. Brigo, N. Burden, Z. Cammerer, M. T. D. Cronin, K. P. Cross, L. Custer, M. Dettwiler, K. Dobo, K. A. Ford, M. C. Fortin, S. E. Gad-McDonald, N. Gellatly, V. Gervais, K. P. Glover, S. Glowienke, J. Van Gompel, S. Gutsell, B. Hardy, J. S. Harvey, J. Hillegass, M. Honma, J.-H. Hsieh, C.-W. Hsu, K. Hughes, C. Johnson, R. Jolly, D. Jones, R. Kemper, M. O. Kenyon, M. T. Kim, N. L. Kruhlak, S. A. Kulkarni, K. Kümmerer, P. Leavitt, B. Majer, S. Masten, S. Miller, J. Moser, M. Mumtaz, W. Muster, L. Neilson, T. I. Oprea, G. Patlewicz, A. Paulino, E. Lo Piparo, M. Powley, D. P. Quigley, M. V. Reddy, A.-N. Richarz, P. Ruiz, B. Schilter, R. Serafimova, W. Simpson, L. Stavitskaya, R. Stidl, D. Suarez-Rodriguez, D. T. Szabo, A. Teasdale, A. Trejo-Martin, J.-P. Valentin, A. Vuorinen, B. A. Wall, P. Watts, A. T. White, J. Wichard, K. L. Witt, A. Woolley, D. Woolley, C. Zwickl and C. Hasselgren, Regul. Toxicol. Pharmacol., 2018, 96, 1–17, DOI:10.1016/j.yrtph.2018.04.014.
- H. Raunio, Front. Pharmacol., 2011, 2, 33, DOI:10.3389/fphar.2011.00033.
- VEGA, https://www.vegahub.eu/portfolio-item/vega-qsar/, 2022.
- TEST, https://www.epa.gov/chemical-research/toxicity-estimation-software-tool-test, 2022.
- LAZAR, https://lazar.in-silico.ch/predict, 2022.
- J. Glück, T. Buhrke, F. Frenzel, A. Braeuning and A. Lampen, Food Chem. Toxicol., 2018, 116, 298–306, DOI:10.1016/j.fct.2018.04.024.
- F. Frenzel, T. Buhrke, I. Wenzel, J. Andrack, J. Hielscher and A. Lampen, Arch. Toxicol., 2017, 91, 3157–3174, DOI:10.1007/s00204-016-1924-3.
- ISIDA/Predictor, https://infochim.u-strasbg.fr/cgi-bin/predictor_reach.cgi, 2022.
- C. Ortiz, M. L. Ferreira, O. Barbosa, J. C. S. dos Santos, R. C. Rodrigues, Á. Berenguer-Murcia, L. E. Briand and R. Fernandez-Lafuente, Catal. Sci. Technol., 2019, 9, 2380–2420, 10.1039/C9CY00415G.
- D. Remonatto, R. H. Miotti Jr, R. Monti, J. C. Bassan and A. V. de Paula, Process Biochem., 2022, 114, 1–20, DOI:10.1016/j.procbio.2022.01.004.
- K. Nasr, A. Favrelle-Huret, R. Mincheva, G. Stoclet, M. Bria, J.-M. Raquez and P. Zinck, ACS Appl. Polym. Mater., 2022, 4, 1387–1400, DOI:10.1021/acsapm.1c01777.
- A. Siller, S. C. Blaszak, M. Lazar and E. Olasz Harken, Plast. Surg. Nurs., 2018, 38, 158–161, DOI:10.1097/PSN.0000000000000244.
- P. Sinha Roy, M. M. Mention, M. A. P. Turner, F. Brunissen, V. G. Stavros, G. Garnier, F. Allais and K. Saito, Green Chem., 2021, 23, 10050–10061, 10.1039/D1GC02957F.
- M. D. Horbury, M. A. P. Turner, J. S. Peters, M. Mention, A. L. Flourat, N. D. M. Hine, F. Allais and V. G. Stavros, Front. Chem., 2020, 8, 633, DOI:10.3389/fchem.2020.00633.
- C. Waszczak, M. Carmody and J. Kangasjärvi, Annu. Rev. Plant Biol., 2018, 69, 209–236, DOI:10.1146/annurev-arplant-042817-040322.
- T. Karuppanapandian, J.-C. Moon, C. Kim, K. Manoharan and W. Kim, Aust. J. Crop Sci., 2011, 5, 709–725 CAS.
- C. Sánchez-Moreno, J. A. Larrauri and F. Saura-Calixto, J. Sci. Food Agric., 1998, 76, 270–276, DOI:10.1002/(SICI)1097-0010(199802)76:2<270::AID-JSFA945>3.0.CO;2-9.
- J. Luo, Y. Liu, S. Yang, A. L. Flourat, F. Allais and K. Han, J. Phys. Chem. Lett., 2017, 8, 1025–1030, DOI:10.1021/acs.jpclett.7b00083.
- X. Zhao, J. Luo, S. Yang and K. Han, J. Phys. Chem. Lett., 2019, 10, 4197–4202, DOI:10.1021/acs.jpclett.9b01651.
- X. Zhao, J. Luo, Y. Liu, P. Pandey, S. Yang, D. Wei and K. Han, J. Phys. Chem. Lett., 2019, 10, 5244–5249, DOI:10.1021/acs.jpclett.9b02175.
- T. T. Abiola, N. Auckloo, J. M. Woolley, C. Corre, S. Poigny and V. G. Stavros, Molecules, 2021, 26, 7631, DOI:10.3390/molecules26247631.
- X. Zhao, F. Ji, Y. Liang, P. Li, Y. Jia, X. Feng, Y. Sun, Y. Shi, L. Zhu and G. Zhao, J. Lumin., 2020, 223, 117228, DOI:10.1016/j.jlumin.2020.117228.
- T. T. Abiola, J. M. Toldo, M. T. do Casal, A. L. Flourat, B. Rioux, J. M. Woolley, D. Murdock, F. Allais, M. Barbatti and V. G. Stavros, Commun. Chem., 2022, 5, 141, DOI:10.1038/s42004-022-00757-6.
- M. J. A. Vink, J. J. Schermer, J. Martens, W. J. Buma, G. Berden and J. Oomens, ACS Agric. Sci. Technol., 2023, 3, 171, DOI:10.1021/acsagscitech.2c00279.
- J. J. Calvete, P. Juárez and L. Sanz, J. Mass Spectrom., 2007, 42, 1405–1414, DOI:10.1002/jms.1242.
- E. A. da Silva-Junior, C. R. Paludo, D. R. Gouvea, M. J. Kato, N. A. J. C. Furtado, N. P. Lopes, R. Vessecchi and M. T. Pupo, J. Mass Spectrom., 2017, 52, 517–525, DOI:10.1002/jms.3955.
- M. J. A. Vink, F. A. M. G. van Geenen, G. Berden, T. J. C. O'Riordan, P. W. A. Howe, J. Oomens, S. J. Perry and J. Martens, Environ. Sci. Technol., 2022, 56, 15563–15572, DOI:10.1021/acs.est.2c03210.
- M. A. Duncan, J. Phys. Chem. A, 2012, 116, 11477–11491, DOI:10.1021/jp309037d.
- O. Dopfer, Int. Rev. Phys. Chem., 2003, 22, 437–495, DOI:10.1080/0144235031000112878.
- A. L. Nicely, D. J. Miller and J. M. Lisy, J. Am. Chem. Soc., 2009, 131, 6314–6315, DOI:10.1021/ja8094526.
- E. J. Bieske and O. Dopfer, Chem. Rev., 2000, 100, 3963–3998, DOI:10.1021/cr990064w.
Footnotes |
| † Electronic supplementary information (ESI) available. See DOI: https://doi.org/10.1039/d3sc04836e |
| ‡ These authors contributed equally to this work. |
| This journal is © The Royal Society of Chemistry 2023 |