 Open Access Article
Ion sieving membrane for direct seawater anti-precipitation hydrogen evolution reaction electrode†
Qianfeng
Liu
,
Zhao
Yan
 ,
Jianxin
Gao
,
Hefei
Fan
,
Min
Li
and
Erdong
Wang
,
Jianxin
Gao
,
Hefei
Fan
,
Min
Li
and
Erdong
Wang
 *
*
Dalian National Laboratory for Clean Energy, Dalian Institute of Chemical Physics, Chinese Academy of Sciences, Dalian 116023, China. E-mail: edwang@dicp.ac.cn
First published on 7th October 2023
Abstract
In seawater, severe hydroxide-based precipitation on the hydrogen evolution reaction (HER) electrode surface is still a major stumbling block for direct seawater electrolysis. Here, we design a direct seawater HER electrode with excellent anti-precipitation performance based on an Ni(OH)2 nanofiltration membrane in situ grown on nickel foam (NF) at room temperature. The positively charged Ni(OH)2 membrane with nanometer-scale cracks realises an ion sieving function, which apparently hinders the transfer of Mg2+/Ca2+ ions to suppress precipitation, while rapidly transporting OH− and H2O to ensure HER mass transfer. Therefore, the Ni(OH)2-membrane-decorated seawater HER electrode reduces precipitation by about 98.3% and exhibits high activity and stability. Moreover, in the application of a direct seawater electrolyser and magnesium seawater battery, the Ni(OH)2 membrane-decorated electrode also shows low precipitation and high stability. This work highlights a potential strategy to solve HER electrode precipitation in seawater via an ingenious electrode structure design.
Introduction
Hydrogen, a carbon-free fuel, can provide a practicable strategy to mitigate climate change and achieve carbon neutrality,1–4 since it is generated through water electrolysis powered by clean energy, such as seawater electrolysis powered by off-shore wind power.5–7 Compared with conventional alkaline and proton exchange membrane (PEM) water electrolysis, seawater electrolysis directly uses the seawater as a waterhead, which reduces the cost of hydrogen production by getting rid of the equipments to produce ultra-pure water.8,9 However, impurity ions in seawater, e.g. Cl− (20.06 g kg−1 H2O) and Mg2+ (1.33 g kg−1 H2O), are known to bring about challenges of the chlorine evolution reaction (ClER) on the oxygen evolution reaction (OER) electrode, equipment corrosion by Cl−, and the precipitation of hydroxides on the hydrogen evolution reaction (HER) cathode.10–13 Due to the effect of blanket cathode precipitation on the size of the active area, over 50% of the HER electrode current density is lost after only 24 hours of operation.14,15 Moreover, HER electrode precipitation also causes problems for other applications, such as electrochemical sewage treatment, sodium hypochlorite production from seawater, and metal seawater batteries.16–21 Therefore, an ideal method to solve HER electrode precipitation is urgently needed for applications.The development of reported methods for solving HER electrode precipitation caused by Mg2+ and Ca2+ ions in seawater can be categorized into four types: (i) the addition of acid or inhibitor to the electrolyte, which avoids the formation of precipitate on the HER electrode, such as sulfuric acid to prevent precipitation and CO2 to dissolve CaCO3;22–25 (ii) optimizing the operating conditions or electrolyser structure, such as current density, electrolyte flow rate, and ion exchange membrane, that can scour the precipitate on the electrode by hydrogen gas bubbles and electrolyte, or an Na+ exchange membrane to alleviate the formation of Mg2+ and Ca2+ precipitates;26–28 (iii) washing with acid, that can dissolve the alkaline precipitate;15 and (iv) direct pre-removal of Mg2+ and Ca2+ ions, which eliminates the main precipitate-forming ions, as used in the chlor-alkali industry for example.29 Some of these methods can efficiently prevent the formation of precipitate, but incidental problems make large-scale application for seawater electrolysis difficult, such as acid consumption and corrosion because of acid addition or wash, and the high cost of the pre-removal of the ions. If the HER electrode surface could itself prevent the formation of precipitate, such as a Cr2O3 Lewis acid layer, which hinders the transfer of the OH− produced by the HER electrode to lower the electrode surface pH,30 this would be more significant for real applications. Several groups have revealed this phenomenon and the reason for the precipitation adsorption on the HER electrode, but studies of how to obtain an anti-precipitation HER electrode in seawater are limited.31
Herein, an Ni(OH)2 ion sieving membrane coated on the surface of 3D NF was in situ fabricated as an anti-precipitation HER electrode in seawater. Combined theoretical calculation and experimental tests, the Ni(OH)2 ion sieving membrane can efficiently hinder the transfer of Mg2+/Ca2+ ions and rapidly convey the HER related OH− and H2O due to the positive charge and nanometer-scale cracks. Due to the excellent anti-precipitation performance, rapid mass transfer, and synergistic effect between Ni(OH)2 and NF, the Ni(OH)2–NF electrode can reduce most of the precipitation on the surface, and exhibit higher HER performance than that of an NF electrode. In application to a direct seawater electrolyser and magnesium seawater battery, the Ni(OH)2-membrane-coated electrode also obviously adsorbed less precipitation and displayed higher stability.
Results and discussion
Precipitation on a seawater HER electrode
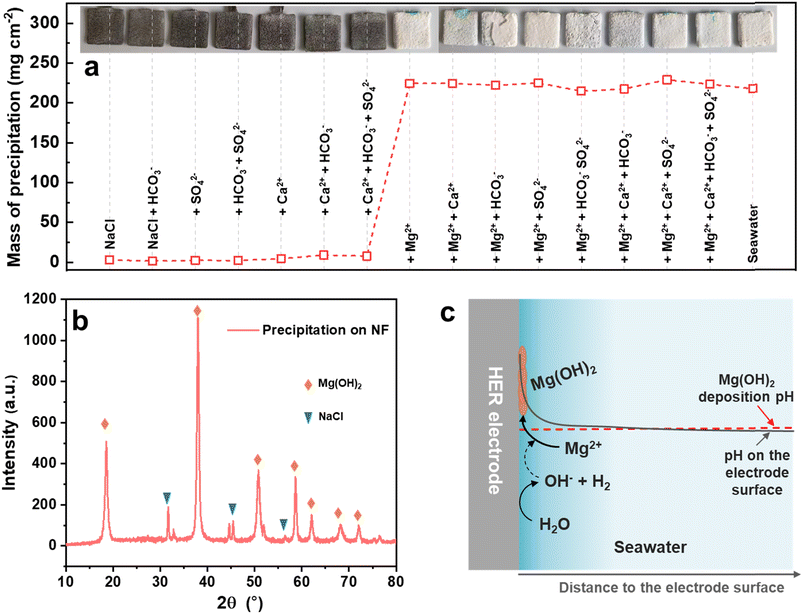
To understand which ion in seawater led to the precipitation, the seawater-related Mg2+, Ca2+, SO42− and HCO3− ions were separated. As shown in Fig. 1a, the NF-based HER electrodes were measured in 3.5% NaCl without or with the different ions at the same concentration in seawater under 1 mA cm−2 for 200 h. Distinctly, the precipitation was mainly caused by the Mg2+ ion and partly by the Ca2+ ion, because the precipitation mass on the electrode surface suddenly increased from 1.4–9.0 mg cm−2 to 215–229 mg cm−2 when the electrolytes contained Mg2+ ions, and the HER electrodes were fully covered by a burly white precipitate. The main components of the precipitate on the electrode surface were Mg(OH)2 and adsorbed NaCl, as identified by XRD (Fig. 1b). It is speculated that the pH on the seawater HER electrode surface would increase rapidly at the beginning of HER operation, as schematically illustrated in Fig. 1c, which was much higher than the pH of Mg(OH)2 deposition.32,33 Therefore, the Mg2+ ions in seawater would preferentially deposit on the surface of the HER electrode, and then the Mg(OH)2 precipitate on the electrode would act as deposition sites for the newly formed Mg(OH)2.26 As a result, the seawater HER electrode would be covered with Mg(OH)2-based precipitate.Synthesis and characterization of the Ni(OH)2 membrane
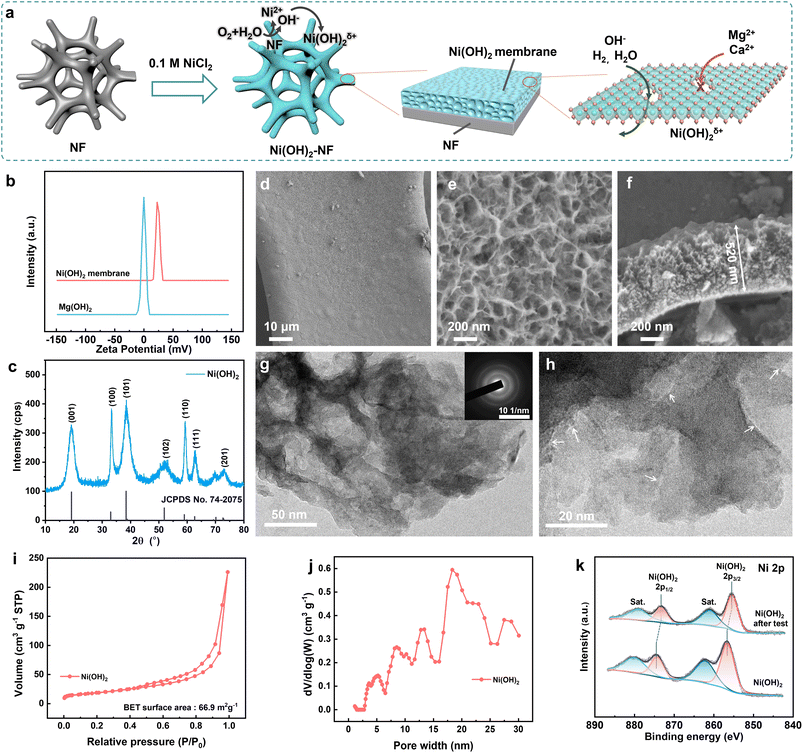
To solve the precipitation on a direct seawater HER electrode, an Ni(OH)2 membrane was in situ synthesized on NF (1 cm × 2 cm) via a simple soaking process in 0.1 M NiCl2 for 3 days at 25 ± 1 °C, as schematically illustrated in Fig. 2a. During the soaking period, the NF was etched by the dissolved oxygen and Cl−, and then the generated OH− reacted with the excess Ni2+ to generate a positively charged Ni(OH)2 membrane (ζ = +23.8 mV in 1 mM NaOH, Fig. 2b) on the NF surface. Due to the positive charge, the Ni(OH)2 membrane can hinder the passage of Mg2+ and Ca2+ ions through the membrane from the electrolyte to the NF surface, as will be discussed in detail below.As disclosed in Fig. 2c, the diffraction peaks appearing at 19.3°, 33.1°, 38.5°, and 52.1° were assigned to the characteristic (001), (100), (101) and (102) facets for Ni(OH)2 (JCPDS no. 74-2075), respectively. It is noteworthy that the c-axis-related diffraction peaks were broadened due to the disordered and expanded Ni(OH)2 layers. The higher redox peak current of Ni(II) to Ni(III) for the Ni(OH)2–NF electrode compared to the NF electrode further verified that the NF surface was covered with Ni(OH)2 (Fig. S1†). The morphology of the Ni(OH)2 membrane on NF was studied with field emission scanning electron microscopy (SEM). As shown in Fig. 2d, Ni(OH)2 was uniformly coated around the 3D NF surface to form the membrane. The surface of the Ni(OH)2 membrane was formed by continuous scarf-like Ni(OH)2 sheets with rugged pores (Fig. 2e). In the membrane matrix, with a thickness of ∼520 nm (Fig. 2f), the rugged pores were completely filled with amorphous Ni(OH)2. Therefore, the solutions must pass through the amorphous Ni(OH)2 sheets to cross over the membrane, but not through the pores. To obtain detailed structural information about the Ni(OH)2 membrane, a transmission electron microscopy (TEM) investigation was carried out. The TEM and selected area electron diffraction (SADE) results further verified the porous and amorphous structure of the Ni(OH)2 membrane (Fig. 2g). Under higher magnification (Fig. 2h), the crack-like defects were randomly distributed on the Ni(OH)2 sheets with a width of 0.4–2.0 nm and a length of 7.9–26.2 nm. The defects supply enough high-speed channels for the water and ions to cross over the Ni(OH)2 membrane, which will be discussed in detail via the simulation below.
Brunauer–Emmett–Teller (BET) analysis showed that the Ni(OH)2 membrane possessed a specific area of 66.9 m2 g−1 (Fig. 2i); the pore size was distributed over 2.5 nm and centred around 20 nm (Fig. 2j), which was in agreement with the TEM results. The surface chemical state of the Ni(OH)2 membrane was investigated with X-ray photoelectron spectroscopy (XPS). As revealed in Fig. S2,† the Ni(OH)2 membrane contained only Ni, O, and C elements. For the Ni 2p XPS spectra (Fig. 2k), the two spin–orbit doublet peaks at 856.4 and 874.3 eV with two shake-up satellites at 862.0 and 880.0 eV belong to Ni(OH)2. The absence of an Ni(0) binding energy peak in Fig. 2k further confirmed that the surface of NF was fully coated with the Ni(OH)2 membrane. The species of Ni(OH)2 was also demonstrated by the O 1s XPS spectra at a binding energy of 531.7 eV (Fig. S3†). Moreover, impurities of H2O and CO32− were found in the Ni(OH)2 membrane in the O 1s XPS spectra (the CO32− can also be confirmed by the C 1s XPS spectra, Fig. S4†). The impurity mass was calculated to be about 5.8% from the thermal gravimetric analysis (TGA, Fig. S5†) curves. In short, the positively-charged Ni(OH)2 membrane with nanometer-scale cracks was in situ uniformly coated on the 3D NF.
Anti-precipitation performance
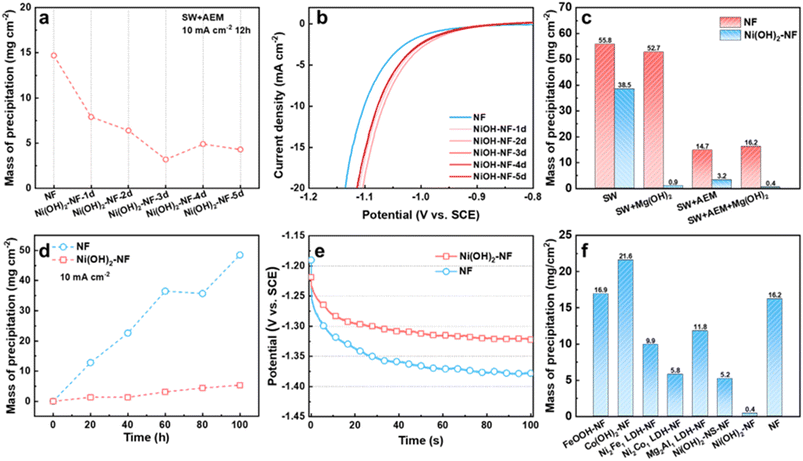
Firstly, we studied the precipitation mass influenced by the thickness of the Ni(OH)2 membrane on the NF electrode, which was controlled by soaking time. From 1 to 5 days (Fig. S6†), the thickness of the Ni(OH)2 membrane grew from ∼350 nm to ∼1010 nm, as detected by SEM. During the measurement, we found that the Ni flake, Ti mesh and graphite rod as counter electrode (CE) in seawater all suffered from corrosion and a chlorine evolution reaction. To avoid or reduce the effect of the CE on the working electrode (WE) as much as possible, we chose a pure Mg rod as the counter electrode. During the test, the Mg CE would be oxidized into Mg2+. When the WE was separated from the CE by AEM, the generated Mg2+ would not affect the WE. Without the AEM, the Mg2+ would diffuse to the WE cell to supplement the consumed Mg2+. Compared to an NF electrode, the Ni(OH)2–NF electrodes deposited less precipitation after 12 h of measurement at 10 mA cm−2 in seawater when the WE and CE were separated with AEM (marked as SW + AEM, Fig. 3a, S7 and S8†). Due to the lower precipitation, the Ni(OH)2–NF electrodes exhibited higher stability than the NF electrode (Fig. S9†). With increasing soaking time, the precipitation mass reached a minimum value of 3.2 mg cm−2 for the Ni(OH)2–NF-3d electrode. In detail, the porous precipitation of Mg/Ca-based hydroxide or carbonate with a thickness of 6.1 μm was evenly distributed on the surface of the Ni(OH)2 membrane (Fig. S2, S10–S12†). It is worth noting that the Mg and Ca elements were only distributed on the surface of the Ni(OH)2 membrane (Fig. S11†), indicating that the Ni(OH)2 membrane can hinder the transfer of Mg2+ and Ca2+ from seawater to the NF substrate. Moreover, the Ni(OH)2–NF electrodes displayed higher HER performance than NF because of the synergistic effect between Ni(OH)2 and NF to accelerate the Volmer step of HER.34,35 Therefore, the potential of Ni(OH)2–NF electrodes (−1.078 to −1.067 V vs. SCE, saturated calomel electrode) was more positive with 24 to 35 mV than that of the NF electrode (−1.102 V vs. SCE) at a current density of 10 mA cm−2 (Fig. 3b). The smaller Tafel slopes and RCT in EIS of the Ni(OH)2–NF electrodes also confirmed the higher HER activity for Ni(OH)2–NF electrodes (Fig. S13†). Just to be clear, the electrolyte pH kept rising from ∼8.1 to 12.8 during the measurement, so the SCE was better able to act as the reference electrode but not as a reversible hydrogen electrode (RHE).To further reduce the precipitation on the electrode surface, we then added Mg(OH)2 powder in seawater to obtain a saturated Mg(OH)2 seawater solution, denoted SW + Mg(OH)2. The Mg(OH)2 particles were expected to supply nucleation sites in seawater electrolyte for the newly formed Mg(OH)2, resulting in new Mg(OH)2 precipitate being deposited in the electrolyte but not on the HER electrode surface. As shown in Fig. 3c and S14,† the precipitation on the Ni(OH)2–NF electrode in SW + AEM (3.2 mg cm−2) obviously decreased after the addition of Mg(OH)2 in seawater (SW + Mg(OH)2 + AEM, 0.4 mg cm−2), but the effect on the NF electrode was insignificant. Additionally, the electrolytic cell without AEM was also investigated, in which case the working electrode chamber would be sustainingly supplied with Mg2+ ions from the counter electrode during the measurement. As a result, in seawater, the precipitation mass for the Ni(OH)2–NF electrode increased significantly from 3.2 to 38.5 mg cm−2, but only increased slightly from 0.4 to 0.9 mg cm−2 in SW + Mg(OH)2 (Fig. 3c). It was demonstrated that the Ni(OH)2 membrane assisted by saturated Mg(OH)2 in seawater can dramatically reduce the precipitation on the HER surface, and the reduction in mass percentage reached 98.3%. Therefore, the lower precipitation on the electrode brought about higher stability for the Ni(OH)2–NF electrode (Fig. S15†).
We then evaluated the stability of the Ni(OH)2 membrane by prolonging the test time. As demonstrated in Fig. 3d and S16,† the NF and Ni(OH)2–NF electrodes were measured under SW + Mg(OH)2 + AEM conditions every 20 h to obtain the precipitation mass over a total time of 100 h. The precipitation mass of the Ni(OH)2–NF electrode was much lower than that of NF over the whole test time. At the time of 100 h, the precipitation mass of the Ni(OH)2–NF electrode was 5.3 mg cm−2, which was only 10.9% that of the NF electrode (48.5 mg cm−2). Due to the accumulation of precipitation, the NF electrode exhibited poor stability with an increased overpotential of 56 mV compared to the Ni(OH)2–NF electrode at the measurement time of 100 h for the continuous test (Fig. 3e).
Finally, we also tried to obtain other hydroxide membranes decorated on NF with the same fabrication conditions as the Ni(OH)2 membrane, such as FeOOH–NF, Co(OH)2–NF, Ni2Fe1 LDH–NF, Ni2Co1 LDH–NF, and Mg2Al1 LDH–NF electrodes. For these electrodes, only the Ni2Co1 LDH/NF electrode formed an Ni(OH)2-membrane-like structure (Fig. S17†), which exhibited higher anti-precipitation performance than the other electrodes, but much lower than that of the Ni(OH)2–NF electrode under SW + Mg(OH)2 + AEM conditions (Fig. 3f, S18†). When the Ni(OH)2 membrane was changed to nanosheets, such as an Ni(OH)2-NS-NF electrode, it displayed similar anti-precipitation performance to the Ni2Co1 LDH–NF electrode. This indicated that the excellent anti-precipitation performance of the Ni(OH)2–NF electrode arose from the special structure of the Ni(OH)2 membrane. Moreover, these hydroxide membranes would reduce the HER performance of NF, or display lower HER performance than that of the Ni(OH)2–NF electrode (Fig. S19†).
Anti-precipitation mechanism
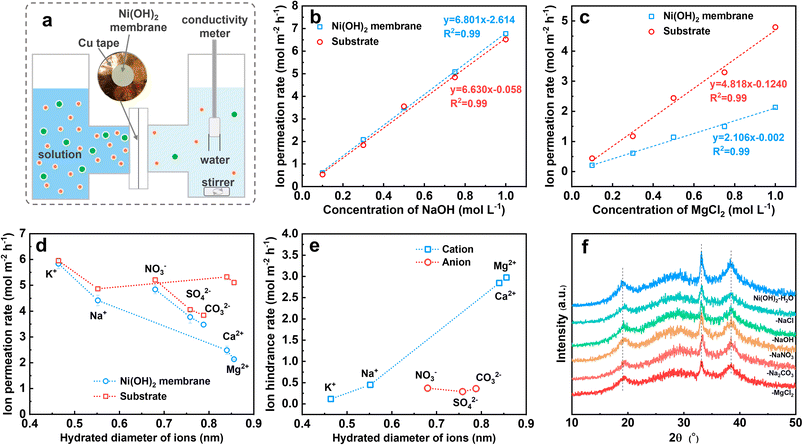
As described above, the Ni(OH)2 membrane reduces the precipitation by hindering the transfer of Mg2+ from the electrolyte to the electrode surface. To understand the mechanism, we quantified the transfer rate of Mg2+ and compared it with the other ions. For the Ni(OH)2 membrane on NF it was difficult to obtain the mass transfer rate of Mg2+, so we fabricated numerous Ni(OH)2–NF electrodes and treated them with ultrasound to obtain an Ni(OH)2 membrane turbid liquid. Via a vacuum filtration method,36 an Ni(OH)2 membrane with a thickness of 1.4 μm on a nylon filter membrane was prepared (Fig. S20†).The Ni(OH)2 membrane was then sealed with a 2 cm2 opening in copper tape, and clamped in the test setup (Fig. 4a and S21†). Prior to the conductivity test, the relationship between conductivity (σ) and concentration (c) was determined for NaOH, NaCl, KCl, CaCl2, MgCl2, NaNO3, Na2CO3, and Na2SO4 solutions, which was log(σ) = a + log(c) (Fig. S22†). Then the conductivity change with time was measured for different concentrations of NaOH and MgCl2 solutions (Fig. S23†). Finally, the ion permeation rate through the nylon membrane (substrate) and the Ni(OH)2-membrane-coated substrate was obtained. As shown in Fig. 4b, the ion permeation rate of the NaOH solution increased linearly with concentration for both substrate and Ni(OH)2-membrane-coated substrate, and the slopes for these two lines were very close. This suggested that the NaOH passed through the Ni(OH)2 membrane almost without resistance, as the ion difference values of the permeation rates between the Ni(OH)2-membrane-coated substrate and the substrate were the ion hindrance rates in the Ni(OH)2 membrane. However, for MgCl2 solution (Fig. 4c), the linear slope of the Ni(OH)2-membrane-coated substrate was much lower than that of the substrate, indicating the obvious resistance for MgCl2 to pass through the Ni(OH)2 membrane. The other solutions were measured at a concentration of 1 M using the same method (Fig. S24†), and the ion permeation rates for the K+, Na+, Ca2+, Mg2+, NO3−, SO42− and CO32− passing through the substrate and Ni(OH)2-membrane-coated substrate were calculated. As listed in Fig. 4d, the cation permeation rates decreased with increasing hydrated diameter when passing through the Ni(OH)2-membrane-coated substrate, but with slight change through the substrate. For anions, the permeation rates decreased with the increasing hydrated diameter both in the substrate and in the Ni(OH)2-membrane-coated substrate. The difference in values of the ion permeation rates between the Ni(OH)2 membrane-coated substrate and the substrate is the ion hindrance rate, which represents the ion transfer rate in the Ni(OH)2 membrane. As displayed in Fig. 4e, the ion hindrance rates of Mg2+ and Ca2+ (2.97 and 2.84 mol m−2 h−1) were much higher than those of Na+ and K+ (0.45 and 0.12 mol m−2 h−1), which increased with the hydrated ion diameter. However, NO3−, SO42− and CO32− exhibited similar hindrance rates (0.29–0.37 mol m−2 h−1), which were close to that of Na+. The ion hindrance feature of the Ni(OH)2 membrane, strong resistance for high-valence ions (Mg2+ and Ca2+) but weak resistance for low-valence ions (K+ and Na+) and reverse ions (NO3−, SO42− and CO32−), is consistent with the nanofiltration membrane.
The interlayer distance of the Ni(OH)2 nanosheets was about 0.46 nm as calculated with the Bragg equation, even though the atom size was ignored, which was smaller than the hydrated diameters of the ions as described before, especially for the anions of NO3−, SO42− and CO32−. The narrow interlayer distance would result in strong resistance to the transfer of the anions. If the interlayering of Ni(OH)2 nanosheets could transfer the ions rapidly, the interlayer distance should be expanded by ions such as GO or α-Ni(OH)2, which could be obviously detected by XRD.37–39 However, as shown in Fig. 4f, the position and width of the XRD diffraction peaks of the Ni(OH)2 membrane were unchanged even though the Ni(OH)2 membrane had been immersed in H2O solution with 1 M of NaCl, NaOH, NaNO3, Na2CO3 and MgCl2 for over one month. This suggested that no or only a very small amount of water or ions could be inserted in the layer space for the Ni(OH)2 sheets. Therefore, it is very difficult for the ions to pass through the Ni(OH)2 membrane via the interlayer of Ni(OH)2 sheets, which is in accord with reports.40–43 For the nanometer-scale cracks in Fig. 2i, the size of cracks with a width of 0.4–2.0 nm was larger than the hydrated diameters of the ions, which ensured high permeation for all the tested ions.44 However, the high-value cations of Mg2+ and Ca2+ encountered obviously higher resistance than anions with a similar hydrated diameter, which might be hindered by electrostatic repulsion due to the positively charged Ni(OH)2 membrane.
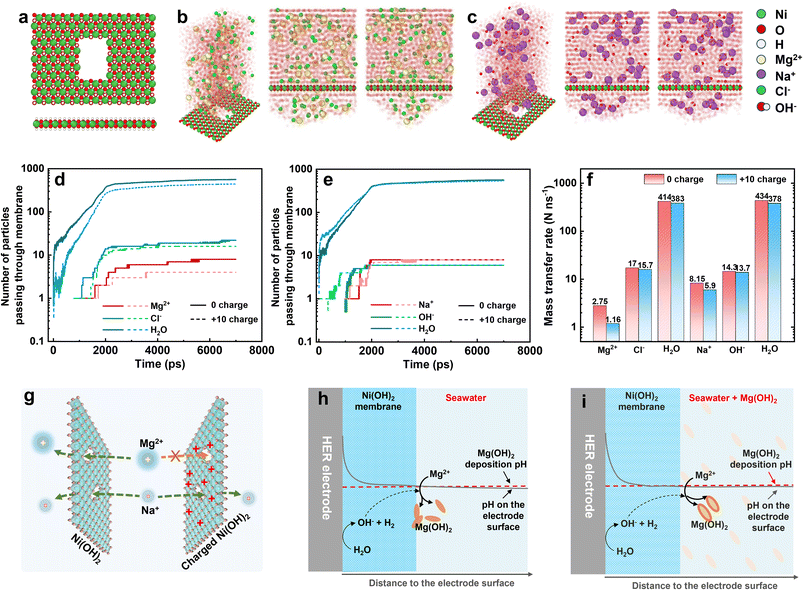
In light of the molecular dynamics simulation, we investigated the ion transfer rate as the ions passed through the Ni(OH)2 membrane and were affected by the positive charge. The optimized model of a monolayer Ni(OH)2 sheet with an opening of 3 × 5 Ni atoms is displayed in Fig. 5a. To simulate the transfer rate of Mg2+, Na+, Cl−, OH− and H2O, and to avoid the deposition interference between Mg2+ and OH−, the simulation was divided into MgCl2 and NaOH solution systems, as shown in Fig. 5b and c. The MgCl2 and NaOH solution was up to the Ni(OH)2 sheet at 300 K and 1 atm and bounded with a simulation box. At the top of the MgCl2 and NaOH solution, a transparent wall with 1 atm pressure drove the solution to pass through the opening on the Ni(OH)2 sheet (Fig. S25 and S26†). The number of ions and water molecules that passed was counted by the LAMMPS software package and recorded in Fig. 5d and e, including the 0-charged and +10-charged Ni(OH)2 models. Apart from Mg2+, the number of other ions and water molecules passing through the Ni(OH)2 sheet with or without positive charge was unchanged or changed insignificantly. According to the slope, the number of ions or water molecules passing through the Ni(OH)2 sheet with increasing time, the mass transfer rate was calculated as shown in Fig. 5f. When the Ni(OH)2 sheet was positively charged, the mass transfer rate of Mg2+ dropped by 57.8% from 2.75 to 1.16 no. ns−1, while Na+ dropped by only 27.6% from 8.15 to 5.90 no. ns−1. The anions of Cl− and OH− and the water molecules were almost unchanged. This suggested that the positive charge on the Ni(OH)2 sheet obviously changed the ion sieving behaviour, hindering high-valence cations with much stronger resistance than those of low-valence cations, anions and molecules.
Therefore, the positively charged Ni(OH)2 membrane can sieve out Mg2+ with higher efficiency. For the Ni(OH)2 membrane without charge, Mg2+ and Na+ can rapidly pass through the Ni(OH)2 nanosheet via the crack-like defects, but not through the interlayer between Ni(OH)2 layers (left-hand side of Fig. 5g). But for the Ni(OH)2 membrane with positive charge, the electrostatic repulsive force between Mg2+ ions and the Ni(OH)2 nanosheet would lower the transfer rate of Mg2+ ions, and evidently reduce the mass transfer rate of Mg2+ ions passing through the Ni(OH)2 membrane (right-hand side of Fig. 5g). This should illustrate that the higher mass transfer rate of water and Cl− was beneficial to passing a greater number of these than of Mg2+, Na+ or OH−. Therefore, normalizing the mass transfer rates to the number (percentage transfer rate) makes the comparison easier. As listed in Table S1,† the rank of ion transfer rate was OH− > Cl− > Na+ > Mg2+, which is associated with the ionic diffusion coefficient.45
Combining the anti-precipitation performance and ion transfer behaviour of the Ni(OH)2 membrane, the anti-precipitation mechanism of the Ni(OH)2–NF electrode is illustrated below. For the HER electrode with an Ni(OH)2 membrane in seawater (Fig. 5h), the pH on the surface would increase dramatically at the begin of HER process, but the Mg2+ could not pass through the Ni(OH)2 membrane to form the precipitate. With increasing time, the out-diffusion of OH− would raise the pH on the interface between the Ni(OH)2 membrane and seawater to reach the deposition pH, so the formed Mg(OH)2 would be deposited both on the Ni(OH)2 membrane and in seawater. Hence, in seawater, the Ni(OH)2 membrane could reduce the electrode precipitation, but the effect was slight.
When the seawater had saturated Mg(OH)2 added (Fig. 5i), the pH on the Ni(OH)2 membrane surface would reach the Mg(OH)2 deposition pH at the initial operation time. After operation, the seawater pH near the Ni(OH)2 membrane surface would soon be slightly higher than the Mg(OH)2 deposition pH to deposit Mg2+. Meanwhile, the saturated Mg(OH)2 particles in the seawater supplied abundant nucleation sites for the newly formed Mg(OH)2. Therefore, most of the Mg(OH)2 was deposited in the saturated Mg(OH)2 seawater, and only a little Mg(OH)2 was adsorbed on the Ni(OH)2 membrane surface. This is the mechanism whereby the Ni(OH)2–NF electrode exhibits excellent anti-precipitation performance in saturated Mg(OH)2 seawater. If the HER electrode without an Ni(OH)2 membrane was operated directly in saturated Mg(OH)2 seawater (Fig. S27†), the much higher pH on the electrode surface would also make it a faster nucleation site than that in seawater, which could not decrease the precipitation on the electrode surface.
Anti-precipitation membrane application
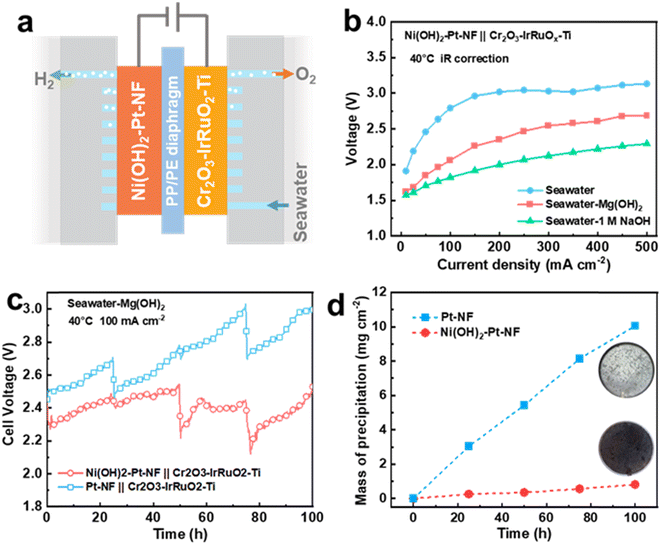
To broaden the application scope of the Ni(OH)2 membrane and enhance its seawater HER performance, we chose Pt-based Ni(OH)2–Pt–NF and Pt–NF electrodes to replace the Ni(OH)2–NF and NF electrodes. As displayed in Fig. S28,† the Pt nanoparticles were uniformly dispersed on the surface of NF for the Pt–NF electrode, and the covered Ni(OH)2 membrane exhibited similar structure and thickness to those of the Ni(OH)2–NF electrode. Due to the high activity of Pt, the Pt–NF and Ni(OH)2–Pt–NF electrodes as expected displayed obviously higher performance than that of the NF electrode (Fig. S29†). To further verify the anti-precipitation performance of the membrane-decorated electrode in application, we assembled a flow-type direct seawater electrolyser equipped with an Ni(OH)2–Pt–NF HER electrode and Cr2O3–IrRuO2–Ti OER electrode (Fig. 6a) with a working area of 10 cm2. Moreover, to lessen the trapped bulky Mg(OH)2 particles in the NF pores of the HER electrode, we chose a PP/PE porous membrane as a diaphragm, and the electrolyte was fed only into the anode side to filter the bulky particles. Due to the higher pH of SW + Mg(OH)2, the electrolyser in SW + Mg(OH)2 exhibited much higher performance than that in seawater (Fig. 6b). The cell voltage (with 75% iR compensation) at 40 °C of the electrolyser in SW + Mg(OH)2 was only 2.69 V at a current density of 500 mA cm−2, while it was over 3.1 V in seawater and 2.29 V in seawater with 1 M NaOH. For the 100 h stability test at a current density of 100 mA cm−2, the seawater electrolyser equipped with Ni(OH)2–Pt–NF and Pt–NF electrodes had a similar cell voltage close to 2.4 V at the beginning (Fig. 6c). With increasing time, the seawater electrolyser voltage of the Pt–NF electrode increased faster than that of the Ni(OH)2–Pt–NF electrode. For example, at a time of 100 h, the voltage reached 2.97 V for the Pt–NF-electrode-equipped seawater electrolyser, but it was only 2.48 V for the Ni(OH)2–Pt–NF electrode. That means the Ni(OH)2–Pt–NF electrode is much more stable than the Pt–NF electrode in seawater. Combined with the result in Fig. 3, the higher voltage of the Pt–NF-electrode-equipped seawater electrolyser was mainly caused by the greater precipitation on the electrode (Fig. 6d and S30†). At 100 h, the precipitation mass on the Ni(OH)2–Pt–NF electrode was 0.82 mg cm−2, which was only 8.1% that of the Pt–NF electrode (10.06 mg cm−2). Besides, the Ni(OH)2–Pt–NF electrode also exhibited higher anti-precipitation performance and stability than the Pt–NF electrode in a magnesium seawater battery (Fig. S31†). The results once again confirmed that an Ni(OH)2 membrane on the electrode can obviously decrease the electrode surface precipitation to enhance its stability.Conclusions
In summary, an Ni(OH)2 nanofiltration membrane in situ grown on a 3D NF-based electrode was fabricated at room temperature via a simple chemical soaking method. Simulations and experiments revealed that the positively charged Ni(OH)2 membrane with nanometer-scale cracks evidently hindered the transfer of Mg2+ and Ca2+, while rapidly transferring OH− and H2O. In seawater, the Ni(OH)2-membrane-decorated Ni(OH)2–NF HER cathode reduced the Mg2+-ion-induced precipitation on the electrode surface compared to the NF cathode. Due to the abundant nucleation sites from the added saturated Mg(OH)2 in seawater at the initial operation, the Ni(OH)2–NF cathode further dramatically reduced the precipitation by about 98.3%. Moreover, the Ni(OH)2–NF electrode exhibited slightly higher HER activity and stability than the NF electrode due to the rapid transfer of OH− and H2O, the synergistic effect between Ni(OH)2 and the Ni substrate, and the excellent anti-precipitation performance. In the application of a direct seawater electrolyser and MSWB, the Ni(OH)2–Pt–NF electrode also displayed high anti-precipitation performance and good stability for 100 h of measurement. We believe that this work highlights a potential strategy to solve HER electrode precipitation in seawater via an ingenious electrode structure design.Data availability
Data will be made available on request.Author contributions
Q. Liu: conceptualization, methodology, investigation, writing – original draft preparation, writing – review & editing, funding acquisition. Z. Yan: methodology, funding acquisition. J. Gao: methodology. H. Fan: methodology. M. Li: methodology. E. Wang: funding acquisition, project administration.Conflicts of interest
There are no conflicts to declare.Acknowledgements
The authors greatly acknowledge the financial support from the National Natural Science Foundation of China (22202203), the Strategic Priority Research Program of the Chinese Academy of Sciences (XDA 22010601), and the National Natural Science Foundation of China (grant no. 22005299). The authors would also like to thank Prof. Zhenbo Wang from the School of Chemistry and Chemical Engineering, Harbin Institute of Technology for help with the writing.References
- X. Li, C. Deng, Y. Kong, Q. Huo, L. Mi, J. Sun, J. Cao, J. Shao, X. Chen, W. Zhou, M. Lv, X. Chai, H. Yang, Q. Hu and C. He, Angew. Chem., Int. Ed., 2023, 62, e202309732 CrossRef CAS PubMed.
- X. Li, H. Zhang, Q. Hu, W. Zhou, J. Shao, X. Jiang, C. Feng, H. Yang and C. He, Angew. Chem., Int. Ed., 2023, 62, e202300478 CrossRef CAS PubMed.
- Q. Hu, K. Gao, X. Wang, H. Zheng, J. Cao, L. Mi, Q. Huo, H. Yang, J. Liu and C. He, Nat. Commun., 2022, 13, 3958 CrossRef CAS PubMed.
- J. Tang, X. Xu, T. Tang, Y. Zhong and Z. Shao, Small Methods, 2022, 6, 2201099 CrossRef CAS PubMed.
- M. S. Genc, M. Celik and I. Karasu, Renewable Sustainable Energy Rev., 2012, 16, 6631–6646 CrossRef CAS.
- M. Chatenet, B. G. Pollet, D. R. Dekel, F. Dionigi, J. Deseure, P. Millet, R. D. Braatz, M. Z. Bazant, M. Eikerling and I. Staffell, et al. , Chem. Soc. Rev., 2022, 51, 4583–4762 RSC.
- G. Calado and R. Castro, Appl. Sci., 2021, 11, 5561 CrossRef CAS.
- S. Dresp, F. Dionigi, M. Klingenhof and P. Strasser, ACS Energy Lett., 2019, 4, 933–942 CrossRef CAS.
- W. M. Tong, M. Forster, F. Dionigi, S. Dresp, R. S. Erami, P. Strasser, A. J. Cowan and P. Farras, Nat. Energy, 2020, 5, 367–377 CrossRef CAS.
- Y. Kuang, M. J. Kenney, Y. T. Meng, W. H. Hung, Y. J. Liu, J. E. Huang, R. Prasanna, P. S. Li, Y. P. Li and L. Wang, et al. , Proc. Natl. Acad. Sci. U. S. A., 2019, 116, 6624–6629 CrossRef CAS PubMed.
- S. Bolar, S. Shit, N. Chandra Murmu and T. Kuila, Sustainable Energy Fuels, 2021, 5, 5915–5945 RSC.
- S. Khatun, H. Hirani and P. Roy, J. Mater. Chem. A, 2021, 9, 74–86 RSC.
- D. W. Kirk and A. E. Ledas, Int. J. Hydrogen Energy, 1982, 7, 925–932 CrossRef CAS.
- J. H. Han, ChemSusChem, 2022, 15, e202200372 CrossRef CAS PubMed.
- X. Y. Lu, J. Pan, E. Lovell, T. H. Tan, Y. H. Ng and R. Amal, Energy Environ. Sci., 2018, 11, 1898–1910 RSC.
- Z. T. Li, X. T. Xu, X. R. Sheng, P. Lin, J. Tang, L. K. Pan, Y. V. Kaneti, T. Yang and Y. Yamauchi, ACS Nano, 2021, 15, 12535–12566 CrossRef CAS PubMed.
- U. G. M. Ekanayake, D. H. Seo, K. Faershteyn, A. P. O'Mullane, H. Shon, J. MacLeod, D. Golberg and K. Ostrikov, Sustainable Mater. Technol., 2020, 25, e00181 CrossRef CAS.
- J. H. Han, Ind. Eng. Chem. Res., 2022, 61, 9165–9170 CrossRef CAS.
- P. Srimuk, X. Su, J. Yoon, D. Aurbach and V. Presser, Nat. Rev. Mater., 2020, 5, 517–538 CrossRef CAS.
- E. Jwa, N. Jeong, J. Y. Nam and J. I. Han, Water Res., 2022, 220, 118681 CrossRef CAS PubMed.
- Q. F. Liu, Z. Yan, E. D. Wang, S. L. Wang and G. Q. Sun, Int. J. Hydrogen Energy, 2017, 42, 23045–23053 CrossRef CAS.
- I. W. P. Chen, C. H. Hsiao, J. Y. Huang, Y. H. Peng and C. Y. Chang, ACS Appl. Mater. Interfaces, 2019, 11, 14159–14165 CrossRef CAS PubMed.
- W. L. Yu, Z. Chen, Y. L. Fu, W. P. Xiao, B. Dong, Y. M. Chai, Z. X. Wu and L. Wang, Adv. Funct. Mater., 2022, 33, 2210855 CrossRef.
- J. H. Han, E. Jwa, H. Lee, E. J. Kim, J. Y. Nam, K. S. Hwang, N. Jeong, J. Choi, H. Kim and Y. C. Jeung, et al. , Chem. Eng. J., 2022, 429, 132383 CrossRef CAS.
- Y. Li, L. Xie and T. Su, Carbon Manage., 2023, 14, 2202167 CrossRef.
- F. H. Adnan, S. Pontvianne, M. N. Pons and E. Mousset, Chem. Eng. J., 2022, 431, 133413 CrossRef CAS.
- O. Oloye and A. P. O'Mullane, ChemSusChem, 2021, 14, 1767–1775 CrossRef CAS PubMed.
- H. Shi, T. Wang, J. Liu, W. Chen, S. Li, J. Liang, S. Liu, X. Liu, Z. Cai, C. Wang, D. Su, Y. Huang, L. Elbaz and Q. Li, Nat. Commun., 2023, 14, 3934 CrossRef CAS PubMed.
- T. F. O'Brien, T. V. Bommaraju and F. Hine, Handbook of Chlor-Alkali Technology, Springer, 2005 Search PubMed.
- J. Guo, Y. Zheng, Z. Hu, C. Zheng, J. Mao, K. Du, M. Jaroniec, S. Z. Qiao and T. Ling, Nat. Energy, 2023, 8, 264–272 CAS.
- M. Mohammad and M. Kaukhab, J. Chem. Soc. Pak., 2011, 33, 166–170 CAS.
- I. Katsounaros, J. C. Meier, S. O. Klemm, A. A. Topalov, P. U. Biedermann, M. Auinger and K. J. J. Mayrhofer, Electrochem. Commun., 2011, 13, 634–637 CrossRef CAS.
- M. Auinger, I. Katsounaros, J. C. Meier, S. O. Klemm, P. U. Biedermann, A. A. Topalov, M. Rohwerder and K. J. Mayrhofer, Phys. Chem. Chem. Phys., 2011, 13, 16384–16394 RSC.
- N. Danilovic, R. Subbaraman, D. Strmcnik, K. C. Chang, A. P. Paulikas, V. R. Stamenkovic and N. M. Markovic, Angew. Chem., Int. Ed., 2012, 51, 12495–12498 CrossRef CAS PubMed.
- X. W. Yu, J. Zhao, L. R. Zheng, Y. Tong, M. Zhang, G. C. Xu, C. Li, J. Ma and G. Q. Shi, ACS Energy Lett., 2018, 3, 237–244 CrossRef CAS.
- H. Ang and L. Hong, J. Mater. Chem. A, 2017, 5, 20598–20602 RSC.
- Q. Yang, Y. Su, C. Chi, C. T. Cherian, K. Huang, V. G. Kravets, F. C. Wang, J. C. Zhang, A. Pratt and A. N. Grigorenko, et al. , Nat. Mater., 2017, 16, 1198–1202 CrossRef CAS PubMed.
- J. Abraham, K. S. Vasu, C. D. Williams, K. Gopinadhan, Y. Su, C. T. Cherian, J. Dix, E. Prestat, S. J. Haigh and I. V. Grigorieva, et al. , Nat. Nanotechnol., 2017, 12, 546–550 CrossRef CAS PubMed.
- D. S. Hall, D. J. Lockwood, C. Bock and B. R. MacDougall, Proc. R. Soc. A, 2015, 471, 20140792 CrossRef PubMed.
- Y. Qu, Q. G. Zhang, F. Soyekwo, R. S. Gao, R. X. Lv, C. X. Lin, M. M. Chen, A. M. Zhu and Q. L. Liu, Nanoscale, 2016, 8, 18428–18435 RSC.
- J. Hu, X. Tang, Q. Dai, Z. Liu, H. Zhang, A. Zheng, Z. Yuan and X. Li, Nat. Commun., 2021, 12, 3409 CrossRef CAS PubMed.
- L. Shi, Z. Ying, A. Xu and Y. Cheng, J. Phys. Chem. C, 2021, 125, 1240–1248 CrossRef CAS.
- P. Sun, R. Ma, X. Bai, K. Wang, H. Zhu and T. Sasaki, Sci. Adv., 2017, 3, e1602629 CrossRef PubMed.
- L. Wang, M. S. H. Boutilier, P. R. Kidambi, D. Jang, N. G. Hadjiconstantinou and R. Karnik, Nat. Nanotechnol., 2017, 12, 509–522 CrossRef CAS PubMed.
- W. M. Haynes, D. R. Lide and T. J. Bruno, CRC Handbook of Chemistry and Physics, CRC Press, 95th edn, 2014, pp. 1–2666 Search PubMed.
Footnote |
| † Electronic supplementary information (ESI) available. See DOI: https://doi.org/10.1039/d3sc04532c |
| This journal is © The Royal Society of Chemistry 2023 |

