
 Open Access Article
 This Open Access Article is licensed under a
 Creative Commons Attribution 3.0 Unported Licence
The temperature-dependence of host–guest binding thermodynamics: experimental and simulation studies†
Laura M.
Grimm‡
 *a,
Jeffry
Setiadi‡
b,
Boryslav
Tkachenko
c,
Peter R.
Schreiner
c,
Michael K.
Gilson
*b and
Frank
Biedermann
*a
*a,
Jeffry
Setiadi‡
b,
Boryslav
Tkachenko
c,
Peter R.
Schreiner
c,
Michael K.
Gilson
*b and
Frank
Biedermann
*a
aInstitute of Nanotechnology (INT), Karlsruhe Institute of Technology (KIT), Hermann-von-Helmholtz Platz 1, 76344 Eggenstein-Leopoldshafen, Germany. E-mail: laura.grimm@kit.edu; frank.biedermann@kit.edu
bSkaggs School of Pharmacy and Pharmaceutical Sciences, University of California, San Diego, 9255 Pharmacy Lane, La Jolla, CA 92093, USA. E-mail: mgilson@health.ucsd.edu
cInstitute of Organic Chemistry, Justus Liebig University Giessen, Heinrich-Buff-Ring 17, 35392 Giessen, Germany
First published on 13th October 2023
Abstract
The thermodynamic parameters of host–guest binding can be used to describe, understand, and predict molecular recognition events in aqueous systems. However, interpreting binding thermodynamics remains challenging, even for these relatively simple molecules, as they are determined by both direct and solvent-mediated host–guest interactions. In this contribution, we focus on the contributions of water to binding by studying binding thermodynamics, both experimentally and computationally, for a series of nearly rigid, electrically neutral host–guest systems and report the temperature-dependent thermodynamic binding contributions ΔGb(T), ΔHb(T), ΔSb(T), and ΔCp,b. Combining isothermal titration calorimetry (ITC) measurements with molecular dynamics (MD) simulations, we provide insight into the binding forces at play for the macrocyclic hosts cucurbit[n]uril (CBn, n = 7–8) and β-cyclodextrin (β-CD) with a range of guest molecules. We find consistently negative changes in heat capacity on binding (ΔCp,b) for all systems studied herein – as well as for literature host–guest systems – indicating increased enthalpic driving forces for binding at higher temperatures. We ascribe these trends to solvation effects, as the solvent properties of water deteriorate as temperature rises. Unlike the entropic and enthalpic contributions to binding, with their differing signs and magnitudes for the classical and non-classical hydrophobic effect, heat capacity changes appear to be a unifying and more general feature of host–guest complex formation in water. This work has implications for understanding protein–ligand interactions and other complex systems in aqueous environments.
Introduction
Understanding the principles of molecular interaction in aqueous solutions is crucial for biochemical and pharmacological research, as it provides a basis for the rational design of targeted compounds, including proteins and small molecule drugs.1–3 Water as a solvent has complex and non-intuitive features. It is challenging to distinguish its contributions to binding thermodynamics from direct solute–solute interactions.4–8 Studying simple systems with a limited number of atoms, such as aromatic systems like benzenes, can help address this issue.9,10 However, available experimental methods do not provide a detailed structural picture of the stacking geometries of aggregated aromatic molecules in water, and the heterogeneity of the aggregates cannot be assessed. Moreover, it is cumbersome to obtain all thermodynamic parameters – binding free energy ΔGb, binding enthalpy ΔHb, binding entropy ΔSb, and changes in heat capacity ΔCp,b experimentally, as the binding interactions are relatively weak, and isothermal titration calorimetry (ITC) cannot easily be applied to such systems. In contrast, processes involving biomolecules, such as the binding of small molecule ligands and drugs with proteins or nucleic acids, can routinely be measured and their binding and folding geometries are usually relatively well-defined, and often follow a two-state model.11,12 Frank and Evans' iceberg model of hydrophobic hydration led Kauzmann to postulate that an entropic driving force for intramolecular binding is generated by the liberation of structured surface water molecules around apolar peptide side chains during protein folding.13,14 However, the concept of entropy as the driving force for hydrophobic association via water liberation has never been unequivocally accepted, and the debate continues to this day.15,16 For instance, Ben-Naim17 and Baldwin18 expressed opposing views in their respective 2013 and 2014 articles on whether the association of non-polar solutes is driven in part by water contributions. Ben-Naim challenged the dominance of the hydrophobic effect and introduced the concept of hydrophilic effects as crucial factors in processes such as protein folding and protein–protein association.17,19,20 Conversely, Baldwin argued that the concept of dynamic hydration shells restores Kauzmann's explanation of how the hydrophobic factor drives protein folding.18,21,22 Such discrepancies may partly trace to the complexity of biomolecules and the number of counteracting effects in play when they bind or fold. For instance, the role of structured water molecules compared to “water reservoirs” and completely “dewetted” regions in the binding pockets or on the surface of biomacromolecules still requires further investigation despite the excellent contributions of many research groups, e.g., Berne,23,24 Whitesides,5,25 Diederich,4,26 Klebe,27,28 and Grzesiek.29Host–guest systems are more straightforward models for studying hydrophobic and non-covalent interactions because they are dramatically simpler than proteins and nucleic acids. They are also of practical interest in their own right, as they have applications as pharmaceutical excipients,30–33 toxin scavengers,34 building blocks for synthetic receptors and chemosensors,35,36 and components of self-healing and smart materials.37–41 Host–guest binding data are also used extensively to evaluate the accuracy of computational methods, notably in the SAMPL series of blinded prediction challenge.42–48 The empirical investigation of molecular studies and host–guest complexes has already led to suggested correlates and principles of binding affinity, such as the packing coefficient,49–51 the energetic cost of receptor organization,52–54 entropy,55–58 conformational freedom and effective molarities,59,60 multivalency,61–64 the molecular electrostatic potential surface,65 surface site interaction points (SSIP),66 the solvent cohesiveness,67–69 the Hofmeister and chaotropic effect,70–72 the solvent accessible surface area,73 differential cavitation energies,74 and the high-energy water release concept.75–78 Although such concepts are intuitive and help guide the design of improved host–guest pairs, they do not directly provide insight into the thermodynamics of binding and are not necessarily comprehensive or mutually exclusive.
A particularly powerful way to gain insight from host–guest binding is to combine experimental and computational approaches. For example, room-temperature ITC data and DFT-computed energy contributions revealed that dispersion energy and packing coefficients are not decisive factors in aqueous CBn·guest binding.79 Note, however, that implicit solvation models, such as COSMO, may introduce sizable errors in solvation contributions for these systems, as they may not be highly suited to describe solvents in the confined interior of a host molecule.79 Molecular dynamics (MD) simulations with explicit solvent consideration may be more useful in this regard. Thus, a combined experimental and simulation study explored the dewetting of host molecules with nonpolar cavities,80 and explicit solvent simulations were used to compute binding enthalpies of CBn·guest systems and dissect them into defined contributions, such as the changes in solute–solute, solute–water, and water–water interaction energies.81,82
The present study builds on these approaches by combining experiments (ITC) and MD simulations to study the physical chemistry of binding for a series of host–guest model systems selected for their rigidity and simplicity, in order to maximize the focus on the role of solvent in binding. We focus on two families of host molecules, cucurbit[n]urils (CBn) and cyclodextrins (CDs), examining a total of 16 host–guest pairs across a 50 K temperature range. Involving the temperature as a data dimension affords more information on solvation contributions, particularly for relatively rigid systems where the direct host–guest interactions are, to a first approximation, temperature-independent. The presented results provide new insight into the determinants of affinity and the role of solvent in binding.
Results and discussion
Experimental analysis
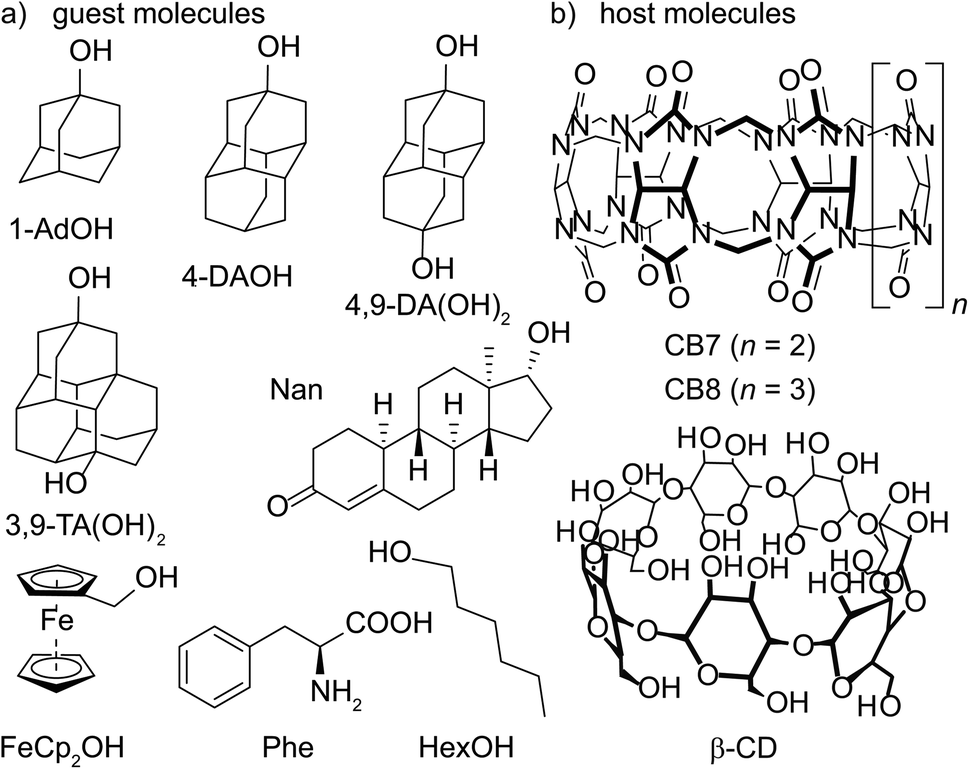 | ||
| Fig. 1 Chemical structures of water-soluble (a) guest molecules and (b) host molecules investigated in this study. | ||
| Guest | CB7 | CB8 | β-CD | |||||||||
|---|---|---|---|---|---|---|---|---|---|---|---|---|
| ΔGexp | ΔHexp | −TΔSexp | ΔCp,b | ΔGexp | ΔHexp | −TΔSexp | ΔCp,b | ΔGexp | ΔHexp | −TΔSexp | ΔCp,b | |
| 1-AdOH | −14.2 | −19.4 | 5.2 | −102 | −9.3 | −8.1 | −1.2 | −83 | −6.5 | −6.5 | 0.0 | −95 |
| 4-DAOH | −9.5 | −12.1 | 2.6 | −66 | −9.1 | −8.0 | −1.1 | −79 | ND | ND | ND | ND |
| 4,9-DA(OH)2 | −9.6 | −12.6 | 3.0 | −135 | −9.9 | −7.7 | −2.2 | −103 | −6.9 | −8.9 | 2.0 | −61 |
| 3,9-TA(OH)2 | NB | NB | NB | NB | −9.5 | −12.7 | 3.2 | −97 | ND | ND | ND | ND |
| FeCp2OH | −12.8 | −21.0 | 8.2 | −64 | −9.0 | −13.1 | 4.1 | −55 | −5.5 | −7.7 | 2.2 | −61 |
| Nan | −8.9 | −12.7 | 3.8 | −144 | −9.5 | −8.9 | −0.6 | −105 | ND | ND | ND | ND |
| L-Phe | −8.2 | −9.5 | 1.3 | −64 | ND | ND | ND | ND | ND | ND | ND | ND |
| HexOH | −8.0 | −9.6 | 1.6 | −89 | ND | ND | ND | ND | ND | ND | ND | ND |
Interestingly, the enthalpic contributions to binding are uniformly favorable at 298 K (Fig. S1,† and Table 1). Strong enthalpic contributions to complex formation (ΔH298 Kexp < −12 kcal mol−1) were found for the CB7·1-AdOH, CB7·4-DAOH, CB7·4,9-DA(OH)2, CB7·FeCp2OH, CB7·Nan as well as CB8·3,9-TA(OH)2 and CB8·FeCp2OH complexes. Particularly large enthalpic contributions of −19.4 kcal mol−1 and −21.0 kcal mol−1 were observed for CB7·1-AdOH and CB7·FeCp2OH, respectively, consistent with literature reports.84 The entropic contributions to binding are relatively small (−TΔS298 Kexp = −2.2 to 8.2 kcal mol−1) and, in most cases, unfavorable (Table 1, Fig. 2, and S1†). However, for CB8, a slightly favorable entropic contribution to binding is observed for several guests at 298 K. In contrast, for CB8·3,9-TA(OH)2 and CB8·FeCp2OH, modestly unfavorable binding entropy contributions were found.
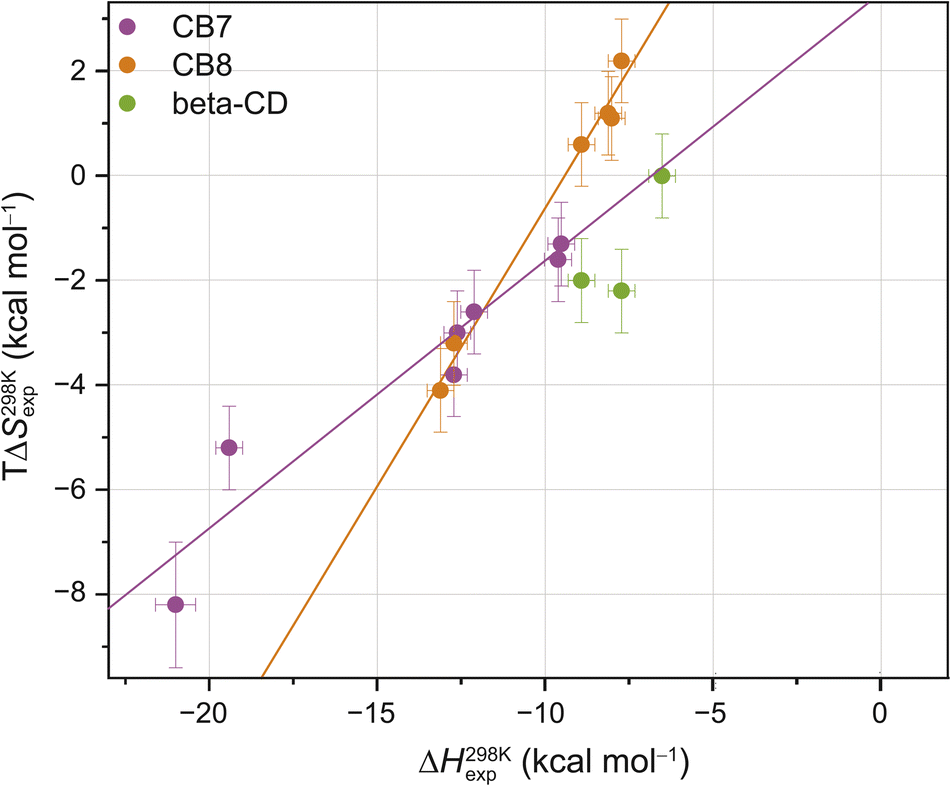 | ||
| Fig. 2 Enthalpy–entropy scatter plot for all investigated host–guest systems at 298 K. The straight lines correspond to linear least-square fits (CB7: slope = 0.50 ± 0.07, R2 = 0.91; CB8: slope = 1.05 ± 0.06, R2 = 0.99). Error bars show SD ± 0.5 kcal mol−1 for ΔH298 Kexp and SD ± 0.8 kcal mol−1 for TΔS298 Kexp. Typical errors (standard deviation across replicates, SD), determined by repeating the titrations at least three times, were smaller than 0.5 kcal mol−1 in ΔHexp and 0.8 kcal mol−1 in −TΔSexp. Based on our extensive experience with ITC studies over the years, we employed these error estimates as an upper bound. See ESI, Tables S1–S3† for the values (and https://zenodo.org for the values of each individual repetition) and Fig. S2† for reproducibility of the repetition experiments and SD thereof. | ||
These room temperature thermodynamic parameters indicate that counteracting effects are at play. For instance, while the binding free energy of 3,9-TA(OH)2 with CB8 is comparable to those of 1-AdOH, 4-DAOH, and 4,9-DA(OH)2, its enthalpic and entropic contributions are very different (Fig. S1†). As previously reported for host–guest68,84–87 and protein–ligand systems,88–91 we also see clear enthalpy–entropy compensation across systems at 298 K (R2(CB7) = 0.91 and R2(CB8) = 0.99, Fig. 2 and Table 2).
| Host·guest complex | ΔGb | ΔHb | −TΔSb | |||
|---|---|---|---|---|---|---|
| exp | calc | exp | calc | exp | calc | |
| CB7·1-AdOH | −14.2 | −23.1 | −19.4 | −25.9 | 5.2 | 2.8 |
| CB7·4,9-DA(OH)2 | −9.6 | −14.6 | −12.6 | −17.5 | 3.0 | 2.9 |
| CB8·1-AdOH | −9.3 | −15.2 | −8.1 | −10.0 | −1.2 | −5.2 |
| CB8·4,9-DA(OH)2 | −9.9 | −19.4 | −7.7 | −15.1 | −2.2 | −4.3 |
| β-CD·1-AdOH | −6.5 | −8.4 | −6.5 | −7.8 | 0.0 | −0.6 |
| β-CD·4,9-DA(OH)2 | −6.9 | −9.8 | −8.9 | −11.2 | 2.0 | 1.4 |
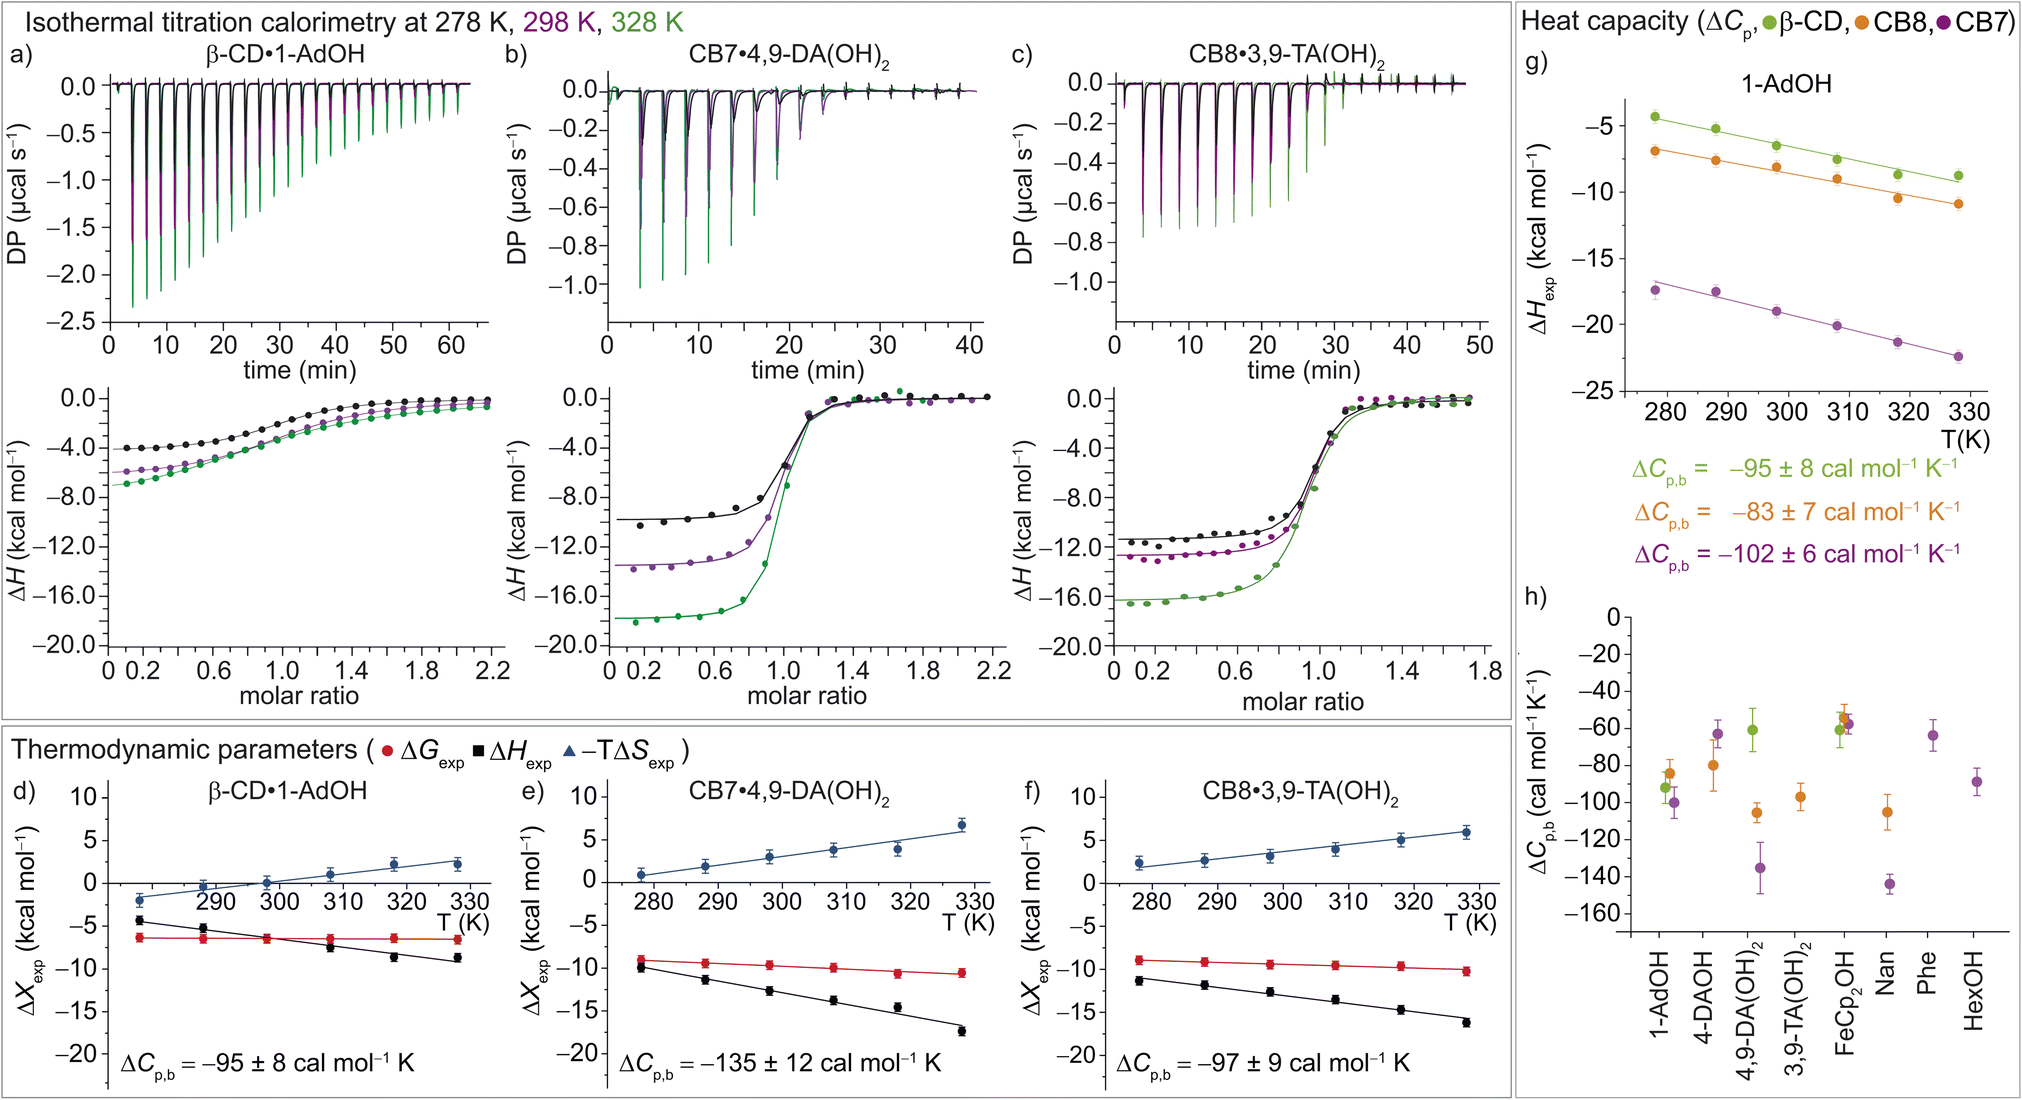 | ||
| Fig. 3 (a)–(c) ITC raw data and integrated heat plots for the complex formation of (a) β-CD·1-AdOH, (b) CB7·4,9-DA(OH)2, and (c) CB8·3,9-TA(OH)2 at 278 K (black), 298 K (violet), and 328 K (green). (d)–(f) Temperature dependence of the standard complexation parameters ΔGexp (red), ΔHexp (black), and −TΔSexp (blue) for (d) β-CD·1-AdOH, (e) CB7·4,9-DA(OH)2, and (f) CB8·3,9-TA(OH)2, from 278 to 328 K. Additionally, heat capacity changes (equal to the slope of the black ΔHexp data points) are given with individual errors. (g) Measured binding enthalpies as function of temperature for 1-AdOH with β-CD (green), with CB8 (orange), and with CB7 (violet). (h) Changes of heat capacity (ΔCp,b) for all 16 host–guest complexes. Shown errors are the individual error values of the linear least-square fits. See ESI, Tables S1–S3† for details. | ||
In accordance with the common observation of enthalpy–entropy compensation,92,93 large, compensating changes in the enthalpic and entropic contribution to the binding free energy were observed for each host–guest system across the investigated temperature range (Fig. 3d–f and S23–S25†). In particular, the value of ΔHexp becomes, on average, ∼0.75 kcal mol−1 more exothermic for each 10 K step, while for CB7·1-AdOH and CB8·Nan, each 10 K temperature increase caused an even larger increment of ∼1 kcal mol−1. As the free energy of binding was approximately constant with respect to temperature changes for these systems, there were compensating large changes in −TΔSexp with each change in temperature.
Simulation analysis
We used molecular dynamics (MD) simulations, computational calorimetry94 based on MD, and grid inhomogeneous solvation theory (GIST)95 to gain insight into the binding thermodynamics observed experimentally. The computational analysis focuses on the six host–guest systems formed by CB7, CB8, and β-CD and the two diamondoid guests that were studied experimentally with all three of the hosts, i.e., 1-AdOH and 4,9-DA(OH)2.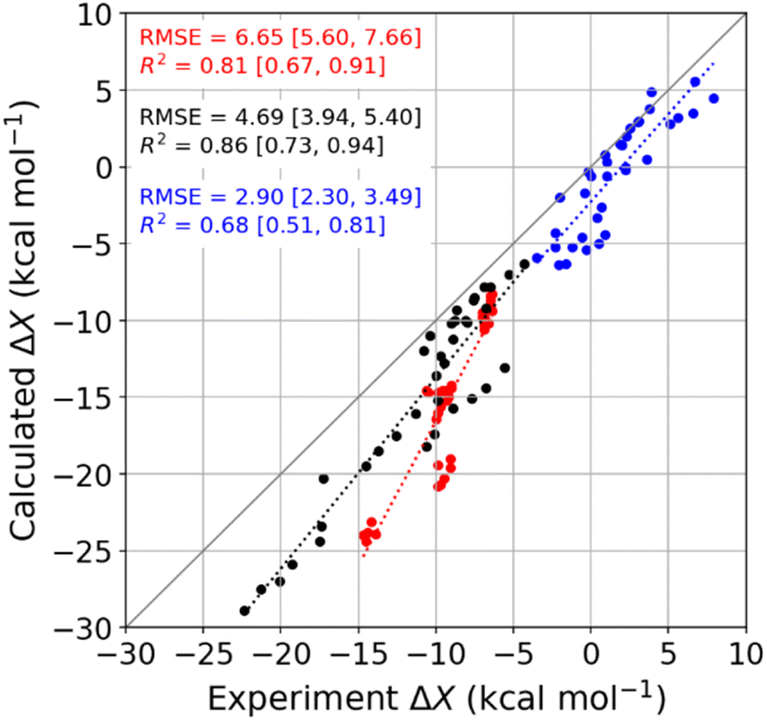 | ||
| Fig. 4 Comparison of MD-calculated thermodynamic quantities versus experimentally obtained values across the temperature range of 278 to 328 K. The thermodynamic quantities ΔGb, ΔHb, and −TΔSb are colored red, black, and blue, respectively. There are 36 data points for each thermodynamic quantity, and the error bars are omitted for clarity. See Table S9† for the corresponding numerical values and uncertainties. The root-mean-squared error (RMSE) and R2 values for each thermodynamic quantity are shown on the plot, and the values in square brackets give the 95% confidence interval obtained from bootstrapping. | ||
Given that the calculations are based on the appropriate statistical thermodynamic theory, that there is no ambiguity in the protonation states of the hosts or guests, and that these systems are straightforward to converge numerically, due to the simplicity of the molecules, these errors presumably trace to problems with the force field, and in particular to an imbalance between the interactions of the free molecules with solvent and the interactions of the bound molecules with each other. Such results support the value of using host–guest binding data to evaluate (see Introduction) and even train simulation force fields.96,97
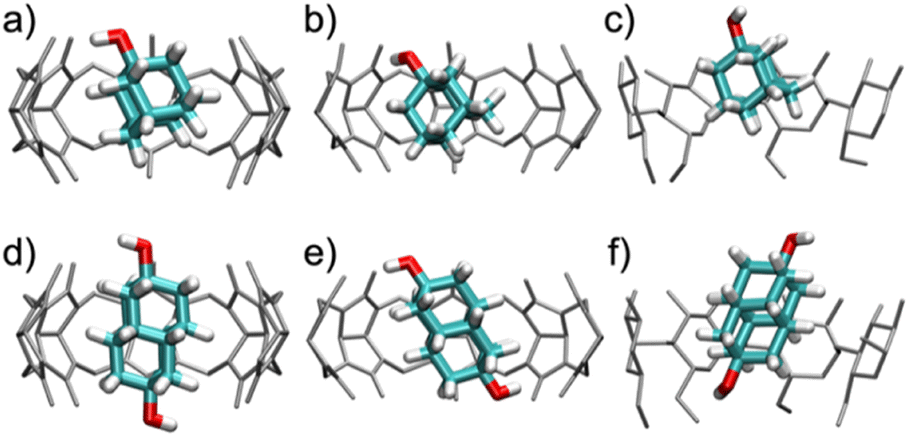 | ||
| Fig. 5 Snapshots of the characteristic binding geometries of (a) CB7·1-AdOH, (b) CB8·1-AdOH, (c) β-CD·1-AdOH, (d) CB7·4,9-DA(OH)2, (e) CB8·4,9-DA(OH)2, and (f) β-CD·4,9-DA(OH)2 observed in MD simulations at room temperature (298 K). Water molecules have been removed for clarity. | ||
When bound within CB7, the smaller guest, 1-AdOH, remains tilted by about 25° from the z-axis during the entire 1 μs simulation, with fluctuations of only about 10° (Fig. S31b†). This angle enables it to donate a hydrogen bond to a carbonyl oxygen at a single portal (Fig. 5a). In CB8, 1-AdOH again hydrogen bonds to the portal carbonyls (Fig. 5b), but the hydroxyl end of the guest flips rapidly between portals, donating first to one portal and then to the other (Fig. S31c†), as permitted by the larger cavity of CB8. In β-CD, 1-AdOH usually sits with its hydroxyl at the secondary face but occasionally flips briefly in the opposite orientation (Fig. S31d†). However, it does not typically form hydrogen bonds with the host's hydroxyl groups (Fig. 5c). When bound within CB7, the larger guest, 4,9-DA(OH)2, remains highly aligned with the z-axis (angled by only about 5°) and forms no hydrogen bonds with the host CB7 (Fig. 5d and S31f†). Apparently, the tight fit of this elongated guest inside the CB7 cavity prevents it from tilting enough to form hydrogen bonds with the host carbonyls. In contrast, the larger cavity of CB8 allows 4,9-DA(OH)2 to tilt by about 35° from the z-axis (Fig. 5e and S31g†) so that each of its hydroxyl groups donates a hydrogen bond to a carbonyl at its respective portal. These hydrogen bonds in CB8·4,9-DA(OH)2 break occasionally, but we did not observe the molecule flipping around the z-axis, presumably due to the lack of space in the cavity. In β-CD, 4,9-DA(OH)2 behaves much as in CB7: it remains rather well aligned with the z-axis, does not flip, and does not form hydrogen bonds with the host (Fig. 5f and S31h†). Again, this is likely due to the bulky and elongated shape of the guest.
The mean number of hydrogen bonds between the host and guest in the simulations does not correlate strongly with binding free energy: R2 is 0.53 for the computed free energies and only 0.25 for the experimentally measured free energies (graph not shown). However, better correlations are obtained when we account for all possible hydrogen bonds, i.e., host–guest, guest–water, host–water, and water–water hydrogen bonds (Fig. 6). The coefficients of determination (R2) with all hydrogen bonds included are 0.63 for the computed binding free energies and 0.48 for the measured binding free energies. We note that if we exclude the outlier, i.e., the complex CB7·1-AdOH, from the calculated and experimental data, the R2 increase to 0.85 and 0.96, respectively.
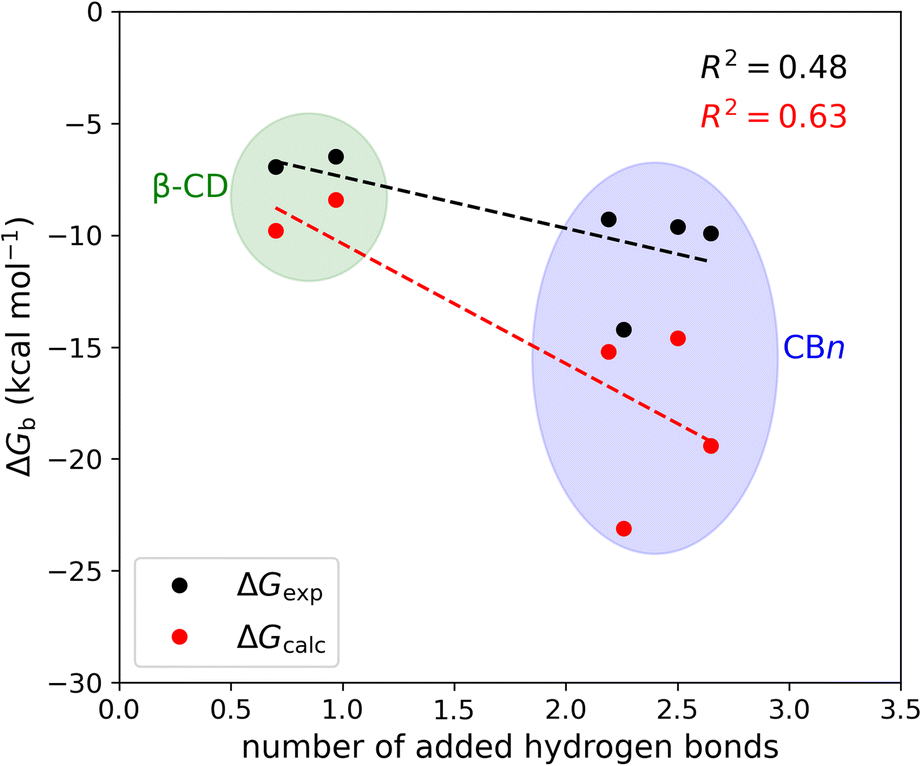 | ||
| Fig. 6 Binding free energy versus the number of added hydrogen bonds upon binding at 298 K. The number of added hydrogen bonds includes the change in host–guest, host–water, guest–water, and water–water hydrogen bonds upon binding. | ||
It is also worth noting that these correlations derive entirely from the differences between the β-CD results and the CBn results. The breakdown of the hydrogen bonds for all six host–guest complexes is summarized in Table 3. For instance, we observed one hydrogen bond formed between the host and guest upon binding for CB7·1-AdOH. This is accompanied by a reduction of one hydrogen bond each between water and the host and guest molecules. The loss of hydrogen bonds with the solutes is balanced by an increase of three hydrogen bonds to bulk water. Thus, the complex formation of CB7·1-AdOH produces a net gain of about two hydrogen bonds. At a coarse level, the more hydrogen bonds gained on binding over the entire solute–water system, the stronger the binding affinity. The linear regression of binding free energy against the number of hydrogen bonds formed (Fig. 6) yields −5.4 kcal mol−1 per hydrogen bond for the computed binding free energy and −2.6 kcal mol−1 per hydrogen bond for the experimental binding free energy. These are reasonable magnitudes for the strength of a hydrogen bond.6 It is noteworthy that amidst the myriad of other factors contributing to binding free energy, such as dispersion interactions and entropy, the hydrogen bond count has emerged as a clear correlate of affinity. Our findings resonate with the generalized hydrogen bonding concept for intermolecular recognition, as initially expounded by Hunter.65,98 As shown in Fig. 6 and Table 3, the total number of hydrogen bonds increases by ∼1 when the guests bind to β-CD and 2-3 for CBn. The smaller increases for β-CD trace chiefly to smaller increases in the number of water–water hydrogen bonds (Table 3).99 This may result from the fact that the free CBn contains collections of water molecules that lack a bulk-like complement of hydrogen bonds with other water molecules. In addition, the CBn cavity water molecules are only weakly hydrogen-bonded to the host. This explanation is qualitatively consistent with the concept that water molecules inside the free CBn are at a higher energy level (fewer hydrogen bonds) than bulk water.7,75,77
| Host·guest complex | H–G | H–W | G–W | W–W | Total | ΔNwat |
|---|---|---|---|---|---|---|
| a The guests expel more water from CB8 than CB7 due to the larger number of water molecules initially present in the CB8 cavity. Both the CB8 and CB7 cavities are essentially water-free following binding. | ||||||
| CB7·1-AdOH | 0.6 | −0.7 | −0.8 | 3.1 | 2.2 | 6.4 |
| CB7·4,9-DA(OH)2 | 0.0 | 0.0 | −0.1 | 2.6 | 2.5 | 6.4 |
| CB8·1-AdOH | 0.2 | −0.2 | −0.5 | 2.7 | 2.2 | 9.2a |
| CB8·4,9-DA(OH)2 | 1.2 | −1.2 | −1.5 | 4.2 | 2.7 | 10.3a |
| β-CD·1-AdOH | 0.1 | −0.4 | −0.5 | 1.8 | 1.0 | 7.2 |
| β-CD·4,9-DA(OH)2 | 0.0 | −1.0 | −0.2 | 1.8 | 0.6 | 7.7 |
One decomposition breaks down the binding enthalpy into two components that add to the total: ΔHcalc = ΔHH–G + ΔHdesolv. The first component, ΔHH–G, includes all energy terms that involve only the host and guest, namely their internal energies in the bound or complexed state and their interaction energy in the bound state. The second term, ΔHdesolv, includes all energy terms that involve water molecules, namely all host–water and guest–water interactions in the bound or complexed state and all water–water interactions. As shown in Table S10,† the binding enthalpies are strongly favored by the host–guest term, especially for the complexes where shape and size match are expected to be particularly favorable, while the desolvation term opposes binding, particularly for the larger 4,9-DA(OH)2 guest. It is instructive to compare the case of CB7 and 1-AdOH with that of β-CD and the same guest: CB7 achieves much more favorable binding enthalpy chiefly by providing more favorable host–guest energies, along with similar or less unfavorable desolvation energies. From this perspective, the binding of CB7 is more exothermic because of a similar or smaller desolvation penalty along with greater gains in solute energy. Note that the latter could result from favorable host–guest interactions and reorganization enthalpies that are small in magnitude.
The second decomposition breaks down the binding enthalpy into the various force field terms, notably the Lennard-Jones (LJ) treatment of van-der-Waals interactions, electrostatic interactions among the partial charges of the atoms, and so-called bonded or valence terms comprising bond stretches, angle-bends, and torsions. Decomposition of ΔHcalc at room temperature along these lines (Table S8†) shows that the LJ and electrostatic terms are favorable for all host–guest pairs, while the valence term tends to be smaller in magnitude and is usually unfavorable. The particularly favorable LJ interactions obtained in the case of CB7·1-AdOH presumably result from the snug fit of their bound complex. Given that hydrogen bonding is represented in General Amber Force Field (GAFF) primarily through the electrostatic term and that we observed a good correlation between the number of added hydrogen bonds and the binding free energy, it makes sense that the calculated binding free energy and the electrostatic part of the binding enthalpy correlate with R2 = 0.73. The computed binding free energy also correlates with the LJ part of the enthalpy, but not as well (R2 = 0.43).
It follows from the above that virtually all of the temperature dependency of the binding enthalpy comes from ΔHdesolv, as confirmed by the data in Table S10.† Intuitively, ΔHdesolv reports the energy cost of partly dehydrating (stripping water molecules from) the solutes when they bind. The present data thus mean that the enthalpic cost of stripping waters from the solutes on binding falls with increasing temperature. This makes sense because warmer water is less free to fall into low-energy configurations around the solutes, therefore, stripping them off upon binding is less energetically costly. Thus, warmer water leads to more enthalpically favorable binding if the host and guest energy contributions are largely temperature independent.
The observed more exothermic binding at higher temperatures explains why the changes in heat capacity on binding all are negative in sign (see heat capacity decomposition in Table S12†). Note that the same physical reasoning applies to the hydration of both polar and non-polar solutes. However, changes in the solutes' conformational distributions with temperature could lead to more complicated and less predictable outcomes for more flexible solutes and complexes.
We also observed that the computed entropy changes on binding are consistently less favorable with increasing temperature (Tables S9 and S10†). Although we did not attempt an entropy decomposition analogous to the enthalpy decomposition used above, the relative rigidity of the solutes and their complexes suggests that most of the temperature dependence of the binding entropy, similarly, derives from changes in the conformational distribution of water. This suggests, in turn, that raising the temperature leads to a greater increase in the entropy of water at the surfaces of the free host and guest than in bulk. As a consequence, release of the surface water on binding at high temperature becomes less entropically favorable (or more unfavorable) than release at low temperature. The resulting changes in −TΔScalc with temperature cancel, or compensate, roughly 70% of the corresponding changes in ΔHcalc, leading to modest increases in binding free energy (ΔGcalc more negative) with rising temperature.
We used grid inhomogeneous solvation theory (GIST) to spatially map the solvent's contributions to the computed changes in heat capacity ΔCp,b (Tables S11, S13, and Fig. S32†). We are not aware that such a spatial decomposition of ΔCp,b has been attempted previously. As shown in Table S11,† the GIST-calculated ΔCp,b agrees reasonably well with both the experiments and MD simulations. The GIST results do not include the solute–solute interactions, but this is a good approximation because ΔHH–G is essentially independent of temperature (Table S10†). The contours in Fig. S32† visually show that ΔCp,b is negative in the cavity region for all host–guest complexes, as water is expelled from this region upon binding. The portal region, however, shows negative and positive contours, which are attributable to solvent reorganization upon binding the guest molecule. The contours also show more differences in the portal region for CBn than for β-CD. To probe this further, we integrated the GIST voxels over two regions, inside and outside the cavity, ΔCp,cavity and ΔCp,portal, respectively, and list them in Table S13.† For all six host–guest complexes, ΔCp,cavity contributes more than ΔCp,portal to the total value. One also notices that ΔCp,cavity is larger (i.e., more negative) in β-CD than in CBn, but the opposite is true for ΔCp,portal. The quantity ΔCp,portal contributes very little to the total ΔCp,b in β-CD but is significant for CBn. The GIST decomposition thus suggests that solvent reorganization around the portal region of CBn, with their highly polar carbonyl oxygens, plays an important role in binding. In β-CD, the water molecules near the portals behave more bulk-like due to weaker interactions with the hydroxyls of CDs compared to the carbonyl oxygens in CBn.
Interpretations
The present experimental data show that the high affinities of CBn are attributable to highly favorable binding enthalpies along with, for the most part, only weakly unfavorable binding entropies. The computational results are in broad accordance with these observations. The binding entropies of the cyclodextrins are generally similar to those of CBn, and the weaker binding of cyclodextrins is attributable to their less favorable binding enthalpies. It is thus of particular interest to consider what may account for the high binding enthalpies of CBn. Indeed, it has been a long-standing riddle why CBn complexes, especially CB7 complexes, show much larger exothermic binding signatures than the corresponding cyclodextrin complexes, despite similar cavity dimensions.101–103 In 2012, we proposed that the release of energetically frustrated water from the binding cavities of the CBn upon binding might account for the outstanding affinities of these hosts.29,45 In particular, water molecules sequestered in a non-polar CBn cavity form fewer hydrogen bonds than water molecules in bulk. The release of these waters upon guest binding restores their hydrogen-bonding potential.77 According to the explanation model, the cavity water molecules inside the cyclodextrin cavities retain more interactions with the surrounding water and are partially hydrogen-bonded to the host, so they are more stable and gain fewer hydrogen bonds upon release. This view is at least partly consistent with observations made in the present study, e.g., the enthalpy gain upon host–guest complex formation that is accompanied by the release of cavity water molecules. Thus, we see larger increases in the total hydrogen bond count for CBn systems than for β-CD upon binding, and this difference is only fully apparent when water hydrogen bonds are accounted for. In addition, the changes in water–water interaction energy on binding are more favorable for CB7 than for β-CD with the same guests by about 5 kcal mol−1 (Table S10†). On the other hand, these advantages are largely balanced by other solvation components, such as a much greater loss of favorable guest–water interactions on binding to CB7 than to β-CD (Table S10†), so that the computed values of ΔHdesolv are not grossly different between CB7 and the similarly sized β-CD. The differences in computed binding enthalpy between these two hosts instead trace primarily to differences in direct host–guest interactions ΔHH–G (Table S10†), presumably, because the diamondoid guests fit more snugly in CB7 than in β-CD and form a more extensive array of attractive interactions. In other words, a direct comparison of the room temperature binding free energies, enthalpies, and entropies between host–guest complexes of cyclodextrins and cucurbit[n]urils may not be well suited to investigate the hydrophobic contributions to binding due to the largely different binding geometry and host–guest contact.
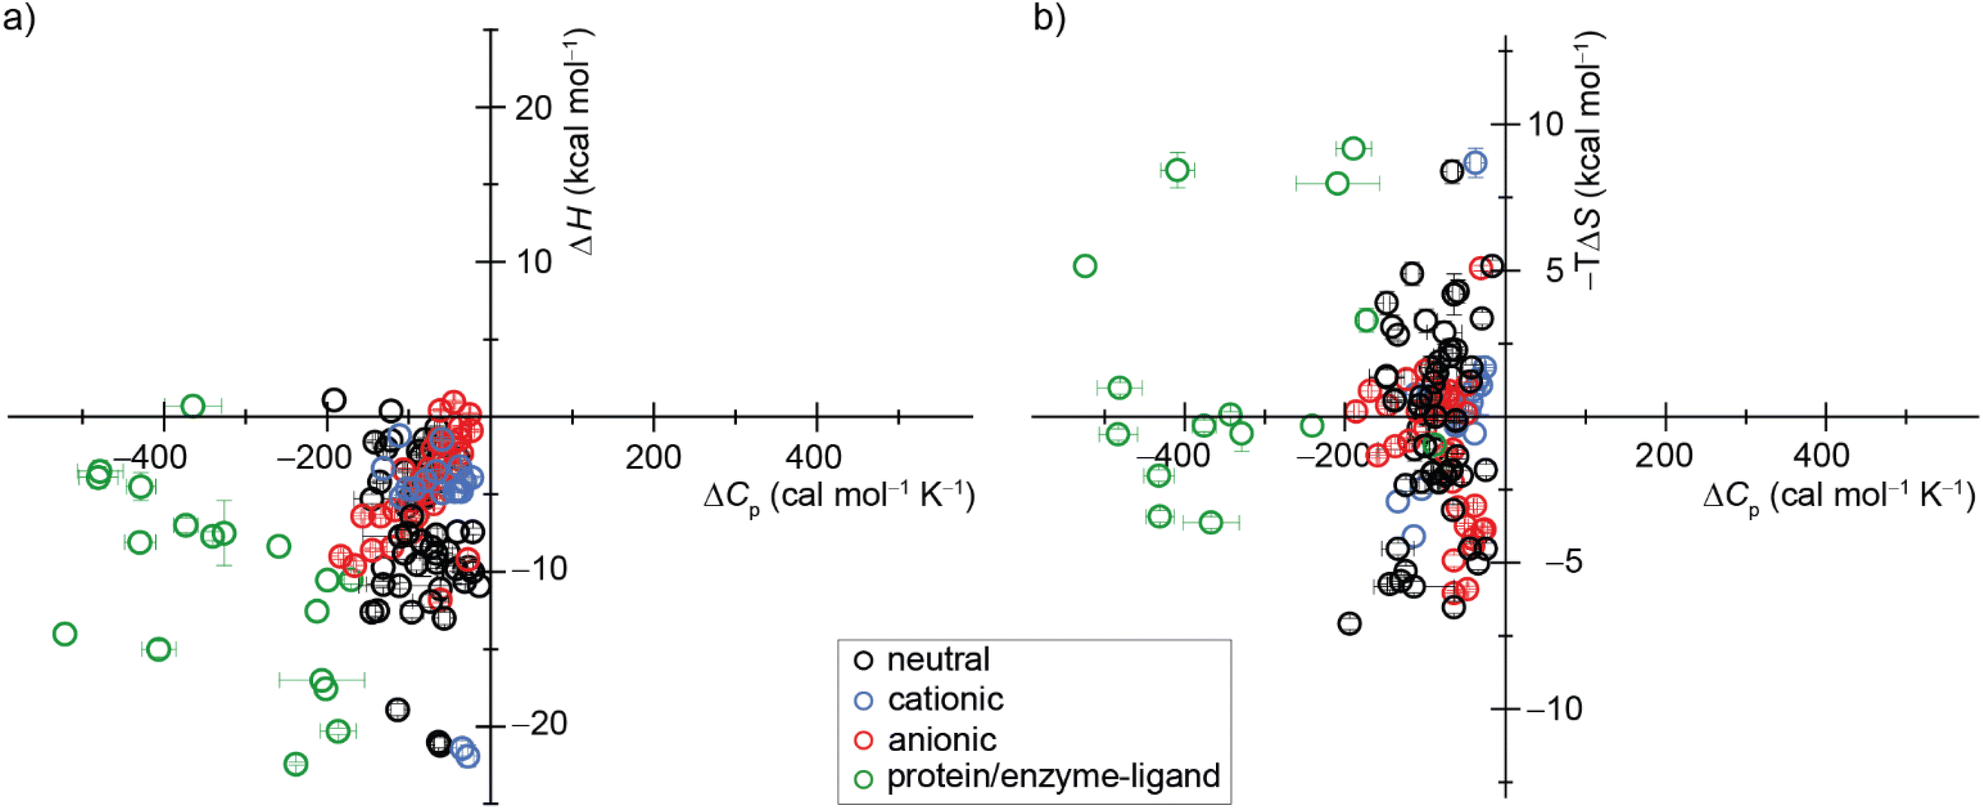 | ||
| Fig. 7 Display of a scatter plot between host–guest and protein–ligand (a) binding enthalpies (ΔHexp) and (b) binding entropies (−TΔSexp) versus heat capacity changes (ΔCp,b). See ESI, Tables S5 and S6 as well as Fig. S28† for details on the host–guest pairs, experimental conditions, exact values, and references. | ||
Our study offers a complementary perspective. We observe that increasing temperature consistently renders binding more enthalpically favorable, both experimentally and computationally, signifying a negative change in heat capacity upon binding. Moreover, virtually the entire change in heat capacity traces directly to the solvent, as indicated by the enthalpic decompositions (Tables S10 and S12†) and rationalized by the relative rigidity of these host–guest systems. We deduce that water becomes a less favorable solvent as the temperature rises, thereby imposing a diminished enthalpic penalty for binding. In addition, our GIST results indicate that the solute–water interface in the portal region of the macrocyclic host plays a more important role in binding for CBn than for β-CD, and the binding process does not depend solely on the desolvation of the cavity by the bound guest molecule. Naturally, discerning this pattern in studies involving more flexible host–guest systems and complex molecules, such as proteins, will be more challenging, given that alterations in the solute conformational distribution are expected to contribute substantially and perhaps unpredictably to the observed heat capacity changes upon binding.
Conclusions
The mechanistic interpretation of observed heat capacity changes for molecular associations, e.g., protein–ligand complexes, is a long-standing challenge. Due to the simplicity of the host–guest systems selected here, we were better able to dissect contributions from solvent effects and direct binding on ΔCp,b. Concretely, we experimentally and computationally investigated CBn and β-CD host–guest complexes with adamantane-, diamantane-, and triamantane-type guests in a temperature range from 278 to 328 K. Our findings revealed a substantial increase (up to 45%) in the enthalpic driving force for binding, corresponding to negative heat capacity changes (−55 to −144 cal mol−1 K−1). The favorable shifts in binding enthalpy with temperature were counterbalanced by compensatory changes in binding entropy, resulting in a nearly constant binding free energy as temperature increased. The computationally observed temperature independence of the direct host–guest interaction combined with GIST water map analysis enabled us to attribute the temperature dependencies to local solvation effects. We argue that as temperature rises, water becomes less favorable as a solvent from an enthalpic point of view, thereby reducing the enthalpic penalty associated with host and guest desolvation upon binding.This perspective accounts for the consistently negative changes in heat capacity of binding for cucurbit[n]urils and cyclodextrins and is expected to play a general role in molecular associations in water.
Data availability
All raw and processed data generated in this study, including data presented in the main manuscript and the ESI† file, have been deposited in the https://zenodo.org database (DOI: https://doi.org/10.5281/zenodo.7082003). Furthermore, binding parameters and chemical structures from this study are available on https://suprabank.org (DOI: https://doi.org/10.34804/supra.20220330425). In addition, the scripts used to prepare and analyze the computational studies are available at https://github.com/jeff231li/adamantanes-temperature-scripts.Author contributions
LMG: conceptualization, methods, validation, investigation, data curation, visualization, writing – original draft. JS: formal analysis, investigation, methods, software, validation, visualization, writing – review and editing. BT & PRS: isolation, functionalization, and characterization of diamondoid alcohols. MKG: conceptualization, funding acquisition, methodology, project administration, resources, supervision, writing – review and editing. FB: conceptualization, funding acquisition, methodology, project administration, resources, supervision, writing – original draft.Conflicts of interest
M. K. G. has an equity interest in and is a co-founder and scientific advisor of VeraChem LLC.Acknowledgements
L. M. G., P. R. S., and F. B. acknowledge the Deutsche Forschungsgemeinschaft (DFG grant BI-1805/2-1 and SCHR 597/28-2) for financial support through the priority program SPP 1807 “Control of Dispersion Interactions in Molecular Chemistry.” In addition, J. S. and M. K. G. acknowledge funding from the National Institute of General Medical Sciences (R01GM061300). These findings are solely of the authors and do not necessarily represent the views of the N. I. H.Notes and references
- S. E. Dalton and S. Campos, Chembiochem, 2020, 21, 1080–1100 CrossRef CAS PubMed.
- O. M. Salo-Ahen, I. Alanko, R. Bhadane, A. M. Bonvin, R. V. Honorato, S. Hossain, A. H. Juffer, A. Kabedev, M. Lahtela-Kakkonen and A. S. Larsen, Processes, 2020, 9, 71 CrossRef.
- E. Lionta, G. Spyrou, D. K. Vassilatis and Z. Cournia, Curr. Top. Med. Chem., 2014, 14, 1923–1938 CrossRef CAS PubMed.
- E. Persch, O. Dumele and F. Diederich, Angew. Chem., Int. Ed., 2015, 54, 3290–3327 CrossRef CAS PubMed.
- P. W. Snyder, M. R. Lockett, D. T. Moustakas and G. M. Whitesides, Eur. Phys. J.: Spec. Top., 2014, 223, 853–891 Search PubMed.
- F. Biedermann and H.-J. Schneider, Chem. Rev., 2016, 116, 5216–5300 CrossRef CAS PubMed.
- P. S. Cremer, A. H. Flood, B. C. Gibb and D. L. Mobley, Nat. Chem., 2018, 10, 8–16 CrossRef CAS PubMed.
- E. Brini, C. J. Fennell, M. Fernandez-Serra, B. Hribar-Lee, M. Lukšič and K. A. Dill, Chem. Rev., 2017, 117, 12385–12414 CrossRef CAS PubMed.
- L. V. Slipchenko and M. S. Gordon, J. Phys. Chem. A, 2009, 113, 2092–2102 CrossRef CAS PubMed.
- W. L. Jorgensen and D. L. Severance, J. Am. Chem. Soc., 1990, 112, 4768–4774 CrossRef CAS.
- K. Kuwajima, Biomolecules, 2020, 10, 407 CrossRef CAS PubMed.
- C.-J. Tsai, D. Xu and R. Nussinov, Folding Des., 1998, 3, R71–R80 CrossRef CAS PubMed.
- W. Kauzmann, in Advances in Protein Chemistry Volume 14, ed. C. B. Anfinsen, M. L. Anson, K. Bailey and J. T. Edsall, Academic Press, 1959, vol. 14, pp. 1–63 Search PubMed.
- H. S. Frank and M. W. Evans, Chem. Phys., 1945, 13, 507–532 CAS.
- Q. Sun, Molecules, 2022, 27, 7009 CrossRef CAS PubMed.
- T. P. Silverstein, ChemTexts, 2020, 6, 26 CrossRef.
- A. Ben-Naim, Int. J. Phys., 2013, 1, 66–71 Search PubMed.
- R. L. Baldwin, Proc. Natl. Acad. Sci. U.S.A., 2014, 111, 13052–13056 CrossRef CAS PubMed.
- A. Y. Ben-Naim, Hydrophobic Interactions, Springer Science & Business Media, 2012 Search PubMed.
- S. R. Durell, B. R. Brooks and A. Ben-Naim, J. Phys. Chem., 1994, 98, 2198–2202 CrossRef CAS.
- R. Baldwin and G. D. Rose, Proc. Natl. Acad. Sci. U.S.A., 2016, 113(44), 12462–12466 CrossRef CAS PubMed.
- R. L. Baldwin, Proc. Natl. Acad. Sci. U.S.A., 2012, 109, 7310–7313 CrossRef CAS PubMed.
- L. Wang, B. J. Berne and R. A. Friesner, Proc. Natl. Acad. Sci. U.S.A., 2011, 108, 1326–1330 CrossRef CAS PubMed.
- B. J. Berne, J. D. Weeks and R. Zhou, Annu. Rev. Phys. Chem., 2009, 60, 85–103 CrossRef CAS PubMed.
- P. W. Snyder, J. Mecinović, D. T. Moustakas, S. W. Thomas, M. Harder, E. T. Mack, M. R. Lockett, A. Héroux, W. Sherman and G. M. Whitesides, Proc. Natl. Acad. Sci. U.S.A., 2011, 108, 17889–17894 CrossRef CAS PubMed.
- M. Ellermann, R. Jakob-Roetne, C. Lerner, E. Borroni, D. Schlatter, D. Roth, A. Ehler, M. G. Rudolph and F. Diederich, Angew. Chem., Int. Ed., 2009, 48, 9092–9096 CrossRef CAS PubMed.
- A. Biela, M. Betz, A. Heine and G. Klebe, ChemMedChem, 2012, 7, 1423–1434 CrossRef CAS PubMed.
- J. Schiebel, R. Gaspari, T. Wulsdorf, K. Ngo, C. Sohn, T. E. Schrader, A. Cavalli, A. Ostermann, A. Heine and G. Klebe, Nat. Commun., 2018, 9, 3559 CrossRef PubMed.
- L. A. Abiko, R. Dias Teixeira, S. Engilberge, A. Grahl, T. Mühlethaler, T. Sharpe and S. Grzesiek, Nat. Chem., 2022, 14, 1133–1141 CrossRef CAS PubMed.
- A. S. Braegelman and M. J. Webber, Theranostics, 2019, 9, 3017 CrossRef CAS PubMed.
- T. Higashi, D. Iohara, K. Motoyama and H. Arima, Chem. Pharm. Bull., 2018, 66, 207–216 CrossRef CAS PubMed.
- S. M. Mantooth, B. G. Munoz-Robles and M. J. Webber, Macromol. Biosci., 2019, 19, 1800281 CrossRef PubMed.
- A. A. Karim, Q. Dou, Z. Li and X. J. Loh, Chem.–Asian J., 2016, 11, 1300–1321 CrossRef PubMed.
- C. Schneider, A. Bierwisch, M. Koller, F. Worek and S. Kubik, Angew. Chem., Int. Ed., 2016, 55, 12668–12672 CrossRef CAS PubMed.
- T. Ogoshi and T. A. Yamagishi, Eur. J. Org Chem., 2013, 2013, 2961–2975 CrossRef CAS.
- S. Li, H. Chen, X. Yang, D. Bardelang, I. W. Wyman, J. Wan, S. M. Lee and R. Wang, ACS Med. Chem. Lett., 2015, 6, 1174–1178 CrossRef CAS PubMed.
- M. Mohamadhoseini and Z. Mohamadnia, Coord. Chem. Rev., 2021, 432, 213711 CrossRef CAS.
- G. Sinawang, M. Osaki, Y. Takashima, H. Yamaguchi and A. Harada, Chem. Commun., 2020, 56, 4381–4395 RSC.
- Z. Wang, Y. Ren, Y. Zhu, L. Hao, Y. Chen, G. An, H. Wu, X. Shi and C. Mao, Angew. Chem., Int. Ed., 2018, 57, 9008–9012 CrossRef CAS PubMed.
- M. Zhang, D. Xu, X. Yan, J. Chen, S. Dong, B. Zheng and F. Huang, Angew. Chem., Int. Ed., 2012, 51, 7011–7015 CrossRef CAS PubMed.
- M. Nakahata, Y. Takashima and A. Harada, Macromol. Rapid Commun., 2016, 37, 86–92 CrossRef CAS PubMed.
- A. G. Skillman, J. Comput.-Aided Mol. Des., 2012, 26, 473–474 CrossRef CAS PubMed.
- H. S. Muddana, A. T. Fenley, D. L. Mobley and M. K. Gilson, J. Comput.-Aided Mol. Des., 2014, 28, 305–317 CrossRef CAS PubMed.
- A. Rizzi, S. Murkli, J. N. McNeill, W. Yao, M. Sullivan, M. K. Gilson, M. W. Chiu, L. Isaacs, B. C. Gibb, D. L. Mobley and J. D. Chodera, J. Comput.-Aided Mol. Des., 2018, 32, 937–963 CrossRef CAS PubMed.
- J. Yin, N. M. Henriksen, D. R. Slochower and M. K. Gilson, J. Comput.-Aided Mol. Des., 2017, 31, 133–145 CrossRef CAS PubMed.
- A. Rizzi, T. Jensen, D. R. Slochower, M. Aldeghi, V. Gapsys, D. Ntekoumes, S. Bosisio, M. Papadourakis, N. M. Henriksen, B. L. de Groot, Z. Cournia, A. Dickson, J. Michel, M. K. Gilson, M. R. Shirts, D. L. Mobley and J. D. Chodera, J. Comput.-Aided Mol. Des., 2020, 34, 601–633 CrossRef CAS PubMed.
- M. Amezcua, L. El Khoury and D. L. Mobley, J. Comput.-Aided Mol. Des., 2021, 35, 1–35 CrossRef CAS PubMed.
- M. Amezcua, J. Setiadi, Y. Ge and D. L. Mobley, J. Comput.-Aided Mol. Des., 2022, 36, 707–734 CrossRef CAS PubMed.
- W. M. Nau, M. Florea and K. I. Assaf, Isr. J. Chem., 2011, 51, 559–577 CrossRef CAS.
- T.-C. Lee, E. Kalenius, A. I. Lazar, K. I. Assaf, N. Kuhnert, C. H. Grün, J. Jänis, O. A. Scherman and W. M. Nau, Nat. Chem., 2013, 5, 376–382 CrossRef CAS PubMed.
- S. Mecozzi and J. J. Rebek, Chem.–Eur. J., 1998, 4, 1016–1022 CrossRef CAS.
- F. C. Parks, E. G. Sheetz, S. R. Stutsman, A. Lutolli, S. Debnath, K. Raghavachari and A. H. Flood, J. Am. Chem. Soc., 2022, 144, 1274–1287 CrossRef CAS PubMed.
- K. N. Houk, A. G. Leach, S. P. Kim and X. Zhang, Angew. Chem., Int. Ed., 2003, 42, 4872–4897 CrossRef CAS PubMed.
- C. L. D. Gibb and B. C. Gibb, J. Am. Chem. Soc., 2004, 126, 11408–11409 CrossRef CAS PubMed.
- M. S. Searle and D. H. Williams, J. Am. Chem. Soc., 1992, 114, 10690–10697 CrossRef CAS.
- M. Mammen, E. I. Shakhnovich and G. M. Whitesides, J. Org. Chem., 1998, 63, 3168–3175 CrossRef CAS.
- H. S. Ali, A. Chakravorty, J. Kalayan, S. P. de Visser and R. H. Henchman, J. Comput.-Aided Mol. Des., 2021, 35, 911–921 CrossRef CAS PubMed.
- W. Chen, C.-E. Chang and M. K. Gilson, Biophys. J., 2004, 87, 3035–3049 CrossRef CAS PubMed.
- F. Eblinger and H.-J. Schneider, Angew. Chem., Int. Ed., 1998, 37, 826–829 CrossRef CAS PubMed.
- H. Sun, C. A. Hunter and E. M. Llamas, Chem. Sci., 2015, 6, 1444–1453 RSC.
- T. Christensen, D. M. Gooden, J. E. Kung and E. J. Toone, J. Am. Chem. Soc., 2003, 125, 7357–7366 CrossRef CAS PubMed.
- J. J. Reczek, A. A. Kennedy, B. T. Halbert and A. R. Urbach, J. Am. Chem. Soc., 2009, 131, 2408–2415 CrossRef CAS PubMed.
- R. S. Kane, Langmuir, 2010, 26, 8636–8640 CrossRef CAS PubMed.
- C. Fasting, C. A. Schalley, M. Weber, O. Seitz, S. Hecht, B. Koksch, J. Dernedde, C. Graf, E.-W. Knapp and R. Haag, Angew. Chem., Int. Ed., 2012, 51, 10472–10498 CrossRef CAS PubMed.
- C. A. Hunter, Angew. Chem., Int. Ed., 2004, 43, 5310–5324 CrossRef CAS PubMed.
- D. P. Reynolds, M. C. Storer and C. A. Hunter, Chem. Sci., 2021, 12, 13193–13208 RSC.
- D. B. Smithrud and F. Diederich, J. Am. Chem. Soc., 1990, 112, 339–343 CrossRef CAS.
- D. B. Smithrud, T. B. Wyman and F. Diederich, J. Am. Chem. Soc., 1991, 113, 5420–5426 CrossRef CAS.
- L. Yang, C. Adam, G. S. Nichol and S. L. Cockroft, Nat. Chem., 2013, 5, 1006–1010 CrossRef CAS PubMed.
- J. H. Jordan, C. L. D. Gibb, A. Wishard, T. Pham and B. C. Gibb, J. Am. Chem. Soc., 2018, 140, 4092–4099 CrossRef CAS PubMed.
- K. I. Assaf and W. M. Nau, Angew. Chem., Int. Ed., 2018, 57, 13968–13981 CrossRef CAS PubMed.
- Y. Zhang and P. S. Cremer, Curr. Opin. Chem. Biol., 2006, 10, 658–663 CrossRef CAS PubMed.
- L. Yang, J. B. Brazier, T. A. Hubbard, D. M. Rogers and S. L. Cockroft, Angew. Chem., Int. Ed., 2016, 55, 912–916 CrossRef CAS PubMed.
- S. He, F. Biedermann, N. Vankova, L. Zhechkov, T. Heine, R. E. Hoffman, A. De Simone, T. T. Duignan and W. M. Nau, Nat. Chem., 2018, 10, 1252–1257 CrossRef CAS PubMed.
- F. Biedermann, W. M. Nau and H.-J. Schneider, Angew. Chem., Int. Ed., 2014, 53, 11158–11171 CrossRef CAS PubMed.
- F. Biedermann, M. Vendruscolo, O. A. Scherman, A. De Simone and W. M. Nau, J. Am. Chem. Soc., 2013, 135, 14879–14888 CrossRef CAS PubMed.
- F. Biedermann, V. D. Uzunova, O. A. Scherman, W. M. Nau and A. De Simone, J. Am. Chem. Soc., 2012, 134, 15318–15323 CrossRef CAS PubMed.
- C. N. Nguyen, T. Kurtzman Young and M. K. Gilson, Chem. Phys., 2012, 137, 044101 Search PubMed.
- L. M. Grimm, S. Spicher, B. Tkachenko, P. R. Schreiner, S. Grimme and F. Biedermann, Chem.–Eur. J., 2022, 28, e202200529 CrossRef CAS PubMed.
- J. W. Barnett, M. R. Sullivan, J. A. Long, D. Tang, T. Nguyen, D. Ben-Amotz, B. C. Gibb and H. S. Ashbaugh, Nat. Chem., 2020, 12, 589–594 CrossRef CAS PubMed.
- A. T. Fenley, N. M. Henriksen, H. S. Muddana and M. K. Gilson, J. Chem. Theory Comput., 2014, 10, 4069–4078 CrossRef CAS PubMed.
- D. M. de Oliveira and D. Ben-Amotz, J. Phys. Chem., 2019, 10, 2802–2805 CAS.
- N. A. Fokina, B. A. Tkachenko, A. Merz, M. Serafin, J. E. P. Dahl, R. M. K. Carlson, A. A. Fokin and P. R. Schreiner, Eur. J. Org Chem., 2007, 2007, 4738–4745 CrossRef.
- V. Rekharsky Mikhail, T. Mori, C. Yang, H. Ko Young, N. Selvapalam, H. Kim, D. Sobransingh, E. Kaifer Angel, S. Liu, L. Isaacs, W. Chen, S. Moghaddam, M. K. Gilson, K. Kim and Y. Inoue, Proc. Natl. Acad. Sci. U.S.A., 2007, 104, 20737–20742 CrossRef CAS PubMed.
- D. A. Stauffer, R. E. Barrans Jr. and D. A. Dougherty, J. Org. Chem., 1990, 55, 2762–2767 CrossRef CAS.
- P. D. Ross and M. V. Rekharsky, Biophys. J., 1996, 71, 2144–2154 CrossRef CAS PubMed.
- D. Hallén, A. Schön, I. Shehatta and I. Wadsö, J. Chem. Soc., Faraday Trans., 1992, 88, 2859–2863 RSC.
- H. J. Hinz, K. Weber, J. Flossdorf and M. R. Kula, Eur. J. Biochem., 1976, 71, 437–442 CrossRef CAS PubMed.
- H. Naghibi, A. Tamura and J. M. Sturtevant, Proc. Natl. Acad. Sci. U.S.A., 1995, 92, 5597–5599 CrossRef CAS PubMed.
- B. Barisas, S. Singer and J. Sturtevant, Biochemistry, 1972, 11, 2741–2744 CrossRef CAS PubMed.
- F. Schmid, H. J. Hinz and R. Jaenicke, Biochemistry, 1976, 15, 3052–3059 CrossRef CAS PubMed.
- C. Schönbeck and R. Holm, J. Phys. Chem. B, 2019, 123, 6686–6693 CrossRef PubMed.
- Y. H. Ko, Y. Kim, H. Kim and K. Kim, Chem.–Asian J., 2011, 6, 652–657 CrossRef CAS PubMed.
- N. M. Henriksen, A. T. Fenley and M. K. Gilson, J. Chem. Theory Comput., 2015, 11, 4377–4394 CrossRef CAS PubMed.
- C. N. Nguyen, T. K. Young and M. K. Gilson, Chem. Phys., 2012, 137, 044101 Search PubMed.
- J. Yin, A. T. Fenley, N. M. Henriksen and M. K. Gilson, J. Phys. Chem. B, 2015, 119, 10145–10155 CrossRef CAS PubMed.
- J. Yin, N. M. Henriksen, H. S. Muddana and M. K. Gilson, J. Chem. Theory Comput., 2018, 14, 3621–3632 CrossRef CAS PubMed.
- M. C. Storer and C. A. Hunter, Chem. Soc. Rev., 2022, 51, 10064–10082 RSC.
- A. A. Sandilya, U. Natarajan and M. H. Priya, ACS Omega, 2020, 5, 25655–25667 CrossRef CAS PubMed.
- S. J. Barrow, K. I. Assaf, A. Palma, W. M. Nau and O. A. Scherman, Chem. Sci., 2019, 10, 10240–10246 RSC.
- M. V. Rekharsky, T. Mori, C. Yang, Y. H. Ko, N. Selvapalam, H. Kim, D. Sobransingh, A. E. Kaifer, S. Liu, L. Isaacs, W. Chen, S. Moghaddam, M. K. Gilson, K. Kim and Y. Inoue, Proc. Natl. Acad. Sci. U.S.A., 2007, 104, 20737–20742 CrossRef CAS PubMed.
- J. Lagona, P. Mukhopadhyay, S. Chakrabarti and L. Isaacs, Angew. Chem., Int. Ed., 2005, 44, 4844–4870 CrossRef CAS PubMed.
- J. Szejtli, Chem. Rev., 1998, 98, 1743–1754 CrossRef CAS PubMed.
- P. Malhotra and J. B. Udgaonkar, Protein Sci., 2016, 25, 1924–1941 CrossRef CAS PubMed.
- N. R. Syme, C. Dennis, S. E. V. Phillips and S. W. Homans, Chembiochem, 2007, 8, 1509–1511 CrossRef CAS PubMed.
- J. M. Sturtevant, Proc. Natl. Acad. Sci. U.S.A., 1977, 74, 2236–2240 CrossRef CAS PubMed.
- N. T. Southall, K. A. Dill and A. D. J. Haymet, J. Phys. Chem. B, 2002, 106, 521–533 CrossRef CAS.
- G. Hummer, S. Garde, A. E. Garcia and L. R. Pratt, Chem. Phys., 2000, 258, 349–370 CrossRef CAS.
- R. L. Baldwin, Proc. Natl. Acad. Sci. U.S.A., 1986, 83, 8069–8072 CrossRef CAS PubMed.
- W. Kauzmann, in Advances in Protein Chemistry, Elsevier, 1959, vol. 14, pp. 1–63 Search PubMed.
Footnotes |
| † Electronic supplementary information (ESI) available: ITC data and analysis, emission-based binding curves, MD simulation details. See DOI: https://doi.org/10.1039/d3sc01975f |
| ‡ These authors contributed equally. |
| This journal is © The Royal Society of Chemistry 2023 |