
 Open Access Article
 This Open Access Article is licensed under a Creative Commons Attribution-Non Commercial 3.0 Unported Licence
High-voltage lithium-metal batteries enabled by ethylene glycol bis(propionitrile) ether-LiNO3 synergetic additives†
Shaopeng
Li
ab,
Kangsheng
Huang
a,
Langyuan
Wu
a,
Dewei
Xiao
a,
Jiang
Long
a,
Chenhui
Wang
a,
Hui
Dou
 a,
Pu
Chen
*b and
Xiaogang
Zhang
*a
a,
Pu
Chen
*b and
Xiaogang
Zhang
*a
aJiangsu Key Laboratory of Electrochemical Energy Storage Technologies, College of Materials Science and Technology, Nanjing University of Aeronautics and Astronautics, Nanjing, 210016, P. R. China. E-mail: azhangxg@nuaa.edu.cn
bDepartment of Chemical Engineering and Waterloo Institute of Nanotechnology, University of Waterloo, N2L 3G1, Canada
First published on 13th September 2023
Abstract
The employment of Li metal anodes is a key to realizing ultra-high energy batteries. However, the commercialization of lithium metal batteries (LMBs) remains challenging partially due to the thermodynamic instability and competitive oxidative decomposition of the solvent. Herein, a bi-functional electrolyte for stabilizing the interfaces of both the Li metal anode and LiCoO2 (LCO) cathode is designed by introducing lithium nitrate (LiNO3) through Ethylene Glycol Bis(Propionitrile) Ether (DENE). For the anode, the C8H12N2O2–LiNO3 coordination-solvation contributes to forming a stable Li3N-enhanced solid electrolyte interphase (SEI), which increases the average Li coulombic efficiency (CE) up to 98.5%. More importantly, in situ electrochemical dilatometry further reveals that the highly reversible behavior and a low volume expansion of lithium deposition are related to the stable Li3N-enhanced SEI. The designed electrolyte enables the Li‖LCO cell to achieve an average CE of 99.2% and a high capacity retention of 88.2% up to 4.6 V after 100 cycles. This work provides a strategic guidance in developing high-voltage Li‖LCO batteries with dual electrolyte additives.
1 Introduction
With the popularity of electric vehicles, the requirement for high-energy-density batteries is becoming increasingly urgent.1 As the power of electric vehicles, the battery's energy density determines the vehicle's mileage. Using high-voltage-capacity cathodes and lithium metal anodes is one of the options for building high-energy systems.2–5 However, such systems are usually accompanied by the issues of thermodynamic instability and aggressive surface chemistry.6,7 Therefore, forming a stable electrolyte interphase is essential to mitigate the oxidative decomposition of solvent and electrodes.8–11For the anode, lithium deposition tends to be non-uniform and intensifies with cycling, eventually piercing the separator and causing runaway battery explosions.12,13 The electrolyte is the source of the SEI, and it has been demonstrated that the SEI composition can be effectively tuned by a special solvation structure design.14–16 For example, LiNO3 has been shown to participate effectively in SEI formation and improve the cycling performance of LMBs.17–20 However, LiNO3 is almost insoluble in carbonate electrolytes. Given this, Lu et al. introduced a solubilizer (tin(II)) as the third solvent to overcome the dissolution barrier of LiNO3, the designed electrolyte can significantly enhance the CE of lithium and the cycle performance of the full cell is improved by as much as 12 times.21 However, the addition of Lewis acid also increases the instability of the electrolyte, which requires precise control of the additional amount. Wang et al. further introduced LiNO3 into a high-concentration sulfolane (SL) electrolyte and obtained >99% CE in the full cell.22,23 In addition, much research on LiNO3 has been reported, such as pre-implantation of LiNO3,24–26 construction of artificial SEI layers containing LiNO3 (ref. 27) and linking NO3− to ether moieties,28 which have improved the stability of LMBs.
For the cathode, LiCoO2 is the earliest commercialized cathode material for lithium-ion batteries.29 A higher cut-off voltage (>4.35 V) is one of the ways to improve the energy density of LCO, while this will be at the cost of fast capacity fading as a result of the high reactivity between solvents and the high-valence Coα+ (α > 3). The main strategies to protect LCO are bulk doping and surface modification. For example, the coating of Li3AlF6,30 Li4Mn5O12,31 LiCoPO4,32 and Li2CoTi3O8 (ref. 33), and the doping of Al, Ti, Mg, P and F34–39 into bulk phases can inhibit the irreversible phase transition of LCO. Another strategy is introducing nitrile,40,41 sulfone,42,43 fluoroether44 and borate45,46 additives to form a stable cathode electrolyte interphase (CEI). Such explorations mainly focus on the cathode, so it is still challenging to realize high-voltage LCO and lithium metal-compatible electrolytes.
Here, we demonstrate the excellent cycling stability of the lithium anode and a high-voltage LiCoO2 can be achieved in a base electrolyte (1 M LiPF6 dissolved in EC/DMC (1![[thin space (1/6-em)]](https://www.rsc.org/images/entities/char_2009.gif) :1 by vol) with 5% FEC) by introducing the DENE/LiNO3 (1 M) composite additive. Using the high Gutmann donor number (DN) of DENE solvent (DN of 19.6 kcal mol−1), we have realized the utilization of LiNO3 (NO3−, DN of 22.2 kcal mol−1) in a carbonate-based electrolyte. The high donor number DENE solvent can solve the insolubility problem of LiNO3 in carbonate-based electrolytes. At the same time, because the DN values of the anion and the solvent are close, the anion can easily enter the solvation sheath, which helps to improve the reduction stability of the electrolyte. The introduction of LiNO3 can induce the formation of a Li3N-enhanced SEI layer. Meanwhile, the performance of high-voltage LCO can be improved simultaneously due to the strong adsorption of DENE on the LCO surface. The electrolyte with a 5% volume of DENE/LiNO3 (1 M) (denoted as 5% DLE) achieves the highest CE (98.5%) of the lithium metal anode and improves the capacity retention of the commercial LCO cathode (4.6 V) to 88.2% after 100 cycles. Interestingly, we further developed a thickness expansion characterization method to illustrate the failure mechanism of lithium metal. In situ electrochemical dilatometry further reveals that the highly reversible behavior and a low volume expansion of lithium deposition are related to the Li3N-enhanced SEI, which can inhibit dead lithium formation. Our work shares new insight into constructing stable compatible electrolytes for high-voltage LMBs with dual electrolyte additives.
:1 by vol) with 5% FEC) by introducing the DENE/LiNO3 (1 M) composite additive. Using the high Gutmann donor number (DN) of DENE solvent (DN of 19.6 kcal mol−1), we have realized the utilization of LiNO3 (NO3−, DN of 22.2 kcal mol−1) in a carbonate-based electrolyte. The high donor number DENE solvent can solve the insolubility problem of LiNO3 in carbonate-based electrolytes. At the same time, because the DN values of the anion and the solvent are close, the anion can easily enter the solvation sheath, which helps to improve the reduction stability of the electrolyte. The introduction of LiNO3 can induce the formation of a Li3N-enhanced SEI layer. Meanwhile, the performance of high-voltage LCO can be improved simultaneously due to the strong adsorption of DENE on the LCO surface. The electrolyte with a 5% volume of DENE/LiNO3 (1 M) (denoted as 5% DLE) achieves the highest CE (98.5%) of the lithium metal anode and improves the capacity retention of the commercial LCO cathode (4.6 V) to 88.2% after 100 cycles. Interestingly, we further developed a thickness expansion characterization method to illustrate the failure mechanism of lithium metal. In situ electrochemical dilatometry further reveals that the highly reversible behavior and a low volume expansion of lithium deposition are related to the Li3N-enhanced SEI, which can inhibit dead lithium formation. Our work shares new insight into constructing stable compatible electrolytes for high-voltage LMBs with dual electrolyte additives.
2 Results and discussion
2.1. Electrochemical behaviors and solvation structure of DLE electrolyte
The solubility of LiNO3 in DENE is demonstrated by Nuclear Magnetic Resonance Spectroscopy (NMR). As a result, the 7Li NMR spectrum in Fig. S1† exhibits the Li+ solvation signal after adding 1 M LiNO3 salt in DENE, and the solvent is clear without insoluble LiNO3 particles. Different volumes of DENE/LiNO3 composite additive were added into the base electrolyte (denoted as 1% DLE, 5% DLE, 10% DLE), equivalent to introducing 0.01 M, 0.05 M, and 0.1 M LiNO3. The electrochemical stabilities of the base electrolyte with different volumes of DENE/LiNO3 composite additive were compared. The high-voltage tolerance of DLE was investigated by linear sweep voltammetry (LSV) starting from 2.5 V up to 6 V at a scan rate of 10 mV s−1 in Fig. 1a. Unlike the base electrolyte that starts to oxidize at 4.3 V, the DLE owns a wider electrochemical window that exhibits an oxidation stability of 4.5 V (1% DLE), 4.8 V (5% DLE) and 5.2 V (10% DLE), respectively. It can also be found that the oxidation current of the electrolyte with DENE is higher than that of the base electrolyte, indicating that DENE is preferentially oxidized and participates in the formation of the surface layer.47 To verify the peroxidation of DENE, the electrostatic potential and the corresponding lowest unoccupied molecular orbital (LUMO) and highest occupied molecular orbital (HOMO) energy levels of DENE and other solvents have been calculated and demonstrated in Fig. S2a.† The highest HOMO energy level of DENE confirms its preferential oxidation, forming stabilizing CEI films. The reduction of NO3− was also detected by cyclic voltammetry (CV) in Fig. S2b.† A wide peak from 1.6 to 1.8 V can be observed in 5% DLE, confirming the reduction of NO3−.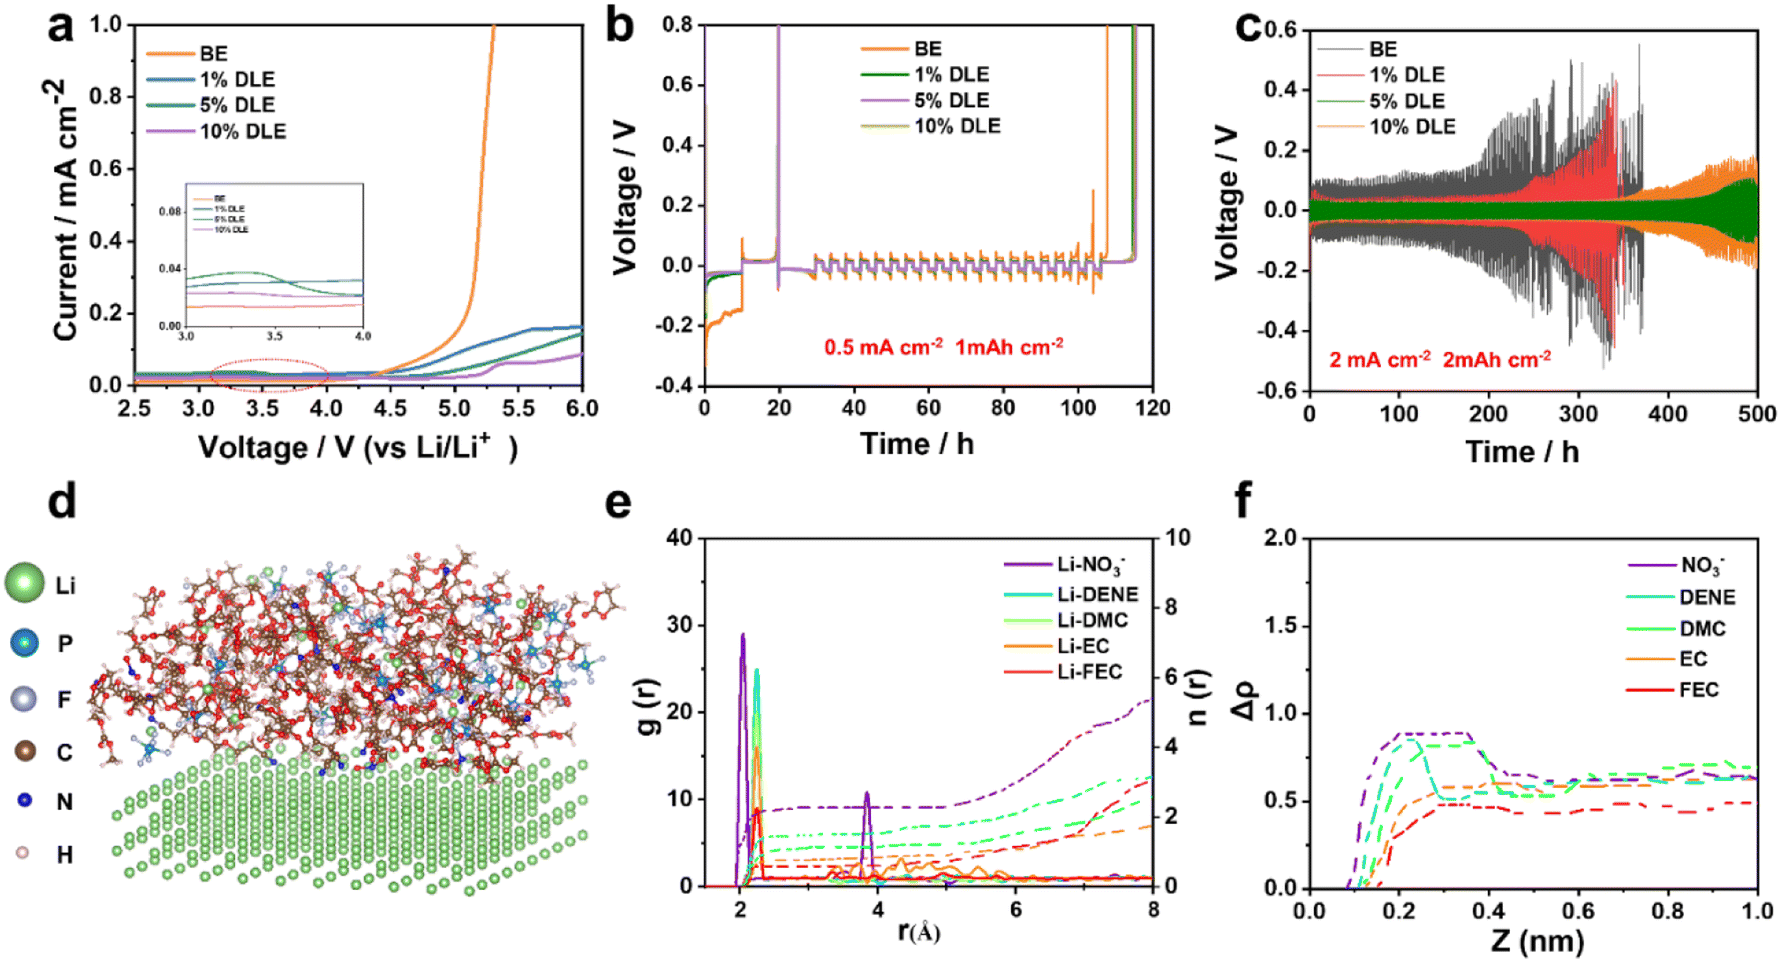 | ||
| Fig. 1 (a) LSV profiles of Li‖stainless-steel cells with different electrolytes at a scanning rate of 10 mV s−1. (b) Li plating/stripping profiles in the base electrolyte and DLE electrolytes at 0.5 mA cm−2 and 1 mA h cm−2. (c) Performances of Li‖Li cells in different electrolytes at a current density of 2 mA cm−2 and 2 mA h cm−2. (d) Snapshots of 5% DLE simulated by MD, and (e) the radial distribution functions and coordination numbers for 5% DLE. (f) MD-obtained normalized number density profiles of different types of molecules at the Li-metal surface in 5% DLE. | ||
Aurbach CE tests48 investigate the impact of the DENE/LiNO3 composite additive on Li deposition. Fig. 1b and S3a† illustrate that the base electrolyte is unstable in the Li plating/stripping process, showing a poor CE of 84.1%. However, the Li metal CE improves when different volumes of DENE/LiNO3 composite additives are added. The 5% DLE shows the best CE (98.5%) compared with 1% DLE (97.4%) and 10% DLE (97.6%). The long-term cycling performances of Li‖Li symmetric cells further prove the benefit of the 5% DLE by showing a substantially reduced overpotential at current densities of 2 mA cm−2 and 2 mA h cm−2 in Fig. 1c. The Li‖Li symmetric cell in the base electrolyte exhibits a high polarization, which increases to more than 200 mV after 200 h. In comparison, DLE electrolytes show much lower polarization. The cells with 5% DLE demonstrate a steady cyclability with the smallest overpotential of 96 mV after 500 h. Therefore, 5% DLE is the optimal proportion for subsequent testing. The smaller potential polarization is attributed to the difference in electrochemical kinetics. To understand the difference of charge transfer kinetics of the lithium anode in the different electrolytes, CV tests of the Li‖Cu half cell were carried out to probe the effect of additive in Fig. S3b.† An obvious redox couple corresponding to Li plating/stripping is observed from −0.2 to 0.2 V (versus Li/Li+). As a comparison, the average redox area for 5% DLE is 2.81 mA V cm−2, which is about 4.0 times higher than that of the base electrolyte (0.69 mA V cm−2). The higher current response can be mainly associated with a higher ionic transfer rate, which is consistent with the polarization discussed above. Meanwhile, the Nyquist plots of the Li‖Li symmetric cell after 100 cycles also show a much higher SEI and charge transfer resistance in the base electrolyte than in 5% DLE (Fig. S3c, Table S1†), which also implies better electrochemical kinetics of 5% DLE.
In Fig. 1d–f, molecular dynamics (MD) simulation was used to study the effect of additives on the solvation structure of lithium ions. By reason of the high electron donor characteristics of DENE, DENE takes precedence over EC, DMC and FEC in participating in solvation coordination. The high coordination number in the radial distribution functions further indicates that DENE has a stronger affinity for Li+, which is the main reason why DENE can dissolve LiNO3. Furthermore, NO3− will still tend to coordinate with Li+ and appear in the primary Li+-solvated structure. It is worth noting that the competitive adsorption of different species on the Electrical Double Layer (EDL) of the lithium metal anode greatly influences the initial interface chemistry of the SEI. Therefore, we calculated the tendency distribution of different components on the lithium metal surface. As the activation energy of NO3− is lower than that of other species, it will preferentially adsorb closer to the lithium metal surface and accumulate in the EDL so that it is first reduced to form an intermediate phase to protect lithium metal. On the other hand, the strong interaction between DENE solvent and Li+ inhibits more solvent components from entering the EDL and reduces the side reaction at the electrode interface.
2.2. Evolution of morphology for Li-metal anodes
To reveal the morphology evolution of lithium anodes at different electrolytes, an in situ monitor using an optical microscope was applied to visualize the evolution during Li plating/stripping (Videos S1 and S2†). As compared in Fig. 2a and b, remarkable dendrite growth can be observed in the base electrolyte after 2 minutes of deposition. As the deposition time increases, uneven Li deposition deteriorates, resulting in a porous structure. In contrast, the nucleation of the deposited Li in 5% DLE is more homogeneous, leading to a denser and smooth morphology. Simultaneously, the Li deposits disappear uniformly in 5% DLE after stripping with the same current density. While in the base electrolyte, plenty of dendritic Li remains on the surface to form black “dead lithium,” which is the main reason for the low CE (Fig. 1b).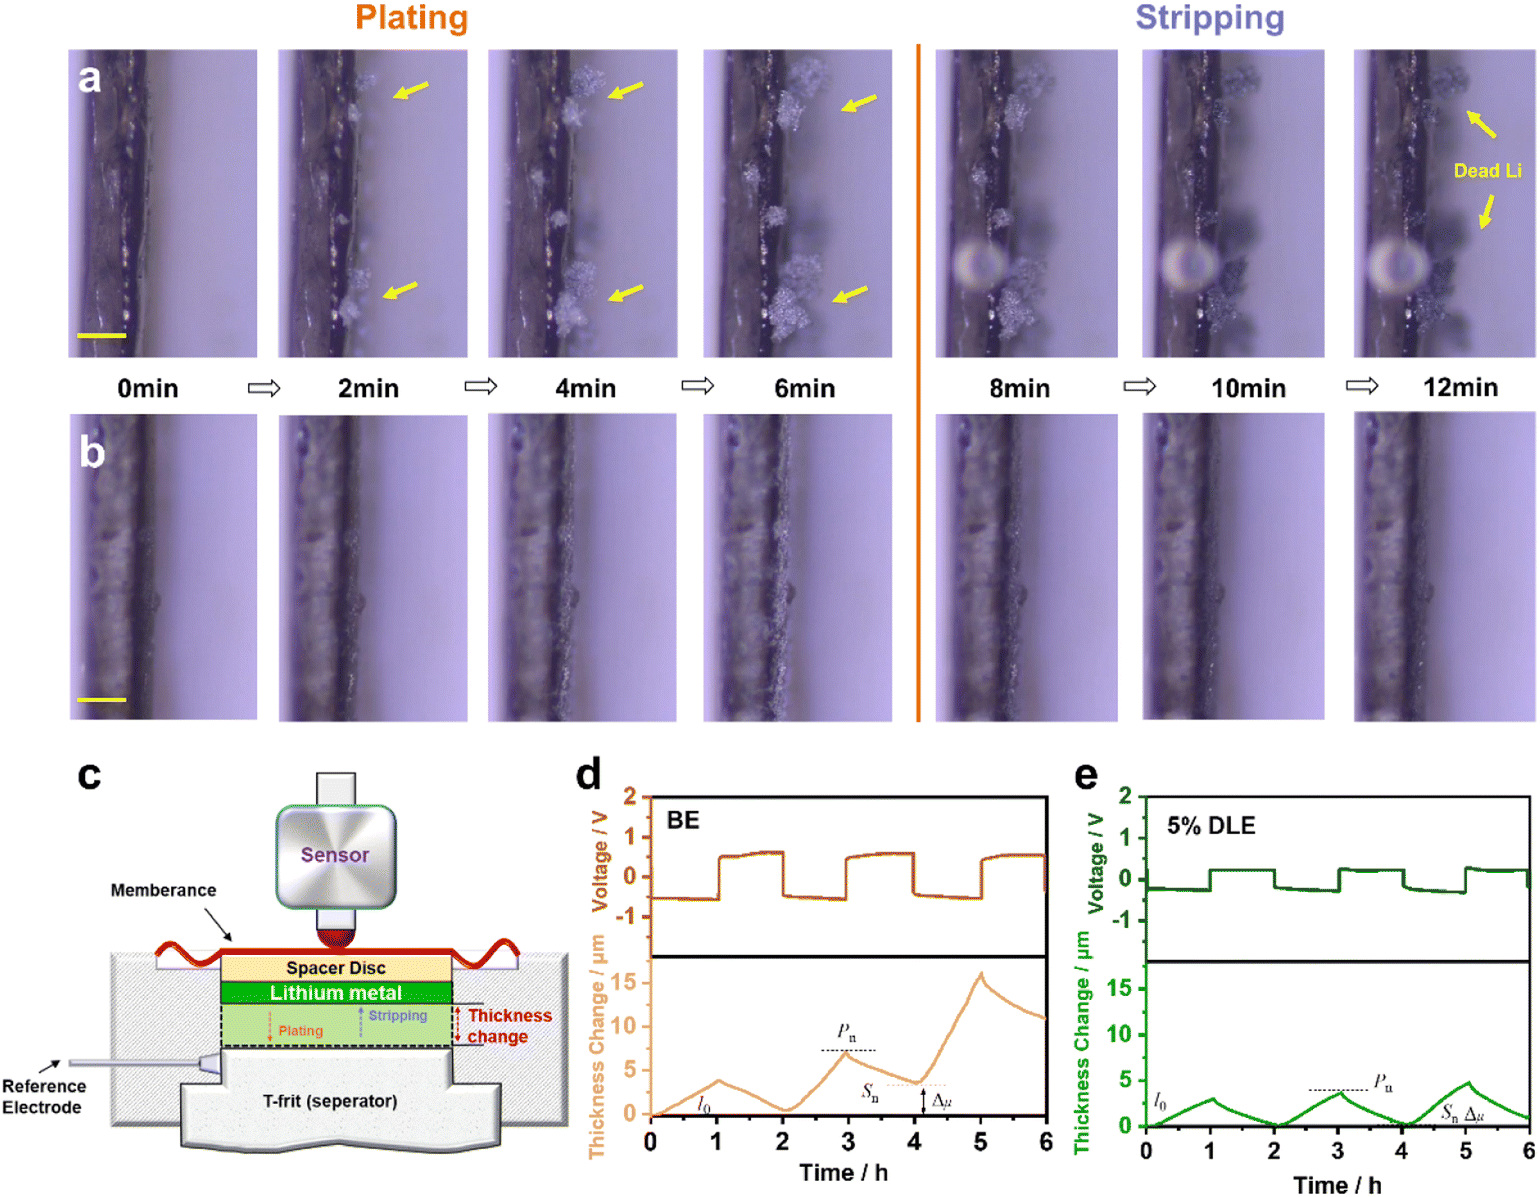 | ||
| Fig. 2 In situ optical microscopy observation of the Li deposition process in (a) the base electrolyte and (b) 5% DLE electrolyte at 5 mA cm−2 and 0.5 mA h cm−2, the ruler is 200 μm. (c) The schematic of the in situ electrochemical dilatometry measurement and the thickness change of the lithium anode in (d) the base electrolyte and (e) 5% DLE at the current density of 1 mA cm−2 for 1 mA h. | ||
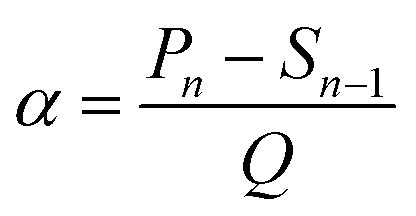
In more detail, in situ electrochemical dilatometry further monitored the lithium anode's thickness change during the plating/stripping process (Fig. 2c). The cells were cycled at a current density of 1 mA cm−2 for 3 cycles. The symbols l0, Pn, and Sn describe the thickness changes of the lithium in the initial, plating, and stripping states (n represents the cycle number).47,49,50 Accordingly, Δμ represents the thickness change caused by unstripped lithium metal and is defined as:
| Δμ = (Sn − l0) | (1) |
Since the capacity and thickness of lithium metal deposition can be regarded as linear changes, we define the slope of the curve as the expansion rate (α) of lithium metal per unit capacity (in this experiment, Q = 1 mA h cm−2), and α is defined as:
 | (2) |
As shown in Fig. 2d, e and Table S2†, Δμ of lithium in the base electrolyte increases rapidly during the cycle, i.e., from 0.48 μm to 10.98 μm. Equally bad, l1 increases sharply to 16.09 μm in the final cycle. This result indicates that the thickness of the dead lithium on the anode increases continuously. Interestingly, the value of Δμ in the 5% DLE remains almost unchanged (from 0.10 μm to 0.99 μm), showing that the thickness of the lithium anode maintains stable during continuous cycling. Further analysis is carried out on the expansion rate α and it can be found that in the base electrolyte, due to the self-deterioration effect of lithium dendrite, the dead lithium leads to the powdery expansion of lithium. The expansion rate increases from 3.88 to 12.45 μm cm2 mA h−1, leading to the rapid failure of the lithium anode. In 5% DLE, the expansion rate increases from 2.89 to 4.58 μm cm2 mA h−1, which significantly inhibits the powdered expansion of lithium metal. The thickness change is consistent with the in situ optical microscopy results and further proves the excellent compatibility of 5% DLE with the lithium metal anode.
The morphologies of the plated Li on Cu substrate can be seen in scanning electron microscopy (SEM) images. Rod-like and thick Li deposition (∼30 μm) with high tortuosity is formed in the base electrolyte as shown in Fig. 3a–c, which can easily penetrate the separator and cause a short circuit in LMBs. In contrast, grain coarsening behavior of lithium deposition with smooth and dense morphology (∼21 μm) can be observed in 5% DLE in Fig. 3d–f, indicating a homogeneous and dense Li deposition behavior. Optical images also show that Li deposition in the base electrolyte is heterogeneous with locally aggregated sediments. In contrast, the Li deposition in 5% DLE flashes a bright metallic luster, which proves that a more stable SEI is formed on the lithium metal.
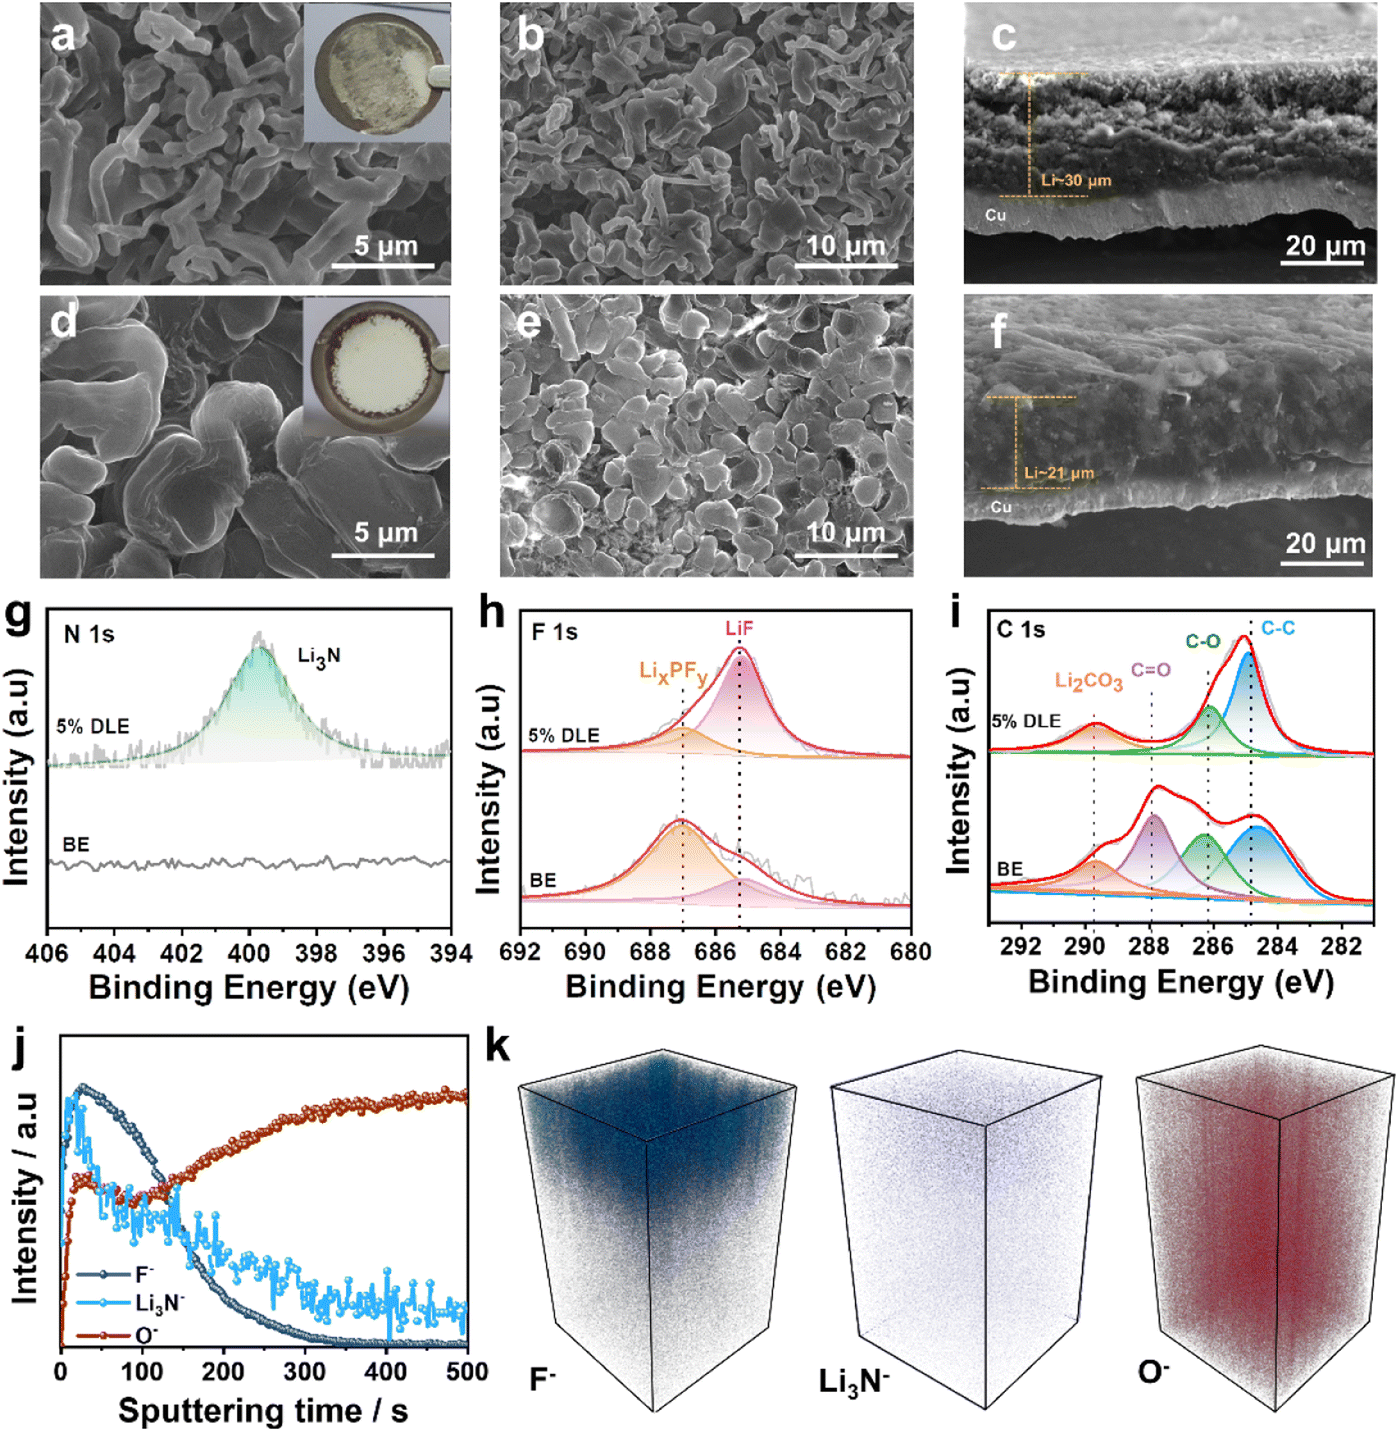 | ||
| Fig. 3 Top-view and cross-sectional SEM images of Li deposition morphology in (a–c) the base electrolyte and (d–f) 5% DLE at 1 mA cm−2 1 mA h after 100 cycles. The insets are optical images of the corresponding Li-plated Cu foils. XPS spectra of (g) N 1s, (h) F 1s, and (i) C 1s on the Li-metal anode at 1 mA cm−2, 1 mA h after 100 cycles. (j) TOF-SIMS depth profiles of F−, Li3N− and O− with a sputtering time of the Li anode in 5% DLE after 5 cycles. (k) TOF-SIMS 3D cubic images of the sputtered volume corresponding to the depth profiles. | ||
To further investigate the underlying reason for better performance, X-ray photoelectron spectroscopy (XPS) analysis is performed to reveal the chemical composition of the SEI.51 As presented in Fig. 3g, the N 1s spectrum exhibits an obvious peak of Li3N at 398.6 eV in 5% DLE. While due to the lack of LiNO3, the SEI formed in the base electrolyte is absent for the N element. Li3N is considered to be a fast conductor of lithium ions, which can regulate Li+ flux distribution and facilitate Li+ diffusion through the SEI layer.52 In the F 1s spectra, both electrolytes present the existence of LixPFy and LiF. In comparison, fewer LixPFy and more LiF are generated in 5% DLE than in the base electrolyte. This is because the N-rich interface formed by the preferential decomposition of LiNO3 inhibits the decomposition of the LiPF6. The C 1s spectra further prove that the SEI formed by 5% DLE has lower C content, suggesting fewer organic components. The enhanced Li3N and LiF can improve the ionic conductivity and stability of the SEI, which is beneficial to uniform and dendrite-free deposition of Li+.
The negative ion time-of-flight secondary ion mass spectrometry (TOF-SIMS) analysis was implemented to investigate the spatial distribution of F, N and O in the SEI layer within a target area of 20 × 20 μm. The depth profiles of different components formed in 5% DLE are demonstrated in Fig. 3j. The peaks of F− and Li3N− are maximal at the top layer of the lithium anode, indicating that LiF and Li3N are the main species of the SEI layer. The high lateral resolution mapping of F− and Li3N− on the surface is further shown in Fig. S4a and b,† which provide a clear localization of F− and Li3N−. After removing the surface electrode (120 s), O− increases significantly and becomes the main signal detected. The increase of O− is due to the formation of Li2CO3 and Li2O compounds during the cycle. The 3D spatial distribution of the F−, Li3N− and O− is presented in Fig. 3k. We can see a clear gradient distribution structure, which is very consistent with the above depth profile results. It is intuitively explained that the excellent electrochemical performance is attributed to the inorganic-rich SEI layer formed by 5% DLE at the interface of lithium metal.
2.3. Electrochemical performance of LCO‖Li cells
To evaluate the high-voltage cycling performance of 5% DLE, commercial LCO was used as a cathode to pair with the lithium anode under 4.45 V and 4.6 V cut-off voltage (12 mg cm−2, 1C = 274 mA g−1, the retentions are compared with the fourth cycle as the first three cycles are the formation process). Long-term cycling of the LCO‖Li cells with and without additives was first evaluated at an upper cut-off voltage of 4.45 V as shown in Fig. 4a. It can be observed that although the cell using the base electrolyte reaches a similar initial capacity of 175.7 mA h g−1, its capacity retention decreases to 80% after the 100th cycle, which is only 141.7 mA h g−1 (Fig. S5a†). While the cell using 5% DLE stably maintained 90.1% capacity retention after 300 cycles, its capacity still reached 162.5 mA h g−1 as shown in Fig. S5b.† A higher cut-off voltage can remarkably improve the energy density of the cell. Here, we studied the electrochemical stability of the additive under high voltage by setting the cut-off charging voltage to 4.6 V. Fig. 4b and c reflect that Li‖LCO batteries using 5% DLE have better capacity retention than batteries using the base electrolyte. After 100 cycles, the capacity retention remains 88.2% with a high CE of 99.2%. The prominent average CE indicates that the undesired side reactions between LCO and electrolytes have been greatly suppressed in 5% DLE. Inversely, the voltage profile of LCO batteries using the base electrolyte is severely deformed after 100 cycles, meaning serious structural degradation (Fig. S5c†).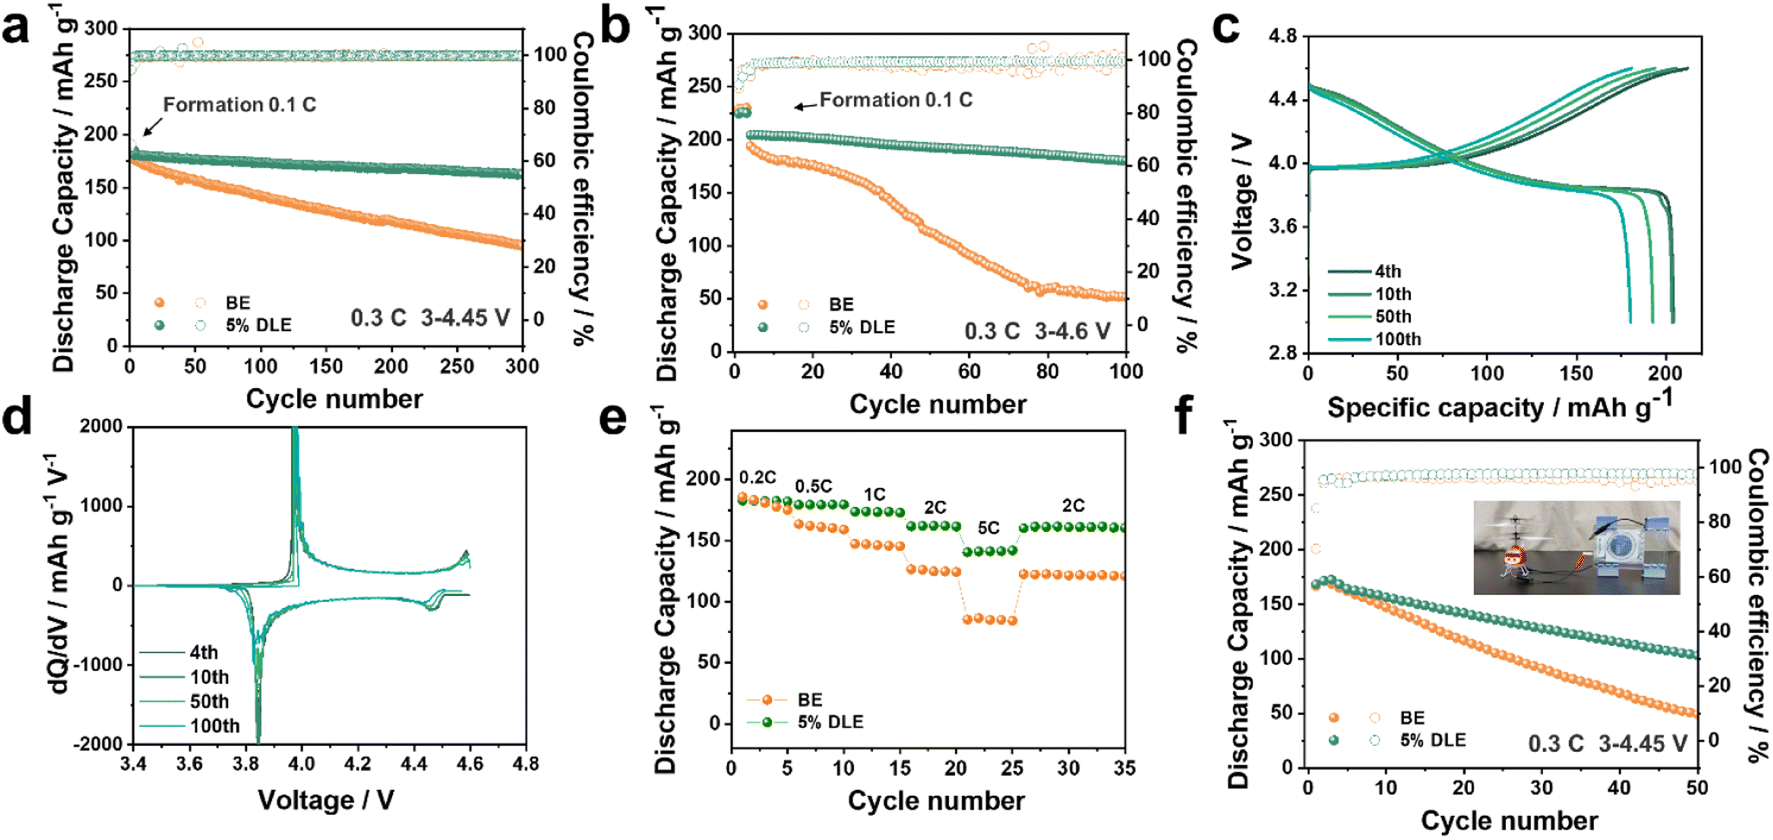 | ||
| Fig. 4 (a) Cycling performances of Li‖LCO between 3.0 and 4.45 V versus Li/Li+. (b) Cycling performances of Li‖LCO between 3.0 and 4.6 V versus Li/Li+. (c) The selected charge/discharge profiles (3–4.6 V) in 5% DLE. (d) Corresponding dQ/dV curves at the selected cycles in 5% DLE. (e) Rate performances of the Li‖LCO cells in different electrolytes. (f) Cycling performances of the Cu‖LCO anode-free cell, the inset shows an electric aircraft powered by the Cu‖LCO anode-free pouch cell. | ||
The corresponding dQ/dV curves at the selected cycles are further presented in Fig. 4d and S5d.† In contrast to the reduced and more polarized peaks with the base electrolyte, sharp redox peaks are observed in 5% DLE, verifying that the structure and interface of LCO encapsulated by the stabilized CEI are well maintained. After 100 cycles, the redox peak of LCO in the base electrolyte almost disappeared, suggesting that its structure was seriously degraded, which corresponded well to the critical capacity loss at a later period of cycles. However, the redox peak in 5% DLE still coincides with the previous cycles, reflecting the expansion of cycle stability. Correspondingly, we also performed an in situ differential electrochemical mass spectroscopy (DEMS) test of the two electrolytes and the patterns are shown in Fig. S6.† It can be clearly distinguished that significant CO2 is produced in the voltage rise region during the cell's charging process in the base electrolyte. This proves that high-valence Co decomposes the electrolyte, resulting in electrode interface failure and capacity decline. Compared with the base electrolyte, the 5% DLE electrolyte releases less CO2 due to the inhibition of competitive oxidative decomposition of solvent, thus significantly improving the cycle stability.
The optimized electrode interface and mitigated polarization improve the cell's rate performance. As shown in Fig. 4e, the LCO‖Li cell using 5% DLE shows better rate performance and can still provide a high discharge capacity of 140.4 mA h g−1 at 5C. In contrast, the capacity of the base electrolyte soon drops to 85 mA h g−1, which proves the superior power capacity of 5% DLE. In order to demonstrate the application potential of 5% DLE, we further prepared an anode-free cell in Fig. 4f and S7.† It can be found that the cell with 5% DLE exhibits more excellent stability, preserving a high capacity of 102.8 mA h g−1 after 50 cycles with a capacity retention of 61.1% (base electrolyte: 44.1 mA h g−1 after 50 cycles). The inset digital diagram in Fig. 4f shows a small aircraft driven by an anode-free pouch cell.
2.4. Interface between LCO and electrolyte
To acquire better views into the enhancement of electrochemical performance and further understand the effects of 5% DLE on the interface, Li‖LCO batteries after 100 cycles were disassembled for XPS and SEM characterization. As shown in Fig. 5a–c, for the C 1s spectrum, the peak at 284.8 eV (C–H/C–C) is from conductive carbon, while the peak at 290.4 eV (C–F) in the C 1s spectrum and the peak at 687.8 eV (C–F) in the F 1s spectrum are also from polyvinylidene fluoride binder (PVDF). With the addition of DENE/LiNO3 composite additives, the intensities of 288.2 eV (C![[double bond, length as m-dash]](https://www.rsc.org/images/entities/char_e001.gif) O) and 286.1 eV (C–O) peaks are obviously reduced, confirming that fewer solvent decomposition byproducts are produced at the interface. Similarly, in the F 1s spectra, the weaker peaks of LiF and LixFyPOz inorganic compounds are also observed at the LiCoO2 electrode circulating in the 5% DLE, providing evidence for the suppressed malignant consumption of lithium salts. Moreover, in the O 1s spectra (Fig. S8†) the weaker peak intensity of Co–O (529.5 eV) further indicates that cobalt dissolution is effectively inhibited due to the strong coordination of the –CN group. As for the N 1s spectrum in Fig. 5c, the peaks corresponding to Co-NC-R and –CN can only be detected in the optimized electrolyte, which also reveals that –CN in DENE can be firmly adsorbed on the surface of LCO and participate in CEI formation.
O) and 286.1 eV (C–O) peaks are obviously reduced, confirming that fewer solvent decomposition byproducts are produced at the interface. Similarly, in the F 1s spectra, the weaker peaks of LiF and LixFyPOz inorganic compounds are also observed at the LiCoO2 electrode circulating in the 5% DLE, providing evidence for the suppressed malignant consumption of lithium salts. Moreover, in the O 1s spectra (Fig. S8†) the weaker peak intensity of Co–O (529.5 eV) further indicates that cobalt dissolution is effectively inhibited due to the strong coordination of the –CN group. As for the N 1s spectrum in Fig. 5c, the peaks corresponding to Co-NC-R and –CN can only be detected in the optimized electrolyte, which also reveals that –CN in DENE can be firmly adsorbed on the surface of LCO and participate in CEI formation.
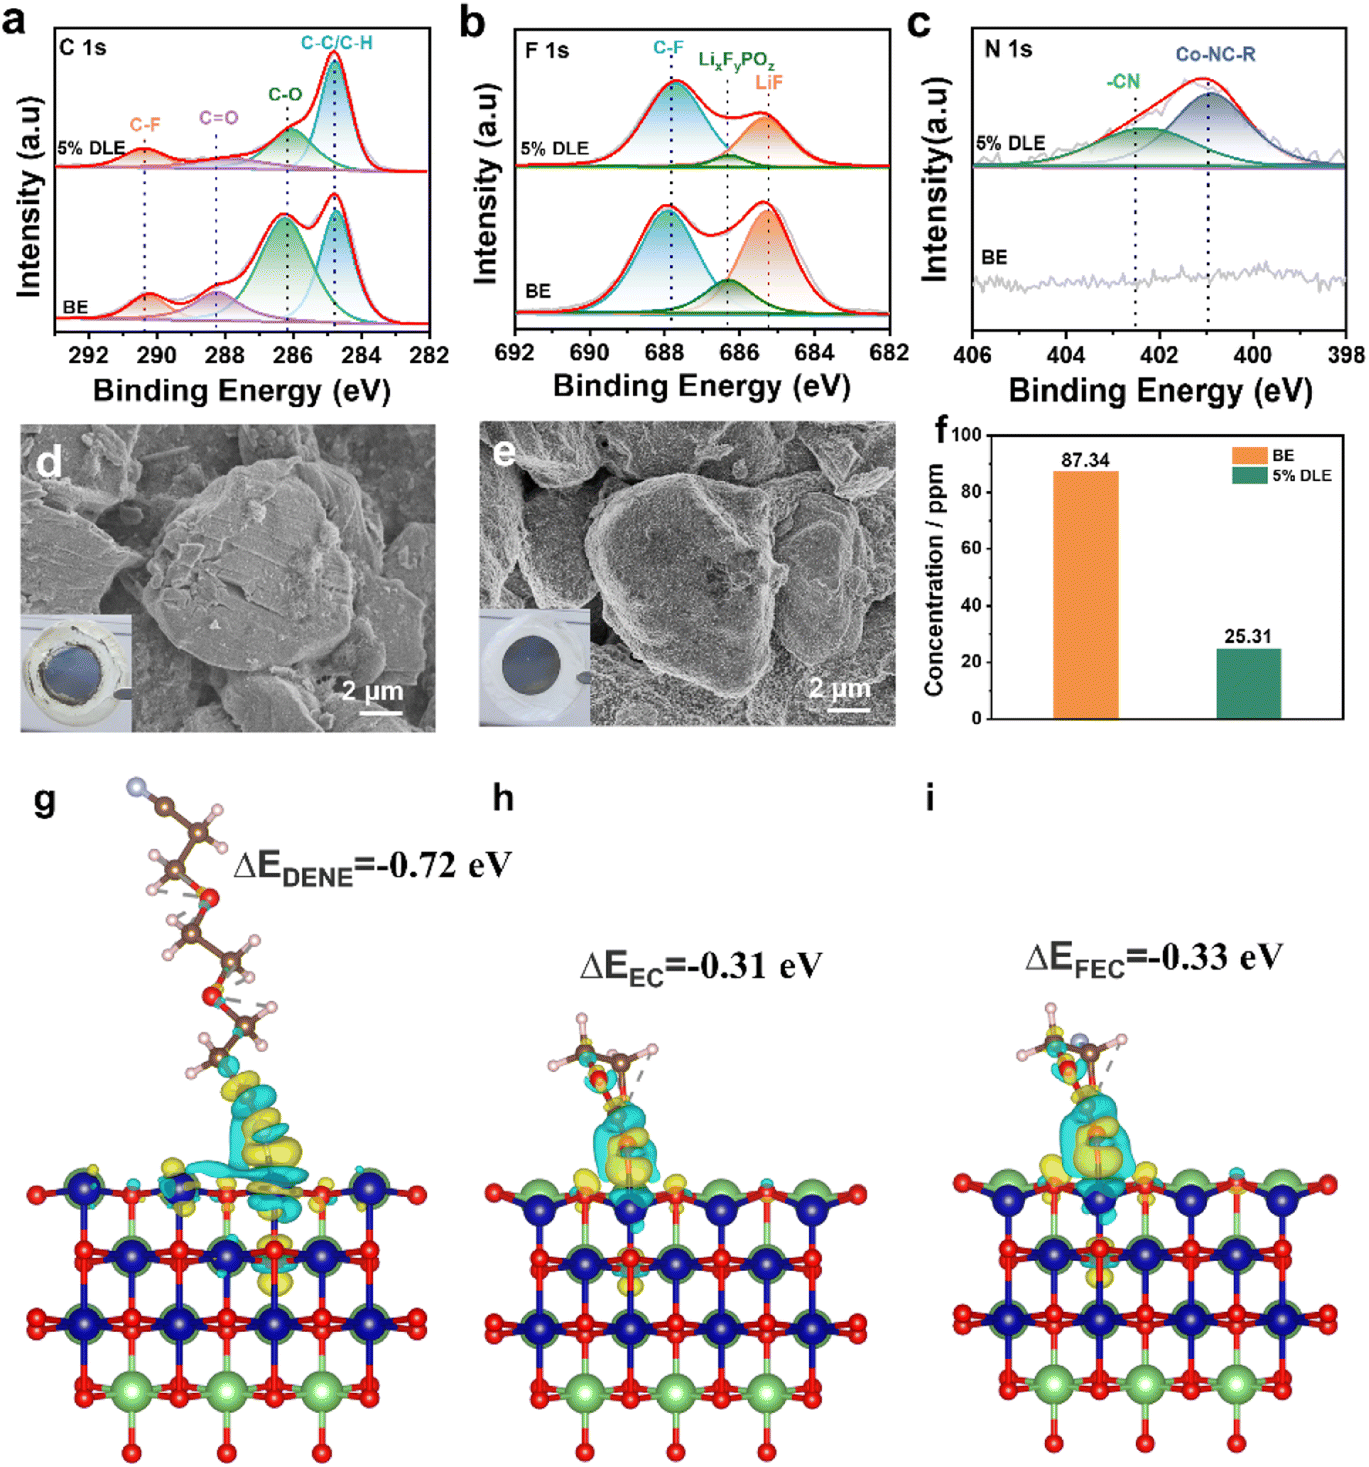 | ||
Fig. 5 XPS patterns of LCO cathodes after 100 cycles under 4.6 V at 0.3C in the base electrolyte and 5% DLE. (a) C 1s, (b) F 1s, and (c) N 1s. SEM images of LCO cathodes in (d) the base electrolyte and (e) 5% DLE (the insets are optical images of the corresponding LCO electrode). (f) ICP patterns of the base electrolyte and 5% DLE. The charge density difference maps and adsorption energies of (g) DENE, (h) EC and (i) FEC on the LiCoO2 (10![[1 with combining macron]](https://www.rsc.org/images/entities/char_0031_0304.gif) 4) surfaces. 4) surfaces. | ||
The morphology of LCO after 100 cycles was characterized as presented in Fig. 5d and e. In the digital photos, it can be observed that a large amount of dead lithium (gray compound) is attached to the electrode circulating in the base electrolyte, while the electrode circulating in 5% DLE is relatively clean. The SEM images show obvious microcracks and irregular byproducts for cycled LCO in the base electrolyte. In contrast, 5% DLE maintains the integrity of the LCO structure. The cobalt content in the electrolyte after cycles is determined using an inductively coupled plasma atomic emission spectrometer (ICP-AES) in Fig. 5f. The results show that the dissolution of Co in 5% DLE is obviously restrained (25.31 ppm vs. 87.34 ppm in the base electrolyte), which also benefits from a stabilized and dense CEI.
Density functional theory (DFT) calculation is further applied to gain insight into the strong coordination between the nitrile group and transition metal Co as shown in Fig. 5g–i. We compared the adsorption energies of DENE, EC, and FEC on the LCO (1014) surface. The results show that the adsorption energy of DENE (−0.72 eV) is lower than that of EC (−0.31 eV) and FEC (−0.33 eV), indicating that DENE is more conducive to adsorption on the LCO surface. In addition, the strong adsorption of DENE effectively inhibits the bonding between cobalt and carbonyl oxygen on the surface of EC and FEC, thus stabilizing the microstructure of the electrode surface. The above results reveal the reason for the superior high-voltage performance of 5% DLE.
3 Conclusions
In this work, we designed and demonstrated a facile and effective strategy to stabilize high-voltage LMBs by adding a 5% volume of DENE/LiNO3 (1 M) composite additive. The high donor number of DENE successfully improves the solubility of LiNO3, and the DENE/NO3− coordination-solvation structure can dramatically optimize the compositions of both SEI and CEI. TOF-SIMS results show that the DENE/LiNO3 composite additive forms a Li3N-enhanced SEI and successfully inhibits dendrite growth. More importantly, in situ electrochemical dilatometry further reveals that the highly reversible behavior of lithium deposition is related to a low expansion rate, which also benefits from the enhanced SEI. As a result, the 5% DLE electrolyte enables the Li metal anode to achieve a high CE of 98.5%. Moreover, the LCO‖Li full cell with the designed electrolyte also achieves an outstanding capacity retention of 88.2% after 100 cycles with a high CE of 99.2%. The microstructure analysis after cycling shows that the particle cracking of high-voltage LCO is suppressed. Our work highlights the importance of constructing compatible electrolytes and provides a new method for rationally designing stabilized cathode/anode interfacial layers.Data availability
Detailed experimental procedures and computational methods are included in the ESI.†Author contributions
Shaopeng Li: designed and executed all experiments and composed the article draft. Kangsheng Huang: designed experiments, writing – reviewing and editing. Langyuan Wu: conceptualization, writing – reviewing and editing. Dewei Xiao: software. Jiang Long: carried out in situ electrochemical dilatometry and analyzed the results. Chenhui Wang: validation, data curation. Hui Dou: writing – reviewing and editing. Pu Chen: writing – reviewing and editing. Xiaogang Zhang: supervision, project administration, funding acquisition, writing – reviewing and editing.Conflicts of interest
There are no conflicts to declare.Acknowledgements
This work was supported by the National Natural Science Foundation of China (2022YFE0109400), Basic Research Program of Frontier Leading Technologies in Jiangsu Province (BK20202008), Free Exploration Basic Research Project in Shenzhen Virtual University Park (2021Szvup062), ChinaScholarship Council (Grant No. CSC202206830063), Analysis and Testing Center of Nanjing University of Aeronautics and Astronautics and the Priority Academic Program Development of Jiangsu Higher Education Institutions (PAPD).References
- R. Schmuch, R. Wagner, G. Horpel, T. Placke and M. Winter, Nat. Energy, 2018, 3, 267–278 CrossRef CAS.
- X. L. Fan and C. S. Wang, Chem. Soc. Rev., 2021, 50, 10486–10566 RSC.
- Y. L. Jie, X. D. Ren, R. G. Cao, W. B. Cai and S. H. Jiao, Adv. Funct. Mater., 2020, 30, 1910777 CrossRef CAS.
- A. J. Louli, A. Eldesoky, R. Weber, M. Genovese, M. Coon, J. deGooyer, Z. Deng, R. T. White, J. Lee, T. Rodgers, R. Petibon, S. Hy, S. J. H. Cheng and J. R. Dahn, Nat. Energy, 2020, 5, 693–702 CrossRef CAS.
- Z. Yu, P. E. Rudnicki, Z. W. Zhang, Z. J. Huang, H. Celik, S. T. Oyakhire, Y. L. Chen, X. Kong, S. C. Kim, X. Xiao, H. S. Wang, Y. Zheng, G. A. Kamat, M. S. Kim, S. F. Bent, J. Qin, Y. Cui and Z. N. Bao, Nat. Energy, 2022, 7, 94–106 CrossRef CAS.
- J. Y. Li, C. Lin, M. Y. Weng, Y. Qiu, P. H. Chen, K. Yang, W. Y. Huang, Y. X. Hong, J. Li, M. J. Zhang, C. Dong, W. G. Zhao, Z. Xu, X. Wang, K. Xu, J. L. Sun and F. Pan, Nat. Nanotechnol., 2021, 16, 599–605 CrossRef CAS PubMed.
- W. J. Xue, R. Gao, Z. Shi, X. H. Xiao, W. X. Zhang, Y. R. Zhang, Y. G. Zhu, I. Waluyo, Y. Li, M. R. Hill, Z. Zhu, S. Li, O. Kuznetsov, Y. M. Zhang, W. K. Lee, A. Hunt, A. Harutyunyan, Y. Shao-Horn, J. A. Johnson and J. Li, Energy Environ. Sci., 2021, 14, 6030–6040 RSC.
- B. Horstmann, J. Y. Shi, R. Amine, M. Werres, X. He, H. Jia, F. Hausen, I. Cekic-Laskovic, S. Wiemers-Meyer, J. Lopez, D. Galvez-Aranda, F. Baakes, D. Bresser, C. C. Su, Y. B. Xu, W. Xu, P. Jakes, R. A. Eichel, E. Figgemeier, U. Krewer, J. M. Seminario, P. B. Balbuena, C. M. Wang, S. Passerini, Y. Shao-Horn, M. Winter, K. Amine, R. Kostecki and A. Latz, Energy Environ. Sci., 2021, 14, 5289–5314 RSC.
- Y. J. Liu, X. Y. Tao, Y. Wang, C. Jiang, C. Ma, O. W. Sheng, G. X. Lu and X. W. Lou, Science, 2022, 375, 739 CrossRef CAS PubMed.
- Q. K. Zhang, S. Y. Sun, M. Y. Zhou, L. P. Hou, J. L. Liang, S. J. Yang, B. Q. Li, X. Q. Zhang and J. Q. Huang, Angew. Chem., Int. Ed., 2023, e202306889, DOI:10.1002/anie.202306889.
- Q.-K. Zhang, X.-Q. Zhang, J. Wan, N. Yao, T.-L. Song, J. Xie, L.-P. Hou, M.-Y. Zhou, X. Chen, B.-Q. Li, R. Wen, H.-J. Peng, Q. Zhang and J.-Q. Huang, Nat. Energy, 2023, 8, 725–735 CrossRef CAS.
- J. Xiao, Science, 2019, 366, 426–427 CrossRef CAS PubMed.
- L. Q. Zhang, T. T. Yang, C. C. Du, Q. N. Liu, Y. S. Tang, J. Zhao, B. L. Wang, T. W. Chen, Y. Sun, P. Jia, H. Li, L. Geng, J. Z. Chen, H. J. Ye, Z. F. Wang, Y. S. Li, H. M. Sun, X. M. Li, Q. S. Dai, Y. F. Tang, Q. M. Peng, T. D. Shen, S. L. Zhang, T. Zhu and J. Y. Huang, Nat. Nanotechnol., 2020, 15, 94 CrossRef CAS PubMed.
- S. J. Tan, W. P. Wang, Y. F. Tian, S. Xin and Y. G. Guo, Adv. Funct. Mater., 2021, 31, 2105253 CrossRef CAS.
- T. Li, X. Q. Zhang, P. Shi and Q. Zhang, Joule, 2019, 3, 2647–2661 CrossRef CAS.
- J.-L. Liang, S.-Y. Sun, N. Yao, Z. Zheng, Q.-K. Zhang, B.-Q. Li, X.-Q. Zhang and J.-Q. Huang, Sci. China: Chem., 2023 DOI:10.1007/s11426-023-1730-x.
- S. Y. Lang, Z. Z. Shen, X. C. Hu, Y. Shi, Y. G. Guo, F. F. Jia, F. Y. Wang, R. Wen and L. J. Wan, Nano Energy, 2020, 75, 104967 CrossRef CAS.
- G. X. Liu, J. Wan, Y. Shi, H. J. Guo, Y. X. Song, K. C. Jiang, Y. G. Guo, R. Wen and L. J. Wan, Adv. Energy Mater., 2022, 12, 2201411 CrossRef CAS.
- C. Yan, Y. X. Yao, X. Chen, X. B. Cheng, X. Q. Zhang, J. Q. Huang and Q. Zhang, Angew. Chem., Int. Ed., 2018, 57, 14055–14059 CrossRef CAS PubMed.
- Z. H. Piao, P. T. Xiao, R. P. Luo, J. B. Ma, R. H. Gao, C. Li, J. Y. Tan, K. Yu, G. M. Zhou and H. M. Cheng, Adv. Mater., 2022, 34, 2108400 CrossRef CAS PubMed.
- W. Zhang, Q. Wu, J. Huang, L. Fan, Z. Shen, Y. He, Q. Feng, G. Zhu and Y. Lu, Adv. Mater., 2020, 32, e2001740 CrossRef PubMed.
- J. Fu, X. Ji, J. Chen, L. Chen, X. Fan, D. Mu and C. Wang, Angew. Chem., Int. Ed., 2020, 59, 22194–22201 CrossRef CAS PubMed.
- N. Piao, S. Liu, B. Zhang, X. Ji, X. Fan, L. Wang, P.-F. Wang, T. Jin, S.-C. Liou, H. Yang, J. Jiang, K. Xu, M. A. Schroeder, X. He and C. Wang, ACS Energy Lett., 2021, 6, 1839–1848 CrossRef CAS.
- Y. Wen, J. Ding, Y. Yang, X. Lan, J. Liu, R. Hu and M. Zhu, Adv. Funct. Mater., 2021, 32, 2109377 CrossRef.
- H. C. Yang, Q. Y. Liu, Y. Z. Wang, Z. T. Ma, P. Tang, X. Y. Zhang, H. M. Cheng, Z. H. Sun and F. Li, Small, 2022, 18, 2202349 CrossRef CAS PubMed.
- D. Jin, Y. Roh, T. Jo, M. H. Ryou, H. Lee and Y. M. Lee, Adv. Energy Mater., 2021, 11, 2003769 CrossRef CAS.
- J. Y. Hwang, S. J. Park, C. S. Yoon and Y. K. Sun, Energy Environ. Sci., 2019, 12, 2174–2184 RSC.
- L. P. Hou, N. Yao, J. Xie, P. Shi, S. Y. Sun, C. B. Jin, C. M. Chen, Q. B. Liu, B. Q. Li, X. Q. Zhang and Q. Zhang, Angew. Chem., Int. Ed., 2022, 61, e202201406 CrossRef CAS PubMed.
- K. Wang, J. J. Wan, Y. X. Xiang, J. P. Zhu, Q. Y. Leng, M. Wang, L. M. Xu and Y. Yang, J. Power Sources, 2020, 460, 228062 CrossRef CAS.
- T. Fan, W. Kai, V. K. Harika, C. Liu, A. Nimkar, N. Leifer, S. Maiti, J. Grinblat, M. N. Tsubery, X. Liu, M. Wang, L. Xu, Y. Lu, Y. Min, N. Shpigel and D. Aurbach, Adv. Funct. Mater., 2022, 32, 2204972 CrossRef CAS.
- J. X. Liu, J. Q. Wang, Y. X. Ni, J. D. Liu, Y. D. Zhang, Y. Lu, Z. H. Yan, K. Zhang, Q. Zhao, F. Y. Cheng and J. Chen, Angew. Chem., Int. Ed., 2022, 61, e202207000 CrossRef CAS PubMed.
- X. R. Yang, C. W. Wang, P. F. Yan, T. P. Jiao, J. L. Hao, Y. Y. Jiang, F. C. Ren, W. G. Zhang, J. M. Zheng, Y. Cheng, X. S. Wang, W. Yang, J. P. Zhu, S. Y. Pan, M. Lin, L. Y. Zeng, Z. L. Gong, J. T. Li and Y. Yang, Adv. Energy Mater., 2022, 12, 2200197 CrossRef CAS.
- S. Mao, Z. Shen, W. Zhang, Q. Wu, Z. Wang and Y. Lu, Adv. Sci., 2022, 9, e2104841 CrossRef PubMed.
- Y.-S. Hong, X. Huang, C. Wei, J. Wang, J.-N. Zhang, H. Yan, Y. S. Chu, P. Pianetta, R. Xiao, X. Yu, Y. Liu and H. Li, Chem, 2020, 6, 2759–2769 CAS.
- W. Kong, J. Zhang, D. Wong, W. Yang, J. Yang, C. Schulz and X. Liu, Angew. Chem., Int. Ed., 2021, 60, 27102–27112 CrossRef CAS PubMed.
- J.-N. Zhang, Q. Li, C. Ouyang, X. Yu, M. Ge, X. Huang, E. Hu, C. Ma, S. Li, R. Xiao, W. Yang, Y. Chu, Y. Liu, H. Yu, X.-Q. Yang, X. Huang, L. Chen and H. Li, Nat. Energy, 2019, 4, 594–603 CrossRef CAS.
- N. Qin, Q. M. Gan, Z. F. Zhuang, Y. F. Wang, Y. Z. Li, Z. Q. Li, H. Iftikhar, C. Zeng, G. Y. Liu, Y. F. Bai, K. L. Zhang and Z. G. Lu, Adv. Energy Mater., 2022, 12, 2201549 CrossRef CAS.
- A. Fu, Z. F. Zhang, J. D. Lin, Y. Zou, C. D. Qin, C. J. Xu, P. F. Yan, K. Zhou, J. L. Hao, X. R. Yang, Y. Cheng, D. Y. Wu, Y. Yang, M. S. Wang and J. M. Zheng, Energy Storage Mater., 2022, 46, 406–416 CrossRef.
- L. L. Wang, J. Ma, C. Wang, X. R. Yu, R. Liu, F. Jiang, X. W. Sun, A. B. Du, X. H. Zhou and G. L. Cui, Adv. Sci., 2019, 6, 1900355 CrossRef PubMed.
- Q. Q. Liu, Z. R. Chen, Y. Liu, Y. R. Hong, W. N. Wang, J. H. Wang, B. Zhao, Y. F. Xu, J. W. Wang, X. L. Fan, L. S. Li and H. B. Wu, Energy Storage Mater., 2021, 37, 521–529 CrossRef.
- D. Ruan, M. Chen, X. Wen, S. Li, X. Zhou, Y. Che, J. Chen, W. Xiang, S. Li, H. Wang, X. Liu and W. Li, Nano Energy, 2021, 90, 106535 CrossRef CAS.
- C. C. Su, M. N. He, J. Y. Shi, R. Amine, Z. Yu, L. Cheng, J. C. Guo and K. Amine, Energy Environ. Sci., 2021, 14, 3029–3034 RSC.
- X. D. Ren, S. R. Chen, H. Lee, D. H. Mei, M. H. Engelhard, S. D. Burton, W. G. Zhao, J. M. Zheng, Q. Y. Li, M. S. Ding, M. Schroeder, J. Alvarado, K. Xu, Y. S. Meng, J. Liu, J. G. Zhang and W. Xu, Chem, 2018, 4, 1877–1892 CAS.
- X. D. Ren, L. F. Zou, X. Cao, M. H. Engelhard, W. Liu, S. D. Burton, H. Lee, C. J. Niu, B. E. Matthews, Z. H. Zhu, C. M. Wang, B. W. Arey, J. Xiao, J. Liu, J. G. Zhang and W. Xu, Joule, 2019, 3, 1662–1676 CrossRef CAS.
- Z. Sun, H. Zhou, X. Luo, Y. Che, W. Li and M. Xu, J. Power Sources, 2021, 503, 230033 CrossRef CAS.
- Y. W. Yan, S. T. Weng, A. Fu, H. T. Zhang, J. K. Chen, Q. Z. Zheng, B. D. Zhang, S. Y. Zhou, H. Yan, C. A. W. Wang, Y. L. Tang, H. Y. Luo, B. W. Mao, J. M. Zheng, X. F. Wang, Y. Qiao, Y. Yang and S. G. Sun, ACS Energy Lett., 2022, 7, 2677–2684 CrossRef CAS.
- P. B. Hong, M. Q. Xu, X. W. Zheng, Y. M. Zhu, Y. H. Liao, L. D. Xing, Q. M. Huang, H. P. Wan, Y. J. Yang and W. S. Li, J. Power Sources, 2016, 329, 216–224 CrossRef CAS.
- B. D. Adams, J. M. Zheng, X. D. Ren, W. Xu and J. G. Zhang, Adv. Energy Mater., 2018, 8, 1702097 CrossRef.
- S. Fang, L. Shen, S. Li, G. T. Kim, D. Bresser, H. Zhang, X. Zhang, J. Maier and S. Passerini, ACS Nano, 2019, 13, 9511–9519 CrossRef CAS PubMed.
- O. Lohrberg, S. Maletti, C. Heubner, M. Schneider and A. Michaelis, J. Electrochem. Soc., 2022, 169, 030543 CrossRef CAS.
- S. T. Oyakhire, H. Gong, Y. Cui, Z. Bao and S. F. Bent, ACS Energy Lett., 2022, 7, 2540–2546 CrossRef CAS.
- Z. J. Wang, Y. Y. Wang, C. Wu, W. K. Pang, J. F. Mao and Z. P. Guo, Chem. Sci., 2021, 12, 8945–8966 RSC.
Footnote |
| † Electronic supplementary information (ESI) available: Experimental section, NMR spectra, electrostatic potential and HOMO/LUMO energy levels, secondary ion maps, XPS profiles, more electrochemical results, and Tables S1 and S2, Videos S1 and S2. See DOI: https://doi.org/10.1039/d3sc04263d |
| This journal is © The Royal Society of Chemistry 2023 |