 Open Access Article
A collagen-immobilized nanodevice for in situ ratiometric imaging of cancer biomarkers in the tumor microenvironment†
Fengyu
Tian
 ,
Shurui
Zhou
 ,
Shiyi
Xie
,
Zhenhua
Zhang
,
Ling
Peng
,
Ling
Jiang
,
Zeyuan
Wang
,
Zhou
Nie
,
Shiyi
Xie
,
Zhenhua
Zhang
,
Ling
Peng
,
Ling
Jiang
,
Zeyuan
Wang
,
Zhou
Nie
 and
Yan
Huang
 *
*
State Key Laboratory of Chemo/Biosensing and Chemometrics, College of Chemistry and Chemical Engineering, Hunan Provincial Key Laboratory of Biomacromolecular Chemical Biology, Hunan University, Changsha, 410082, P. R. China. E-mail: yanhuang@hnu.edu.cn
First published on 3rd October 2023
Abstract
Monitoring the spatiotemporal dynamics of cancer biomarkers within the tumor microenvironment (TME) is critical to understanding their roles in tumorigenesis. Here, we reported a multifunctional fusion protein (collagen-binding domain and duck circovirus tag fused to mCherry, CBD-mCherry-DCV) capable of binding collagen with high affinity and covalently binding specific nucleic acids with exceptional efficiency. We then constructed a chimeric protein–nucleic acid nanodevice (CPNN) using CBD-mCherry-DCV and an aptamer-based sensing module to enable spatially controlled ratiometric imaging of cancer biomarkers in the TME. The collagen-anchoring module CBD-mCherry-DCV allowed specific immobilization of CPNN on 3D multicellular tumor spheroids, enabling the sensing module to achieve “off–on” fluorescence imaging of cancer biomarkers upon specific target recognition by an aptamer. Taking advantage of the constant fluorescence signal of mCherry and the activatable fluorescence response of Cy5 to specific cancer biomarkers, the detection sensitivity and reliability of CPNN were improved by self-calibrating the signal intensity. Specifically, CPNN enabled ratiometric fluorescence imaging of varying concentrations of exogenous PDGF-BB and ATP in tumor spheroids with a high signal-to-background ratio. Furthermore, it allowed the visual monitoring of endogenous PDGF-BB and ATP released from cells. Overall, this study demonstrates the potential of the nanodevice as a versatile approach for the visualization and imaging of cancer biomarkers in the TME.
Introduction
The tumor microenvironment (TME) is a highly complex physical and biochemical system.1,2 Due to their critical role in regulating cellular metabolism and intercellular communication, the dysregulated expression of various biomolecules in the TME is closely associated with tumor growth, invasion, and metastasis, making them valuable cancer biomarkers.3,4 However, tracking cancer biomarkers in the TME with high temporal and spatial resolution remains challenging for conventional assays, including flow cytometry, enzyme-linked immunosorbent assay, immunostaining, and mass spectrometry.5–7 Therefore, in situ imaging of cancer biomarkers with high resolution in the TME is urgently needed to study their functions in cancer biology and to facilitate early cancer diagnosis and treatment.The development of functional DNA-based cell surface sensors has opened new possibilities for in situ imaging of cancer biomarkers in the TME.8–13 Benefiting from the exceptional programmability and flexibility of functional DNA, these sensors enable the detection of various relevant information in the TME with high spatial resolution, including extracellular pH,14,15 metal ions,16 small molecules,17 and gaseous molecules.18,19 Despite remarkable progress, current approaches for cell surface localization imaging and biosensing within the TME typically depend on lipid-based membrane modification or chemical modification for cell surface engineering. Consequently, they suffer from a lack of cell selectivity, cellular internalization of signal probes, and interference with the biological function of membrane proteins.20–24 Furthermore, these conventional approaches generally rely on the absolute intensity-dependent signal readout, which can be influenced by various analyte-independent factors, leading to inaccurate sensing and imaging results.25 In contrast, ratiometric measurements can minimize nonspecific effects by self-calibrating the signal intensity, thereby increasing the sensitivity and reliability of detection.26–28 Nevertheless, developing a ratiometric fluorescent reporter for real-time monitoring and in situ imaging of cancer biomarkers in the TME remains a significant challenge due to the lack of molecular targeting tools with high affinity, stability, and versatility in the TME.
Collagen, an extracellular matrix protein, has recently emerged as a promising target in the TME due to its overexpression in various cancers.29–31 Under normal physiological conditions, collagen is insoluble and cannot penetrate most tissues due to the limited permeability of the vascular system. Conversely, in the TME, collagen becomes abnormally exposed to the bloodstream due to the hyperpermeability of the tumor vasculature.32,33 Based on this, Hubbell's group developed a series of simple engineered collagen-binding immunotherapies to improve safety and antitumor efficacy by utilizing the A3 collagen-binding domain (CBD) of von Willebrand factor (VWF) with a high affinity for collagen.34,35 Accordingly, a nanodevice using a collagen binding strategy shows significant potential for in situ imaging of biomarkers within the TME, while no related work has been reported.
Thus motivated, here we reported a novel multifunctional fusion protein CBD-mCherry-DCV (CmD) by genetic engineering and then constructed a chimeric protein-nucleic acid nanodevice (CPNN) for in situ ratiometric imaging of cancer biomarkers in the TME (Scheme 1). The proposed CmD consists of three functional units: (1) CBD as an anchoring element for binding collagen in the TME, (2) the HUH-endonuclease domain (duck circovirus, DCV) as a linking element for covalent coupling of protein and DNA, and (3) mCherry as an internal reference element for self-calibration.36,37 By employing DCV as a linker, we covalently conjugated the multifunctional CmD to the aptamer-designed DNA sensing module, thus conferring target recognition and signal-read-out capacity to CPNN. CPNN presented an “always on” reference fluorescence signal and an “activatable” fluorescence signal in response to cancer biomarkers. Subsequently, CPNN was able to efficiently bind collagen in the TME for in situ ratiometric imaging of cancer biomarkers. As a proof of concept, we selected PDGF-BB, one of the major pro-angiogenic factors induced by the necrotic and hypoxic TME in various malignancies, as an example.38,39 We demonstrated that the PDGF-BB-triggered CPNN (CPNNPDGF) enabled visual monitoring of varying concentrations of exogenous PDGF-BB and endogenous PDGF-BB released from cells in tumor spheroids. High accuracy and sensitivity were achieved by benefiting from the colocalization of the nanodevice and the target molecule and the self-calibration of the ratiometric signal. Significantly, replacing the aptamer with others can expand the nanodevice to be a promising platform for detecting different tumor-associated markers in the TME. An ATP-responsive CPNN (CPNNATP) enabling ratiometric fluorescence imaging of ATP in tumor spheroids with a high signal-to-background ratio was fabricated. Moreover, unlike localization on the cell surface, CPNN binding to collagen prevented internalization into cells and kept it in the TME for efficient detection.40 Therefore, this method provides an effective tool for the in-depth study and in situ imaging of cancer biomarkers in the TME.
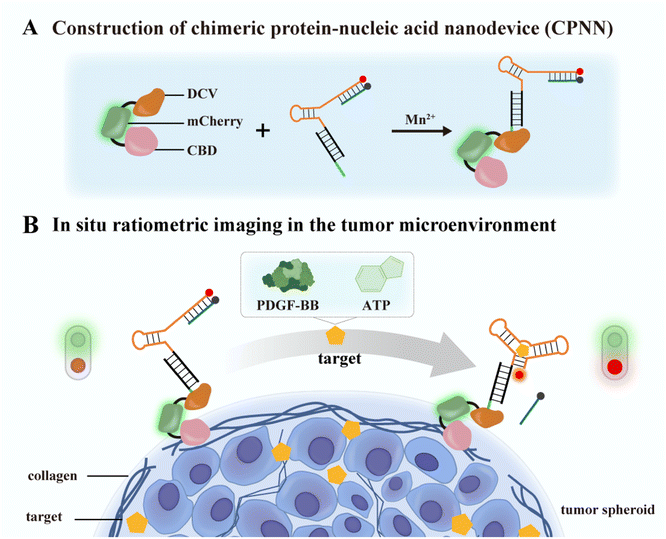 | ||
| Scheme 1 Schematic showing the working principle of a collagen-immobilized nanodevice for in situ fluorescence imaging of cancer biomarkers in the TME. | ||
Results and discussion
Preparation and characterization of the fusion protein CmD
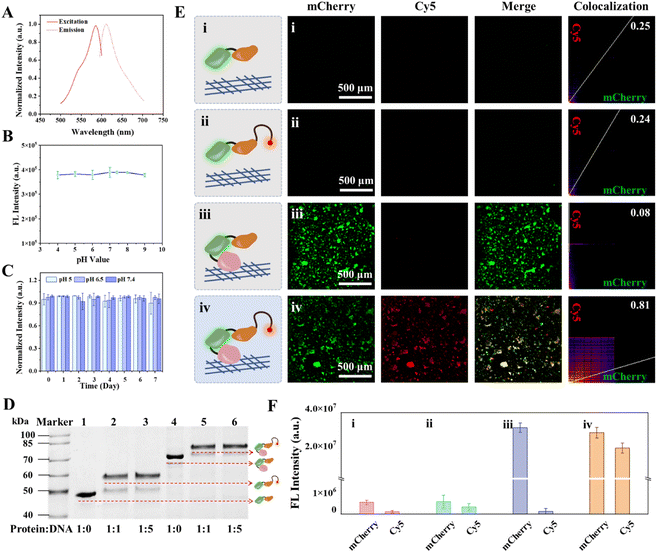
The multifunctional fusion protein CBD-mCherry-DCV (CmD) was designed and biosynthesized using the E. coli expression system. The structural details of CmD are described in Fig. S1 and S2.† This fusion protein contained a CBD domain with a high affinity for collagen,33 a fluorescent protein domain for self-calibration, and a HUH-endonuclease domain (DCV) for efficient protein–DNA covalent binding.41 Among these, the fluorescent protein domain can be flexibly designed according to experimental requirements, and mCherry was chosen in this study due to its low intracellular background during cell imaging. In addition, glycine–serine (GlySer) linkers are introduced between different domains in the fusion protein to minimize inter-domain interactions.42The molecular weight and optical properties of the obtained fusion proteins CmD and mCherry-DCV (mD, used as a control protein) were analyzed by SDS-polyacrylamide gel electrophoresis (SDS-PAGE) and fluorescence spectroscopy. As expected, CmD was of high purity with a molecular weight of approximately 65 kDa, and the control protein mD had a molecular weight of approximately 46 kDa (Fig. S3†), which agreed with the calculated theoretical protein sizes. Both CmD and mD exhibited the same excitation (580 nm) and emission (610 nm) wavelengths as mCherry, suggesting the minimal influence of the N- and C-terminal connexins on the fluorescence properties of mCherry (Fig. 1A and S4†). The stability of CmD in different physiological environments was further studied. Fig. 1B demonstrates that the fluorescence intensity of CmD remained constant over a range of pH values (4–9). This pH stability can be attributed to the distinctive barrel shape of mCherry, which protects the chromophore.43 Furthermore, CmD maintained a steady fluorescence intensity over a week in different simulated physiological or pathological pH, such as pH 5.0 for lysosomes, pH 6.5 for the TME, and pH 7.4 for the normal tissues (Fig. 1C). CmD exhibited excellent fluorescence stability over a wide pH range and for prolonged periods of time, providing a significant advantage in tumor imaging applications.
By incorporating the CBD and DCV domains, CmD exhibited remarkable bispecificity, enabling it to bind collagen in the TME and link to nucleic acids covalently. The bispecificity of the obtained CmD was investigated by SDS-PAGE and fluorescence imaging. Gel shift analysis demonstrated that when incubated with a single-stranded DNA containing the DCV-specific recognition sequence (ssDNADCV), both CmD and mD formed a covalent adduct (CmD-ssDNADCV) with ssDNADCV in the presence of Mn2+, respectively (Fig. 1D). In addition, good conjugation was achieved with a 1![[thin space (1/6-em)]](https://www.rsc.org/images/entities/char_2009.gif) :
:![[thin space (1/6-em)]](https://www.rsc.org/images/entities/char_2009.gif) 1 ratio of the fusion protein to ssDNADCV, consistent with the results reported in the literature.36 The conjugation reaction is rapid and efficient, resembling click chemistry-like biochemical reactions under physiological conditions, and has the potential for versatile one-pot labeling.41 Notably, due to the stable covalent bond between DCV and ssDNADCV, CmD-ssDNADCV showed satisfactory stability (Fig. S5†). This stability is a foundation for future sensing and imaging applications. The collagen-dependent anchoring performance of CmD was then evaluated on the collagen-coated or the collagen-free 96-microwell plate. A clear change in the mCherry signal was observed in the collagen-coated wells after incubation with CmD for 30 min, followed by a gradual increase in the fluorescence signal with prolonged incubation (Fig. S6 and S7,† pseudo green). In contrast, the collagen-free well showed a negligible signal (Fig. S6†). Moreover, both collagen-coated and collagen-free wells showed minimal fluorescence after MD treatment (Fig. 1E, F and S6†), confirming that the observed fluorescence resulted from CBD-mediated anchoring. Importantly, CmD demonstrated stable anchoring on collagen for at least 4 hours under our experimental conditions (Fig. S8†). To illustrate the bispecificity of CmD more intuitively, we prepared the covalent adducts (CmD-ssDNADCV-Cy5 and mD-ssDNADCV-Cy5) by conjugating a Cy5-labeled ssDNADCV (ssDNADCV-Cy5) to the fusion proteins. Subsequently, the adducts were incubated in the collagen-coated wells and subjected to fluorescence imaging, respectively. Fig. 1E and F illustrate that the collagen-coated well incubated with CmD-ssDNADCV-Cy5 exhibited bright fluorescence in the mCherry and Cy5 (pseudo red) channels. Notably, these two signals presented a positive correlation with incubation time and showed a significant colocalization with a Pearson's correlation coefficient (PC) of 0.81 (Fig. 1E and S9†). Conversely, the control well treated with mD-ssDNADCV-Cy5 did not exhibit discernible mCherry or Cy5 signals. These results confirmed that the fusion protein CmD possesses the functions we designed, including high-affinity binding to collagen and efficient conjugation to single-stranded DNA. As a dual high-affinity “bridge” protein, CmD opens new possibilities for in situ imaging of targets in the TME.
1 ratio of the fusion protein to ssDNADCV, consistent with the results reported in the literature.36 The conjugation reaction is rapid and efficient, resembling click chemistry-like biochemical reactions under physiological conditions, and has the potential for versatile one-pot labeling.41 Notably, due to the stable covalent bond between DCV and ssDNADCV, CmD-ssDNADCV showed satisfactory stability (Fig. S5†). This stability is a foundation for future sensing and imaging applications. The collagen-dependent anchoring performance of CmD was then evaluated on the collagen-coated or the collagen-free 96-microwell plate. A clear change in the mCherry signal was observed in the collagen-coated wells after incubation with CmD for 30 min, followed by a gradual increase in the fluorescence signal with prolonged incubation (Fig. S6 and S7,† pseudo green). In contrast, the collagen-free well showed a negligible signal (Fig. S6†). Moreover, both collagen-coated and collagen-free wells showed minimal fluorescence after MD treatment (Fig. 1E, F and S6†), confirming that the observed fluorescence resulted from CBD-mediated anchoring. Importantly, CmD demonstrated stable anchoring on collagen for at least 4 hours under our experimental conditions (Fig. S8†). To illustrate the bispecificity of CmD more intuitively, we prepared the covalent adducts (CmD-ssDNADCV-Cy5 and mD-ssDNADCV-Cy5) by conjugating a Cy5-labeled ssDNADCV (ssDNADCV-Cy5) to the fusion proteins. Subsequently, the adducts were incubated in the collagen-coated wells and subjected to fluorescence imaging, respectively. Fig. 1E and F illustrate that the collagen-coated well incubated with CmD-ssDNADCV-Cy5 exhibited bright fluorescence in the mCherry and Cy5 (pseudo red) channels. Notably, these two signals presented a positive correlation with incubation time and showed a significant colocalization with a Pearson's correlation coefficient (PC) of 0.81 (Fig. 1E and S9†). Conversely, the control well treated with mD-ssDNADCV-Cy5 did not exhibit discernible mCherry or Cy5 signals. These results confirmed that the fusion protein CmD possesses the functions we designed, including high-affinity binding to collagen and efficient conjugation to single-stranded DNA. As a dual high-affinity “bridge” protein, CmD opens new possibilities for in situ imaging of targets in the TME.
CPNNPDGF-based PDGF-BB sensing in solution
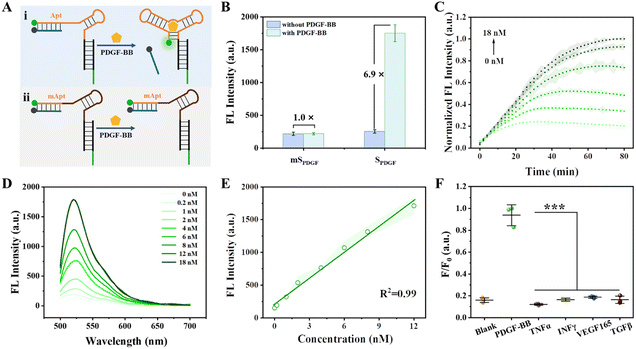
Tumor cells often secrete various growth factors and cytokines as signalling molecules to influence host cells, predominantly promoting tumor growth and metastasis.38 Notably, PDGF-BB and PDGFR-β are integral components of the ligand tyrosine kinase receptor system, critically involved in angiogenesis and blood vessel formation.39,44 PDGF-BB plays a critical role in establishing an immunosuppressive TME.45,46 Here, we first developed a PDGF-BB-responsive CPNN as a proof of concept. A sensing module (SPDGF) was designed based on the structural switching of the aptamer of PDGF-BB. SPDGF comprises three partially complementary strands, a FAM-labeled PDGF-BB aptamer strand (Apt-FAM), a quencher-modified strand (cDNA-BHQ1) that can complement the 5′ terminal sequence of Apt-FAM, and a DCV-specific recognition sequence-containing strand (cDNADCV) that can complete the 3′ terminal sequence of Apt-FAM (Fig. S10†). After SPDGF was prepared through hybridization, it was covalently bound to CmD to obtain CPNNPDGF (Scheme 1).The capability of the proposed SPDGF to detect PDGF-BB in the buffer was first investigated (Fig. 2A). As expected, SPDGF exhibited a low fluorescent background in the buffer (Fig. 2B), suggesting the successful assembly and the efficient Förster resonance energy transfer between FAM and the quencher. In the presence of PDGF-BB, there was an approximately 6.9-fold increase in fluorescence intensity, which indicated that the specific binding of PDGF-BB to its aptamer led to the release of cDNA-BHQ1 and fluorescence recovery. Some specific nucleotides in the aptamer sequence were mutated (mApt-FAM) to generate mSPDGF as a control. For mSPDGF, no obvious increase in fluorescence intensity was detected before and after the addition of PDGF-BB, thereby confirming the essential role of the aptamer sequence in the sensing module. In addition, the fluorescence characteristics of SPDGF were further explored by quantifying its relative fluorescence quantum yield (Φ) both before and after incubation with PDGF-BB. As shown in Table S5,† the relative fluorescence quantum yield of SPDGF was significantly increased after incubation with PDGF-BB. These data demonstrated the capability of SPDGF to detect PDGF-BB with high sensitivity and selectivity.
After optimizing the SPDGF sequence, concentration, and buffer (Fig. S11–S13†), we further evaluated the analytical performance of SPDGF for PDGF-BB detection. Real-time fluorescence analysis showed that the fluorescence intensity of the PDGF-BB-treated SPDGF increased continuously with incubation time, reaching an almost plateau level within approximately 60 min (Fig. 2C). As depicted in Fig. 2D, the fluorescence signal increased with increasing PDGF-BB concentrations. It exhibited a linear relationship in the concentration range of 0.2–12 nM with a detection limit of 0.1 nM (3σ/slope, Fig. 2E). It is noteworthy that the designed SPDGF can detect PDGF-BB levels ranging from several hundred pM to low nM levels, which is in good agreement with the concentration of PDGF-BB observed in serum (0.4–0.7 nM under physiological conditions and higher under pathological conditions such as tumors).47,48 Furthermore, only PDGF-BB can increase the fluorescence intensity of SPDGF compared to other cytokines, indicating the high selectivity of SPDGF towards PDGF-BB (Fig. 2F).
The excellent sensing performance of SPDGF encouraged us to investigate the viability of CPNNPDGF as a ratiometric sensing probe for PDGF-BB monitoring. As shown in Fig. S14A,†CPNNPDGF consisted of a CmD-based localization module and a SPDGF-based sensing module. Specifically, the FAM signal in SPDGF offers a PDGF-BB concentration-dependent detection signal, and the mCherry signal in the localization module worked as a reference signal. As expected, the FAM signal of CPNNPDGF gradually increased in the presence of PDGF-BB, whereas the fluorescence intensity of mCherry remained stable (Fig. S14B and C†). Additionally, similar trends were observed in the measurements of relative fluorescence quantum yields of FAM and mCherry in the SPDGF (Table S5†). Meanwhile, the ratiometric signal FFAM/FmCherry increased linearly with the concentration of PDGF-BB ranging from 0.2 to 10 nM, with a detection limit as low as 0.06 nM. Despite achieving a comparable linear range and detection limit, the ratiometric CPNNPDGF exhibits enhanced reliability attributed to its self-calibration capability. Further, we assessed the photostability of the proposed CPNNPDGF following its incubation with PDGF-BB. As shown in Fig. S15,† the fluorescence intensity of FAM in CPNNPDGF remained relatively stable even after 1 hour and exhibited a decrease of 30% after 3 hours of irradiation, while the fluorescence intensity of mCherry remained almost unchanged. Notably, enhanced photostability of CPNN can be achieved by adopting more durable fluorescent dyes, such as Cy5. Together, these results demonstrate the high potential of CPNNPDGF for detecting PDGF-BB in complex environments.
CPNNPDGF-based PDGF-BB imaging in the collagen-coated plates
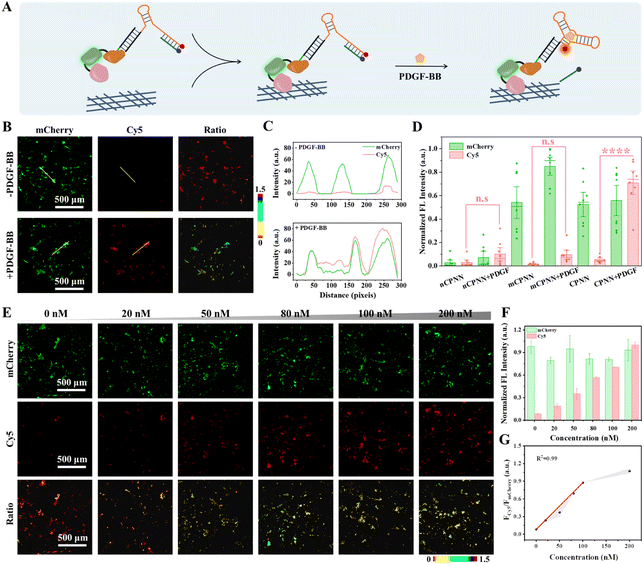
Before in situ monitoring of PDGF-BB in the TME, we first evaluated the response of CPNNPDGF to PDGF-BB in the collagen-coated 96-microwell plate by fluorescence imaging, utilizing a Cy5-labeled SPDGF (Fig. 3A). Fig. 3B and C depict that, after treatment of CPNNPDGF, the collagen-coated wells exhibited bright mCherry fluorescence signals, indicating the efficient binding of CPNNPDGF to collagen. Further incubation with PDGF-BB resulted in a significant increase in the Cy5 signal, which colocalized well with the mCherry signal. The ratiometric signal (FCy5/FmCherry) was calculated as approximately 1.27 by dividing the fluorescence intensity of Cy5 by that of mCherry (Fig. 3D). In comparison, although the control group mCPNNPDGF (constructed by coupling CmD and mSPDGF) can immobilize the collagen-coated wells, there was no obvious Cy5 fluorescence signal upon the addition of PDGF, indicating the critical role of the aptamer-mediated target recognition in the nanodevice (Fig. S16†).Next, the ability of CPNNPDGF for semiquantitative analysis of PDGF-BB at the interface was evaluated. The collagen-coated wells were pretreated with CPNNPDGF, followed by washing and subsequent incubation with PBS-HSA buffers containing different concentrations of PDGF-BB. As shown in Fig. 3E and F, the fluorescence signal of Cy5 gradually increased with the increasing concentration of adscititious PDGF-BB, while the signal of mCherry remained relatively stable. The ratiometric signal FCy5/FmCherry was calculated using ImageJ software and showed a concentration-dependent pattern in response to PDGF-BB concentration ranging from 0 to 200 nM. Moreover, the collagen-coated well treated with 200 nM of PDGF-BB exhibited a ratiometric signal approximately 10-fold higher than that of the untreated collagen-coated well (Fig. 3G). Therefore, the CBD-based collagen binding did not affect the PDGF-BB sensing capacity of CPNNPDGF. The ratiometric signal with an excellent signal-to-noise ratio indicated both the reliability and sensitivity of CPNNPDGF for the detection of PDGF-BB at the interface. In combination, CPNNPDGF exhibited a satisfactory imaging capability and allowed semi-quantitative detection of PDGF-BB after immobilization with collagen.
Expression and binding of collagen in the tumor spheroids
Encouraged by the fluorescence imaging outcomes on the collagen-coated plates, we wanted to know whether CPNN can immobilize the TME through collagen binding. Three-dimensional (3D) multicellular tumor spheroid models serve as an intermedia model bridging the gap between in vitro and in vivo systems and have attracted considerable interest from the scientific community.49 Rather than the traditional 2D culture system, tumor spheroids, which contain the complex and dynamic intercellular communication and cell–matrix interactions inherent to cancer metastasis, more closely mimic the TME of tumor growth and progression, providing a comprehensive understanding of the fundamental characteristics of tumor tissues and the complexities of cancer metastasis.50–52 Therefore, using tumor spheroids as a model provides an opportunity for in situ imaging of cancer biomarkers within the TME and a deep understanding of the biological mechanisms of these cancer biomarkers in cancer progression.Before CPNN binding, the presence of collagen in the TME of MCF-7 (a breast cancer cell) tumor spheroids was investigated through immunofluorescence staining. Fig. S17† demonstrates that after the MCF-7 tumor spheroid was treated with the rabbit anti-collagen antibody and the Alex Fluor 594 labeled goat anti-rabbit IgG, there was obvious red fluorescence around the spheroids. It is consistent with the literature that abundant collagen is present in the TME of tumor spheroids.53,54 When the tumor spheroids were mixed with the fusion proteins, only those incubated with the fusion protein containing CBD (CmD) showed a prominent mCherry signal. Furthermore, the tumor spheroids incubated with CmD-ssDNADCV-Cy5 exhibited the mCherry and Cy5 signals with a high PC of 0.97 (Fig. S18†). This correlation suggests the effective coupling of DCV to nucleic acid and the efficient immobilization of the fusion protein and the nanodevice on the tumor spheroids through collagen binding, providing a robust basis for CPNN-based detection of the biomarker in the TME.
CPNNPDGF-based PDGF-BB imaging in the TME of tumor spheroids
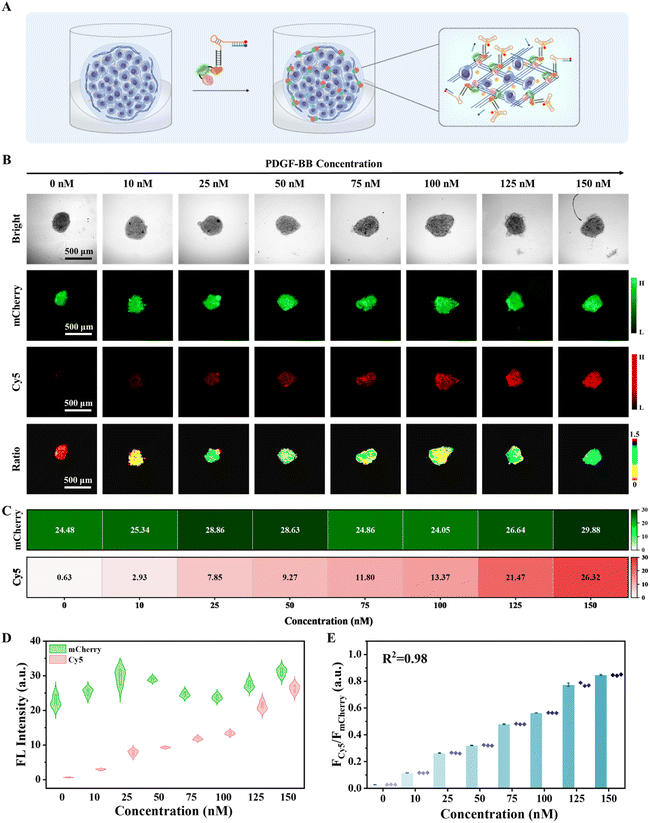
The TME is a highly intricate physical and biochemical system that comprises a multitude of cancer biomarkers intimately linked to tumor growth, invasion, and metastasis.3,4 Based on the promising fluorescence imaging results obtained in collagen-coated microplates and efficient immobilization of the chimeric protein-nucleic acid in the tumor spheroids, we investigated the sensing capability of CPNNPDGF in the complex TME of MCF-7 tumor spheroids. First, the biocompatibility of the fusion protein CmD and the nanodevice CPNNPDGF was assessed using the CCK-8 method. It was found that incubation with different concentrations of CmD and CPNNPDGF for different durations did not obviously change the viability of MCF-7 cells under the experimental conditions (Fig. S19 and S20†). Encouraged by favourable biocompatibility, we then evaluated the feasibility of CPNNPDGF for sensing and imaging PDGF-BB in MCF-7 tumor spheroids (Fig. 4A). The tumor spheroids incubated with CPNNPDGF emitted a clear mCherry signal. The addition of PDGF-BB largely increased the signal from the Cy5 channel, which colocalized well with the mCherry signal. Ratiometric fluorescence imaging and FCy5/FmCherry analysis further confirmed that the tumor spheroids pretreated with CPNNPDGF exhibited a clear ratiometric fluorescence signal upon exposure to PDGF-BB, resulting in a significant increase in FCy5/FmCherry values from 0.03 to 1.21 (Fig. S21†). In contrast, the Cy5 fluorescence signal of the tumor spheroids in the mCPNNPDGF group was negligible due to the low affinity between mSPDGF and PDGF-BB. These results collectively indicate that CPNNPDGF anchored to the tumor spheroids retains its ability to respond to PDGF-BB.Further, the analytical performance of CPNNPDGF for PDGF-BB sensing and imaging in tumor spheroids was assessed. The tumor spheroids pre-treated with CPNNPDGF were incubated with different concentrations of PDGF-BB, and imaging was performed after 1 hour of incubation (Fig. 4B). Consistent with the findings at the interface of the 96-microwell plate, as the concentrations of PDGF-BB gradually increased from 0 to 150 nM, the fluorescence intensity of mCherry on the tumor spheroids remained relatively stable, whereas the fluorescence intensity of Cy5 exhibited a significant increase (Fig. 4C). However, as shown by the change in the mCherry signal, the signal fluctuation among the tumor spheroids was obvious, and the linear relationship between the Cy5 signal and the PDGF-BB concentration was not particularly good (R2 = 0.95) (Fig. 4D and S22†). Conversely, using mCherry as a reference signal, the ratiometric signal FCy5/FmCherry exhibited a better concentration-dependent increase (R2 = 0.98) within the PDGF-BB concentration range of 0–150 nM. The detection limit for PDGF-BB in tumor spheroids was determined to be 0.16 nM based on the quantitative results obtained through fluorescence imaging (3σ/slope, Fig. 4E), which was slightly higher than the detection limit in solution (0.06 nM). Notably, the extracellular concentration of PDGF-BB in the TME often exceeds those in serum (0.4–0.7 nM under physiological conditions and higher under pathological conditions) due to enrichment in the local microenvironment, and falls well within the detectable range of the proposed CPNNPDGF.47,48 The self-calibration capability of the fluorescence signals improved the accuracy of the proposed method. Therefore, the nanodevice CPNNPDGF has the potential to be an effective tool for in situ semi-quantitative imaging of PDGF-BB in tumor spheroids.
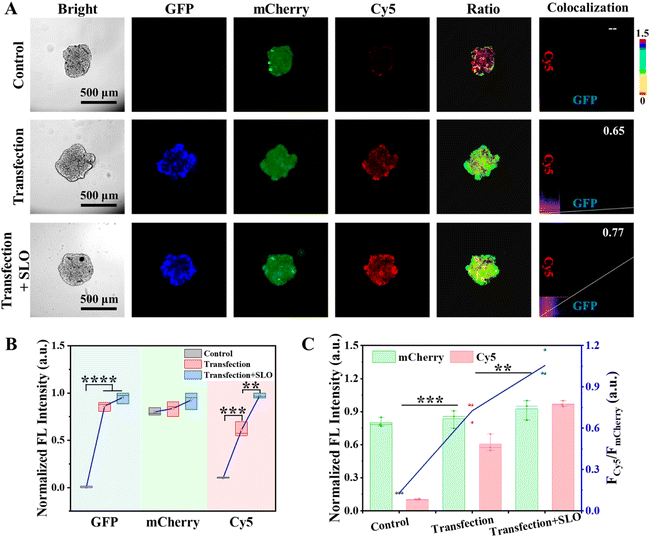
Given the pivotal role of PDGF-BB in the progression of numerous solid tumors, endogenous PDGF-BB in the TME was monitored using CPNNPDGF. To mimic the endogenic production and release of PDGF-BB, a construct pCMV3-pdgf-gfp containing the fusion gene of the GFP-tagged human PDGF-BB was transiently transfected into the cells, and the tumor spheroids using Lipofectamine™ 8000 transfection reagent, respectively. It was found that both the 2D cultured MCF-7 cells and the 3D tumor spheroids emitted bright green fluorescence, which indicated the successful expression of PDGF-BB in the cells (Fig. S23†). We then used CPNNPDGF to monitor the endogenic PDGF-BB within the tumor spheroids. Streptolysin O (SLO), a member of cytolysins that can bind to eukaryotic cells and promote cytolysis by forming transmembrane pores, was used to release PDGF-BB. At this time, we utilized the “always on” fluorescence of mCherry to track the anchoring of CPNNPDGF on tumor spheroids, the “always on” fluorescence of GFP to label the expression and localization of PDGF-BB, and the “activated” fluorescence of Cy5 to monitor the secretion and release of PDGF-BB. As expected, the fluorescence signals of mCherry were detected in all groups, and only the transfection groups exhibited GFP signals (Fig. 5A and B). While a weak Cy5 signal was detected around the un-transfected tumor spheroids, a significant increase of the Cy5 signal with an FCy5/FmCherry of 0.73 was observed in the transfected group (Fig. 5), which was comparable to that of the 125 nM PDGF-BB-treated group in Fig. 4E. Considering that CPNNPDGF was anchored on collagen in the TME, this bright Cy5 signal suggested that PDGF-BB was released from the cells, just like other cytokines. Furthermore, the fluorescence of Cy5 was enhanced by approximately 1.6 times following SLO treatment with an FCy5/FmCherry of 1.06 (Fig. 5), suggesting that the addition of SLO potentially facilitated the release of PDGF-BB by inducing cell membrane perforation, which was consistent with the literature.17 Notably, the Cy5 signal of CPNNPDGF exhibited excellent overlap not only with the mCherry signal but also with the GFP signal of the secreted PDGF-BB (PC > 0.65), indicating the ability of our method to monitor both the expression level and localization of PDGF-BB (Fig. 5A). These results suggested that CPNNPDGF could successfully monitor PDGF-BB levels in tumor spheroids, indicating its potential as a valuable tool for cancer diagnosis and evaluation of therapeutic approaches.
Expanding the strategy for in situ imaging of ATP in the TME
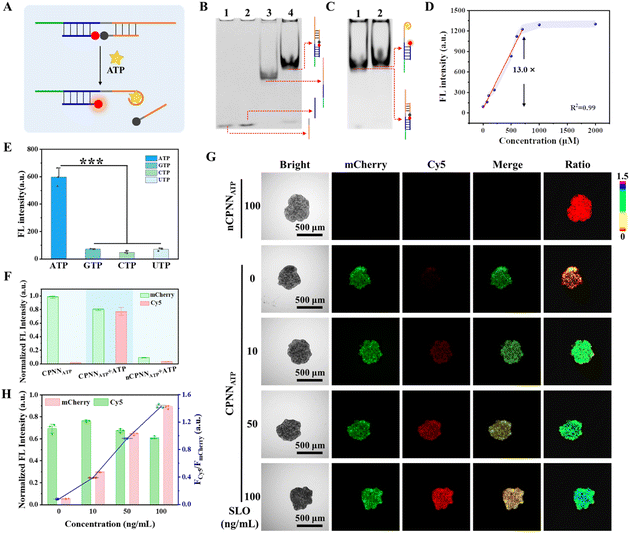
As a modularized nanodevice, CPNN has the potential to detect other targets in situ by simply changing the aptamer of the sensing module. Given its pivotal role in cellular metabolism and regulation, ATP, as a typical cancer biomarker, was selected as another target to evaluate the expandability of CPNN.55,56 We first designed a sensing module specifically responsive to ATP (SATP, Fig. 6A and S24†). The assembly of SATP and its ability to bind ATP were confirmed by PAGE analysis (Fig. 6B and C), and its feasibility for ATP detection was further demonstrated by fluorescence spectrum measurements. As shown in Fig. S25† and 6D, the fluorescence signal of Cy5 exhibited a linear correlation with the ATP concentration, and the calibration curve for the ATP assay shows linearity in the concentration range of 50–700 μM, with a detection limit of 10 μM (3σ/slope). Due to the high specificity of the aptamer for the target, this SATP exhibited unique selectivity for ATP (Fig. 6E and S26†). After confirming the high biocompatibility of CPNNATP under the experimental conditions (Fig. S27†), the feasibility of CPNNATP for sensing and imaging ATP in the tumor spheroids was assessed through fluorescence imaging. As depicted in Fig. 6F, a strong Cy5 signal from the immobilized CPNNATP was detected within the tumor spheroids in the presence of ATP. Endogenous ATP released during cellular necrosis was further detected. Here, the tumor spheroids anchored with CPNNATP were treated with different concentrations of SLO for 1 hour before fluorescence imaging. As expected, the fluorescence signal of Cy5 and the resulting ratiometric signal FCy5/FmCherry increased sensitively with the increasing SLO concentration (Fig. 6F–H). In contrast, the control nCPNNATP (mD-SATP) showed a weak fluorescent signal even in the presence of high concentrations of SLO due to the absence of the CBD anchor unit. Together, these data demonstrate the promising performance of CPNNATP for in situ imaging of ATP in the tumor spheroids and present the flexible design of this chimeric protein-nucleic acid nanodevice for in situ detection of different targets.Conclusions
In summary, we designed a versatile chimeric protein–nucleic acid nanodevice (CPNN) consisting of a multifunctional fusion protein CmD and an aptamer-based sensing module. CPNN can be specifically anchored on collagen, enabling sensitive and accurate in situ ratiometric imaging of exogenous and endogenous PDGF-BB in the tumor spheroids. Notably, we also validated the efficacy of this approach for spatiotemporal imaging of ATP in the tumor spheroids by substituting the sensing module with an ATP-responsive one. To our knowledge, this is the first example of a collagen-binding chimeric protein-nucleic acid reporter for ratiometric imaging of cancer biomarkers in the TME.CPNN in this study offers several advantages: (i) DCV-based efficient coupling between the sensing module and the protein module endows CPNN with the dual advantages of both protein and nucleic acid; (ii) it uses the high affinity of CBD for collagen to achieve specific and stable in situ anchoring, enabling the co-localization of the nanodevice for intuitive and precise visualization and monitoring of critical information in the TME; (iii) the design of the aptamer-based sensing module makes it possible to expand the range to various biomarkers; (iv) the ratiometric fluorescence design results in improved accuracy. We believe that this straightforward yet potent approach offers a versatile imaging platform capable of elucidating the biological functions of cancer biomarkers in the TME and being valuable for early cancer diagnosis and therapeutic applications.
Data availability
All data required to evaluate the conclusions are present in the paper and/or ESI.†Author contributions
F. Tian, Y. Huang, and Z. Nie proposed the idea, designed the experiments, and revised the manuscript. F. Tian performed experimental work and wrote the manuscript. S. Zhou, S. Xie, and Z. Zhang performed most assays. L. Peng, L. Jiang, and Z. Wang assisted in plasmid construction, protein expression, and purification. All authors contributed to the manuscript.Conflicts of interest
The author(s) declare that they have no competing interests.Acknowledgements
This work was supported by the National Key R&D Program of China (2021YFA0910100), the National Natural Science Foundation of China (22074034, 22034002, 22274041, and 22204047), and the Fundamental Research Funds for the Central Universities.Notes and references
- D. F. Quail and J. A. Joyce, Nat. Med., 2013, 19, 1423–1437 CrossRef CAS PubMed.
- S. Sanegre, F. Lucantoni, R. Burgos-Panadero, L. de La Cruz-Merino, R. Noguera and T. Álvaro Naranjo, Cancers, 2020, 12, 1677 CrossRef CAS PubMed.
- S. Wang, W. X. Ren, J. T. Hou, M. Won, J. An, X. Y. Chen, J. Shu and J. S. Kim, Chem. Soc. Rev., 2021, 50, 8887–8902 RSC.
- X. Li, P. Ramadori, D. Pfister, M. Seehawer, L. Zender and M. Heikenwalder, Nat. Rev. Cancer, 2021, 21, 541–557 CrossRef CAS PubMed.
- M. Gullberg, S. M. Gústafsdóttir, E. Schallmeiner, J. Jarvius, M. Bjarnegård, C. Betsholtz, U. Landegren and S. Fredriksson, Proc. Natl. Acad. Sci. U. S. A., 2004, 101, 8420–8424 CrossRef CAS PubMed.
- N. Cohen, P. Sabhachandani, A. Golberg and T. Konry, Biosens. Bioelectron., 2015, 66, 454–460 CrossRef CAS PubMed.
- H. M. Da, H. Y. Liu, Y. N. Zheng, R. Yuan and Y. C. Chai, Biosens. Bioelectron., 2018, 101, 213–218 CrossRef CAS PubMed.
- C. M. Cao, F. Y. Zhang, E. M. Goldys, F. Gao and G. Z. Liu, Advances in structure-switching aptasensing towards real time detection of cytokines, TrAC, Trends Anal. Chem., 2018, 102, 379–396 CrossRef CAS.
- A. L. Chen, M. M. Yan and S. M. Yang, TrAC, Trends Anal. Chem., 2016, 80, 581–593 CrossRef CAS.
- H. R. Jia, Y. X. Zhu, Q. Y. Duan and F. G. Wu, Chem. Soc. Rev., 2021, 50, 6240–6277 RSC.
- S. Shi, J. Chen, X. W. Wang, M. S. Xiao, A. R. Chandrasekaran, L. Li, C. Q. Yi and H. Pei, Adv. Funct. Mater., 2022, 32, 2201069 CrossRef CAS.
- L. L. Chen, Y. F. Lyu, X. Zhang, L. T. Zheng, Q. Q. Li, D. Ding, F. M. Chen, Y. H. Liu, W. Li, Y. T. Zhang, Q. L. Huang, Z. Q. Wang, T. T. Xie, Q. Zhang, Y. Y. Sima, K. Li, S. Xu, T. B. Ren, M. Y. Xiong, Y. Wu, J. B. Song, L. Yuan, H. H. Yang, X. B. Zhang and W. H. Tan, Sci. China: Chem., 2023, 66, 1336–1383 CrossRef CAS.
- Y. X. Zhao, X. L. Zuo, Q. Li, F. Chen, Y. R. Chen, J. Q. Deng, D. Han, C. L. Hao, F. J. Huang, Y. Y. Huang, G. L. Ke, H. Kuang, F. Li, J. Li, M. Li, N. Li, Z. Y. Lin, D. B. Liu, J. W. Liu, L. B. Liu, X. G. Liu, C. H. Lu, F. Luo, X. H. Mao, J. S. Sun, B. Tang, F. Wang, J. B. Wang, L. H. Wang, S. Wang, L. L. Wu, Z. S. Wu, F. Xia, C. L. Xu, Y. Yang, B. F. Yuan, Q. Yuan, C. Zhang, Z. Zhu, C. Y. Yang, X. B. Zhang, H. H. Yang, W. H. Tan and C. H. Fan, Sci. China: Chem., 2021, 64, 171–203 CrossRef CAS PubMed.
- L. Li, Y. Jiang, C. Cui, Y. Yang, P. H. Zhang, K. Stewart, X. S. Pan, X. W. Li, L. Yang, L. P. Qiu and W. H. Tan, J. Am. Chem. Soc., 2018, 140, 13335–13339 CrossRef CAS PubMed.
- Y. Zhou, Y. Zhuo, R. Peng, Y. Zhang, Y. Du, Q. Zhang, Y. Sun and L. Qiu, Sci. China: Chem., 2021, 64, 1817–1825 CrossRef CAS.
- L. P. Qiu, T. Zhang, J. H. Jiang, C. C. Wu, G. Z. Zhu, M. X. You, X. G. Chen, L. Q. Zhang, C. Cui, R. Q. Yu and W. H. Tan, J. Am. Chem. Soc., 2014, 136, 13090–13093 CrossRef CAS PubMed.
- Z. H. Di, J. Zhao, H. Q. Chu, W. T. Xue, Y. L. Zhao and L. L. Li, Adv. Mater., 2019, 31, 1901885 CrossRef PubMed.
- G. F. Feng, X. Y. Luo, X. Lu, S. Y. Xie, L. Deng, W. Y. Kang, F. He, J. H. Zhang, C. Y. Lei, B. Lin, Y. Huang, Z. Nie and S. Z. Yao, Angew. Chem., Int. Ed., 2019, 58, 6590–6594 CrossRef CAS PubMed.
- X. M. Dong, L. X. Sun, Z. W. Zhang, T. L. Zhu, J. Sun, J. Z. Gao, C. J. Dong, R. C. Wang, X. F. Gu and C. C. Zhao, Sci. China: Chem., 2023, 66, 1869–1876 CrossRef CAS.
- J. Y. Shi, C. Clayton and B. Z. Tian, Nano Res., 2019, 13, 1214–1227 CrossRef PubMed.
- Z. D Wu, M. S. Xiao, W. Lai, Y. Y. Sun, L. Li, Z. Q. Hu and H. Pei, ACS Appl. Bio Mater., 2022, 5, 1901–1915 CrossRef PubMed.
- W. A. Zhao, S. Schafer, J. Choi, Y. J. Yamanaka, M. L. Lombardi, S. Bose, A. L. Carlson, J. A. Phillips, W. Teo, I. A. Droujinine, C. H. Cui, R. K. Jain, J. Lammerding, J. C. Love, C. P. Lin, D. Sarkar, R. Karnik and J. M. Karp, Nat. Nanotechnol., 2011, 6, 524–531 CrossRef CAS PubMed.
- L. P. Qiu, F. Wimmers, J. Weiden, H. A. Heus, J. Tel and C. G. Figdor, Chem. Commun., 2017, 53, 8066–8069 RSC.
- D. D. Chao, X. M. Xu, Y. Y. Miao, L. L. Yang, Q. Q. Gao, R. Xu, Y. Tian, Y. M. Zhao, Y. M. Du and D. Han, Sci. China: Chem., 2022, 65, 2327–2334 CrossRef CAS.
- X. L. Huang, J. B. Song, B. C. Yung, X. H. Huang, Y. H. Xiong and X. Y. Chen, Chem. Soc. Rev., 2018, 47, 2873–2920 RSC.
- Y. Z. Shen, Y. L. Wei, C. L. Zhu, J. X. Cao and D. M. Han, Coord. Chem. Rev., 2022, 458, 214442 CrossRef CAS.
- S. P. Zhang, H. Chen, L. P. Wang, X. Qin, B. P. Jiang, S. C. Ji, X. C. Shen and H. Liang, Angew. Chem., Int. Ed., 2022, 61, e202107076 CrossRef CAS PubMed.
- G. Grasso, F. Colella, S. Forciniti, V. Onesto, H. Iuele, A. C. Siciliano, F. Carnevali, A. Chandra, G. Gigli and L. L. del Mercato, Nanoscale Adv., 2023, 5, 4311–4336 RSC.
- X. Li and J. W. Dai, Biomater. Sci., 2018, 6, 265–271 RSC.
- X. Z. Liu, L. L. Zhang, Z. J. Xu, X. Xiong, Y. Z. Yu, H. F. Wu, H. Qiao, J. J. Zhong, Z. Zhao, J. W. Dai and G. L. Suo, Acta Biomater., 2022, 154, 385–400 CrossRef CAS PubMed.
- J. Adams and R. W. Farndale, Essays Biochem., 2019, 63, 337–348 CrossRef PubMed.
- J. K. Mouw, G. Q. Ou and V. M. Weaver, Nat. Rev. Mol. Cell Biol., 2014, 15, 771–785 CrossRef CAS PubMed.
- K. Sasaki, J. Ishihara, A. Ishihara, R. Miura, A. Mansurov, K. Fukunaga and J. A. Hubbell, Sci. Adv., 2019, 5, eaaw6081 CrossRef CAS PubMed.
- J. Ishihara, A. Ishihara, K. Sasaki, S. S. Y. Lee, J. M. Williford, M. Yasui, H. Abe, L. Potin, P. Hosseinchi, K. Fukunaga, M. M. Raczy, L. T. Gray, A. Mansurov, K. Katsumata, M. Fukayama, S. J. Kron, M. A. Swartz and J. A. Hubbell, Sci. Transl. Med., 2019, 11, eaau3259 CrossRef CAS PubMed.
- A. Mansurov, J. Ishihara, P. Hosseinchi, L. Potin, T. M. Marchell, A. Ishihara, J. M. Williford, A. T. Alpar, M. M. Raczy, L. T. Gray, M. A. Swartz and J. A. Hubbell, Nat. Biomed. Eng., 2020, 4, 531–543 CrossRef CAS PubMed.
- K. N. Lovendahl, A. N. Hayward and W. R. Gordon, J. Am. Chem. Soc., 2017, 139, 7030–7035 CrossRef CAS PubMed.
- S. F. Hu, J. H. Zhang, R. Tang, J. H. Fan, H. Q. Liu, W. Y. Kang, C. Y. Lei, Z. Nie, Y. Huang and S. Z. Yao, Anal. Chem., 2019, 91, 10180–10187 CrossRef CAS PubMed.
- K. Hosaka, Y. L. Yang, T. Seki, C. Fischer, O. Dubey, E. Fredlund, J. Hartman, P. Religa, H. Morikawa, Y. Ishii, M. Sasahara, O. Larsson, G. Cossu, R. H. Cao, S. Lim and Y. H. Cao, Proc. Natl. Acad. Sci. U. S. A., 2016, 113, 5618–5627 CrossRef PubMed.
- C. Q. Vu, P. Rotkrua and Y. Tantirungrotechai, ACS Comb. Sci., 2017, 19, 609–617 CrossRef CAS PubMed.
- Z. Y. Xia, Y. Xing, J. Jeon, Y. P. Kim, J. Gall, A. Dragulescu-Andrasi, S. S. Gambhir and J. H. Rao, ACS Chem. Biol., 2011, 6, 1117–1126 CrossRef CAS PubMed.
- R. Tang, Y. H. Fu, B. Gong, Y. Y. Fan, H. H. Wang, Y. Huang, Z. Nie and P. Wei, Angew. Chem., Int. Ed., 2022, 61, e202205902 CrossRef CAS PubMed.
- P. Romero, A. Donda and J. A. Hubbell, Nat. Biomed. Eng., 2020, 4, 583–584 CrossRef CAS PubMed.
- M. J. Wang, Y. F. Da and Y. Tian, Chem. Soc. Rev., 2023, 52, 1189–1214 RSC.
- M. Tsioumpekou, S. I. Cunha, H. S. Ma, A. Åhgren, J. Cedervall, A. K. Olsson, C. H. Heldin and J. Lennartsson, Theranostics, 2020, 10, 1122–1135 CrossRef CAS PubMed.
- M. Kirsch, J. C. Wilson and B. Peter, J. Neuro-Oncol., 1997, 35, 289–301 CrossRef CAS PubMed.
- A. Csordas, A. E. Gerdon, J. D. Adams, J. R. Qian, S. S. Oh, Y. Xiao and H. T. Soh, Angew. Chem., Int. Ed., 2010, 49, 355–358 CrossRef CAS PubMed.
- D. A. Bronzert, P. Pantazis, H. N. Antoniades, A. Kasid, N. Davidson, R. B. Dickson and M. E. Lippman, Proc. Natl. Acad. Sci. U. S. A., 1987, 84, 5763–5767 CrossRef CAS PubMed.
- S. Fredriksson, M. Gullberg, J. Jarvius, C. Olsson, K. Pietras, S. M. Gústafsdóttir, A. Östman and U. Landegren, Nat. Biotechnol., 2002, 20, 473–477 CrossRef CAS PubMed.
- S. J. Han, S. Kwon and K. S. Kim, Cancer Cell Int., 2021, 21, 152 CrossRef PubMed.
- F. Pampaloni, E. G. Reynaud and E. H. K. Stelzer, Nat. Rev. Mol. Cell Biol., 2007, 8, 839–845 CrossRef CAS PubMed.
- X. Xu, M. C. Farach-Carson and X. Q. Jia, Biotechnol. Adv., 2014, 32, 1256–1268 CrossRef CAS PubMed.
- B. Pinto, A. C. Henriques, P. M. A. Silva and H. Bousbaa, Pharmaceutics, 2020, 12, 1186 CrossRef CAS PubMed.
- J. Winkler, A. Abisoye-Ogunniyan, K. J. Metcalf and Z. Werb, Nat. Commun., 2020, 11, 5120 CrossRef CAS PubMed.
- A. D. Theocharis, S. S. Skandalis, C. Gialeli and N. K. Karamanos, Adv. Drug Delivery Rev., 2016, 97, 4–27 CrossRef CAS PubMed.
- S. Y. Chen, R. J. Wang, S. Peng, S. Y. Xie, C. Y. Lei, Y. Huang and Z. Nie, Chem. Sci., 2022, 13, 2011–2020 RSC.
- F. Di Virgilio, A. C. Sarti, S. Falzoni, E. De Marchi and E. Adinolfi, Nat. Rev. Cancer, 2018, 18, 601–618 CrossRef CAS PubMed.
Footnote |
| † Electronic supplementary information (ESI) available. See DOI: https://doi.org/10.1039/d3sc03972b |
| This journal is © The Royal Society of Chemistry 2023 |

