 Open Access Article
Efficient exploration of compositional space for high-performance copolymers via Bayesian optimization†
Xinyao
Xu‡
,
Wenlin
Zhao‡
,
Liquan
Wang
 *,
Jiaping
Lin
 * and
Lei
Du
Shanghai Key Laboratory of Advanced Polymeric Materials, Key Laboratory for Ultrafine Materials of Ministry of Education, Frontiers Science Center for Materiobiology and Dynamic Chemistry, School of Materials Science and Engineering, East China University of Science and Technology, Shanghai, 200237, China. E-mail: jlin@ecust.edu.cn; lq_wang@ecust.edu.cn
First published on 6th September 2023
Abstract
The traditional approach employed in copolymer compositional design, which relies on trial-and-error, faces low-efficiency and high-cost obstacles when attempting to simultaneously improve multiple conflicting properties. For example, designing co-cured polycyanurates that exhibit both moisture and thermal resistance, along with high modulus, is a long-term challenge because of the intrinsic trade-offs between these properties. In this work, to surmount these barriers, we developed a Bayesian optimization (BO)-guided method to expedite the discovery of co-cured polycyanurates exhibiting low water uptake, coupled with higher glass transition temperature and Young's modulus. By virtue of the knowledge of molecular simulations, benchmarking studies were carried out to develop an effective BO-guided method. Propelled by the developed method, several copolymers with improved comprehensive properties were obtained experimentally in a few iterations. This work provides guidance for efficiently designing other high-performance copolymers.
Introduction
Recent developments in the high-tech area of aerospace have heightened the requirements for high-performance polymer matrix composites (PMCs).1,2 PMCs used in structural components require matrices possessing superior comprehensive properties, such as superior moisture, thermal resistance, and exceptional modulus. Among current thermosetting polymers, polycyanurates derived from cyclotrimerization of cyanate ester (CE) monomers are gifted with a number of performance advantages like low water uptake, high glass transition temperature (Tg), and favorable modulus.3–6 These highly desirable properties make them ideal for structural applications in the aerospace field.The progress in the exploration and exploitation of new high-performance polycyanurates for aerospace structural applications is limited by the intrinsic restrictions among moisture resistance, high-temperature properties, and excellent mechanical properties.7,8 To rapidly discover polycyanurates that meet the needs of specific applications, researchers have increased interest in copolymerization techniques to enhance the comprehensive properties.9,10 However, the traditional trial-and-error for experimenting with all potential formulae is impractical owing to the infinite compositional design space. Recently, machine learning (ML) tools have been promised to reduce unnecessary experiments by predicting promising formulae.
Bayesian optimization (BO) is one of the ML tools for solving expensive optimization problems, hitherto, it has been employed to address a wide range of challenges in the fields of chemical and materials science, such as optimizing the Hubbard U parameter and interatomic force fields,11,12 constructing phase diagrams of copolymers,13 and discovering new molecules and materials.14–17 Noticeably, the specific implementation of the BO framework immensely affects the optimized results. Benchmarking studies are valuable for evaluating the performance of various BO implementations and identifying the choices of optimization frameworks that exhibit high efficiency. Some researchers have investigated the effect of BO implementation on the optimized results based on benchmark problems, and the results showed that benchmarking studies could provide efficient ways for implementing an optimization framework.18–20 However, depending solely on knowledge obtained from commonly used benchmark problems may be insufficient, as the relationship between the composition of co-cured polycyanurates and their properties is more intricate and complex compared to the typical scenarios encountered in common benchmark problems. Therefore, it is essential to design a customized benchmark problem that accurately reflects the distinct characteristics of co-cured polycyanurates and subsequently to develop a reliable BO-guided method for real-world applications.
In this work, we focused on a class of advanced copolymers of a three-component co-cured CE system, aiming to rapidly discover copolymers possessing low hygroscopicity, coupled with high Tg and Young's modulus by the BO-guided method. Three commercially available CE monomers, which can copolymerize with each other to form a co-cured network, comprised compositional design space. Benchmarking studies were conducted by virtue of the knowledge of theoretical simulations to develop an effective BO-guided method. Propelled by the developed BO-guided method, the copolymer compositional space was searched experimentally. Remarkably, several copolymers with excellent properties were obtained in a few iterations. This study provides guidance for accelerating the discovery of other advanced copolymers.
Results and discussion
Overview of the workflow
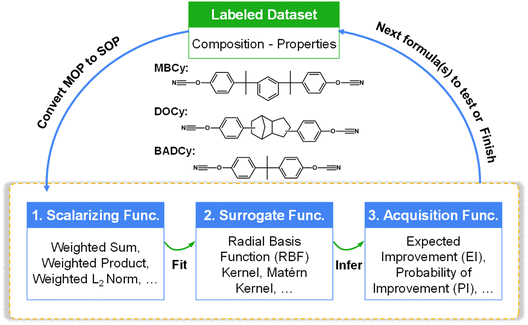
This work focuses on a kind of high-performance copolymers with three-component co-cured CE networks. To discover copolymers with excellent low hygroscopicity, high Tg, and high Young's modulus simultaneously, three commercially available CE monomers, each of which has excellent one or two desired properties, comprise the compositional design space. The names (abbreviations) of the three CE monomers are 1,3-bis[2-(4-cyanatophenyl)-2-propyl]benzene (MBCy), 2,5-bis(4-cyanatophenyl)octahydro-1H-4,7-methanoindene (DOCy), and 2,2-bis(4-cyanatophenyl)propane (BADCy).Fig. 1 schematically illustrates the BO workflow for copolymer compositional design in this work. The compositional design space is labeled as MxDyBz. Here, M, D, and B mean MBCy, DOCy, and BADCy, respectively. x, y, z is the mole ratio of each component, where x + y + z = 1. Considering that the small proportion change in the formula has a less marked effect on the macroscopic properties of the copolymer, the compositional design space is constrained by a grid value. Since this work aims to improve multiple properties, it can be mapped to a multi-objective optimization problem (MOP). We defined our MOP as
| fMOP = maxmize{fH−1(MxDyBz), fT(MxDyBz), fY(MxDyBz)} | (1) |
This work leveraged the Gaussian process (GP)-based BO framework to solve the MOP, as shown in Fig. 1. (1) Within the BO workflow, one practical solution for solving a MOP is to convert a MOP into a single-objective optimization problem (SOP) using the scalarizing function.19 Our study implemented it by converting multiple property functions into an overall score function. (2) The GP-based surrogate was used to fit the black-box function between the formula and the overall score. (3) According to the acquisition function, promising formulae in the design space were inferred based on the posterior distribution of the GP-based surrogate. The optimization stops when the preset criteria are reached.
Benchmarking studies through molecular simulations
The specific implementation of the GP-based BO framework can significantly affect the efficiency of the compositional design. In this work, the scalarizing functions, kernel functions of GP, and acquisition functions are key factors (see Fig. 1). To take full advantage of this cost-effective tool, conducting benchmarking studies before real-world applications become imperative. However, when dealing with complex systems, such as the copolymer property space that is highly intricate and involves a wide range of variables (e.g., structure and composition, reaction and processing conditions, crosslinking degree, and crystallization), relying solely on insights from commonly used benchmark problems may yield ineffective or suboptimal solutions. This limitation arises because these commonly used benchmark problems could not fully capture the complexity of copolymer behavior. Therefore, it is necessary to develop a customized benchmark problem that resembles real-world copolymer characteristics and then carry out benchmarking studies to design a practical optimization framework.All-atomic molecular simulations are widely used to model thermosets and calculate their macroscopic properties. The consistency between the calculated and experimental results indicates that all-atomic simulations can be used to prepare the calculated copolymer property space (CCPS).21–23 Herein, by virtue of the knowledge of molecular simulations, we presented a simulation scheme for calculating the CCPS of the three-component co-cured CE system. The main steps of the simulation scheme are as follows. First, a crosslinking strategy was developed to construct co-cured CE networks. This strategy mainly consists of a cutoff distance criterion and a multi-stage relaxation process.24 The compositional design space of the co-cured CE system was constrained by a grid of 1/30. Then, the properties of hygroscopicity, Tg, and Young's modulus of copolymers were obtained for the crosslinked CE networks. The ultimate water uptake was calculated by Monte Carlo simulations.21 The Tg was derived from the volume–temperature curve based on the free volume theory.25 The Young's modulus was determined using the constant strain method.26 For more details about the simulation scheme and parameter settings, see Methods and Section S1 of the ESI.† The values of data points for copolymers in CCPS are provided in Section S2 of the ESI.†
We conducted benchmarking studies where we set the CCPS as the black-box function to optimize. According to our BO workflow given in Fig. 1, the scalarizing function converts a MOP into an SOP. We proposed three scoring methods (denoted as ScoreWS, ScoreWL, and ScoreWP), given by eqn (2)–(4), to convert three properties to a new overall score. Based on CCPS, we first calculated the overall score of each copolymer and then colored the copolymers using their scores (see Fig. 2 and S2 of the ESI,† the copolymer with a high overall score tends to be red).
| ScoreWS = wHfH−1 + wTfT + wYfY | (2) |
 | (3) |
| ScoreWP = (fH−1)wHfTwTfYwY | (4) |
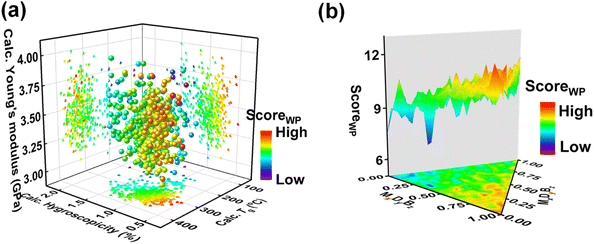
As shown in Fig. 2a and S2,† the data points for copolymers in CCPS were plotted as a function of three properties: hygroscopicity, Tg, and Young's modulus. Directly, we compared the consistency between the goal of our original MOP (i.e., exhibiting low hygroscopicity, coupled with high Tg and Young's modulus) and the goal of the new SOP (i.e., the color variation exhibited by the data points in CCPS, blue-green-red). It is evident that when the data points in CCPS are colored by ScoreWS (Fig. S2a†) or ScoreWL (Fig. S2b†), the color variation of the data points closely aligns with the increase of Tg, but does not exhibit good consistency with the variation of the other two properties. This observation suggests that selecting either of these two methods could not enable simultaneous improvements in all three properties effectively. However, when the data points in CCPS are colored by ScoreWP (Fig. 2a and S2c†), the color variation of the data points aligns most consistently with the variation of low hygroscopicity, along with high Tg and Young's modulus. This observation indicates that choosing this scoring method can achieve the simultaneous enhancement of all three desired properties. One reason for the observed differences arising from the use of the three scoring methods is that the numerical values of properties have different orders of magnitude (i.e., the reciprocal of hygroscopicity is around 100, Young's modulus is around 100, and Tg is around 102). For scalarizing functions with addition operations, they are sensitive to the magnitude of the value. To obtain new copolymers with enhanced multiple properties, we used the ScoreWP as the scalarizing function in follow-up work instead of merely improving a single property.
Furthermore, Fig. 2b depicts the contour of the black-box function, showcasing the relationship between the formulae and their overall score calculated using ScoreWP. Observably, there are multiple peaks in the compositional design space. During the BO-guided workflow, locating the peak is a relatively straightforward task. However, attaining convergence towards the global optimum poses significant challenges, thus rendering this black-box function an exemplary test case.
The GP-based BO was used in this work, in which the kernel function of GP-based surrogate and acquisition function are two main parts. The Gaussian process regression is a technique utilized within the Bayesian framework, where a GP is employed to establish the functional mapping f(x) → y. This mapping is determined based on the Bayesian prior and the available dataset, which is integrated using the kernel function. Herein, four types of Euclidean distance-based kernel functions with different smoothness (denoted as k#1 ∼ k#4), which are given by eqn (5)–(8), were compared.27
 | (5) |
 | (6) |
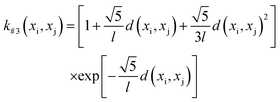 | (7) |
 | (8) |
Moreover, two acquisition functions commonly used in Bayesian optimization were compared in this work.28 The expected improvement (EI) is given as eqn (9), and the probability of improvement (PI) is given as eqn (10). (For details about the GP-based BO, see the Methods section.)
 | (9) |
 | (10) |
 | (11) |
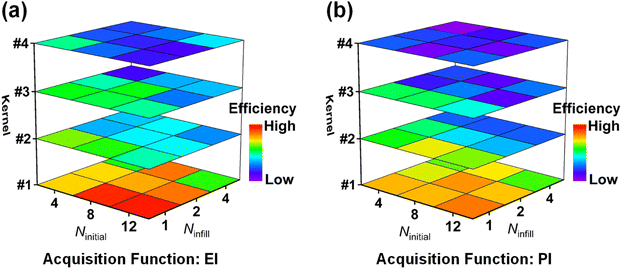
Benchmarking studies were conducted as follows. Initial samples were uniformly sampled from CCPS, with three different initial sample sizes (Ninitial = 4, 8, 12) considered. Then, the iteration was carried out according to GP-based BO, and three different infill sample sizes (Ninfill = 1, 2, 4) were applied. The maximum number of samples was limited to 64 for the stopping criteria. Search efficiency was evaluated based on the ranking of the best sample among all searched samples at the end of optimization (the higher the ranking, the higher the efficiency), and was on the basis of the average of 500 replicates.
Fig. 3 shows the search efficiency of each BO-guided method under different combinations of initial sample size Ninitial and infill sample size Ninfill. The method with high efficiency tends to be red. One can see that for each acquisition function (Fig. 3a for EI and Fig. 3b for PI), the order of search efficiency of the four kernels is k#1 > k#2 > k#3 > k#4. Since the smoothness of the four kernels is k#1 < k#2 < k#3 < k#4, we deemed that the kernel with lower smoothness could be more suitable for learning the black-box function of structure and overall score. Meanwhile, by comparing Fig. 3a and b, we can see that EI is more effective than PI. Upon analysis above, the combination of k#1 and EI was selected in follow-up work. (Detailed iterative curves of the benchmarking studies guided by k#1 and EI are provided in Fig. S3 of the ESI.†)
Furthermore, we conducted a controlled study by utilizing a random search, which involves selecting copolymer formulae without any guidance or learning from previous samples. As shown in Fig. 4, the orange line is the iterative process employing random search, while the blue line corresponds to the BO-guided method incorporating ScoreWP, k#1, and EI (Ninital = 1, Ninfill = 1, and the results were based on the average of 500 replicates). As shown, the best ranking of the copolymer searched by the BO-guided method is better than that obtained by the random search, which demonstrates that the search efficiency of the BO-guided method is higher than that of the random search. In addition, the standard error, which reflects the uncertainty associated with the best ranking of samples, decreases during iteration, as shown in Fig. S4 of the ESI.† This indicates that the estimation of the best ranking becomes more reliable. Moreover, the standard error in the BO-guided method is smaller than that in the random search.
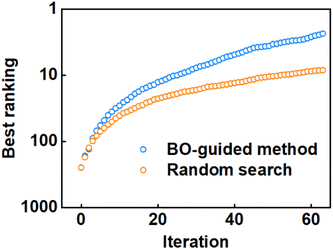 | ||
| Fig. 4 Comparison of search efficiency between the BO-guided method and random search. The best ranking achieved during each iteration is used to assess the relative efficiency of the two methods. | ||
Upon substantiating the exemplary efficacy of our designed BO-guided method, which incorporates ScoreWP, k#1, and EI, as substantiated by rigorous benchmarking studies, our focus then shifted toward the experimental exploration of copolymer compositional design.
Copolymer design and property optimization
Driven by the BO-guided method which incorporates ScoreWP, k#1, and EI, an experimental exploration of the compositional design space of MxDyBz was then carried out. The main procedures of experiments are as follows. CE monomers with a specific ratio were uniformly mixed and heated until complete dissolution. The resulting liquid was then poured into a steel mold coated with a release agent. After removing any trapped air bubbles under a vacuum, the sample was cured in a blast drying oven under a specific curing condition. Subsequently, the hygroscopicity, Tg, and Young's modulus of the cured resin were characterized. The hygroscopicity was determined based on the ultimate water uptake of the cured resin when immersed in water at room temperature. Tg was characterized using a differential scanning calorimeter (DSC). The tensile test was performed utilizing an electronic universal testing machine. Detailed experiments are provided in the Methods section.In our case, to minimize the iteration cycle and optimize the use of experimental data, we carefully selected Ninitial and Ninfill based on the benchmarking study shown in Fig. 3. From Fig. 3, we learned that setting Ninitial to 12 and Ninfill to 1 can result in notably higher search efficiency thereby highlighting their potential to enhance the effectiveness of experimental optimization. Therefore, we fixed Ninitial and Ninfill to be 12 and 1, respectively. Furthermore, the compositional design space of MxDyBz was restricted by a grid of 0.1, enabling distinct discernment of experimental properties across different compositions.
The iterative design process begins by selecting copolymer samples at random. These samples cover the entire compositional design space uniformly and serve as the initial points for our copolymer design. Subsequently, a new copolymer formula is predicted, with a focus on maximizing the EI value. Following the synthesis of the new copolymer, comprehensive characterizations of the desired properties were conducted. The obtained results are then employed to update the existing samples. This crucial step ensures that the knowledge gained from the new experiments is incorporated into the existing samples, facilitating ongoing refinement. The process above is repeated for continuous refinement of the optimal copolymer formula until the desired results are obtained.
By incorporating a scalarizing function, the compositional design of the copolymers with low hygroscopicity, high Tg, and high Young's modulus was achieved by maximizing the overall score of the copolymer. Table 1 presents a comprehensive overview of the iterative design process, illustrating the copolymer composition and its corresponding experimental properties. The table includes the proportions of copolymer constituents for each iteration, along with the evaluation of three desired properties for each composition. The initial 12 data points are labeled as 0-a to 0-l to represent the starting samples, followed by sequential updates of one data point per iteration for a total of 9 iterations. It can be seen that, driven by the BO-guided method, several high-performance copolymers with a combination of low hygroscopicity, high glass transition temperature, and high Young's modulus were obtained after a few iterations.
| Iteration | Composition (mol%) | Hygroscopicity (%) | T g (°C) | Young's modulus (GPa) | ||
|---|---|---|---|---|---|---|
| MBCy | DOCy | BADCy | ||||
| 0-a | 1.0 | 0.0 | 0.0 | 0.53 | 165 | 3.16 |
| 0-b | 0.0 | 1.0 | 0.0 | 0.70 | 254 | 2.89 |
| 0-c | 0.0 | 0.0 | 1.0 | 0.90 | 221 | 3.17 |
| 0-d | 0.0 | 0.2 | 0.8 | 1.59 | 284 | 3.28 |
| 0-e | 0.0 | 0.5 | 0.5 | 1.22 | 266 | 3.24 |
| 0-f | 0.0 | 0.8 | 0.2 | 1.16 | 255 | 3.32 |
| 0-g | 0.1 | 0.4 | 0.5 | 1.50 | 269 | 3.22 |
| 0-h | 0.1 | 0.0 | 0.9 | 1.81 | 288 | 3.21 |
| 0-i | 0.2 | 0.2 | 0.6 | 1.25 | 245 | 3.18 |
| 0-j | 0.4 | 0.0 | 0.6 | 1.11 | 221 | 3.02 |
| 0-k | 0.5 | 0.2 | 0.3 | 0.81 | 189 | 3.18 |
| 0-l | 0.7 | 0.1 | 0.2 | 0.68 | 186 | 3.32 |
| 1 | 0.9 | 0.0 | 0.1 | 0.58 | 198 | 3.21 |
| 2 | 0.9 | 0.1 | 0.0 | 0.56 | 171 | 3.30 |
| 3 | 0.8 | 0.1 | 0.1 | 0.59 | 173 | 3.30 |
| 4 | 0.8 | 0.0 | 0.2 | 0.62 | 190 | 3.21 |
| 5 | 0.8 | 0.2 | 0.0 | 0.57 | 177 | 3.37 |
| 6 | 0.7 | 0.3 | 0.0 | 0.61 | 187 | 3.31 |
| 7 | 0.5 | 0.5 | 0.0 | 0.60 | 223 | 3.21 |
| 8 | 0.4 | 0.6 | 0.0 | 0.83 | 247 | 3.31 |
| 9 | 0.6 | 0.4 | 0.0 | 0.61 | 219 | 3.26 |
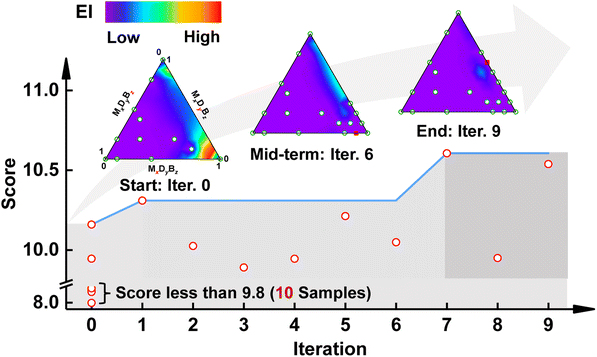
Fig. 5 displays the variation in the overall score of the prepared copolymers during the on-the-fly iterations. As shown, the best overall score of copolymers improves and remains the same for a period of time. In the first iteration, the copolymer CoCE-1 (the number 1 refers to the iteration round) achieved a better overall score than the initially prepared copolymers. In the subsequent iterations (2–6), the overall score of the newly prepared copolymer did not surpass the existing samples but still outperformed most of the initially prepared copolymers. In the seventh iteration, there was another improvement in the overall score. Finally, in the last iterations of this study (iterations 8 and 9), the best score of copolymers remains the same as in the seventh iteration.
We then plotted the contour of EI values during the iterative process to gain insights into copolymer compositional design. The insets in the upper part of Fig. 5 illustrate the contour of EI at the start, mid-term, and end of the iteration. The region in the lower left corner of the compositional design space is exploited to a greater extent at the beginning of the iteration. In the initial stage, the BO-guided exploration reveals that the formulae located in the lower right corner of the compositional design space have higher EI values. Mid-term exploration of the compositional space shows that copolymers located in the upper right area register higher EI values. At the end of the iteration, all the formulae have lower EI values compared to the start and mid-term of the iteration, revealing that the exploration of the copolymer space is complete (detailed results about the overall score and EI value during the iterative process are provided in Fig. S4†).
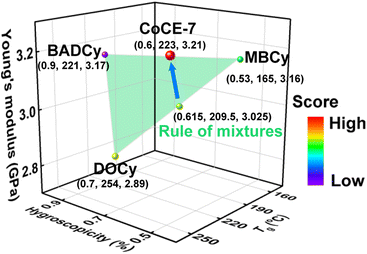
Fig. 6 depicts an example of a copolymer exhibiting enhanced comprehensive properties. The copolymer of CoCE-7, which was synthesized in the seventh iteration, demonstrates comparable hygroscopicity to MBCy, while significantly surpassing it in terms of Tg and Young's modulus. Although the Tg of CoCE-7 is slightly lower than that of DOCy, its hygroscopicity and Young's modulus are both superior to DOCy. Furthermore, each desired property of CoCE-7 is markedly enhanced compared to BADCy.
Herein, the ε-Pareto dominance relation was used to compare the properties of the samples quantitatively. A concise definition of the ε-Pareto dominance relation is as follows.29 A point y ∈ Rmε-dominates  According to the definition, the copolymer of CoCE-7 demonstrates Pareto dominance over BADCy, while a 0.13-Pareto dominance prevails over MBCy and DOCy. Moreover, we calculated the properties of M0.5B0.5D0 (i.e., the composition of CoCE-7) according to the rule of mixtures, as depicted in Fig. 6. Notably, the properties of CoCE-7 are superior to the linear mixing of properties of corresponding homopolymers, highlighting the effectiveness of our developed BO-guided method in rapidly discovering copolymers with improved comprehensive properties.
Designing optimal materials for real-world applications is the holy grail of the materials chemistry community. To date, copolymerization techniques are widely used to discover advanced polymeric materials, not only due to the synthetic accessibility of copolymers but also because copolymerization can yield appealing and unexpected physical properties that deviate from the linear combination rules of homopolymer properties. However, it is challenging to perform experiments with all promising formulae due to the vast space of copolymers to be explored.
GP-based BO, an ML tool for optimizing expensive black-box functions, holds great potential for the optimal compositional design of copolymers. However, its practical application in crosslinked copolymer compositional design remains limited due to the complex nature of the three-dimensional networks, which complicates the relationship between composition and properties. Consequently, accurately modeling and effectively optimizing such complex systems can be challenging for an arbitrary GP-based BO, since the specific implementation of the optimization framework, such as the selection of the kernel of GP, can affect its performance. To take full advantage of this tool, we carried out benchmarking studies using the black-box function generated by molecular simulations. The results revealed that the kernel with lower smoothness exhibits higher efficiency in optimal compositional design. This finding indicates that the shape of kernels with lower smoothness better aligns with the black-box function between structure and property, providing valuable insights for advancing quantitative structure–property relationships research in the field of polymers.
Furthermore, guided by the developed BO-based method, we experimentally explored the compositional design space. The results illustrate that the BO can be used to address the challenge of low efficiency and high cost in improving multiple conflicting properties. Importantly, it should be emphasized that the traditional trial-and-error method is difficult in achieving comprehensive property improvements, as certain properties may contradict each other. The BO-based method presented in this study offers advantages compared to traditional compositional design strategies and can be extended to the agile discovery of diverse advanced copolymeric materials with multi-functions. This extension goes beyond mere composition optimization and encompasses the optimization of the curing process. The black-box function governing the relationship of structure–composition–process–property can represent a more general case. By simultaneously considering both composition and curing process parameters, the developed BO-based method achieves a broadened scope and enhanced applicability in materials discovery and design.
Lastly, we would like to mention the limitations of the workflow presented in this work and give possible solutions. The limitation is that our approach relies on molecular simulations to design a benchmark problem that accurately represents the characteristics of crosslinked polymers. While these simulations could provide valuable insights for benchmarking studies, the accuracy demands and time costs associated with simulations present significant challenges. In some cases, the computational expenses can become prohibitive, hindering the scalability of the workflow to larger and more complex systems. To address these challenges, future research could focus on advancing multi-scale simulation approaches for polymers. This involves coupling different levels of computational methods, such as integrating atomistic simulations with coarse-grained models or continuum models. By capturing phenomena occurring at various lengths and time scales, multi-scale simulations enable the exploration of larger and more complex systems while effectively reducing computational costs. These advancements in simulation techniques could enhance the applicability and efficiency of the proposed workflow, promoting progress in the interdisciplinary field of machine learning and materials chemistry.
Conclusions
Bayesian optimization has been used to optimize expensive black-box functions. However, its efficiency can be severely affected by the implementation of an optimization framework. This work carried out benchmarking studies through molecular simulations and constructed an effective BO-based method for the compositional design of the co-cured CE system. With the guidance of the developed method, several copolymers having low hygroscopicity, along with superior Tg and Young's modulus were successfully synthesized in a few iterations. Notably, it is challenging to simultaneously improve multiple desired objectives by the trial-and-error method because of the contradictory relationship among properties. The present work well addresses this challenge. The basic framework of this work can be generalized for efficiently exploring and discovering other advanced copolymers with multiple properties.Methods
Computational details
Experimental details
Data availability
The data that supports the findings of this study is available from the corresponding author upon reasonable request.Author contributions
J. L., L. W., and L. D. initiated this research project; X. X. conducted the research and wrote this manuscript under the guidance of J. L. and L. W.; W. Z. assisted with the material synthesis and characterization. All authors discussed the results.Conflicts of interest
There are no conflicts to declare.Acknowledgements
This work was supported by the National Key R&D Program of China (2022YFB3707302) and the National Natural Science Foundation of China (51833003, 22173030, 21975073, and 51621002).Notes and references
- Q. Li, L. Chen, M. R. Gadinski, S. Zhang, G. Zhang, H. U. Li, E. Iagodkine, A. Haque, L.-Q. Chen, T. N. Jackson and Q. Wang, Nature, 2015, 523, 576–580 CrossRef CAS PubMed
.
- C. Barile, C. Casavola and F. D. Cillis, Composites, Part B, 2019, 162, 122–128 CrossRef CAS
.
- T. Fang and D. A. Shimp, Prog. Polym. Sci., 1995, 20, 61–118 CrossRef CAS
.
- I. Hamerton, B. J. Howlin, P. Klewpatinond and S. Takeda, Macromolecules, 2009, 42, 7718–7735 CrossRef CAS
.
- A. J. Guenthner, B. G. Harvey, A. P. Chafin, M. C. Davis, J. J. Zavala, K. R. Lamison, J. T. Reams, K. B. Ghiassi and J. M. Mabry, Macromolecules, 2017, 50, 4887–4896 CrossRef CAS
.
- C. A. Corley, A. J. Guenthner, C. M. Sahagun, K. R. Lamison, J. T. Reams, M. K. Hassan, S. E. Morgan, S. T. Iacono and J. M. Mabry, ACS Macro Lett., 2014, 3, 105–109 CrossRef CAS PubMed
.
- A. J. Guenthner, G. R. Yandek, M. E. Wright, B. J. Petteys, R. Quintana, D. Connor, R. D. Gilardi and D. Marchant, Macromolecules, 2006, 39, 6046–6053 CrossRef CAS
.
- A. J. Guenthner, K. R. Lamison, V. Vij, J. T. Reams, G. R. Yandek and J. M. Mabry, Macromolecules, 2012, 45, 211–220 CrossRef CAS
.
- A. Inamdar, J. Cherukattu, A. Anand and B. Kandasubramanian, Ind. Eng. Chem. Res., 2018, 57, 4479–4504 CrossRef CAS
.
- C. P. R. Nair, D. Mathew and K. N. Ninan, Adv. Polym. Sci., 2001, 155, 1–99 CrossRef CAS
.
- M. Yu, S. Yang, C. Wu and N. Marom, npj Comput. Mater., 2020, 6, 180 CrossRef CAS
.
- Y. Xie, J. Vandermause, L. Sun, A. Cepellotti and B. Kozinsky, npj Comput. Mater., 2021, 7, 40 CrossRef CAS
.
- S. Zhao, T. Cai, L. Zhang, W. Li and J. Lin, ACS Macro Lett., 2021, 10, 598–602 CrossRef CAS PubMed
.
- G. Agarwal, H. A. Doan, L. A. Robertson, L. Zhang and R. S. Assary, Chem. Mater., 2021, 33, 8133–8144 CrossRef CAS
.
- R.-R. Griffiths and J. M. Hernández-Lobato, Chem. Sci., 2020, 11, 577–586 RSC
.
- Y. Zhang, D. W. Apley and W. Chen, Sci. Rep., 2020, 10, 4924 CrossRef CAS PubMed
.
- Y. Zhang and A. A. Lee, Chem. Sci., 2019, 10, 8154–8163 RSC
.
- B. Lei, T. Q. Kirk, A. Bhattacharya, D. Pati, X. Qian, R. Arroyave and B. K. Mallick, npj Comput. Mater., 2021, 7, 194 CrossRef
.
-
T. Chugh, arXiv, 2019, preprint, arXiv:1904.05760, DOI:10.48550/arXiv.1904.05760
.
- H. Zhang, H. Fu, S. Zhu, W. Yong and J. Xie, Acta Mater., 2021, 215, 117118 CrossRef CAS
.
- L. M. J. Moore, N. D. Redeker, A. R. Browning, J. M. Sanders and K. B. Ghiassi, Macromolecules, 2021, 54, 6275–6284 CrossRef CAS
.
- Z. Meng, M. A. Bessa, W. Xia, W. K. Liu and S. Keten, Macromolecules, 2016, 49, 9474–9483 CrossRef CAS
.
- G. M. Odegard, S. U. Patil, P. P. Deshpande, K. Kanhaiya, J. J. Winetrout, H. Heinz, S. P. Shah and M. Maiaru, Macromolecules, 2021, 54, 9815–9824 CrossRef CAS
.
- M. S. Radue, V. Varshney, J. W. Baur, A. K. Roy and G. M. Odegard, Macromolecules, 2018, 51, 1830–1840 CrossRef CAS
.
- S. Zhang, S. Du, L. Wang, J. Lin, L. Du, X. Xu and L. Gao, Chem. Eng. J., 2022, 448, 137643 CrossRef CAS
.
- BIOVIA Materials Studio, https://www.3ds.com/products-services/biovia/products/molecular-modeling-simulation/biovia-materials-studio/, accessed, June, 2023.
-
C. E. Rasmussen and C. K. I. Williams, Gaussian Processes for Machine Learning, The MIT Press, London, 2006 Search PubMed
.
- A. Agnihotri and N. Batra, Distill, 2020, 5, e26 Search PubMed
.
- M. Zuluaga, A. Krause and M. Püschel, J. Mach. Learn. Res., 2016, 17, 1–32 Search PubMed
.
- F. Pedregosa, G. Varoquaux, A. Gramfort, V. Michel, B. Thirion, O. Grisel, M. Blondel, P. Prettenhofer, R. Weiss and V. Dubourg, J. Mach. Learn. Res., 2011, 12, 2825–2830 Search PubMed
.
Footnotes |
| † Electronic supplementary information (ESI) available. See DOI: https://doi.org/10.1039/d3sc03174h |
| ‡ These authors contributed equally to this work. |
| This journal is © The Royal Society of Chemistry 2023 |

