 Open Access Article
Engineering the microenvironment of electron transport layers with nickle single-atom sites for boosting photoelectrochemical performance†
Ying
Qin
a,
Rong
Tan
a,
Jing
Wen
b,
Qikang
Huang
c,
Hengjia
Wang
a,
Mingwang
Liu
a,
Jinli
Li
a,
Canglong
Wang
 d,
Yan
Shen
c,
Liuyong
Hu
*b,
Wenling
Gu
*a and
Chengzhou
Zhu
 *a
*a
aNational Key Laboratory of Green Pesticide, International Joint Research Center for Intelligent Biosensing Technology and Health, College of Chemistry, Central China Normal University, Wuhan 430079, P. R. China. E-mail: wlgu@ccnu.edu.cn; czzhu@ccnu.edu.cn
bHubei Key Laboratory of Plasma Chemistry and Advanced Materials, School of Materials Science and Engineering, Wuhan Institute of Technology, Wuhan 430205, P. R. China. E-mail: huly@wit.edu.cn
cWuhan National Laboratory for Optoelectronics, Huazhong University of Science and Technology, Wuhan 430074, P. R. China
dInstitute of Modern Physics, Chinese Academy of Science, Lanzhou 730000, P. R. China
First published on 6th June 2023
Abstract
Advances in the rational design of semiconductor–electrocatalyst photoelectrodes provide robust driving forces for improving energy conversion and quantitative analysis, while a deep understanding of elementary processes remains underwhelming due to the multistage interfaces involved in semiconductor/electrocatalyst/electrolyte. To address this bottleneck, we have constructed carbon-supported nickel single atoms (Ni SA@C) as an original electron transport layer with catalytic sites of Ni–N4 and Ni–N2O2. This approach illustrates the combined effect of photogenerated electron extraction and the surface electron escape ability of the electrocatalyst layer in the photocathode system. Theoretical and experimental studies reveal that Ni–N4@C, with excellent oxygen reduction reaction catalytic activity, is more beneficial for alleviating surface charge accumulation and facilitating electrode–electrolyte interfacial electron-injection efficiency under a similar built-in electric field. This instructive method enables us to engineer the microenvironment of the charge transport layer for steering the interfacial charge extract and reaction kinetics, providing a great prospect for atomic scale materials to enhance photoelectrochemical performance.
Introduction
Semiconductor electrode-based photoelectrochemical (PEC) behavior has been broadly recognized as a promising chemical method for energy conversion1,2 and quantitative analysis.3–5 However, developing efficient PEC systems has been hampered by poor carrier mobility and selectivity, short carrier diffusion lengths, and sluggish electrochemical kinetics at the multistage interfaces from the semiconductor photoelectrode to electrolyte.6–9 To suppress competing excited-carrier recombination pathways, significant effort has been devoted to developing simple and effective photoelectrodes made from light-absorbing semiconductors with electrocatalysts to improve charge separation or simply enable more facile surface reaction kinetics.10–13 Nonetheless, the energetics and charge-transfer processes of semiconductor–electrocatalyst photoelectrodes used in PEC systems are poorly understood,14,15 resulting from the not well-defined electrocatalysts on semiconductors.16,17 Meanwhile, the properties of the as-synthesized photoactive materials are diverse,18,19 with a large degree of electron–hole recombination at the photoactive material/electrocatalysts/electrolyte interfaces due to the mismatched energy band alignment.20 To finely optimize the charge transfer process, it is a promising method to introduce a charge transfer layer that can provide an outstanding charge transfer channel at the heterojunction interface and prolong the charge trapping lifetime on the surface of the photoelectrode.21–23Single-atom catalysts (SACs) involving individual and isolated metal atoms stabilized on appropriate supports have been widely studied and recognized in different fields, such as electrocatalysis,24,25 photocatalysis,26–29 biomimetic catalysis,30,31etc., due to the compelling advantages of unique electronic structures, high activity, and well-defined active sites. Given the strong interaction between the metal single atom and support, regulating the local environment of single atoms that results in different electron transfer paths is expected to facilitate the extraction of photogenerated carriers from semiconductors (Interface I; charge transfer) and their injection into the electrolyte (Interface II; surface reaction).32,33 Furthermore, the integration of the atomically dispersed catalytic site and charge extraction layer significantly extends the charge diffusion length, establishes atomic-level charge transfer channels,34 and enhances the electrochemical reaction driving force.35,36 Inspired by the above analysis, it's highly desirable to obtain a deep understanding of the mechanisms for selective extraction of photoexcited minority carriers and surface reaction kinetics at the semiconductor–electrocatalyst photoelectrode, which would more generally illustrate design principles that can be applied to other material systems.
Herein, nickel-based materials are employed as an ideal model to gain a deep understanding of interface properties at the photocathode.37–39 Thus, we decorated the electron transport layer of a carbon support with nickel single atoms (Ni SA@C) to boost the carrier dynamics of typical p-type semiconductor CuO with atomic-level charge transfer channels. Since porphyrin-like M–N4 sites and Schiff base-like M–N2O2 sites in nonprecious metal SACs exhibit different electron transfer pathways for the ORR under neutral conditions, the atomic scale active centers with Ni–N4 (Ni–N4@C) and Ni–N2O2 (Ni–N2O2@C) also significantly affect the PEC behaviors towards CuO-based photocathodes. From the comprehensive consideration of light absorption, built-in electric field, and surface reaction energy levels, experimental investigations and theoretical calculations clarify that the electron transport process of Ni–N4@C is much better than that of Ni–N2O2@C, thus achieving high-efficiency PEC performance (Scheme 1). Based on the poisoning of the active sites of Ni SA@C, we not only confirmed the importance of metal active sites on the electron transport layer to the kinetics of the solid–liquid interface reaction in the PEC system but also designed an advanced PEC biosensing platform for the sensitive detection of paraoxon. The modulation of the electron transport layer with atomically dispersed metal sites in this work furnishes in-depth insights into the PEC process, facilitating the interfacial engineering and optimization of PEC devices.
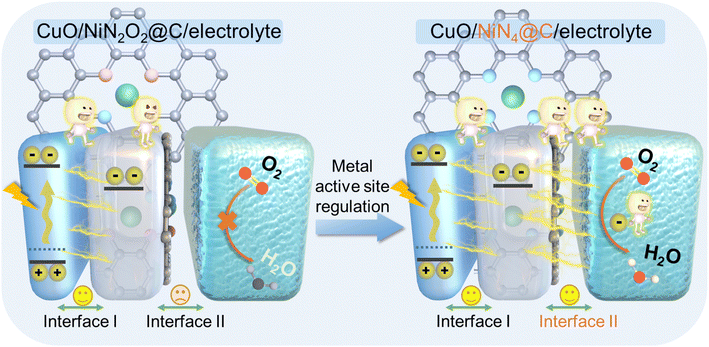 | ||
| Scheme 1 Schematic diagram of the PEC process based on the regulation of metal active sites on the electron transport layer in the photocathode. | ||
Results and discussion
Structural characterization of Ni SA@C/CuO
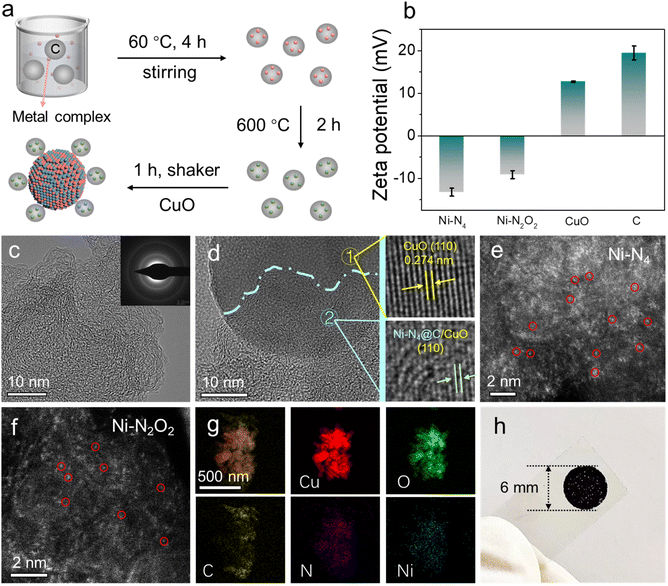
The electron transport layers of Ni SA@C with the active sites of Ni–N4 and Ni–N2O2 were synthesized using a “ligand-mediated” method,40,41 and the corresponding ligand structures are shown in Fig. S1.† An illustration of Ni SA@C and its integration with the semiconductor CuO for the preparation of photoelectrode materials is depicted in Fig. 1a. During the preparation, Ni SA@C was adsorbed on the surface of the CuO semiconductor by the electrostatic self-assembly method according to the measured zeta potentials in Fig. 1b. Next, the microstructure of as-synthesized Ni SA@C was characterized using transmission electron microscope (TEM) images (Fig. 1c and S2†) and X-ray diffraction (XRD) analysis (Fig. S3a†), displaying an amorphous state without the formation of Ni-related nanoparticles or clusters. Meanwhile, the selected area electron diffraction (SAED) patterns in the inset image of Fig. 1c verify the amorphous characteristics of Ni SA@C due to the weak diffraction rings. Only the diffraction peaks of CuO can be clearly recognized in the XRD result of the Ni SA@C/CuO composite (Fig. S3b and c†), which are assigned to the standard lattice planes (PDF#41-0254) of CuO. This amorphous Ni SA@C after combining with CuO was revealed by the HRTEM images (Fig. 1d) as well, discovering that Ni–N4@C was in close contact with the (110) lattice plane of CuO. To further confirm the atomically dispersed Ni element, we performed aberration-corrected high-angle annular dark-field scanning transmission electron microscopy (AC-HAADF-STEM) measurement. The isolated bright dots were identified as Ni single atoms anchored on the carbon support (Fig. 1e and f). Thus, the subsequent theoretical model (Fig. S4†) was established based on the exposed crystal facet and single atomic structure. The corresponding energy-dispersive spectroscopy (EDS) element mapping images of Ni–N4@C/CuO also show that the C, Cu, O, N, and Ni elements are uniformly distributed in the composite (Fig. 1g). To identify the surface element composition and chemical states of Ni SA@C, CuO, and Ni SA@C/CuO, X-ray photoelectron spectroscopy (XPS) was employed. As presented in Fig. S5a,† C, Cu, O, N, and Ni elements can be detected in the Ni SA@C/CuO composite, which are in accordance with the EDS results. The binding energies were calibrated against the C–C peak in C 1s spectra at 284.8 eV (Fig. S6b†). As for O 1s (Fig. S5b†) and Cu 2p (Fig. S6a†) spectra of different samples, it could be clearly noticed that the binding energy had a positive shift in Ni–N4@C/CuO and Ni–N2O2@C/CuO. In contrast, the binding energies of Ni–N4@C/CuO and Ni–N2O2@C/CuO show obvious negative shifts in N 1s (Fig. S6c†) and Ni 2p (Fig. S6d†) spectra. The opposite charge transfer indicates a strong interfacial interaction between CuO and Ni SA@C. Moreover, in the spectra of C 1s and O 1s, the characteristic peak of the C–O bond increases in the composite samples,42,43 indicating the chemically bonded C–O interface between CuO and catalysts. Finally, the prepared Ni SA@C/CuO was modified on the photoelectrode unit, which adopted a circular area size with a uniform radius of 3 mm to support PEC testing (Fig. 1h).General PEC performances and basic photoelectric properties of Ni SA@C/CuO
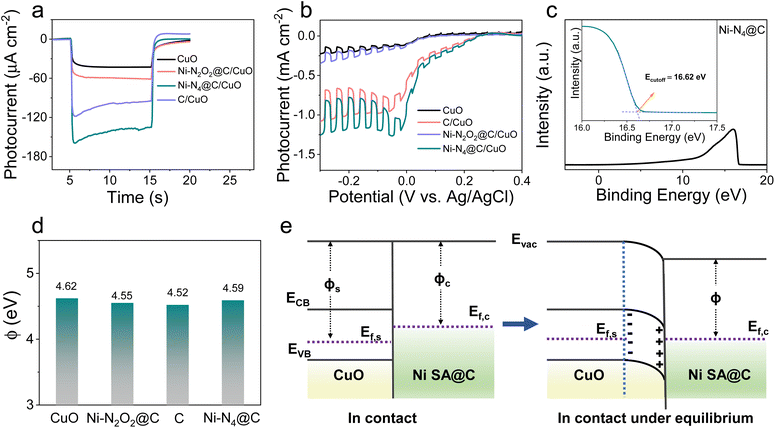
The systematic research on photocurrent transients of the Ni SA@C/CuO photocathodes under 100 mW cm−2 simulated sunlight illumination in PBS solution (pH = 7.4) is plotted in Fig. 2a and S7.† In comparison to bare CuO, temporal measurements of Ni–N2O2@C/CuO, C/CuO, and Ni–N4@C/CuO modified photoelectrodes in photocurrent are enhanced by 1.4, 2.1, and 3.1 times, respectively, pointing to the favorable charge transfer or surface reaction ability after loading Ni SA@C on semiconductors. The current–voltage characteristics of modified photoelectrodes were studied through the linear sweep voltammetry (LSV) curves in Fig. 2b under continuous and on–off cycle illumination. When the p-type semiconductor CuO was modified with the Ni–N4@C-based electron transport layer, the photocurrent density can reach a value of 1.19 mA cm−2 at −0.1 V (vs. Ag/AgCl) with a remarkable onset potential (Eonset) of 0.2 V, which significantly exceed the performance of bare CuO. This increment in the photocurrent could be attributed to the passivation of electron–hole pair recombination, which is closely related to the extraction of photogenerated electrons in CuO and the accelerated photo-excited ORR kinetics.Ultraviolet-visible (UV-vis) diffuse reflectance spectra were first examined to disclose their optical absorption properties. As presented in Fig. S8,† the band gap energy (Eg) values of CuO, Ni–N2O2@C/CuO, C/CuO, and Ni–N4@C/CuO are determined from the Tauc plot of (αhν)2vs. energy (hν), hovering around 1.47 eV. The virtually unchanged Eg proves that Ni SA@C does not change the light-absorption performance of CuO itself. At the same time, the Ni SA@C alone has almost no photocurrent response (Fig. S9†), which also implies that Ni SA@C has no light energy conversion function and the generation of photocarriers mainly comes from CuO. Then, we studied their solid-state electronic properties to understand the electron extraction ability of such electron transport layers for semiconductor CuO. The surface energetics of Ni SA@C and CuO were investigated by ultraviolet photoelectron spectroscopy (UPS) (Fig. 2c and S10†), and the work functions (ϕ) of CuO, Ni–N2O2@C, C, and Ni–N4@C are determined to be about 4.62, 4.55, 4.52 and 4.59 eV, respectively (Fig. 2d). The work function of Ni SA@C (ϕc) is smaller than that of CuO (ϕs), being ϕs > ϕc in Fig. 2e, and then the band of CuO will bend downward forming a space charge layer until their Fermi levels (Ef) reach an equilibrium.44 As a result, the built-in electric field in the space charge layer of CuO is directed from the surface into the inside of the semiconductor. Thus, once the electron–hole pairs are generated in Ni SA@C/CuO, the photoelectrons are extracted to the Ni SA@C pole, which facilitates the separation of carriers in the CuO semiconductor. In terms of the strength of the formed built-in electric field, Ni–N2O2@C and Ni–N4@C will exhibit similar electron extraction abilities at the semiconductor/catalyst interface due to similar Ef. Then, three-dimensional (3D) charge density differences (Fig. S11†) were calculated to reveal the interlayer charge transfer between the CuO (110) and Ni SA@C. As expected, the Ni SA@C could induce electron depletion on CuO (110) through the Mülliken charge analysis (δe, Ni SA@C < 0, −1.61 e for Ni–N4@C and −1.63 e for Ni–N2O2@C). Likewise, the charge accumulation values in Ni–N2O2@C and Ni–N4@C areas confirm the ability to extract electrons from the semiconductor CuO, but the difference was not significant. The results of the steady-state photoluminescence spectra also confirm this phenomenon, showing few differences in the quenching effect of the electron–hole pair recombination in all-solid-state Ni–N4@C/CuO and Ni–N2O2@C/CuO (Fig. S12†). To figure out the essence of the Ni–N4@C electron transport layer with the greatest influence on the PEC signal, we shift our attention to the perspective of electron exchange at the solid–liquid interface regardless of little difference in solid-state physical electronic properties (Ni–N4@C ≈ Ni–N2O2@C).
Working mechanism characterization of PEC behavior at the solid–liquid interface
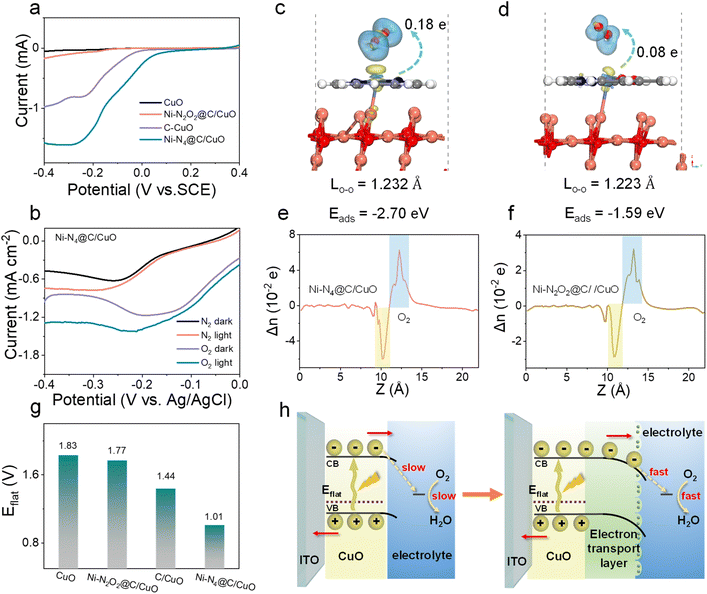
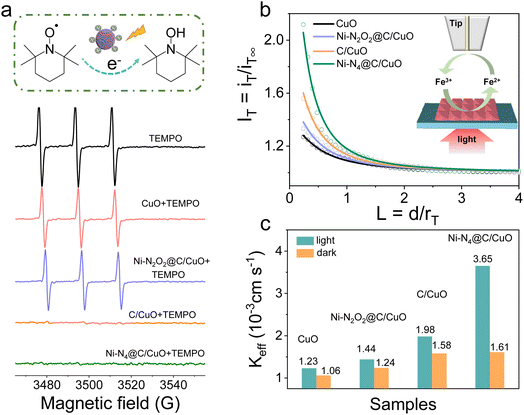
The electrochemical ORR properties of Ni–N2O2@C, Ni–N4@C, and C were first examined in O2-saturated 0.1 M PBS at room temperature, and a strong ORR peak was observed for each catalyst in cyclic voltammetry (CV) curves, denoting their eximious interfacial catalytic activity (Fig. S13a†). Concurrently, ORR polarization curves for Ni SA@C were further recorded on the rotating ring-disk electrode (RRDE) (Fig. S13b†). The Ni–N4@C layer offers the highest ORR current and the most positive onset potential, suggesting that the Ni–N4@C layer has the best ORR catalytic activity among the tested samples (Ni–N4@C > C > Ni–N2O2@C). Meanwhile, the average electron-transfer number and peroxide yield percentage of the samples (Fig. S13c and d†) are calculated. As a result, the average electron transfer number of Ni–N4@C is higher than that of C and Ni–N2O2@C, indicating that Ni–N4@C favors an apparent 4e− ORR process with low H2O2 yield. Subsequently, electrochemical ORR tests (Fig. 3a) were performed on the CuO electrodes integrated with the Ni SA@C to illustrate the reaction kinetics of the solid–liquid interface. The results prove that the interfacial ORR properties of different composites are improved, and the tendency of ORR activity remains unchanged after adding CuO (Ni–N4@C/CuO > C/CuO > Ni–N2O2@C/CuO). This ORR capacity trend demonstrates that the local atomic environments of metal Ni sites induced by ligands play an important role in catalytic activity, which will in turn determine the electrode–electrolyte interfacial electron-injection efficiency. Besides, LSV curves of samples in different atmosphere-saturated electrolytes (O2 and N2) were obtained under dark and light conditions. As expected, the photocurrent of Ni–N4@C/CuO in the N2-saturated electrolyte cannot hold a candle to that in the O2-saturated electrolyte, demonstrating that the extra transfer of photoelectrons in the electron extraction layer can be enhanced due to the ORR activity at the solid–liquid interface (Fig. 3b). Compared with Ni–N4@C/CuO, C/CuO and Ni–N2O2@C/CuO with inferior ORR efficiency exhibit limited photocurrent (Fig. S14†), which verifies the critical influence of Ni SA@C structures on the photoelectron consumption rate of the photocathode surface as well. Moreover, density functional theory (DFT) calculations were carried out to gain fundamental insight into the electron transport differences of the Ni SA@C/CuO (110) for oxygen molecules, and the results are depicted in Fig. 3c and d. The adsorption energy for oxygen molecules on the Ni–N4@C/CuO (110) surface (−2.70 eV) is significantly stronger than that on the Ni–N2O2@C/CuO (110) surface (−1.59 eV), suggesting that Ni–N4 sites are more favorable to enhance the activation of O2 during the interfacial reaction. Thereupon, the bond length of oxygen molecules on the Ni–N4@C/CuO (110) surface (1.232 Å) is stretched to a greater extent compared with the Ni–N2O2@C/CuO (110) surface (1.223 Å). The Mülliken charge of oxygen molecule (δe, oxygen < 0) analyses also supports the fact that Ni–N4@C/CuO (110) could induce more electron transfer from the surface to the oxygen molecule, being −0.18 e for O2|Ni–N4@C/CuO (110) and −0.08 e for O2|Ni–N2O2@C/CuO (110). Meanwhile, the planar-averaged charge density differences (Fig. 3e and f) of O2|Ni–N4@C/CuO (110) and O2|Ni–N2O2@C/CuO (110) along the Z direction were analyzed according to the 3D charge density differences, signifying that electrons are more able to slide impulsively from the Ni–N4@C/CuO side to the O2 side across the interface. To further explore the PEC behavior of the photocathode/solution interface, flat band potentials (Eflat) were measured by the Mott–Schottky (M–S) technique at 1000 Hz in PBS solution (pH = 7.4) (Fig. S15† and 3g). After modifying these electron transport layers on CuO, the Eflat values of the samples have negative intercept shifts, especially for Ni–N4@C/CuO. According to previous studies,45–47 the negative shift of the Eflat of the system indicates the rise of the Ef (Ni–N4@C/CuO > C/CuO > Ni–N2O2@C/CuO > CuO), leading to the energy band bending down in the PEC cell. The elevated energy level values of the electron transport layer/CuO photocathodes confirm that the electrons in the Ni–N4@C/CuO conduction band are more likely to react with O2 in PBS solution with a larger driving force. Additionally, typical electrochemical impedance spectroscopy (EIS) Nyquist plots of the as-prepared samples are illustrated in Fig. S16.† The arc diameter in Nyquist plots for the Ni–N4@C/CuO sample was largely reduced, meaning the easier charge transfer at the solid–liquid interface. As described in the schematic diagram (Fig. 3h), the driving force for the surface ORR is enhanced by this outstanding electron transport layer with excellent catalytic site activity and electron extraction ability.Furthermore, we took advantage of electron paramagnetic resonance (EPR) with the spin labeling technique to evaluate the reduction behavior of photoelectrons in the samples. 2,2,6,6-Tetramethylpiperidine-1-oxyl (TEMPO) can be reduced by photoelectrons into hydroxyl amine, TEMPOH, accompanied by quenching of the EPR signal.48 Therefore, TEMPO was used to probe the reactivity of electrons generated in photoexcited CuO and Ni SA@C/CuO (Fig. 4a). The EPR spectrum of TEMPO exhibits three peaks with an intensity of 1![[thin space (1/6-em)]](https://www.rsc.org/images/entities/char_2009.gif) :
:![[thin space (1/6-em)]](https://www.rsc.org/images/entities/char_2009.gif) 1
1![[thin space (1/6-em)]](https://www.rsc.org/images/entities/char_2009.gif) :
:![[thin space (1/6-em)]](https://www.rsc.org/images/entities/char_2009.gif) 1, and the intensity was almost unchanged after mixing with samples before irradiation (Fig. S17†). However, the signal intensity of TEMPO in the mixed solution decreased rapidly after 2 min of irradiation, indicating that the photoelectron reduces spin-labeled TEMPO to an EPR silencing product. The greatest decline in EPR signal intensity was found for C/CuO and Ni–N4@C/CuO, where more photoelectrons are exchanged for the photo-reduction reaction. To further uncover how the surface photoelectron reaction kinetics influence the PEC performance, scanning electrochemical microscopy (SECM) characterization in feedback mode was performed on the CuO and Ni SA@C/CuO samples. The molecular probe of [Fe(CN)6]4− was first oxidized at the Pt ultramicroelectrode (UME) (ET = 0.6 V vs. Ag/AgCl) to generate [Fe(CN)6]3−. The formed [Fe(CN)6]3− diffuses to the photocathode surface and subsequently reacts with the photoelectrons.49,50Fig. 4b presents the probe approach curves (IT–L curves) of the samples under illumination, among which Ni–N4@C/CuO has the largest positive feedback current. In contrast, the approach curves without illumination show poor feedback effects, demonstrating the promotion effect of photoelectrons (Fig. S18†). In addition, the effective heterogeneous charge transfer rate constant (keff) can be gained by data fitting (Table S1†) and plotted in Fig. 4c. From the above results, keff manifests an increasing trend of Ni–N4@C/CuO > C/CuO > Ni–N2O2@C/CuO > CuO. The solid–liquid interfacial charge transfer rate of Ni–N4@C/CuO is about 2.4 times higher than that of Ni–N2O2@C/CuO, which means that the modulation of the surface charge transfer pathway plays a beneficial role in promoting reaction kinetics.
1, and the intensity was almost unchanged after mixing with samples before irradiation (Fig. S17†). However, the signal intensity of TEMPO in the mixed solution decreased rapidly after 2 min of irradiation, indicating that the photoelectron reduces spin-labeled TEMPO to an EPR silencing product. The greatest decline in EPR signal intensity was found for C/CuO and Ni–N4@C/CuO, where more photoelectrons are exchanged for the photo-reduction reaction. To further uncover how the surface photoelectron reaction kinetics influence the PEC performance, scanning electrochemical microscopy (SECM) characterization in feedback mode was performed on the CuO and Ni SA@C/CuO samples. The molecular probe of [Fe(CN)6]4− was first oxidized at the Pt ultramicroelectrode (UME) (ET = 0.6 V vs. Ag/AgCl) to generate [Fe(CN)6]3−. The formed [Fe(CN)6]3− diffuses to the photocathode surface and subsequently reacts with the photoelectrons.49,50Fig. 4b presents the probe approach curves (IT–L curves) of the samples under illumination, among which Ni–N4@C/CuO has the largest positive feedback current. In contrast, the approach curves without illumination show poor feedback effects, demonstrating the promotion effect of photoelectrons (Fig. S18†). In addition, the effective heterogeneous charge transfer rate constant (keff) can be gained by data fitting (Table S1†) and plotted in Fig. 4c. From the above results, keff manifests an increasing trend of Ni–N4@C/CuO > C/CuO > Ni–N2O2@C/CuO > CuO. The solid–liquid interfacial charge transfer rate of Ni–N4@C/CuO is about 2.4 times higher than that of Ni–N2O2@C/CuO, which means that the modulation of the surface charge transfer pathway plays a beneficial role in promoting reaction kinetics.
PEC biosensing properties based on Ni–N4@C/CuO
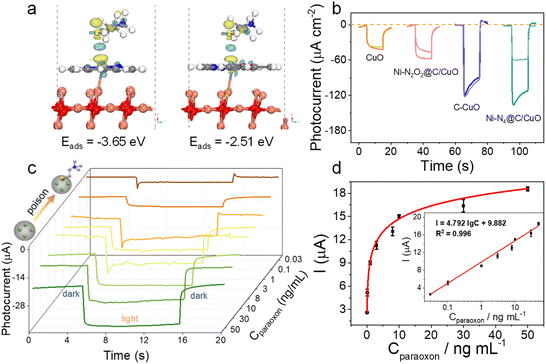
Based on the above research, we applied this Ni SA@C/CuO photocathode to the detection of paraoxon, an acetylcholinesterase (AChE) inhibitor. Thiocholine, the enzymolysis product of acetylthiocholine (ATCh), can effectively poison Ni single-atom sites, resulting in a slow surface reaction kinetics of the photoelectrode. First, to study the sensitivity of different electrode materials to thiocholine molecules, we calculated the charge density differences of Ni–N4@C/CuO (110) and Ni–N2O2@C/CuO (110) to simulate the interaction between surface active sites and sulfhydryl molecules. As displayed in Fig. 5a, Ni–N4@C/CuO (110) reflects a stronger charge transfer process and adsorption performance. As a result, the photocurrent changes of the four samples were also observed after being poisoned with thiocholine (Fig. 5b). Interestingly, Ni–N4@C/CuO was seriously poisoned by the sulfhydryl molecule with a noticeable decrease in photocurrent. The order of ability in being poisoned is Ni–N4@C/CuO > Ni–N2O2@C/CuO > C/CuO ≈ CuO, which is in accordance with the theoretical calculations. Hence, we selected the optimized Ni–N4@C/CuO materials to monitor the concentration of paraoxon. The Ni–N4@C/CuO with a feed ratio of 7.4% Ni–N4@C reflects the best photocurrent (Fig. S19 and Table S2†). In addition, the concentrations of the enzyme and substrate were finally selected as 500 mU mL−1 and 1 mM according to the optimization results (Fig. S20†). Under optimized experimental conditions, the I–t curves of the fabricated photocathode incubated with different concentrations of paraoxon are illustrated in Fig. 5c. The photocurrent linearly increased with the logarithm of paraoxon concentrations from 0.03 to 50 ng mL−1, and the linear regression equation (Fig. 5d) can be given by I = 4.792 lg![[thin space (1/6-em)]](https://www.rsc.org/images/entities/char_2009.gif) C + 9.882 (R2 = 0.996) with a limit of detection (LOD) of 0.02 ng mL−1 (signal-to-noise ratio of 3). The as-prepared PEC sensing platform also expresses good selectivity to different interfering species, including, Na+, Zn2+, Mg2+, ascorbic acid (AA), glycine, vitamin E (VE), glucose, and bovine serum albumin (BSA) (Fig. S21†). Besides, the developed Ni SA@C/CuO photocathode demonstrates better PEC stability under consecutive on–off light irradiation for 300 s in comparison with the bare CuO (Fig. S22†), which can be ascribed to the weakened redox peak of CuO after loading Ni SA@C for the prevention of photo corrosion (Fig. S23†). Finally, the reliability and practicability of the PEC sensing platform were evaluated in the paraoxon-adsorbed real samples of cucumber, tomato, apple, and cabbage. The recovery rates are in the range of 90.00–110.5% with the relative standard deviations ranging from 1.56 to 7.25% (Table S3†), which is in accordance with the results measured by gas chromatography (Fig. S24†), implying potential application in practical sample analysis.
C + 9.882 (R2 = 0.996) with a limit of detection (LOD) of 0.02 ng mL−1 (signal-to-noise ratio of 3). The as-prepared PEC sensing platform also expresses good selectivity to different interfering species, including, Na+, Zn2+, Mg2+, ascorbic acid (AA), glycine, vitamin E (VE), glucose, and bovine serum albumin (BSA) (Fig. S21†). Besides, the developed Ni SA@C/CuO photocathode demonstrates better PEC stability under consecutive on–off light irradiation for 300 s in comparison with the bare CuO (Fig. S22†), which can be ascribed to the weakened redox peak of CuO after loading Ni SA@C for the prevention of photo corrosion (Fig. S23†). Finally, the reliability and practicability of the PEC sensing platform were evaluated in the paraoxon-adsorbed real samples of cucumber, tomato, apple, and cabbage. The recovery rates are in the range of 90.00–110.5% with the relative standard deviations ranging from 1.56 to 7.25% (Table S3†), which is in accordance with the results measured by gas chromatography (Fig. S24†), implying potential application in practical sample analysis.
Conclusions
In summary, we have developed an innovative coupling method to regulate atomically dispersed catalytic sites (Ni–N4 and Ni–N2O2) on electron transport layers for the interpretation of carrier dynamics in semiconductor/electrocatalyst/electrolyte interfaces. The atomic design of active centers on electron transport layers offers a modulated surface energy structure for electron extraction and a favorable charge transfer channel for facilitated activation of reactants, thus enhancing PEC stability and responsivity. In comparison to Ni–N2O2@C, the modification of p-type semiconductor CuO with the Ni–N4@C electron transport layer greatly reduces the barriers to photoelectron migration and the surface ORR, achieving the best photocurrent response. Thanks to this outstanding electron transport layer, a sensitive and quantitative PEC assay of paraoxon was successfully realized using the as-prepared Ni–N4@C/CuO photocathode. The demonstrated charge transport layer design strategy opens an avenue for facilitating charge transfer and accelerating surface reaction kinetics by the construction of atomically dispersed catalytic sites.Data availability
The data that support the findings of this study are available in the ESI† of this article.Author contributions
Ying Qin: investigation, data Curation, writing-original draft. Rong Tan: providing help in measurements. Jing Wen: theoretical calculation. Qikang Huang: scanning electrochemical microscopy analysis. Hengjia Wang: formal analysis. Mingwang Liu: validation. Jinli Li: validation. Canglong Wang: theoretical calculation. Yan Shen: scanning electrochemical microscopy analysis. Liuyong Hu: supervision, conceptualization, writing-review & editing. Wenling Gu: supervision, methodology, formal analysis. Chengzhou Zhu: supervision, funding acquisition, writing-review & editing, project administration.Conflicts of interest
There are no conflicts to declare.Acknowledgements
The authors gratefully acknowledge the financial support from the National Natural Science Foundation of China (no. 22104114), the Natural Science Foundation of Hubei Province (2021CFB518), the Fundamental Research Funds for the Central Universities (no. CCNU22JC006), and the Program of Introducing Talents of Discipline to Universities of China (111 program, B17019).Notes and references
- D. E. Scaife, Sol. Energy, 1980, 25, 41–54 CrossRef CAS.
- M.-H. Ham, J. H. Choi, A. A. Boghossian, E. S. Jeng, R. A. Graff, D. A. Heller, A. C. Chang, A. Mattis, T. H. Bayburt, Y. V. Grinkova, A. S. Zeiger, K. J. Van Vliet, E. K. Hobbie, S. G. Sligar, C. A. Wraight and M. S. Strano, Nat. Chem., 2010, 2, 929–936 CrossRef CAS PubMed.
- W.-W. Zhao, J.-J. Xu and H.-Y. Chen, Chem. Soc. Rev., 2015, 44, 729–741 RSC.
- R. Saran and R. J. Curry, Nat. Photonics, 2016, 10, 81–92 CrossRef CAS.
- S. Cestellos-Blanco, H. Zhang, J. M. Kim, Y.-X. Shen and P. Yang, Nat. Catal., 2020, 3, 245–255 CrossRef CAS.
- Q. Wang and K. Domen, Chem. Rev., 2020, 120, 919–985 CrossRef CAS PubMed.
- Y.-F. Xu, H.-S. Rao, B.-X. Chen, Y. Lin, H.-Y. Chen, D.-B. Kuang and C.-Y. Su, Adv. Sci., 2015, 2, 1500049 CrossRef PubMed.
- R. A. Pala, A. J. Leenheer, M. Lichterman, H. A. Atwater and N. S. Lewis, Energy Environ. Sci., 2014, 7, 3424–3430 RSC.
- C. Li, Z. Luo, T. Wang and J. Gong, Adv. Mater., 2018, 30, 1707502 CrossRef PubMed.
- S. M. Thalluri, L. Bai, C. Lv, Z. Huang, X. Hu and L. Liu, Adv. Sci., 2020, 7, 1902102 CrossRef CAS PubMed.
- F. Lin and S. W. Boettcher, Nat. Mater., 2014, 13, 81–86 CrossRef CAS PubMed.
- X. Ning, P. Du, Z. Han, J. Chen and X. Lu, Angew. Chem., Int. Ed., 2021, 60, 3504–3509 CrossRef CAS PubMed.
- G. Zhao, Y. Sun, W. Zhou, X. Wang, K. Chang, G. Liu, H. Liu, T. Kako and J. Ye, Adv. Mater., 2017, 29, 1703258 CrossRef PubMed.
- L. Li, X. Yang, Y. Lei, H. Yu, Z. Yang, Z. Zheng and D. Wang, Chem. Sci., 2018, 9, 8860–8870 RSC.
- G. M. Carroll and D. R. Gamelin, J. Mater. Chem. A, 2016, 4, 2986–2994 RSC.
- M. R. Nellist, F. A. L. Laskowski, F. Lin, T. J. Mills and S. W. Boettcher, Acc. Chem. Res., 2016, 49, 733–740 CrossRef CAS PubMed.
- J. R. Hemmerling, A. Mathur and S. Linic, Adv. Energy Mater., 2022, 12, 2103798 CrossRef CAS.
- D. V. Esposito, I. Levin, T. P. Moffat and A. A. Talin, Nat. Mater., 2013, 12, 562–568 CrossRef CAS PubMed.
- N. Zhang, M.-Q. Yang, Z.-R. Tang and Y.-J. Xu, ACS Nano, 2014, 8, 623–633 CrossRef CAS PubMed.
- L. An and H. Onishi, ACS Catal., 2015, 5, 3196–3206 CrossRef CAS.
- X. Ning, B. Lu, Z. Zhang, P. Du, H. Ren, D. Shan, J. Chen, Y. Gao and X. Lu, Angew. Chem., Int. Ed., 2019, 58, 16800–16805 CrossRef CAS PubMed.
- K. Wang, Y. Liu, K. Kawashima, X. Yang, X. Yin, F. Zhan, M. Liu, X. Qiu, W. Li, C. B. Mullins and J. Li, Adv. Sci., 2020, 7, 2002563 CrossRef CAS PubMed.
- T. A. Pham, Y. Ping and G. Galli, Nat. Mater., 2017, 16, 401–408 CrossRef CAS PubMed.
- M. B. Gawande, K. Ariga and Y. Yamauchi, Small, 2021, 17, 2101584 CrossRef CAS PubMed.
- S. Sultan, J. N. Tiwari, A. N. Singh, S. Zhumagali, M. Ha, C. W. Myung, P. Thangavel and K. S. Kim, Adv. Energy Mater., 2019, 9, 1900624 CrossRef.
- C. Gao, J. Low, R. Long, T. Kong, J. Zhu and Y. Xiong, Chem. Rev., 2020, 120, 12175–12216 CrossRef CAS PubMed.
- X. Li, W. Bi, L. Zhang, S. Tao, W. Chu, Q. Zhang, Y. Luo, C. Wu and Y. Xie, Adv. Mater., 2016, 28, 2427–2431 CrossRef CAS PubMed.
- P. Zhou, M. Luo and S. Guo, Nat. Rev. Chem., 2022, 6, 823–838 CrossRef CAS PubMed.
- J. N. Tiwari, A. N. Singh, S. Sultan and K. S. Kim, Adv. Energy Mater., 2020, 10, 2000280 CrossRef CAS.
- Y. Wu, W. Xu, L. Jiao, W. Gu, D. Du, L. Hu, Y. Lin and C. Zhu, Chem. Soc. Rev., 2022, 51, 6948–6964 RSC.
- W. Xu, L. Jiao, Y. Wu, L. Hu, W. Gu and C. Zhu, Adv. Mater., 2021, 33, 2005172 CrossRef CAS PubMed.
- C. Ding, J. Shi, Z. Wang and C. Li, ACS Catal., 2017, 7, 1706 CrossRef CAS.
- S. Chen, S. Shen, G. Liu, Y. Qi, F. Zhang and C. Li, Angew. Chem., Int. Ed., 2015, 54, 3047–3051 CrossRef CAS PubMed.
- F. Chen, T. Ma, T. Zhang, Y. Zhang and H. Huang, Adv. Mater., 2021, 33, 2005256 CrossRef CAS PubMed.
- X. Bai, X. Zhao, Y. Zhang, C. Ling, Y. Zhou, J. Wang and Y. Liu, J. Am. Chem. Soc., 2022, 144, 17140–17148 CrossRef CAS PubMed.
- X. Wei, S. Song, W. Cai, X. Luo, L. Jiao, Q. Fang, X. Wang, N. Wu, Z. Luo, H. Wang, Z. Zhu, J. Li, L. Zheng, W. Gu, W. Song, S. Guo and C. Zhu, Chem, 2023, 9, 181–197 CAS.
- V. Vij, S. Sultan, A. M. Harzandi, A. Meena, J. N. Tiwari, W.-G. Lee, T. Yoon and K. S. Kim, ACS Catal., 2017, 7, 7196–7225 CrossRef CAS.
- S. Liu, H. B. Yang, S.-F. Hung, J. Ding, W. Cai, L. Liu, J. Gao, X. Li, X. Ren, Z. Kuang, Y. Huang, T. Zhang and B. Liu, Angew. Chem., Int. Ed., 2020, 59, 798–803 CrossRef CAS PubMed.
- R. Anand, A. S. Nissimagoudar, M. Umer, M. Ha, M. Zafari, S. Umer, G. Lee and K. S. Kim, Adv. Energy Mater., 2021, 11, 2102388 CrossRef CAS.
- H. Yang, L. Shang, Q. Zhang, R. Shi, G. I. N. Waterhouse, L. Gu and T. Zhang, Nat. Commun., 2019, 10, 4585 CrossRef PubMed.
- Y. Wang, R. Shi, L. Shang, G. I. N. Waterhouse, J. Zhao, Q. Zhang, L. Gu and T. Zhang, Angew. Chem., Int. Ed., 2020, 59, 13057–13062 CrossRef CAS PubMed.
- M. Zhang, M. Lu, Z.-L. Lang, J. Liu, M. Liu, J.-N. Chang, L.-Y. Li, L.-J. Shang, M. Wang, S.-L. Li and Y.-Q. Lan, Angew. Chem., Int. Ed., 2020, 59, 6500–6506 CrossRef CAS PubMed.
- M. Zhang, X. Wang, H. Sun, N. Wang, J. He, N. Wang, Y. Long, C. Huang and Y. Li, ACS Cent. Sci., 2020, 6, 950–958 CrossRef CAS PubMed.
- Z. Zhang and J. T. Yates Jr, Chem. Rev., 2012, 112, 5520–5551 CrossRef CAS PubMed.
- V. Subramanian, E. E. Wolf and P. V. Kamat, J. Am. Chem. Soc., 2004, 126, 4943–4950 CrossRef CAS PubMed.
- M. Sun and X. Cui, Electrochem. Commun., 2012, 20, 133–136 CrossRef CAS.
- A. I. Kontos, V. Likodimos, T. Stergiopoulos, D. S. Tsoukleris, P. Falaras, I. Rabias, G. Papavassiliou, D. Kim, J. Kunze and P. Schmuki, Chem. Mater., 2009, 21, 662–672 CrossRef CAS.
- W. He, H. Jia, W. G. Wamer, Z. Zheng, P. Li, J. H. Callahan and J.-J. Yin, J. Catal., 2014, 320, 97–105 CrossRef CAS.
- Z. Yu, Q. Huang, X. Jiang, X. Lv, X. Xiao, M. Wang, Y. Shen and G. Wittstock, Anal. Chem., 2021, 93, 12221–12229 CrossRef CAS PubMed.
- G. Wittstock, M. Burchardt, S. E. Pust, Y. Shen and C. Zhao, Angew. Chem., Int. Ed., 2007, 46, 1584–1617 CrossRef CAS PubMed.
Footnote |
| † Electronic supplementary information (ESI) available. See DOI: https://doi.org/10.1039/d3sc01523h |
| This journal is © The Royal Society of Chemistry 2023 |

