
 Open Access Article
 This Open Access Article is licensed under a Creative Commons Attribution-Non Commercial 3.0 Unported Licence
Bright near-infrared circularly polarized electrochemiluminescence from Au9Ag4 nanoclusters†
Lirong
Jiang‡
,
Mengmeng
Jing‡
,
Bing
Yin
,
Wenjun
Du
,
Xiaojian
Wang
,
Ying
Liu
,
Shuang
Chen
 * and
Manzhou
Zhu
*
* and
Manzhou
Zhu
*
Institutes of Physical Science and Information Technology, Centre for Atomic Engineering of Advanced Materials, Key Laboratory of Structure and Functional Regulation of Hybrid Materials of Ministry of Education, Department of Chemistry, Anhui Province Key Laboratory of Chemistry for Inorganic/Organic Hybrid Functionalized Materials, Anhui University, Hefei, Anhui 230601, China. E-mail: chenshuang@ahu.edu.cn; zmz@ahu.edu.cn
First published on 7th June 2023
Abstract
Metal nanoclusters are excellent electrochemiluminescent luminophores owing to their rich electrochemical and optical properties. However, the optical activity of their electrochemiluminescence (ECL) is unknown. Herein, we achieved, for the first time, the integration of optical activity and ECL, i.e., circularly polarized electrochemiluminescence (CPECL), in a pair of chiral Au9Ag4 metal nanocluster enantiomers. Chiral ligand induction and alloying were employed to endow the racemic nanoclusters with chirality and photoelectrochemical reactivity. S-Au9Ag4 and R-Au9Ag4 exhibited chirality and bright-red emission (quantum yield = 4.2%) in the ground and excited states. The enantiomers showed mirror-imaged CPECL signals at 805 nm owing to their highly intense and stable ECL emission in the presence of tripropylamine as a co-reactant. The ECL dissymmetry factor of the enantiomers at 805 nm was calculated to be ±3 × 10⁻³, which is comparable with that obtained from their photoluminescence. The obtained nanocluster CPECL platform shows the discrimination of chiral 2-chloropropionic acid. The integration of optical activity and ECL in metal nanoclusters provides the opportunity to achieve enantiomer discrimination and local chirality detection with high sensitivity and contrast.
Electrochemiluminescence (ECL), a property that combines electrochemistry and chemiluminescence (CL), may be observed when electroactive species are reduced or oxidized and the generated redox species undergoes chemical reactions to produce excited luminophores that emit light.1,2 ECL is a versatile analytical, immunological, and imaging method owing to its advantages of enhanced temporal and spatial controllability compared with CL, as well as lower background interference and higher signal-to-noise ratio compared with photoluminescence.3–5 The long-term goals of researchers in this field include the development of novel luminophores,6 exploration of new ECL mechanisms,7–13 and exploitation of new detection14–16 and imaging17–20 platforms. ECL spectroscopy to determine the emission intensity and spectra of luminophores has been applied in emission mechanism studies and practical applications to sense trace amounts of target molecules.21–23
Circularly polarized luminescence (CPL) spectroscopy is an analytical technique that provides important information about chiral materials in the excited state.24–26 Chiral materials demonstrating CPL have unique applications in displays,27 polarized lasers,28 chiral sensing,29–31 and optical imaging.32 The combination of CPL and ECL in a single analytical technique, that is, circularly polarized electrochemiluminescence (CPECL) spectroscopy, is expected to integrate the merits of CPL and ECL to achieve chiral detection with high sensitivity and contrast and low background interference. Although pyrene-18C6 and [Ru(phen)3][ClO4]2 complexes have been reported to exhibit CPECL performance,33,34 studies on the CPECL of luminophores remain limited.
Metal nanoclusters protected by ligands have received wide attention owing to their definite structure, intense quantum-size effect, and rich physicochemical properties, including chiral, electrochemical, and optical properties.35–42 Metal nanoclusters have been demonstrated to be excellent ECL luminophores.23,43,44 The ECLs of Au25, Au38, and Au144 nanoclusters in the co-reactant pathway were previously reported by Ding and coworkers.45–47 We recently demonstrated the intense ECL of rod-shaped bimetallic Au12Ag13 nanoclusters via the self-annihilation and co-reactant pathways.48 However, the achiral or racemic properties of these materials limit research on the CPECL of metal nanoclusters. Thus, whether the ECL produced by chiral nanoclusters is circularly polarized and whether CPECL could be generalized and detected in metal nanoclusters are unknown. These issues may be attributed to the difficulty of simultaneously achieving chiral structures, intense emission, and good electrochemical performance.
Herein, we constructed metal nanocluster enantiomers with chirality and strong emission, namely, S-Au9Ag4 and R-Au9Ag4 (S-Au9Ag4 = [Au9Ag4(S-DIOP)4Cl4]Cl; R-Au9Ag4 = [Au9Ag4(R-DIOP)4Cl4]Cl; S/R-DIOP = 1,4-bis(diphenylphosphino)-2,3-o-isopropylidene-2,3-butanediol) to study the optical activity of their ECL. Intense red-emissive and chiral S-Au9Ag4 and R-Au9Ag4 nanoclusters were constructed by alloying and chiral ligand induction, and the optical and electrochemical performance of the resultant molecules was investigated. A pair of mirrored CPECL peaks at 805 nm was observed in the oxidative reduction pathway of S-Au9Ag4 and R-Au9Ag4 when tripropylamine (TPrA) was used as a co-reactant. The CPECL dissymmetry factor of the nanoclusters was calculated to be gECL = ±5 × 10⁻³, which is comparable with the gPL (±3 × 10⁻³) obtained from their PL.
The chirality of nanoclusters usually originates from the inherent chirality of the metal core, chiral arrangement of motifs, and chiral ligands.42 The introduction of chiral ligands endows achiral or racemic nanoclusters with optical activity.49–51 Alloying can improve the PL of nanoclusters.52,53 In this study, racemic Au9Ag4 protected by bisdiphenylphosphinobutane (DPPB) was first prepared, and its composition was characterized by ESI-MS, XPS (Fig. S1†), 1H NMR (Fig. S2†), 31P NMR (Fig. S3†), and TGA (Fig. S4†). The molecular formula of the Au9Ag4 nanocluster was determined to be [Au9Ag4(DPPB)4Cl4]+ by ESI-MS analysis (Fig. 1b, black line). The structure of [Au9Ag4(DPPB)4Cl4]Cl was determined using single-crystal XRD, as shown in the inset of Fig. 1a and detailed in Table S1.† A pair of enantiomers was observed in a unit cell (Fig. 1d), indicating that the nanoclusters are racemic. The chirality of the nanoclusters originated from the chiral arrangement of the protecting motif. The chiral ligand S/R-DIOP was used to obtain optically pure Au9Ag4 nanoclusters, and chiral S-Au9Ag4 and R-Au9Ag4 nanoclusters were prepared. The ESI-MS spectra of S-Au9Ag4 and R-Au9Ag4 showed peaks at 4339.9, consistent with the formula [Au9Ag4(DIOP)4Cl4]+ (Fig. 1b, blue and green lines). The UV-vis spectra of S-Au9Ag4 and R-Au9Ag4 were similar to that of [Au9Ag4(DPPB)4Cl4]Cl, indicating the similarity of their structures (Fig. 1a). XPS further confirm the composition of [Au9Ag4(DIOP)4Cl4]+ (Fig. S5†). The PL spectra of Au9Ag4, S-Au9Ag4, and R-Au9Ag4 were centered at 760 nm, and their lifetimes were 0.21, 0.80, and 0.94 μs, respectively (Fig. S6†). The PL quantum yields of Au9Ag4, S-Au9Ag4, and R-Au9Ag4 were 2.96%, 3.56% and 4.20%, respectively.
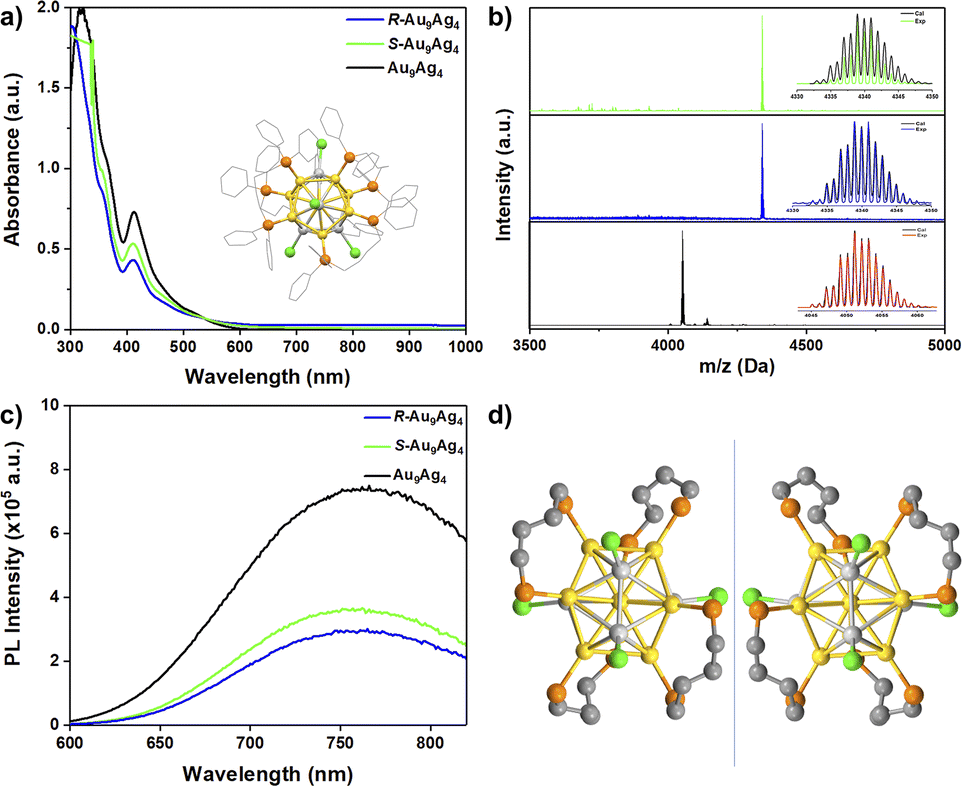 | ||
| Fig. 1 (a) UV-vis absorption spectra of Au9Ag4 (black), R-Au9Ag4 (blue), and S-Au9Ag4 (green). The inset shows the structure of a Au9Ag4 nanocluster. (b) ESI-MS spectra of Au9Ag4 (black), R-Au9Ag4 (blue), and S-Au9Ag4 (green). (c) PL spectra of Au9Ag4 (black), R-Au9Ag4 (blue), and S-Au9Ag4 (green). (d) Au9Ag4 enantiomer pairs. Color label: gold = Au, white = Ag, green = Cl, orange = P, gray = C; all benzene rings were omitted for clarity. | ||
The circular dichroism (CD) and CPL spectra of S-Au9Ag4 and R-Au9Ag4 were investigated to determine their optical activities. As shown in Fig. 2a, the CD spectra of S-Au9Ag4 and R-Au9Ag4 are mirror-imaged and show main peaks at 325, 360, and 375 nm, minor peaks at 345, 420, 460, and 490 nm, and a shoulder peak at 550 nm. These results reflect the ground-state chirality of S-Au9Ag4 and R-Au9Ag4. The concentration-independent anisotropy factor (gabs = 2(AL − AR)/(AL + AR)) of the nanoclusters was calculated from their CD spectra (Fig. 2b) and found to be 2.8 × 10⁻³ at 600 nm. To understand the optical activity of S-Au9Ag4 and R-Au9Ag4 in the excited state further, their CPL spectra were recorded. As shown in Fig. 2c, S-Au9Ag4 and R-Au9Ag4 manifested strong CPL activity at ∼760 nm, with negative and positive signals, respectively. The anisotropy factors (g-factor) of S/R-Au9Ag4 were calculated to be gPL (R) = 2.84 × 10⁻³ and gPL (S) = −2.33 × 10⁻³, respectively.
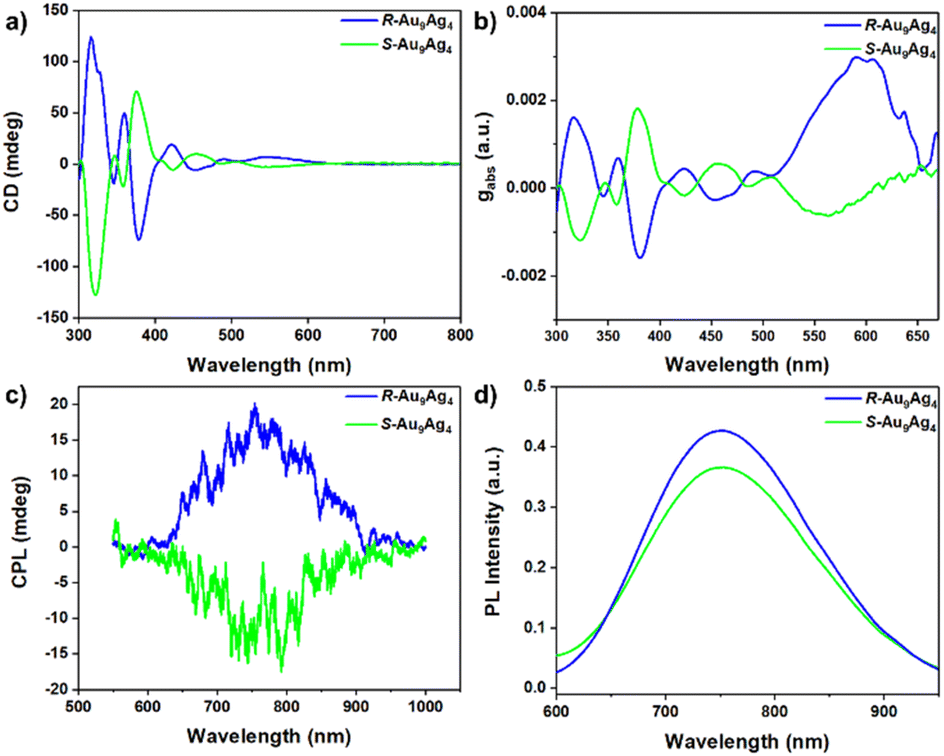 | ||
| Fig. 2 (a) CD spectra of R-Au9Ag4 (blue) and S-Au9Ag4 (green). (b) Anisotropy factors (g-factors) of R-Au9Ag4 (blue) and S-Au9Ag4 (green) nanoclusters. (c) CPL spectra of R-Au9Ag4 (blue) and S-Au9Ag4 (green). (d) Corresponding PL spectra of R-Au9Ag4 (blue) and S-Au9Ag4 (green) during CPL detection. R-Au9Ag4 and S-Au9Ag4 nanoclusters were dissolved in DCM for the CD and CPL experiments. | ||
S-Au9Ag4 and R-Au9Ag4 were subjected to cyclic voltammetry (CV) to determine the appropriate potential for ECL generation. Experiments were performed in dichloromethane (DCM) with a glassy carbon working electrode. As shown in Fig. 3a, S-Au9Ag4 and R-Au9Ag4 exhibit similar voltammetric features, which indicates that they have the same electronic state. Two-step reduction bands centered at ER1 = −0.819 V and ER2 = −1.432 V and a one-step oxidation band centered at EO1 = 1.106 V were also observed. The reduction currents in the first and second reduction steps were identical, and the oxidation current was two times greater than the reduction current at each step. Thus, two electrons were injected to generate Au9Ag40 and Au9Ag41− during reduction scanning, and two electrons were removed to generate Au9Ag43+ during oxidation scanning in the voltammetry experiment. The electrochemical gaps were calculated to be 1.925 V, which is consistent with their optical gaps 1.952 eV (Fig. S7†).
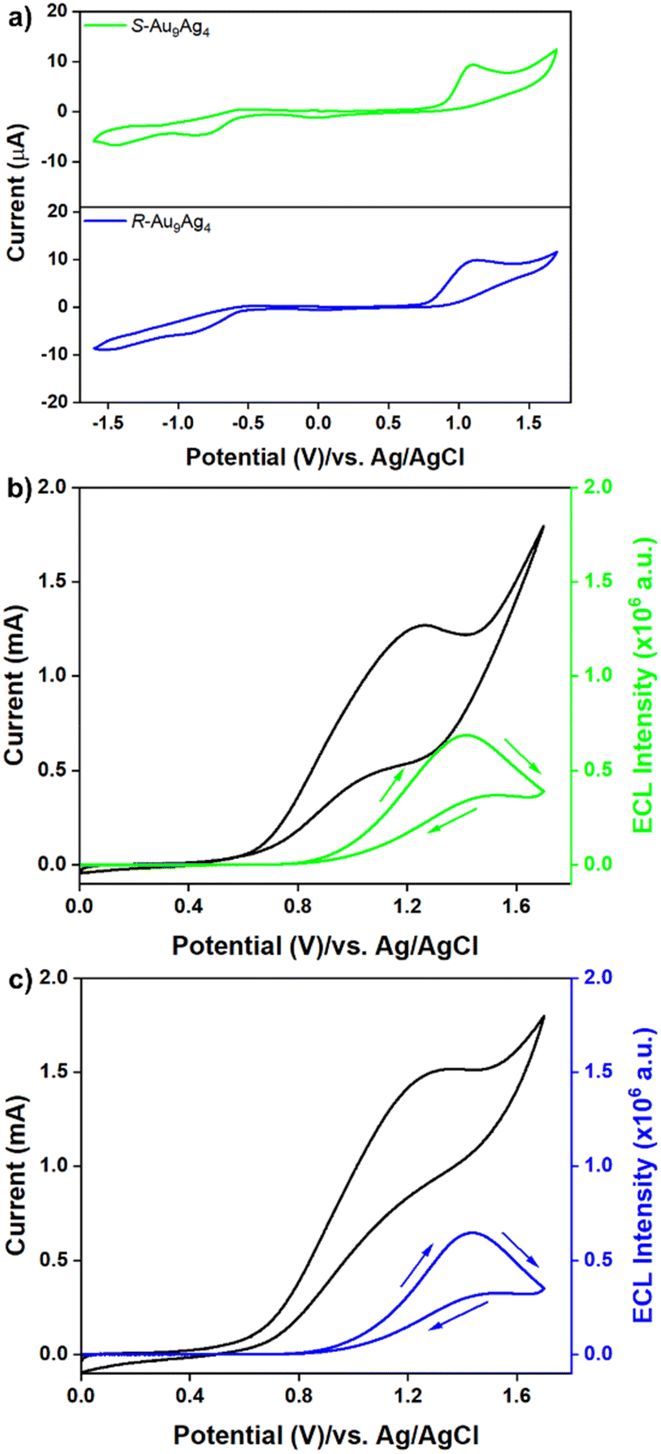 | ||
| Fig. 3 (a) Voltammetric characterization of R/S-Au9Ag4 in degassed DCM with 0.1 M tetrabutylammonium perchlorate (TBAP) as the supporting electrolyte. (b) and (c) CV (black curve) and corresponding ECL signal (blue/green curves) recorded in DCM containing 0.23 mM R/S-Au9Ag4, 700 mM TPrA, and 0.1 M TBAP. A platinum mesh electrode and Ag/AgCl wire were used as the working and reference electrodes, respectively. Scan rate = 0.1 V s−1. | ||
The ECL performance of the samples in the co-reactant pathway was explored because luminophores usually present relatively strong and stable signals in the presence of a co-reactant. Fig. 3b and c show the ECLs of S-Au9Ag4 and R-Au9Ag4 with TPrA as the co-reactant when the potential was scanned from 0 to 1.7 V. Both nanoclusters displayed similar ECL profiles. TPrA oxidation occurs at 0.7 V, but the ECL signals were observed at an onset potential of 0.9 V, thus implying that ECL formation requires the oxidation of both the luminophore and co-reactant by the electrode reactions. Step-ECL has been demonstrated to generate more durable and stable signals than CV-ECL, which is highly desirable for ECL optical activity testing.48S-Au9Ag4 and R-Au9Ag4 displayed weaker ECL signals in the presence of benzoyl peroxide (BPO) as a co-reactant compared with TPrA (Fig. S8†). The ECL of the nanoclusters in the oxidative reduction pathway was explored to select a suitable co-reactant that could generate strong ECL signals and achieve high contrast. The concentration of the TPrA co-reactant was optimized in step ECL experiments to obtain higher and more stable signals (Fig. S9 and S10†). The intensity of the step ECL signals of S-Au9Ag4 and R-Au9Ag4 increased with increasing co-reactant concentration, peaked at 700 mM, and remained stable thereafter.
Because the S-Au9Ag4 and R-Au9Ag4 nanoclusters exhibited similar ECL behaviors, we selected S-Au9Ag4 as an example and explored its ECL spectra in the presence of different concentrations of TPrA. The ECL spectra of S-Au9Ag4 and R-Au9Ag4 under a holding potential of 0–1.7 V applied cyclically every 5 s were determined. The exposure time was set to 5 s. One spectrum was obtained from each nanocluster at a holding potential of 1.7 V. The ECL spectrum of S-Au9Ag4 shifted when different amounts of TPrA were used. As shown in Fig. S12 (right panel),† in 50 mM TPrA, the peak position of the ECL spectrum can be observed at 760 nm, which is consistent with the PL spectral position observed in Fig. 1c. As the TPrA concentration increased, the ECL spectrum of S-Au9Ag4 red-shifted. When the concentration of TPrA was 700 mM, the ECL emission peak of S-Au9Ag4 was detected at 805 nm. To assign the ECL spectra, we collected the PL spectra of S-Au9Ag4 electrolyzed at different potentials. According to the reduction peaks of S-Au9Ag4 (Fig. S11†), we collected the PL spectra of S-Au9Ag4 electrolyzed at −1.2, −1.6, and −2.4 V. As shown in the left panel in Fig. S12,† electrolyzed S-Au9Ag4 showed peaks at 780, 785, and 795 nm, corresponding to the emissions of (S-Au9Ag4)0, (S-Au9Ag4)1−, and (S-Au9Ag4)x− (x ≥ 2), respectively. The emission intensity of the nanoclusters decreases as the potential reaches more negative potentials (Fig. S13†). Although we attempted to excite only the electrolyzed nanoclusters near the electrode and collect their PL spectrum, the excitation light passing through the sample cell inevitably excited a few non-electrolyzed nanoclusters. Thus, the PL spectrum collected under electrolysis is actually the sum of the PL spectra of the electrolyzed sample and a small amount of the unelectrolyzed sample. That is, the PL spectra of (S-Au9Ag4)0, (S-Au9Ag4)1−, (S-Au9Ag4)x− may be more red-shifted than shown in the left panel in Fig. S12.† The ECL spectral peaks centered at 780, 790, and 805 nm can be respectively assigned to the ECL emissions of (S-Au9Ag4)0, (S-Au9Ag4)1−, combinations of clusters of multiple valences (S-Au9Ag4)x− (x ≥ 2). Similar ECL emission peak shifts have been observed in Au25 nanoclusters.23,54 The possible mechanism and major reaction processes of S-Au9Ag4 nanoclusters are presented in the ESI (Schemes S1–S4†). TPrA is oxidized by the electrode to produce strongly reductive TPrA radical after deprotonation. When a more positive potential is applied, the nanoclusters are oxidized. The strongly reductive TPrA reduces the nanoclusters to generate an excited-state nanoclusters that relaxes to the ground state and produces ECLs.
The optical activity of the ECL emissions of S-Au9Ag4 and R-Au9Ag4 was explored in two ways. In the first method, a commercial CPL instrument was used (Fig. S14†). It is used to collect the circularly polarized emissions, and the sample is excited externally under the condition of constant potential electrolysis. This method is simple but has high detection limits because it works with PL systems that typically have a stronger light signal than ECL systems. In the second method, a CCD with left- and right-handed circular polarizers applied to the optical path was used. Such method has higher sensitivity and detection limit due to the high sensitivity of the instrument for detection of weak light. As shown in Fig. S15 and S16,† the ECL spectra of S-Au9Ag4 and R-Au9Ag4 are centered at 805 nm. The CPECL spectra of S-Au9Ag4 and R-Au9Ag4 were collected using a commercial CPL instrument with triggering by an electrochemical reaction. As shown in Fig. 4a, a pair of mirror-imaged CPECL signals of S-Au9Ag4 and R-Au9Ag4 were observed. The ECL dissymmetric factors (gECL) of S-Au9Ag4 and R-Au9Ag4 were calculated to be ±3 × 10⁻³, which is comparable with the gPL obtained from their CPL. The dissymmetry factors (gECL or gPL) of the S-Au9Ag4 and R-Au9Ag4 nanoclusters are small, likely because of the relatively large nanocluster body and small chiral unit.
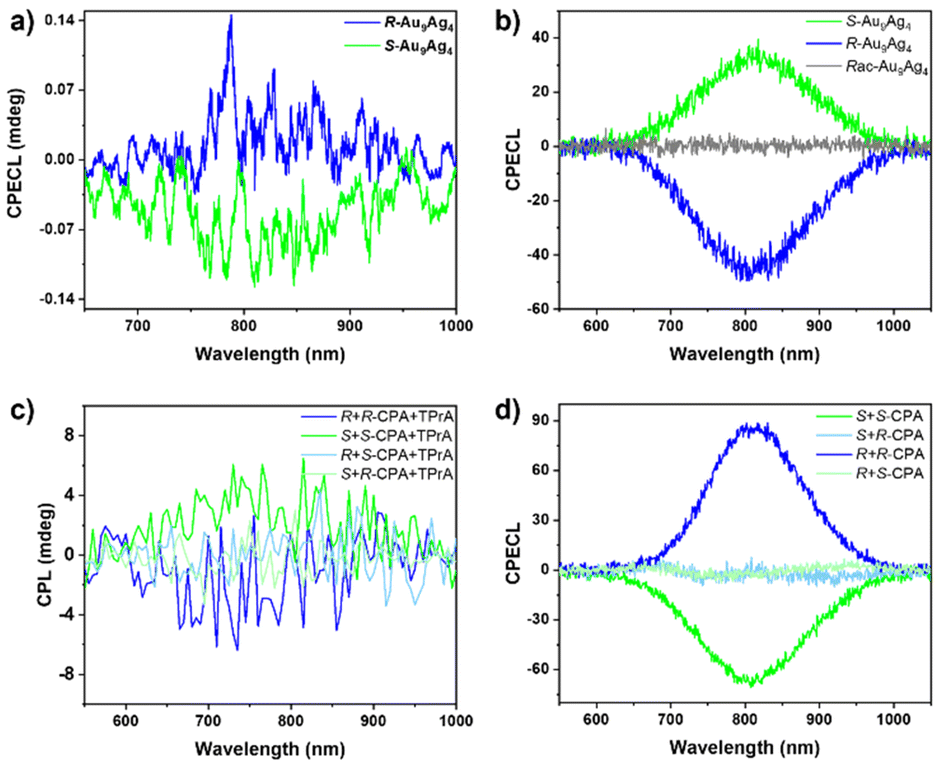 | ||
| Fig. 4 (a) CPECL of R-Au9Ag4 (blue) and S-Au9Ag4 (green) collected by commercial CPL instrument. 0.23 mM R/S-Au9Ag4 dissolved in DCM were subjected to CPECL testing under 1.7 V electrolysis. (b) CPECL of R-Au9Ag4 (blue) and S-Au9Ag4 (green) collected by adding circular polarizers. ECL spectra were collected in DCM containing 0.23 mM R/S-Au9Ag4, 700 mM TPrA, and 0.1 M TBAP. A platinum mesh electrode and Ag/AgCl wire were used as the working and reference electrodes, respectively. The CPECL spectra were obtained by subtracting the ECL spectrum obtained by inserting a right-handed circular polarizer from the ECL spectrum obtained by inserting a left-handed circular polarizer. (c) CPL spectra after adding 1 equivalent R-CPA or S-CPA to R-Au9Ag4 or S-Au9Ag4 dissolved in DCM. (d) CPECL spectra after adding R-CPA or S-CPA to R-Au9Ag4 or S-Au9Ag4. One equivalent R-CPA or S-CPA was added into R-Au9Ag4 or S-Au9Ag4, which is subjected to the CPECL experiments. | ||
In the second detection method, circular polarizers were used as filters to demonstrate the circular polarization of ECL produced by S-Au9Ag4 and R-Au9Ag4 (Fig. S17†). In general, a left-handed polarizer converts left-handed circularly polarized light into linearly polarized light. When right-handed circularly polarized light enters the polarizer from this direction, the output is zero. The opposite output is obtained when a right-handed polarizer is applied; that is, left-handed circularly polarized light cannot pass through a right-handed circular polarizer. Two spectra can be obtained when left- and right-handed circular polarizers are added to the light path. The spectrum obtained from the difference in the spectra collected after filtration by the left- and right-handed polarizers is the circularly polarized light produced by the luminophore. The CPECL spectrum of each enantiomer was obtained by subtracting the spectrum filtered by the right-handed circular polarizer from that filtered by the left-handed circular polarizer.
The ECL spectra of S-Au9Ag4 and R-Au9Ag4 collected before and after the addition of the left/right-handed circular polarizers are shown in Fig. S15 and S16,† respectively. Six experiments were performed for each enantiomer to evaluate the reproducibility of the results. The ECL intensity decreased when the circular polarizers were added to the light path; this result may be attributed to the influence of the intrinsic transmittance of the device. Similar results were obtained in all other experiments for each enantiomer. The ECL intensity of S-Au9Ag4 after filtration by the left-handed circular polarizer was higher than that obtained after filtration by the right-handed circular polarizer (Fig. S15†), resulting in positive CPECL signals (Fig. 4b, green line). Negative CPECL signals were observed for R-Au9Ag4 (Fig. 4b, blue line). The CPECL signal of R-Au9Ag4 was mirror-imaged with that of S-Au9Ag4. Differences in the intensity of the CPECL signals of the different groups are due to differences in the angle between the light and polarizer in these groups. Interestingly S-Au9Ag4 showed negative signals in its CPL but positive ones in its CPECL spectrum obtained by adding the circular polarizers. By contrast, R-Au9Ag4 showed positive signals in its CPL spectra but negative ones in its CPECL spectra obtained by adding the circular polarizers. The contradicting signals in the CPL and CPECL spectra are due to differences in the instruments and measurement procedure. The ECL spectra of racemic rac-Au9Ag4 (a mixture of S-Au9Ag4 and R-Au9Ag4 at a 1![[thin space (1/6-em)]](https://www.rsc.org/images/entities/char_2009.gif) :1 ratio) before and after passing through the left/right-handed circular polarizers demonstrated random features (i.e., some signals were positive, some signals were negative, and some signals were zero); thus, the averaged CPECL of racemic rac-Au9Ag4 showed a straight line (Fig. 4b, gray line).
:1 ratio) before and after passing through the left/right-handed circular polarizers demonstrated random features (i.e., some signals were positive, some signals were negative, and some signals were zero); thus, the averaged CPECL of racemic rac-Au9Ag4 showed a straight line (Fig. 4b, gray line).
In addition, discrimination against enantiomers was further investigated. Chiral carboxylic acid (S/R-2-chloropropanoic acid, S/R-CPA) were employed for the discrimination of this CPECL detection platform due to the binding ability of oxygen atoms to the silver atoms.55,56 The ECL intensity of S-Au9Ag4 after filtration by the left-handed circular polarizer was lower than that obtained after filtration by the right-handed circular polarizer after addition of S-CPA (Fig. S18†), indicating a negative CPECL signal (Fig. 4d, green line). The CPECL of S-Au9Ag4 is inverted after addition of S-CPA. For the R-Au9Ag4, the CPECL changed from an initial negative signal (Fig. 4b, blue line) to a positive signal (Fig. 4d, blue line) after adding the R-CPA (Fig. S19†). While adding the R-CPA into S-Au9Ag4 or adding the S-CPA into R-Au9Ag4, the ECL intensity showed comparable after filtration by the left-handed and right-handed circular polarizers (Fig. S20 and S21†), resulting in zero signals for CPECL (Fig. 4d, light green and light bule lines). The discrimination of nanoclusters against enantiomers was further studied using CPL. The CPL of the S-Au9Ag4 changed from negative (Fig. 2c, green line) to positive (Fig. 4c, green line) after adding the S-CPA and TPrA. While the CPL of the R-Au9Ag4 changed from positive (Fig. 2c, blue line) to negative (Fig. 4c, blue line) after adding the R-CPA and TPrA. The CPLs are zero when adding R-CPA to S-Au9Ag4 or adding S-CPA to R-Au9Ag4 (Fig. 4c, light green and light blue lines). However, addition of the chiral enantiomer or TPrA alone did not result in a change in the CPL signal (Fig. S22 and S23†). It may be that the nanoclusters formed adducts with chiral acids and TPrA leading to chiral changes.57
In conclusion, we unambiguously demonstrated that intense CPECL in the near-infrared region can be generated and detected from chiral Au9Ag4 metal nanoclusters. Chiral ligand induction and alloying were employed to obtain chiral and luminescent S/R-Au9Ag4 metal nanoclusters, and the photoelectrochemical performance of these nanoclusters was explored. The ECL emissions of the metal nanoclusters in the presence of TPrA as a co-reactant were centered at 805 nm. The mirror-imaged CPECL signals of S-Au9Ag4 and R-Au9Ag4 indicate that the construction and detection of CPL triggered by electrochemistry was successfully achieved. The obtained nanocluster CPECL platform shows the discrimination of chiral 2-chloropropionic acid. Our further work aims to explore and address the interactions between nanoclusters luminophore, co-reactant and discriminating enantiomers. Overall, this work establishes an integration platform of chirality and electrochemiluminescence in metal nanoclusters for discriminating enantiomers and developing novel chiral detection platforms.
Data availability
All the data are shown in the ESI. CCDC 2165721 contains the supplementary crystallographic data for this paper.Author contributions
L. J. and M. J. performed the synthesis, characterizations, optical and electrochemical tests, and ECL experiments. S. C. and L. J. analysed the data. B. Y., X. W., W. D., and Y. L. assisted in the synthesis and characterizations. S. C. and M. Z. directed the study. All authors prepared the manuscript.Conflicts of interest
There are no conflicts to declare.Acknowledgements
We acknowledge financial support provided by the National Natural Science Foundation of China (22004001, 21631001, 21871001), the University Synergy Innovation Program of Anhui Province (GXXT-2020-053), and the Anhui Provincial Natural Science Foundation (2008085QB84).Notes and references
- W. Miao, Chem. Rev., 2008, 108, 2506–2553 CrossRef CAS PubMed.
- M. M. Richter, Chem. Rev., 2004, 104, 3003–3036 CrossRef CAS PubMed.
- W. Guo, H. Ding, P. Zhou, Y. Wang and B. Su, Angew. Chem., Int. Ed., 2020, 59, 6745–6749 CrossRef CAS PubMed.
- W. Guo, P. Zhou, L. Sun, H. Ding and B. Su, Angew. Chem., Int. Ed., 2021, 60, 2089–2093 CrossRef CAS PubMed.
- L. Li, Y. Chen and J. J. Zhu, Anal. Chem., 2017, 89, 358–371 CrossRef CAS PubMed.
- W. Miao, J. P. Choi and A. J. Bard, J. Am. Chem. Soc., 2002, 124, 14478–14485 CrossRef CAS.
- S. Carrara, A. Aliprandi, C. F. Hogan and L. De Cola, J. Am. Chem. Soc., 2017, 139, 14605–14610 CrossRef CAS PubMed.
- S. Carrara, F. Arcudi, M. Prato and L. De Cola, Angew. Chem., Int. Ed., 2017, 56, 4757–4761 CrossRef CAS PubMed.
- H. Peng, Z. Huang, H. Deng, W. Wu, K. Huang, Z. Li, W. Chen and J. Liu, Angew. Chem., Int. Ed., 2020, 59, 9982–9985 CrossRef CAS PubMed.
- H. Peng, Z. Huang, Y. Sheng, X. Zhang, H. Deng, W. Chen and J. Liu, Angew. Chem., Int. Ed., 2019, 58, 11691–11694 CrossRef CAS PubMed.
- R. Tian, S. Zhang, M. Li, Y. Zhou, B. Lu, D. Yan, M. Wei, D. G. Evans and X. Duan, Adv. Funct. Mater., 2015, 25, 5006–5015 CrossRef CAS.
- T. Wang, D. Wang, J. W. Padelford, J. Jiang and G. Wang, J. Am. Chem. Soc., 2016, 138, 6380–6383 CrossRef CAS PubMed.
- Q. Zhai, H. Xing, X. Zhang, J. Li and E. Wang, Anal. Chem., 2017, 89, 7788–7794 CrossRef CAS.
- E. M. Gross, S. M. Maddipati and S. M. Snyder, Bioanalysis, 2016, 2071–2089 CrossRef CAS PubMed.
- Irkham, T. Watanabe, A. Fiorani, G. Valenti, F. Paolucci and Y. Einaga, J. Am. Chem. Soc., 2016, 138, 15636–15641 CrossRef CAS PubMed.
- Y. Wang, G. Zhao, H. Chi, S. Yang, Q. Niu, D. Wu, W. Cao, T. Li, H. Ma and Q. Wei, J. Am. Chem. Soc., 2021, 143, 504–512 CrossRef CAS PubMed.
- C. Ma, S. Wu, Y. Zhou, H. F. Wei, J. Zhang, Z. Chen, J. J. Zhu, Y. Lin and W. Zhu, Angew. Chem., Int. Ed., 2021, 60, 4907–4914 CrossRef CAS PubMed.
- J. Zhang, R. Jin, D. Jiang and H. Y. Chen, J. Am. Chem. Soc., 2019, 141, 10294–10299 CrossRef CAS PubMed.
- M. J. Zhu, J. B. Pan, Z. Q. Wu, X. Y. Gao, W. Zhao, X. H. Xia, J. J. Xu and H. Y. Chen, Angew. Chem., Int. Ed., 2018, 57, 4010–4014 CrossRef CAS PubMed.
- L. Xu, Z. Zhou, C. Zhang, Y. He and B. Su, Chem. Commun., 2014, 50, 9097–9100 RSC.
- C. Ma, W. Wu, Y. Peng, M.-X. Wang, G. Chen, Z. Chen and J.-J. Zhu, Anal. Chem., 2018, 90, 1334–1339 CrossRef CAS PubMed.
- S. Wu, C. Ma, Y. Gao, Y. Su, Q. Xia, Z. Chen and J.-J. Zhu, Anal. Chem., 2020, 92, 9940–9947 CrossRef CAS PubMed.
- M. Hesari and Z. Ding, Acc. Chem. Res., 2017, 50, 218–230 CrossRef CAS PubMed.
- X. Yang, X. Jin, L. Zhou, P. Duan, Y. Fan and Y. Wang, Angew. Chem., Int. Ed., 2022, 61, e202115600 CAS.
- M. Li, M. Y. Wang, Y. F. Wang, L. Feng and C. F. Chen, Angew. Chem., Int. Ed., 2021, 60, 20728–20733 CrossRef CAS PubMed.
- Y. Okayasu and J. Yuasa, Mol. Syst. Des. Eng., 2018, 3, 66–72 RSC.
- L. Xu, Y. Feng, D. Yu, Z. Zheng, X. Chen and W. Hong, Adv. Mater. Technol., 2020, 5, 2000373 CrossRef CAS.
- H. He, E. Ma, Y. Cui, J. Yu, Y. Yang, T. Song, C. D. Wu, X. Chen, B. Chen and G. Qian, Nat. Commun., 2016, 7, 11087 CrossRef CAS PubMed.
- R. Carr, N. H. Evans and D. Parker, Chem. Soc. Rev., 2012, 41, 7673–7686 RSC.
- Y. Yang, R. C. da Costa, M. J. Fuchter and A. J. Campbell, Nat. Photonics, 2013, 7, 634–638 CrossRef CAS.
- F. Zinna and L. Di Bari, Chirality, 2015, 27, 1–13 CrossRef CAS.
- M. C. Heffern, L. M. Matosziuk and T. J. Meade, Chem. Rev., 2014, 114, 4496–4539 CrossRef CAS.
- P. M. L. Blok, P. S. Cartwright, H. P. J. M. Dekkers and R. D. Gillard, J. Chem. Soc., Chem. Commun., 1987, 1232–1233, 10.1039/C39870001232.
- F. Zinna, S. Voci, L. Arrico, E. Brun, A. Homberg, L. Bouffier, T. Funaioli, J. Lacour, N. Sojic and L. Di Bari, Angew. Chem., Int. Ed., 2019, 58, 6952–6956 CrossRef CAS.
- R. Jin, C. Zeng, M. Zhou and Y. Chen, Chem. Rev., 2016, 116, 10346–10413 CrossRef CAS PubMed.
- I. Chakraborty and T. Pradeep, Chem. Rev., 2017, 117, 8208–8271 CrossRef CAS PubMed.
- R. W. S. Murray, Chem. Rev., 2008, 108, 2688–2720 CrossRef CAS PubMed.
- K. Kwak and D. Lee, Acc. Chem. Res., 2019, 52, 12–22 CrossRef CAS PubMed.
- X. Kang and M. Zhu, Chem. Soc. Rev., 2019, 48, 2422–2457 RSC.
- Y. Li, T. Higaki, X. Du and R. Jin, Adv. Mater., 2020, 32, e1905488 CrossRef PubMed.
- M. M. Zhang, K. Li and S. Q. Zang, Adv. Opt. Mater., 2020, 8, 1902152 CrossRef CAS.
- Y. Zhu, J. Guo, X. Qiu, S. Zhao and Z. Tang, Acc. Mater. Res., 2020, 2, 21–35 CrossRef.
- Y. M. Fang, J. Song, J. Li, Y. W. Wang, H. H. Yang, J. J. Sun and G. N. Chen, Chem. Commun., 2011, 47, 2369–2371 RSC.
- Y. Jiang, W. J. Guo, D. X. Kong, Y. T. Wang, J. Y. Wang and Q. H. Wei, Dalton Trans., 2015, 44, 3941–3944 RSC.
- M. Hesari, Z. Ding and M. S. Workentin, Organometallics, 2014, 33, 4888–4892 CrossRef CAS.
- M. Hesari, M. S. Workentin and Z. Ding, ACS Nano, 2014, 8, 8543–8553 CrossRef CAS PubMed.
- K. N. Swanick, M. Hesari, M. S. Workentin and Z. Ding, J. Am. Chem. Soc., 2012, 134, 15205–15208 CrossRef CAS PubMed.
- S. Chen, H. Ma, J. W. Padelford, W. Qinchen, W. Yu, S. Wang, M. Zhu and G. Wang, J. Am. Chem. Soc., 2019, 141, 9603–9609 CrossRef CAS PubMed.
- G. Deng, S. Malola, J. Yan, Y. Han, P. Yuan, C. Zhao, X. Yuan, S. Lin, Z. Tang, B. K. Teo, H. Hakkinen and N. Zheng, Angew. Chem., Int. Ed., 2018, 57, 3421–3425 CrossRef CAS PubMed.
- H. Yi, K. M. Osten, T. I. Levchenko, A. J. Veinot, Y. Aramaki, T. Ooi, M. Nambo and C. M. Crudden, Chem. Sci., 2021, 12, 10436–10440 RSC.
- Y. Yang, Q. Zhang, Z. J. Guan, Z. A. Nan, J. Q. Wang, T. Jia and W. W. Zhan, Inorg. Chem., 2019, 58, 3670–3675 CrossRef CAS PubMed.
- S. Wang, X. Meng, A. Das, T. Li, Y. Song, T. Cao, X. Zhu, M. Zhu and R. Jin, Angew. Chem., Int. Ed., 2014, 53, 2376–2380 CrossRef CAS PubMed.
- G. Soldan, M. A. Aljuhani, M. S. Bootharaju, L. G. AbdulHalim, M. R. Parida, A. H. Emwas, O. F. Mohammed and O. M. Bakr, Angew. Chem., Int. Ed., 2016, 55, 5749–5753 CrossRef CAS PubMed.
- M. Hesari, M. S. Workentin and Z. Ding, Chem. Sci., 2014, 5, 3814 RSC.
- X.-M. Luo, C.-H. Gong, F. Pan, Y. Si, J.-W. Yuan, M. Asad, X.-Y. Dong, S.-Q. Zang and T. C. W. Mak, Nat. Commun., 2022, 13, 1177 CrossRef CAS PubMed.
- W. Du, X. Kang, S. Jin, D. Liu, S. Wang and M. Zhu, Inorg. Chem., 2020, 59, 1675–1681 CrossRef CAS PubMed.
- R. Hu, W.-H. Xie, H.-Y. Wang, X.-A. Guo, H.-M. Sun, C.-B. Li, X.-P. Zhang and R. Cao, Appl. Catal., B, 2022, 304, 120946 CrossRef CAS.
Footnotes |
| † Electronic supplementary information (ESI) available: XPS, 1H NMR, 31P NMR, and TGA of Au9Ag4, the crystal data and structure refinement for [Au9Ag4(DPPB)4Cl4]+. CCDC 2165721. For ESI and crystallographic data in CIF or other electronic format see DOI: https://doi.org/10.1039/d3sc01329d |
| ‡ These authors contributed equally to this work. |
| This journal is © The Royal Society of Chemistry 2023 |