
 Open Access Article
 This Open Access Article is licensed under a Creative Commons Attribution-Non Commercial 3.0 Unported Licence
CrystalClear: an open, modular protocol for predicting molecular crystal growth from solution†
Peter R.
Spackman
 *a,
Alvin J.
Walisinghe
ab,
Michael W.
Anderson
ab and
Julian D.
Gale
a
*a,
Alvin J.
Walisinghe
ab,
Michael W.
Anderson
ab and
Julian D.
Gale
a
aCurtin Institute for Computation, School of Molecular and Life Sciences, Curtin University, GPO Box U1987, Perth, Western Australia 6845, Australia. E-mail: peter.spackman@curtin.edu.au
bCentre for Nanoporous Materials, Department of Chemistry, The University of Manchester, Oxford Road, Manchester M13 9PL, UK
First published on 23rd May 2023
Abstract
We present a new protocol for the prediction of free energies that determine the growth of sites in molecular crystals for subsequent use in Monte Carlo simulations using tools such as CrystalGrower [Hill et al., Chemical Science, 2021, 12, 1126–1146]. Key features of the proposed approach are that it requires minimal input, namely the crystal structure and solvent only, and provides automated, rapid generation of the interaction energies. The constituent components of this protocol, namely interactions between molecules (growth units) in the crystal, solvation contributions and treatment of long-range interactions are described in detail. The power of this method is shown via prediction of crystal shapes for ibuprofen grown from ethanol, ethyl acetate, toluene and acetonitrile, adipic acid grown from water, and five polymorphs (ON, OP, Y, YT04 and R) of ROY (5-methyl-2-[(2-nitrophenyl)amino]-3-thiophenecarbonitrile), with promising results. The predicted energies may be used directly or subsequently refined against experimental data, facilitating insight into the interactions governing crystal growth, while also providing a prediction of the solubility of the material. The protocol has been implemented in standalone, open-source software made available alongside this publication.
1 Introduction and background
Crystallisation, being fundamental to the creation of solid materials from molecules or ions in solution, is a process of great industrial, environmental and even biomedical significance. It is a key method of chemical purification, while the reverse process of dissolution can also be exploited, as in the controlled release of pharmaceuticals.1 While it is often beneficial, the unwanted crystallisation of materials can be a major problem, with pervasive effects in many contexts such as in scale formation in pipes and vessels or renal calculi in humans.Beside the chemical composition and/or crystal structure of the solid phase being formed, one of the most influential aspects of crystallisation lies in the shape, morphology or habit of the resulting crystals. The shapes of crystals play a critical role throughout their practical use and therefore control of morphology is an important objective.2 It can determine particle agglomeration and mixing characteristics, mechanical strength, washing/drying, catalytic activity, dissolution rate, and many more physical properties. For practical considerations it is then of immense importance that we understand the underlying processes and mechanisms governing the ultimate shape of crystals. It is only through knowledge of these effects that we might learn how to rationally influence or manipulate growth environments to yield more desirable crystal shapes or forms. As a concrete example, the presence of a fast-growth facet in a crystal can lead to needle-like crystals that are then challenging to separate and utilise in many applications.3
Of particular relevance to sectors such as pharmaceuticals and agrochemicals is the case of molecular crystals growth from solution. Here, the growth rates for different facets and, ultimately, the final morphologies of crystals grown from solution are determined by so-called ‘weak’ interactions between both the constituent molecules of the crystal and with the solvent. The strength of these interactions and their directional specificity varies; hydrogen bonding is generally strong and directional while other interactions, such as London dispersion forces, are typically weaker and less dependent on orientation. It is the complex interplay of these interactions that determines crystal growth, which presents a great challenge in the prediction and modification of conditions to exert control over the growth processes. Further complicating this, we must consider the dynamics of the systems as almost all molecular solids of interest crystallise at or near ambient temperature and pressure.
Theoretical methods for the prediction of crystal morphology have a long history through use of the Wulff construction,4 which is based on the minimisation of the thermodynamic penalty associated with creating the crystal surfaces. The majority of studies to date compute the surface energies of the competing facets, which can be readily achieved using most atomistic methods from force fields to ab initio quantum mechanics. At the other end of the spectrum in terms of computational cost, some methods look to simplify the prediction of morphology by using quantities that avoid an explicit surface energy calculation, such as the distance between Miller planes5–7 or periodic bond chains.8 As particle sizes approach the nanoscale the surface energy alone becomes insufficient: inclusion of line energies for the stability of edges where surfaces meet, or even the corner energies for the intersection of three or more surfaces, begin to make an important contribution that can lead to size-dependent morphologies9 and polymorphic transitions.10
In contrast to in vacuo surface energies, the morphology for a crystal growing from solution presents significantly more of a challenge to predict, since the interfacial free energies can be complex to determine. For force fields, this entails the use of free energy methods built on top of stochastic simulations in order to capture the dynamic nature of the solid–liquid interface.11 At the quantum mechanical level, this is typically too computationally demanding for most systems of interest, and so it becomes necessary to replace an explicit solvent with an implicit model, typically involving a dielectric continuum,12,13 leading to a potential reduction in accuracy relative to a structured solvent.
Although approaches to morphology prediction based on the Wulff construction and its extensions have proven successful for many materials, the assumption that surfaces are clean, perfect terraces is a significant simplification often not borne out in reality. Experimental data from methods such as atomic force microscopy (AFM) reveal that many surfaces are far from regular smooth planes during growth, with multiple islands, extended defects and other features often being observed both in molecular crystals and other materials.14–21 This more complex (and realistic) picture of surface topography necessitates different modelling approaches. Instead of focusing on the macroscopic surfaces, it is necessary to instead model the crystallisation process in terms of addition or loss of growth units at specific surface sites (see Fig. 1 for a graphical depiction). Naturally, the stochastic nature of such processes lend the problem to solution via Monte Carlo (MC) or Kinetic Monte Carlo (KMC) methods,22,23 where the probability of attachment or detachment is determined by the associated thermodynamics or rate constants, respectively. Such methods are not only capable of providing a detailed view of the evolution of surface topography as a function of the saturation state of the system, but when performed for a complete 3-D crystal also lead to the prediction of the overall morphology without the need for prior consideration or specification of the relevant facets/crystallographic planes.24
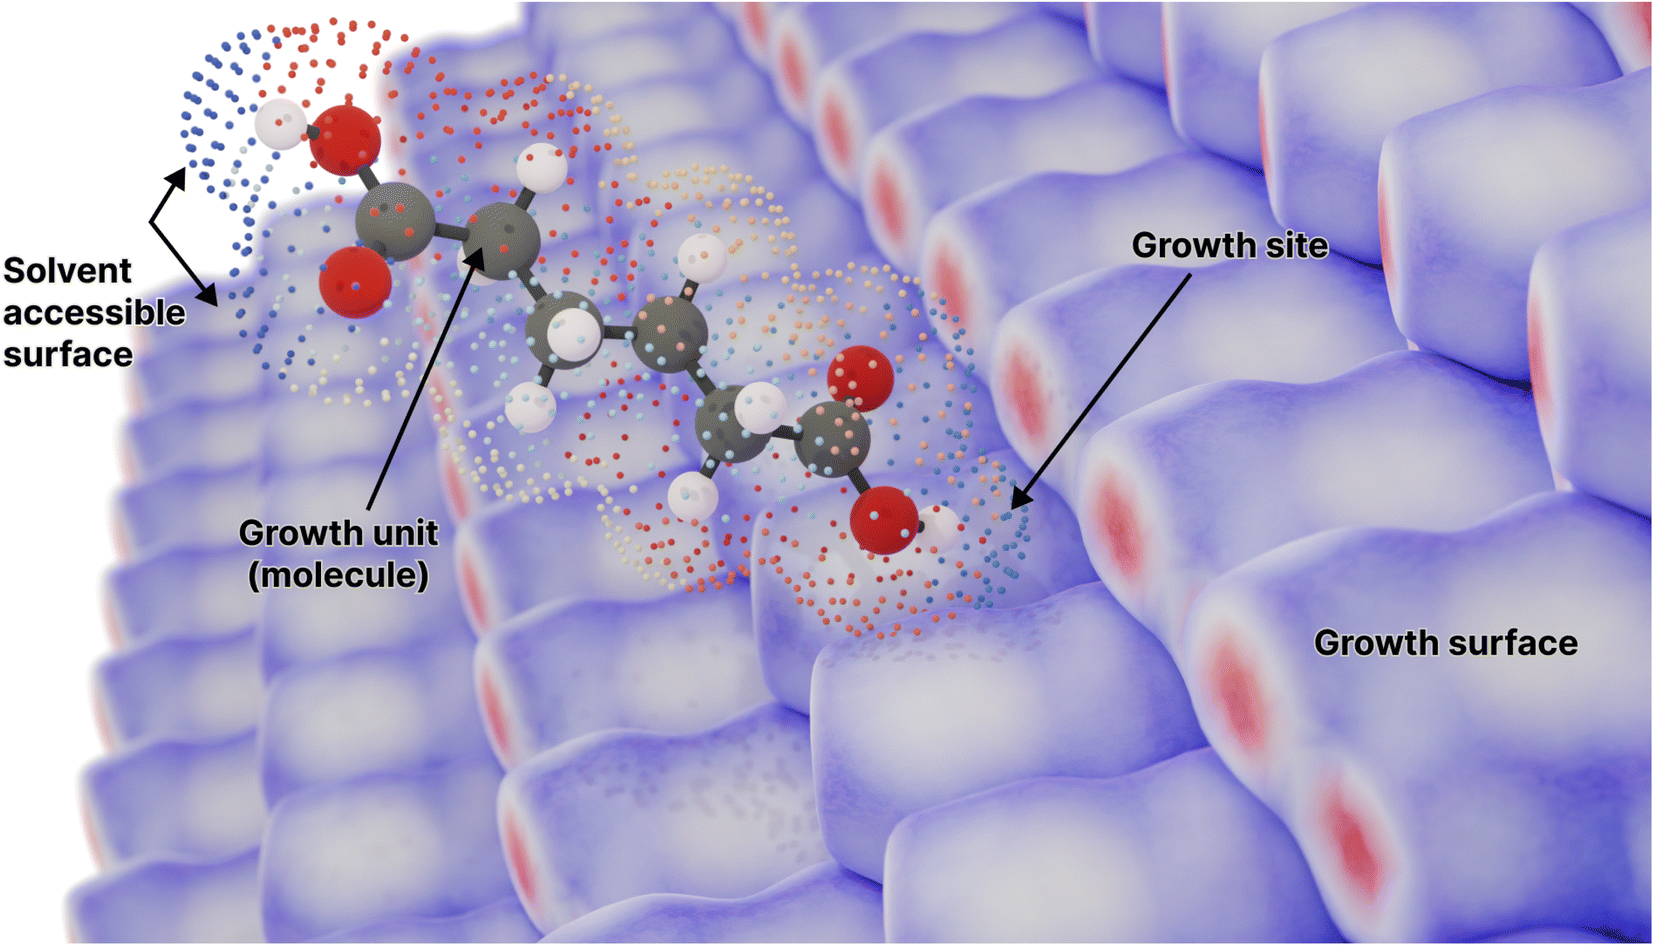 | ||
| Fig. 1 A molecule surrounded by its solvent accessible surface, moving toward a candidate growth site on the surface of the crystal composed of the same molecule (represented by an array of Hirshfeld surfaces). Points on the solvent accessible surface are partitioned and coloured by the different neighbouring molecules in the crystal lattice (Fig. S1†). Here adipic acid is used as an example for such a molecule. | ||
While Monte Carlo-based methods are appealing for the simulation of crystal growth and dissolution processes, they are not without their own challenges. Critically, there is the question of how to determine the thermodynamics or kinetics for each possible event? In exceptional cases, such as the fast growing molecular crystalline solid of urea, sufficient data might be obtained from unbiased molecular dynamics (MD) simulation of the surfaces and their interface with solvent to determine the rate constants for individual molecular transitions at different surface sites.24,25 However, in general the timescale required to model many crystallisation events is too large to be directly accessible to atomistic simulations – crystals may form in tiny fractions of a second, minutes, years or even over periods as long as millenia in the case of some minerals. As a result of this limitation, the thermodynamic stability of each surface site (and ultimately the kinetics) must be determined laboriously one-by-one using bias-enhanced free energy sampling or alchemical techniques.26,27
Recently, a general approach to the MC simulation of materials has been proposed, in the form of the CrystalGrower28,29 method and associated software. Throughout this method, the relative stabilities of growth sites are evaluated as a sum of nearest-neighbour (or even next-nearest neighbour) interaction energies, with each growth site being dependent on its local coordination environment (see Fig. 2 for the energetic quantities involved, and Fig. S1 in the ESI† for an example construction). This reduces the problem of determining the stability of potentially huge numbers of distinct surface sites to a related problem which requires evaluation of significantly fewer distinct energies – only pairwise interactions between growth units need to be evaluated. Presently, these quantities are fitted against experimental data by scanning through the parameter space of interaction energies in order to find the set of values that best match experimental data obtained from microscopy. This fitting process itself is laborious, and may cumulatively require thousands of individual growth simulations to be carried out as part of this refinement process.
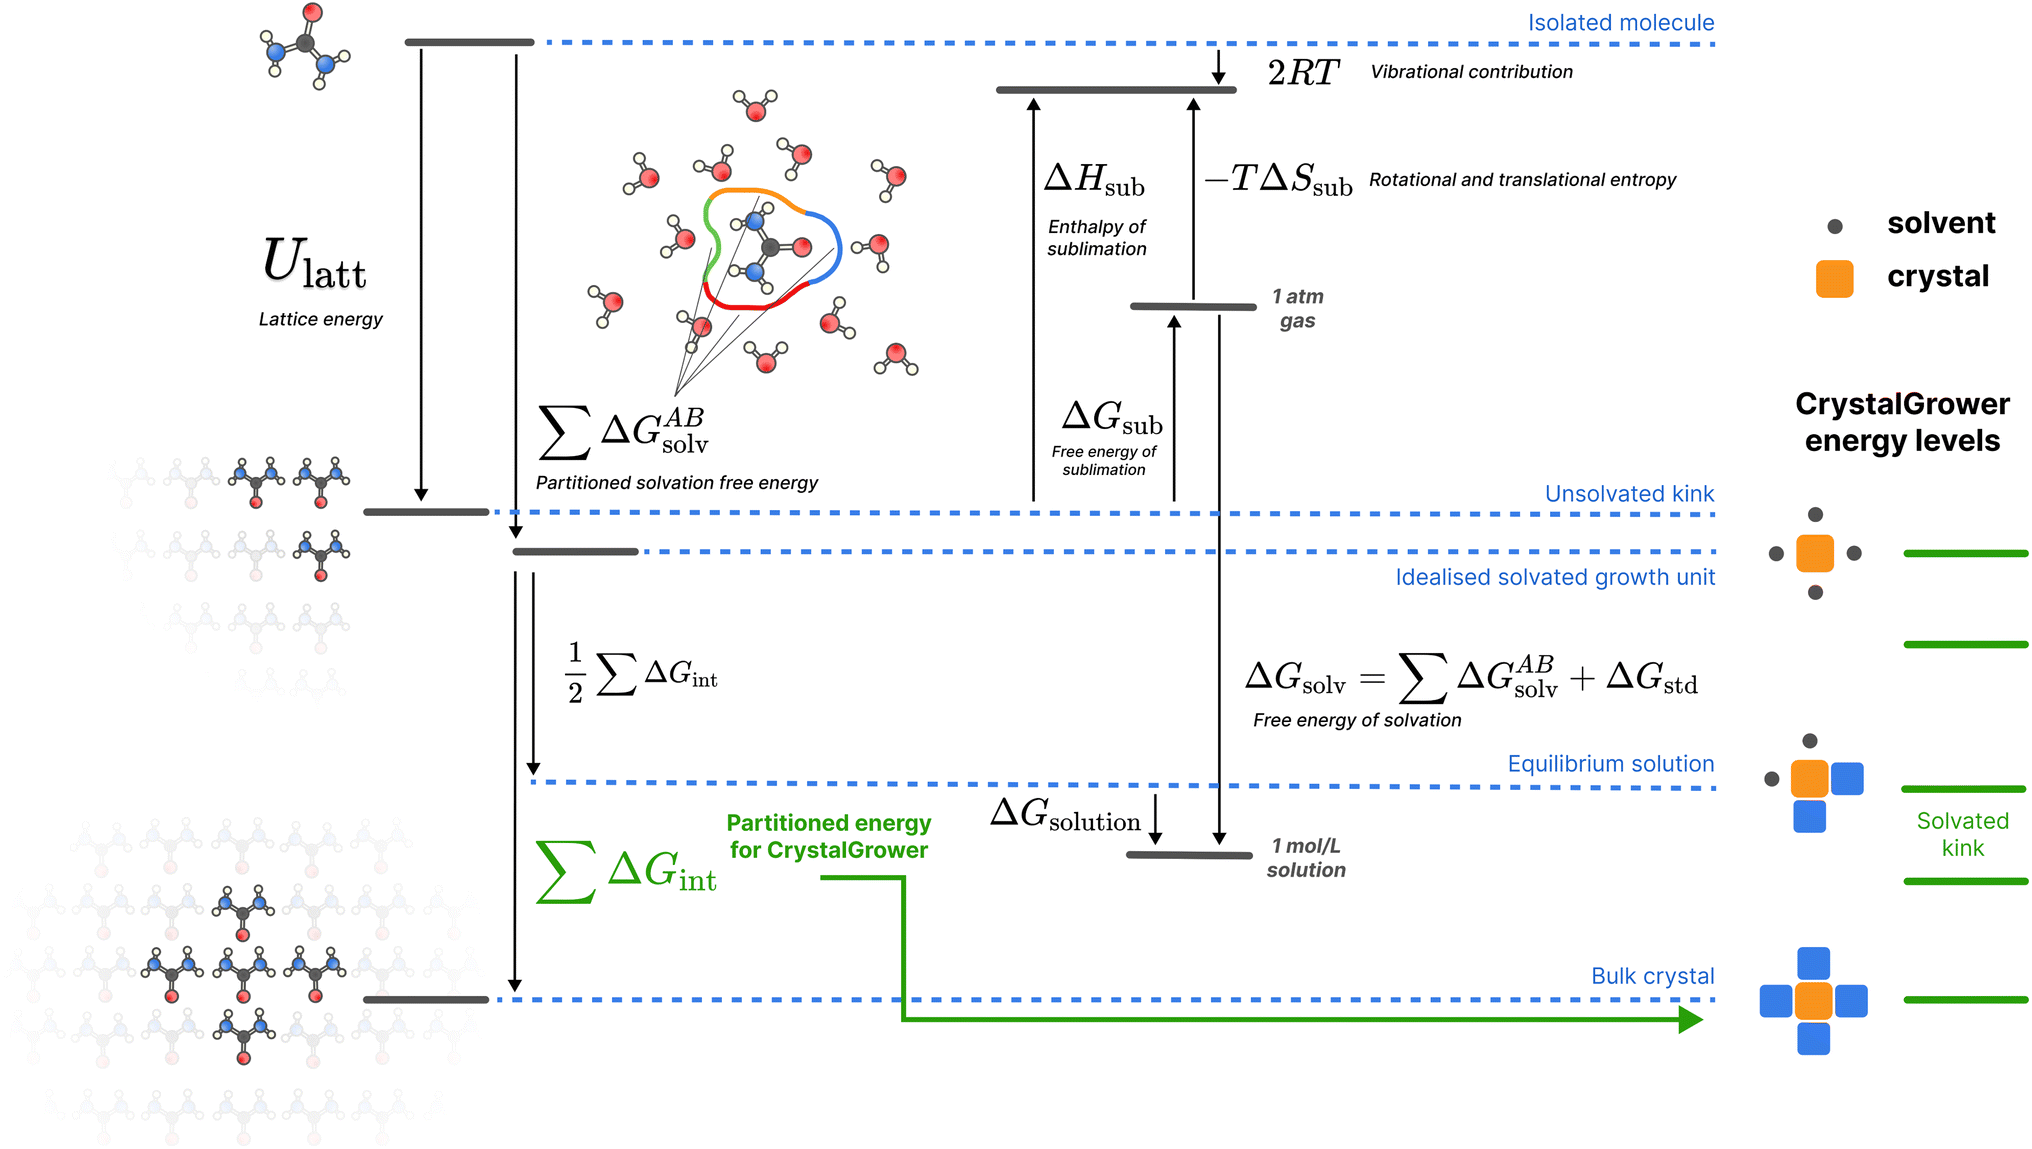 | ||
| Fig. 2 A schematic of the overall thermodynamic process and corresponding energy levels for the proposed protocol. Urea is used as an example for illustrative purposes, but the protocol shown is general for all molecules studied. For crystal growth energies, only the Ulatt and ΔGsolv terms are utilised, broken down into nearest-neighbour interactions. All quantities are defined in the methods section. Here the ‘Isolated molecule’ energy level refers to a single molecule in an ideal gas, the ‘Unsolvated kink’ refers to the average (over all possible kink sites, with stoichiometry considered for multi-component systems) energy of a kink site, the ‘Idealised solvated growth unit’ refers to the starting point in the CrystalGrower model – an ordered site surrounded by ordered solvent, the ‘Equilibrium solution’ refers to the solvated average kink site which is in equilibrium with the solution phase for a given molecule, and the ‘Bulk crystal’ refers to an ordered site inside the crystal (which is twice Ulatt due to double counting). The corresponding energy levels of different sites in the CrystalGrower model are provided on the right in green, and are linear combinations of the individual interaction energies ΔGint for the corresponding neighbours; a schematic construction of these energy levels is provided in Fig. S1.† | ||
In this work we propose a rapid and automated protocol capable of determining the free energies of interaction for use in MC simulations of the crystallisation of molecular crystalline materials, and in particular for the CrystalGrower methodology. It is important to stress upfront that the goal of this protocol is not to obtain the most accurate values possible at any computational expense, but instead to present a methodology compromising a trade-off between accuracy and computational expense, capable of rapid generation of reasonable parameter sets for a wide variety of molecular materials and solvents. The resulting values can then be either directly used in MC simulations of crystals without modification, or may act as a starting point for subsequent refinement against experimental data, should this be available and desired.
1.1 Model of crystal growth
An efficient method to simulate crystal growth at length scales relevant to experimental observation, while retaining molecular resolution, is through a model based on a lattice of sites that represent the growth units, where the sites can be occupied or unoccupied. Adsorption or dissolution events are then selected probabilistically by considering the addition or removal of growth units at each site on the surface of a micro-crystal. Ideally, the probabilities of events are determined by the rate constants for the relevant processes, leading to a KMC simulation, as extensively utilised in this field.30,31 The essential challenge here, as previously highlighted, is always in the determination of the huge number of required rate constants. For a model to be useful and predictive, this issue is particularly acute since the transition states for growth or dissolution will directly depend on the local solvent structure at the surface; something that is hard to determine without expensive atomistic simulation of the actual pathway.An alternative to direct use of kinetic information is to only exploit the free energy change for addition or removal of growth units to determine the probability for events, given that this captures the ratio of the forward and backward rates. This reduces the number of quantities required by a factor of two, while importantly eliminating the need to characterise the transition state by focusing only on the initial and final states, making the process more amenable to efficient calculation. In situations where the transition states for growth or dissolution are similar for different sites the Bell–Evans–Polanyi principle32,33 should apply, so the underlying thermodynamics serves as a reasonable proxy for the relative rate constants. In these cases, the evolution of the crystal morphology ought to mimic the time-dependent kinetic processes, though the precise timeline itself is implicit, rather than the explicit as in KMC. Should the barrier to any given step be substantially different, then kinetic effects may lead to deviation of the experimental morphology from that predicted by this approach, which is based purely on the thermodynamics of crystal growth.
1.2 Determination of the thermodynamics of surface sites
As has been previously alluded to, the energies in the CrystalGrower approach are currently fitted to reproduce experimental observations – e.g. morphologies or surface structures determined from AFM. Fitting these free energies to experimental observations also brings significant challenges. It is not obvious or intuitive, prima facie, how many or which neighbours are ‘important’ or relevant for the growth of the crystal. Further, the relative values of these interaction energies are highly correlated, given that the morphology of crystal only depends on the ratio of surface energies, rather than the absolute magnitude. Consequently, it is currently necessary to perform large numbers of scans through the parameter space in order to identify the best combination of energies that reproduce the experimental observations.Our protocol aims to predict the underlying free energies which dictate crystal growth for a given crystal structure and solvent. Importantly, calculations are performed in a manner that lends itself to the partitioning of the relevant energies into pairwise terms that are naturally suited to direct use in the CrystalGrower approach. Building upon an established methodology for the prediction of intermolecular interactions in the crystal, namely the CrystalExplorer34,35 model energies, and the widely applicable SMD continuum solvation model36 allows our approach to be generally used for a wide variety of molecular systems and solvents. Further, by designing a modular approach from the ground-up, other improved methods for the computation of the lattice and/or solvation free energies could be substituted for those chosen in this work. Our particular choices here are motivated by the dual aims of computational efficiency and straightforward use, requiring only a crystal structure and solvent specification as input. The CrystalExplorer model energy is particularly advantageous since it removes the potential cost of optimising the crystal structure prior to the determination of the lattice energy, an approach that has been demonstrated to introduce relatively little energetic error.37 Collectively, the efficiency and minimal input makes the present protocol suitable for tasks such as rapid high-throughput screening, with subsequent refinement of the energies using more accurate (and time-consuming) theoretical methods or experimental data being possible where desirable.
There are, of course, many existing methods which aim to predict morphologies and/or crystal growth, usually based on the thermodynamics of surfaces, i.e. the free energies of kinks, edges and terraces. These include methods that in varying degrees use experimental data to fit theoretical models, through to the explicit calculation of energies based on interatomic potentials,38,39 as implemented in a number of software packages including HABIT,40 MARVIN,41 METADISE42 and GULP.43 The present method prima facie also shares much in common with the periodic bond chain8 approach that is the basis of many approaches. Indeed, the interaction energies/free energies of crystallisation within this work may be utilised to construct or identify periodic bond chains.
A further key quantity introduced in the seminal series of papers by Hartman and Perdok8,44,45 is the attachment energy (Eatt) which represents the energy per growth unit released when a slice crystallises on a particular face (hkl). While being formally a thermodynamic term, Hartman and Bennema46 showed that under appropriate conditions of supersaturation this quantity was often found to be proportional to the rate of growth. Thus the attachment energy can be used to predict a quasi-kinetic morphology that can differ substantially from the equilibrium thermodynamic morphology that results from the use of surface energies. Using the concept of attachment energies, Gilmer and Bennema47 performed numerical simulations of the growth of a cubic lattice based on nearest-neighbour interactions that are either solid–solid or solid–fluid. Again, this represents an inspiration for the present method, where the model is generalised to a lattice of any symmetry, with interactions that are computed ab initio and can be extended to the long-range limit.
It is also important to emphasise that the proposed method, in this case, relies upon individual molecules as growth units in the calculation of the attachment energy, rather than whole layers (growth slices) of the structure. This means that there is no choice to be made a priori of which crystal faces or cuts to include. Instead, the morphology emerges naturally from the strength of intermolecular interactions with the crystal, balanced against those with the surrounding solvent. In this manner faces, detailed surface structure and crystal rounding is all determined with a coarse-grain resolution at the molecular scale.
Particularly worthy of mention when consider existing protocols is the Advanced Design and Development of Industrial Crystallization Technology (ADDICT)48 software which is a powerful tool for predicting morphologies and simulating crystal growth. This approach also starts from the crystal structure as input and includes solvent effects. However, there are significant differences in the details of the energy calculation. For example, ADDICT uses the GAFF force field49 with partial charges generated from a molecular quantum mechanical calculation to compute the lattice energy, whereas in our model all interactions are determined using a quantum chemical based model energy with universal parameters. Hence, the present method is more general and avoids issues with atom typing and limitations of a specific force field. However, this comes at an increased computational cost, but one that is arguably acceptable and well within current resources, as will be shown later. For the solvent treatment, ADDICT offers a number of parameterised models that incorporate the contribution of the interfacial energy, while in our approach the corresponding effects come from a molecular quantum mechanical calculation in the presence of a general continuum solvation model. Again, while our protocol has a higher computational overhead, it remains generally small and benefits from the existence of universal parameters for a wide range of solvents.
A key innovation in this work is the partitioning of solvation free energies, described in detail in Section 4.5, which facilitates the rapid incorporation of the relative contributions of the solution and crystalline phases to the competing energetics that determine growth rates. This decomposition of the solvation free energies is achieved via the observation that all terms in the SMD solvation model are built out of discrete contributions from points on the solvation surface, and thus the individual contribution from each surface point can be assigned to specific neighbouring interactions – in the case of the present work, using a distance-based criterion.
While our primary goal has been to provide a reasonable and theoretically-motivated starting point for determining the thermodynamic quantities required for the prediction of crystal growth and surface morphology, the current method is also capable of estimating the solubility of molecular crystalline materials. Although there are other more accurate methods available for this specific purpose, through the use of more involved and computationally-demanding techniques,50 it will be shown later that the predicted solubilities are not unreasonable in comparison to other approaches, which lends credibility to the validity of the approximations made throughout.
2 Results and discussion
The application of the proposed rapid, automated method for prediction of nearest-neighbour interaction energies for molecular crystalline materials will be demonstrated in the subsequent subsections. Here three examples are provided, namely ibuprofen, adipic acid and ROY, which serve to illustrate the strengths and limitations of the approach for pharmaceuticals, systems where the protonation state differs between solution and the crystal, and materials with extensive polymorphism, respectively.2.1 Ibuprofen
As one of the major potential areas of application for methods that predict crystallisation properties of molecular crystals is in the pharmaceutical industry, it is natural to select a well-studied drug molecule as a starting point. The crystal habit of ibuprofen ((RS)-2-(4-(2-methylpropyl)phenyl)propanoic acid) has been extensively studied in a variety of solvents,51,52 making it an ideal candidate for the application of the proposed new protocol. In this work we attempt to examine the effect of varying the solvent on the predicted morphologies, and whether the results correlate with the observed experimental habit. As such, we have predicted the crystal growth energies for ibuprofen (CSD ref. code IBPRAC01) in ethanol, ethyl acetate, acetonitrile and toluene (provided in Tables S1–S4,† with the neighbouring environment depicted in Fig. S2†). These solvents primarily differ in their dielectric constant, ε, which largely dictates the coulombic interaction strength between solute and solvent. An increase in the strength of the interaction with the solvent, in this case resulting from a larger ε, will generally tend to reduce the strength/rate of growth in directions with strong electrostatic intermolecular interactions, e.g. hydrogen bond directions, relative to a smaller ε. After the initial determination of the thermodynamics for these solvents, further refinement of the crystal growth energies was attempted by fitting to the experimental data in order to assess how close the theoretical predictions are to the optimal values (Table S5†).In Fig. 3 it may be seen that interaction I, corresponding to the alcohol–alcohol hydrogen bond is by far the strongest interaction predicted for ibuprofen (and the strongest after fitting). Intuitively, one might expect there to be a downward trend associated with increasing the dielectric constant, as the only difference among these values is in the solvation component. If that were the case, then the strength of interaction I would follow (from weakest to strongest) the order of acetonitrile, ethanol, ethyl acetate and toluene. However, both in the predicted energies and those subsequently fitted to reproduce the experimental morphology we see no such trend, indicating that non-coulombic terms associated with the surface area and dispersion (in this case the so-called CDS terms in the SMD solvent model) play a significant role in the local solvation.
 | ||
| Fig. 3 Comparison of the energies for different interaction directions as a function of solvent. Coloured bars represent the theoretically predicted value, while black lines indicate the change in each value as a result of experimental fitting. | ||
Of the available experimental morphologies, the clearest and most valuable conclusions may be drawn from the ethanol crystal habit. As can be seen in Fig. 4, the largest error apparent in the predicted vs. experimental morphology is in flattening of the ends of the prism. However, it can also be seen here that the energetic difference between the two habits is quite small (Fig. 3, red bars), where the largest shift was observed for ethyl acetate energies from 14.4 to 9.4 kcal mol−1 in interaction I. One possible reason for any discrepancy between the predicted and observed morphologies could be the presence of kinetic effects in the experimental habit. However, the use of a continuum solvation model is likely to limit the accuracy of theoretical results. Alternative solvation models, that better capture the explicit solvation structure (at increased computational cost), represent a future direction for potential improvement.
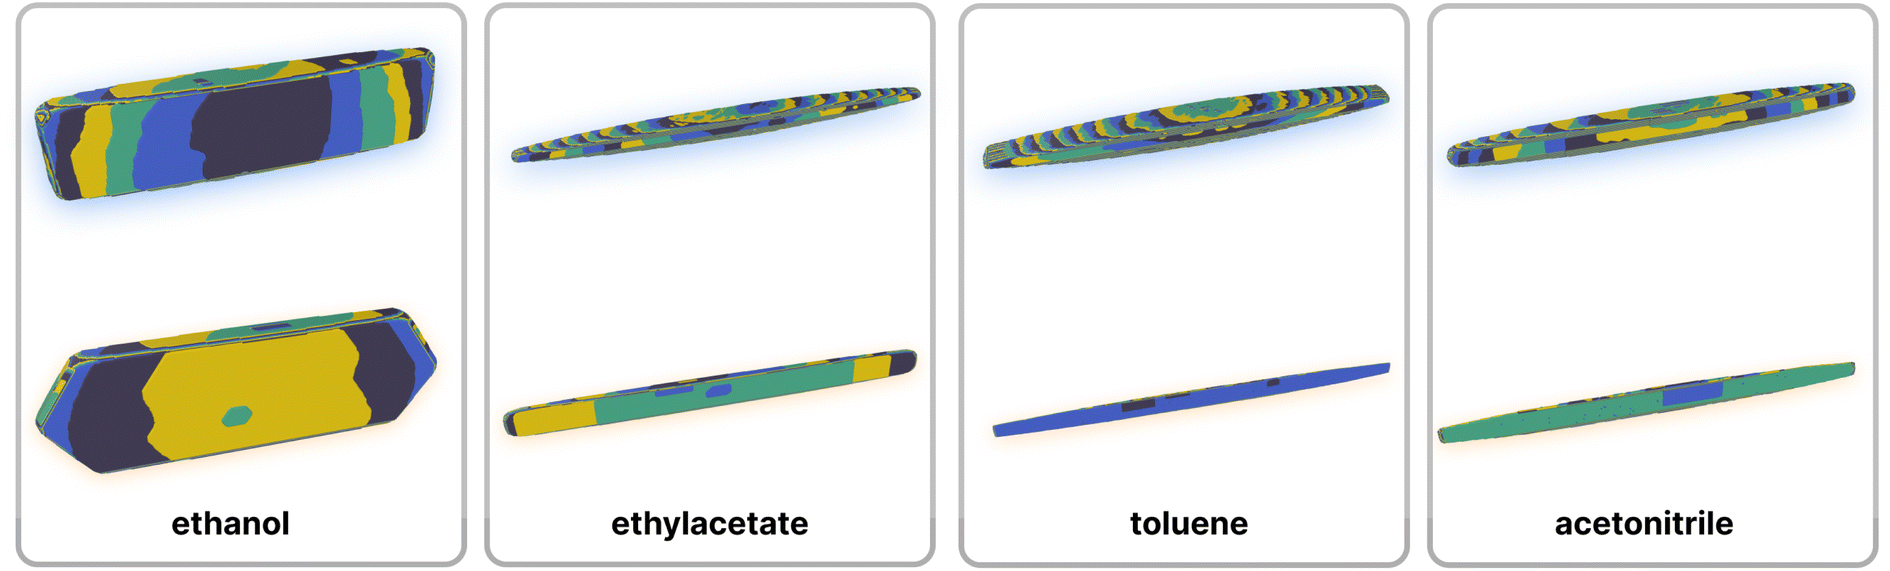 | ||
| Fig. 4 Comparison of predicted crystal morphologies (top) with those after fitting energies to the experimental shape (bottom) for ibuprofen crystals grown in (left to right) ethanol, ethyl acetate, toluene and acetonitrile. Simulated crystal growth images are coloured by growth layer. | ||
It is also important to note here that the observed change in crystal habit corresponding to the change of solvents has been replicated in the predicted crystal habits. For example, the significant lengthening in habit going from ethanol to any of the 3 other solvents studied is especially visible. Some more subtle changes, such as the thickening or the widening of the crystal habit, that are also evidenced experimentally have been captured within the predicted crystal habits. Often within industry, a considerable amount of time can be spent in studying solvent effects on crystal habits. Therefore, this example shows promise in potential use for a predictive and automated protocol to aid experimental studies.
2.2 Adipic acid
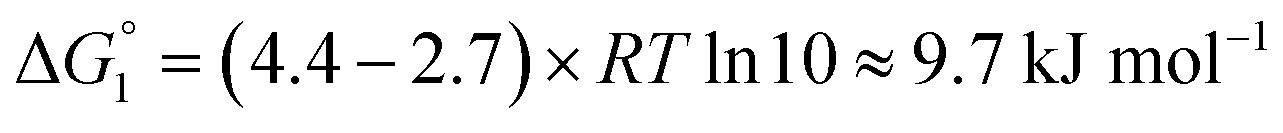
Adipic acid (hexanedioic acid) is one of the most commonly produced crystals in industry, largely due to its role as a precursor for the production of nylon. It is also a highly symmetric molecule, with intermolecular interactions in its crystal structure largely dominated by strong carboxylic acid hydrogen bonded dimers. We have predicted the crystal growth energies for the adipic acid crystal (CSD ref. code ADIPAC), which are provided in Table S6 in the ESI,† with the neighbouring interactions depicted in Fig. S3.†For the present method, adipic acid presents a significant challenge since in aqueous solution it exists almost entirely in its (doubly) deprotonated form as its conjugate base. If this is ignored, then the protocol here gives a net interaction energy in the hydrogen bonding direction of approximately −33.7 kJ mol−1, which would yield needle-like crystals. Obviously, for a method proposed to provide fast and straightforward predictions of crystal growth energies explicit simulation of the dynamics and protonation states of adipic acid is out of the question, especially as this would require a reactive model that allows for proton transfer. Instead, we propose an approximate correction using readily available experimental quantities (pKa and pH) which appears to compensate for the changes in protonation state.
Recall that pKa can also be interpreted as the pH where ΔG° = −RT![[thin space (1/6-em)]](https://www.rsc.org/images/entities/char_2009.gif) lnKeq = 0. Adipic acid has two relevant protonation states (one for each carboxylic acid group), with experimental pKa values of 4.4 and 5.4. Typical conditions for crystallisation of adipic acid would have a pH of 2.7 at ambient conditions, which gives the following working for the correction factor:
lnKeq = 0. Adipic acid has two relevant protonation states (one for each carboxylic acid group), with experimental pKa values of 4.4 and 5.4. Typical conditions for crystallisation of adipic acid would have a pH of 2.7 at ambient conditions, which gives the following working for the correction factor:
| ΔG° = −RTlnKeq = (pKa − pH)RTln10 | (1) |
 | (2) |
 | (3) |
 | (4) |
This yields a net interaction energy in the hydrogen bond direction of approximately −8.5 kJ mol−1 after applying the above correction to the interaction energy for the carboxylic acid groups (−33.7 kJ mol−1). This significant reduction in the interaction strength due to the cost of protonation as the molecule transitions from the solvent to the crystal shifts the predicted morphology away from needles to the expected shape. The resulting predicted and reference crystal shapes, along with a micrograph of the experimental crystal are shown in Fig. 5.
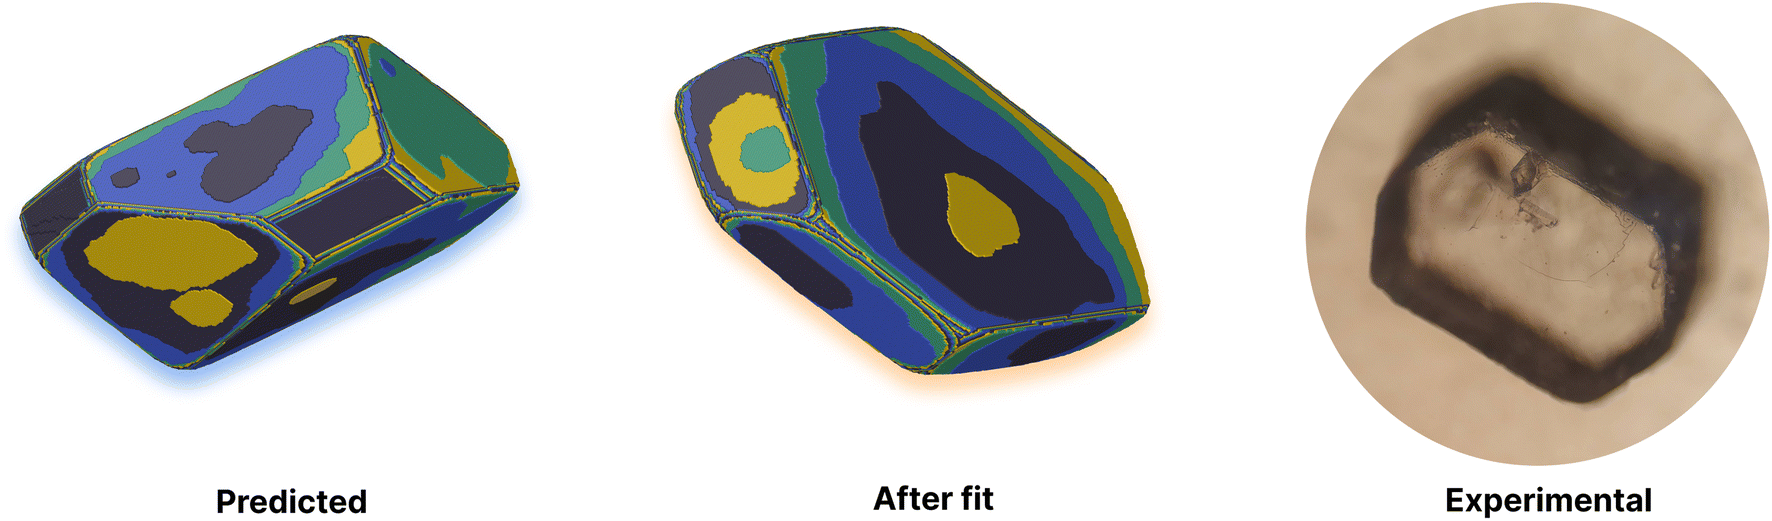 | ||
| Fig. 5 Comparison of experimental and predicted morphologies for adipic acid. Left: simulated crystal morphology using predicted energies. Middle: simulation fitted to the experimental morphology through iterative refinement of the predicted energies. Right: an optical image of the equilibrium morphology for an adipic acid crystal grown from aqueous solution. Simulated crystal growth images are coloured by growth layer. | ||
The predicted enthalpy of sublimation for adipic acid of roughly 143 kJ mol−1 is found to be in good agreement with the experimental value of 145(5) kJ mol−1,53 especially considering the simple approximation made to the vibrational contribution (2RT) and the use of an experimental geometry with hydrogen bond lengths normalised to fixed values.
2.3 ROY
Polymorphism – the capacity for a molecule to crystallise in different structures (which may or may not have different habits or shapes) – is another area of substantial interest for pharmaceutical applications of molecular crystals. Due to the extreme number of known stable polymorphs, ROY (5-methyl-2-[(2-nitrophenyl)amino]-3-thiophenecarbonitrile) represents another interesting test case for the demonstration and evaluation of this protocol. Furthermore, as ROY is an example of conformational polymorphism it provides an ideal case to explore the effects of a significant approximation made in our protocol; that the molecular conformation in the crystal is suitable for the estimation of the relevant solvent interactions. To this end, we have predicted the growth energies for five of the polymorphs of ROY: the monoclinic ON (CSD ref. code QAXMEH24), OP (QAXMEH27), Y (QAXMEH25) and YT04 (QAXMEH12) polymorphs and the triclinic R polymorph (QAXMEH26). The ON polymorph yields needle-like crystals, while the remaining polymorphs have more distinguishable crystal shapes. These energies are shown in Tables S8–S12 in the ESI,† with the neighbouring interactions depicted for each polymorph in Fig. S4–S8.† We note that the precise conditions used to crystallise the different polymorphs are not available in detail in the original work. Consequently, we have used the re-crystallisation solvent specified in the CSD, where available, or otherwise have used methanol to approximate the conditions (as noted in Yu et al.54).The crystal habits of the polymorphs of ROY are known,54 but only the Y polymorph appears to have been thoroughly examined (with indexed faces presented and labeled) for its morphology55 experimentally. Previous computational work in predicting crystal habits has been performed56 using force fields. Overall, the predicted and fitted crystal habits (Fig. 6) are remarkably similar – with the differences largely being minor differences in the sizes of certain crystal faces. The overall shapes are correctly predicted, with the exception of the OP polymorph.
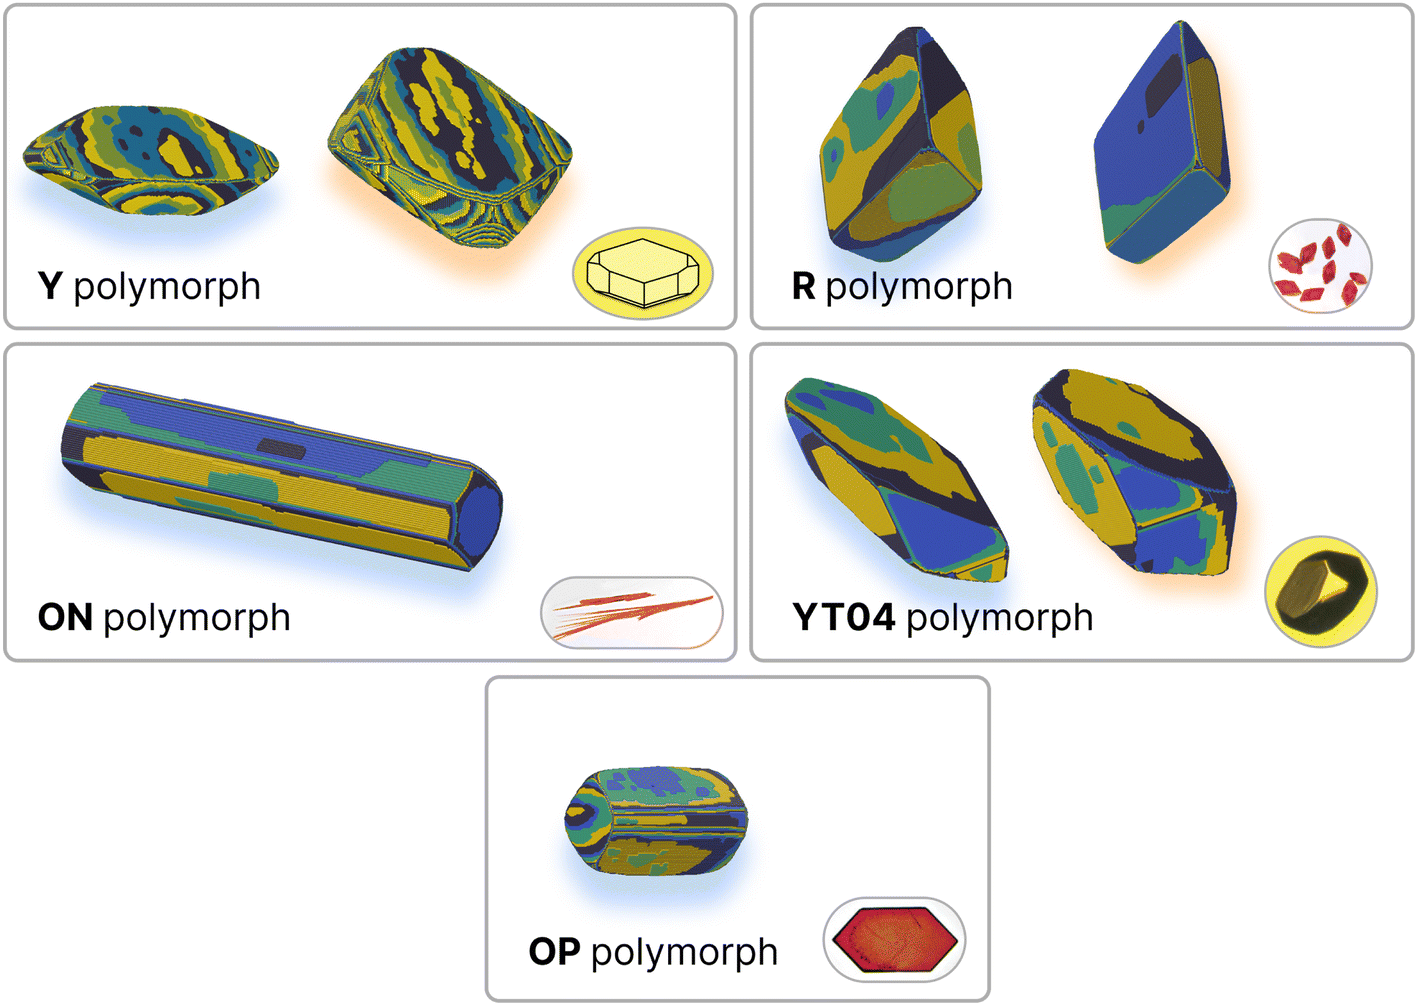 | ||
| Fig. 6 Comparison of experimental and predicted growth for polymorphs of ROY. Predicted habits are on the left of each pane (blue shadow), and results from the fitting procedure are on the right (orange shadow) where available. Experimental images are in the bottom-right corner of each pane. Simulated crystal growth images are coloured by growth layer. Polymorphs ON, Y and YT04 were predicted with ethanol as the solvent, R with benzyl alcohol and OP with methanol. Experimental images taken from Yu, 2010,54 with the exception of Y which was sketched out based on the morphology in ref. 55. | ||
Unlike the Y polymorph, there are fewer thorough studies of the morphology of the other polymorphs within the literature. Despite this, using optical micrographs that were provided,54 we were able to recreate morphologies that largely resemble what is experimentally observed. The fitted energies for these morphologies, upon comparison, revealed values that were similar to those predicted within a small error (MAE around 2.5 kJ mol−1). Although caution is advised in this particular case, as the recreated experimental morphologies can be slightly different from a true equilibrium morphology, this protocol still showcases a high degree of accuracy in the predicted energies/morphologies for all five polymorphs. Apart from the prediction of energies, the case study of ROY can also be used to note the method's applicability in reducing the energy ranges that are used to obtain fitted values. Each ROY polymorph studied here consisted of approximately ten interactions that required fitting and this would have resulted in a very large number of individual simulations during a high throughput scan in the absence of any prior knowledge of starting values. However, as the ranges used within this study (Table S13†) suggest, we were capable of greatly restricting these ranges, resulting in a much smaller set of simulations for fitting.
2.4 Summary of predicted vs. fitted energies
In order to provide an overall validation of the theoretical predicted energies for the systems studied here, the values have been plotted against those obtained from fitting to experiment using CrystalGrower (see Section 4.9.1 in the Methods for full details). As can be seen in Fig. 7, the predicted and fitted energies are quite correlated, with values generally clustered around a 1:1 relationship. Within the test cases, we generally observe better agreement for lower energy values. At higher energies, the theoretical model consistently predicts slightly higher energies than those obtained from fitting. The major contributor to these large values that have a greater deviation is found to be the hydrogen bonding interaction energies within the ibuprofen structures (Section 2.1). As previously discussed, this is an intrinsic error that could be expected as a result of the solvation model that was used. Use of a model with explicit hydrogen bonding in the first solvation shell instead of a pure dielectric continuum would therefore lead to an improvement. Given the modular nature of the present approach, any improved solvent model developed in the future could be substituted here to improve the accuracy, provided that the solvation energy can be partitioned into local contributions. A further alternative would be to introduce scale factors to correct for any systematic deviation. This would require a more comprehensive set of experimental values against which to fit, though this is somewhat restricted by the limited availability of complete morphological data in the literature.
 | ||
| Fig. 7 Scatter plot comparing predicted and fitted interaction energies (kJ mol−1) evaluated in this work. All values from adipic acid, ibuprofen (including all solvents) and ROY (YT04, Y and R) crystal systems are included, with the exception of energies that were fixed throughout the fitting process. The solid line (black) represents a perfect 1:1 correlation. | ||
2.5 Prediction of solubility
While the prediction of solubilities was not an explicit goal of the current methodology, this quantity serves as a useful initial benchmark to assess the accuracy of our total energies – alongside the suitability of the approximations used throughout e.g., the lack of vibrational corrections. To this end, we evaluated the solubilities of a set of 32 molecules taken from Palmer et al.50 Solubilities were predicted via the thermodynamic cycle shown in Fig. 2, i.e., via summation of the Gibbs free energy of sublimation and the Gibbs free energy of solvation, which is also the basis of more accurate approaches.57The solubility measure, logS0, may be evaluated via the equilibrium constant, Keq;
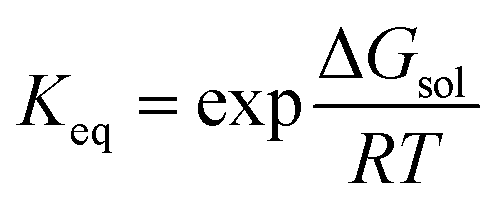 | (5) |
| logS0 = log10Keq | (6) |
The predicted solubilities from the current method are given in Table 1 (with a plot in Fig. S9 in the ESI†) along with the corresponding experimental values. Overall, our protocol predicts the solubility (logS0) of the test set with a RMSE of 2.29 log units from experiment. It is worth noting that a deviation of around 5 kJ mol−1 in, for example, the free energy of solvation would shift the corresponding logS0 by roughly one unit, which is indicative of the sensitivity of solubility predictions to small errors at any point in the cycle. Considering the simplicity of the present approach, in particular the use of the 2RT approximation which has noted inaccuracies57 and the use of experimental crystal structures with no optimisation of either the crystal or the molecular gas-phase geometry, these results are surprisingly good. For reference, the previous work50 from which this collection of experimental data was taken found a RMSE of 1.45 log units over another test set of 25 drug-like molecules when using a related model, using parameters fitted to reproduce solubilities in this training set (the 32 molecules in Table 1). Their method further involved optimisation of the crystal geometry and the gas- and solution-phase molecular geometries. Even machine learning models specifically designed to predict solubilities are only achieving an RMSE of just under 1 log unit for drug-like molecules.58
| Molecule | logS0 |
||
|---|---|---|---|
| Experiment | Predicted | Error | |
| 1-Naphthol | −1.96 | 0.40 | 2.36 |
| 4-Aminosalicylic acid | −1.96 | −0.85 | 1.11 |
| Acetaminophen | −1.02 | −0.36 | 0.66 |
| Acetanilide | −1.40 | −0.54 | 0.86 |
| Adenosine | −1.73 | −6.65 | −4.92 |
| Alclofenac | −3.13 | −1.62 | 1.51 |
| Allopurinol | −2.26 | −1.35 | 0.91 |
| Alprazolam | −3.60 | −0.52 | 3.09 |
| Benzamide | −0.95 | −0.50 | 0.45 |
| Benzocaine | −2.41 | −0.84 | 1.57 |
| Benzoic acid | −1.58 | 0.09 | 1.67 |
| Chlorprothixene | −6.75 | −4.39 | 2.36 |
| Chlorzoxazone | −2.59 | 0.61 | 3.20 |
| Clozapine | −3.24 | −3.57 | −0.33 |
| Cocaine | −2.25 | −2.00 | 0.25 |
| Diclofenac | −5.34 | −3.56 | 1.78 |
| Flufenamic acid | −5.33 | −6.50 | −1.17 |
| Ibuprofen | −3.62 | −5.69 | −2.07 |
| Mefenamic acid | −6.35 | −7.00 | −0.65 |
| Metclopramide | −3.58 | −0.44 | 3.14 |
| Naphthalene | −3.61 | −0.66 | 2.95 |
| Naproxen | −4.15 | −4.19 | −0.04 |
| Nicotinic acid | −0.85 | −0.24 | 0.61 |
| Nitrofurantoin | −3.26 | −0.54 | 2.72 |
| Papaverine | −4.34 | −7.38 | −3.04 |
| Phenobarbital | −2.28 | −1.04 | 1.24 |
| Phthalic acid | −1.47 | −4.33 | −2.86 |
| Propranolol | −3.49 | −5.25 | −1.76 |
| Pyrazinamide | −0.91 | 2.26 | 3.17 |
| Pyrimethamine | −4.11 | −3.76 | 0.36 |
| Salicylic acid | −1.94 | 0.50 | 2.44 |
| Trimethoprim | −2.90 | −8.21 | −5.31 |
| RMSE | MAE | MSE | |
| 2.29 | 1.89 | 0.51 | |
For reference, the corresponding errors for a strictly near-neighbour lattice energy (i.e. not converging the lattice sum by including the contributions of further shells) are a RMSE of 3.04, a MAE of 2.62 log units and a MSE of 1.84 log units. This is consistent with the expected systematic error from neglecting the non-local environment, which is generally a binding term for neutral molecules such as these.
For systems with two symmetry-unique molecular units (pyrimethamine and alprazolam), the average of the solubility values for the two molecules was used. It should be noted that the difference in ΔGsolv between the two molecules as a result of the slightly different conformations was very small, being well within the error bounds for the method (approx. 0.5 kJ mol−1).
2.6 Comment on the accuracies of the lattice energy and solvation models
Here we have chosen two particular approaches to evaluating the lattice energy (CrystalExplorer model energies) and solvation contributions (SMD) based on their simplicity, efficiency, and the ability to partition the energy into directional components. However, it is important to also discuss the likely accuracy of these choices based on existing data. The CrystalExplorer lattice energy model (CE-B3LYP) has previously been evaluated against the X23 benchmark set, where it was found to have a MAD of approximately 5 kJ mol−1, making it comparable with most dispersion-corrected DFT methods. This accuracy is also in the same region as that of the SMD solvation model used (the original paper gives a MAD of approx. 1 kcal mol−1 or 4 kJ mol−1 when using the 6-31G* basis set).Barring fortuitous cancellation of errors, this establishes that at best the overall protocol presented here will likely be within approximately 5 kJ mol−1 of the total energy. Further errors may of course be introduced by the various other approximations introduced throughout the protocol.
3 Conclusions and future prospects
We have presented a modular protocol for the evaluation of free energies of crystallisation in molecular crystals, which has been successfully applied to simulate crystal growth. Our method is free from many of the usual challenges and requires only modest computational expense, making it easily applicable to a range of molecular crystals of interest – be they pharmaceuticals, agrochemicals or otherwise.The example case studies presented in this work have demonstrated surprising accuracy in their application to a challenging, highly polymorphic molecular crystal system (ROY) and in the exploration of trends in crystal morphology under different solvents (ibuprofen). Further, the demonstration that a relatively simple correction, based on known experimental data (i.e., the pKa values and pH of the solution), may be utilised to correct for the protonation state changes in a system like adipic acid highlights that the approach can be readily extended even to systems that do not conform to some of the basic assumptions of the model, such as the use of the same molecular geometry in the solid and solution.
It is important to stress that the proposed protocol is generically applicable to molecular crystal structures, with no restrictions involving molecular symmetry or crystals with a particular crystallographic Z′ ≤ 1. Furthermore, unlike many surface- or attachment-energy based methodologies it requires no prior choice of relevant crystal faces or cuts, increasing the ease of its application to arbitrary molecular crystals. That is not to say that the method is without limitations. For example, it is a challenge to study disordered crystals generically. However, some kinds of disorder such as 2-dimensional disordered intergrowths can be readily treated.59 Also, solid solutions and aperiodic systems such as Wang tiles are easily accommodated. Systems with heterogeneous supersaturation caused by diffusion limited processes are difficult to treat with our current methodology without seriously affecting computation speed but methods to overcome such limitations should be possible. Likewise, the present work neglects conformational energy differences between polymorphs which, for example, would need to be considered with care if investigations into competitive crystal growth between conformational polymorphs were to be considered. However, even with the neglect of conformational energy differences, the successful application to the polymorphs of ROY has already been demonstrated here.
Perhaps the most important takeaway from this work is that the coupling of rapid energetic predictions to Monte Carlo simulations of crystal growth, like those in CrystalGrower, represents a powerful combination for gaining insight and understanding into critical factors affecting molecular crystal growth. Applicability to polymorphic systems, such as ROY, and across a range of solvents is key if we hope to utilise predictions from tools such as this in a laboratory setting as part of the decision-making process for crystalline growth conditions.
Due to the modularity of the protocol, future improvements or revisions should be extremely straightforward to substitute in. In particular, immense benefit could be realised through more sophisticated (though likely computationally demanding) solvation models which account for solvent structure. Similarly faster pair interaction energy models could be employed, provided that they are universally applicable, such as force fields,60,61 density functional tight binding,62 or machine-learned potential methods. We anticipate that these avenues will be explored in future works.
While the present study has focused on the development of a protocol to determine the thermodynamics of growth unit additional and removal for molecular crystals, an area for future development is the extension to other material types. For example, the application to ionic crystals, such as minerals, presents a few additional challenges. Firstly, the interactions between ions are no longer rapidly and unconditionally convergent in real space, and so specific handling of charge sums will be required. Secondly, the use of quantum mechanical calculations for isolated species will be problematic for anions, especially those that are multiply-charged, due to the tendency for the electrons to delocalise. This would therefore require either the inclusion of a confinement potential, or to rely on the consequences of a finite atom-centred basis to address this issue. Extension to materials that contain periodic frameworks, such as zeolites, would also require some modification of the protocol to handle breaking of covalent bonds between growth units. This would require corrections for the conversion of bonds to a terminal functional group that is in contact with solution. For the example of zeolites (SiO2), this would require protonation of the dangling Si–O bonds, which could be handled in a manner similar to the correction applied to adipic acid depending on the pH of the solution. The determination of the lattice energy for covalent frameworks based on coupling of growth units would then follow similar approaches used in quantum mechanical fragmentation methods.63,64
It is our vision that automated, rapid protocols for the prediction of crystal growth, such as the present method, will soon be readily integrated into laboratory settings for targeted design and prediction of crystal forms and habits via close integration with the CrystalGrower method, and – especially in combination with accurate crystal structure prediction protocols – utilised to screen for desirable crystal forms in the design of new materials, or optimisation of existing active ingredients.
4 Methods
4.1 Interaction energies, lattice energies and sublimation energy
Intermolecular interaction energies were calculated using the CrystalExplorer (CE-B3LYP) model.34,65 This model uses isolated, gas-phase, molecular wavefunctions and separately calculates electrostatic (Coulomb), exchange-repulsion, dispersion and polarisation terms, which are subsequently scaled in order to produce total interaction energies. A thorough exposition of the details of these energies is available in the original references provided.The key feature of the CE-B3LYP model is that it aims to provide reasonable estimates for the lattice energies of molecular crystals via direct summation, without the need to optimise the experimental crystal structure or the gas-phase molecular geometry. The total lattice energy of a crystal may be approximated as the sum of pairwise interactions, EAB, between molecules (or fragments, ions etc., though in the latter case special care would be requirement to handle the conditional convergence of charge–charge interactions) as follows:
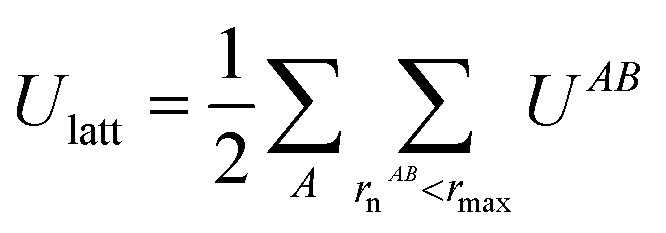 | (7) |
Typically for neutral molecules this sum will rapidly converge with respect to the interaction distance, rAB. An obvious choice for the interaction distance is to use molecular centres of mass, rc, but it is our experience that a better measure for the purposes of intermolecular interactions is the nearest atom–atom pair in the dimer, rn, as, especially for very anisotropic molecular shapes, it is the nearest proximity which is a better indicator of whether there will be any significant energetic interaction. An illustrative example is shown in Fig. 8 for adipic acid, where the hydrogen bonded dimer interaction in the crystal has a centre of mass distance, rc, of approximately 10 Å, but the nearest atom–atom distance, rn, is less than 2 Å.
 | ||
| Fig. 8 Intermolecular distance metrics rc (centre of mass distance, green) and rn (nearest atom–atom distance, blue) for an adipic acid dimer. Carbon, oxygen and hydrogen are coloured grey, red and white, respectively. | ||
While the total lattice energy is a reasonable approximation of the sublimation enthalpy of a crystal, precise estimation of the total sublimation enthalpy would require a vibrational correction to be calculated both in the solid and gas phases; something that would significantly increase the cost and is not possible within the CrystalExplorer model, which adopts the experimental structure. However, a simple approximation is available by treating the vibrating crystal as being composed of rigid molecules in a harmonic potential. This yields a vibrational term of 6RT in the crystal and 3RT in the gas phase. Further, we must apply a PV = RT correction in order to convert internal energies into enthalpies. This results in the following approximation:
| ΔHsub = −Ulatt + (−6 + 3 + 1)RT = −Ulatt + 2RT | (8) |
4.2 Long-range contributions
The CrystalGrower model currently tends to focus on the breakdown of energies into only nearest-neighbour interactions (for a given set of nearest neighbours) both in order to reduce the computational cost and also to reduce the number of parameters to be fitted to experiment. This choice is not without issue as, even in neutral molecules, interactions outside the first nearest-neighbour shell of molecules can significantly contribute to the total lattice energy – especially in molecules with a significant dipole. Of course, when this energy is treated as a fitted parameter then the effect of multiple shells can be implicitly subsumed into the final value. However, when explicitly computing pairwise interactions, this necessitates a method of approximately incorporating the non-nearest-neighbour interactions and their direction,![[r with combining macron]](https://www.rsc.org/images/entities/i_char_0072_0304.gif) AB, into our protocol.
AB, into our protocol.
The essence of our solution for long-range interactions is to assign each pair energy from non-nearest neighbours to nearest-neighbours based on their overlap in direction within the crystal. An illustrative example is given in Fig. 9 for the formamide crystal. Here, non-nearest-neighbour interaction AD will be divided up and proportionally assigned to interactions AB and AC based on their overlap, i.e., the dot products 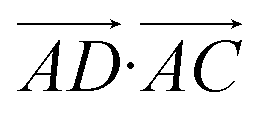 and
and 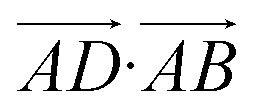 .
.
 | ||
| Fig. 9 Illustration of incorporating a non-nearest-neighbour interaction (AD) by partitioning its energy into contributions to nearest-neighbour interactions in similar directions (AB and AC). | ||
The following equations demonstrate the evaluation of the total weight for a given non-nearest-neighbour interaction wtotAC and how that is subsequently used to determine the long-range energy contribution ULRAB for a given nearest-neighbour interaction AB:
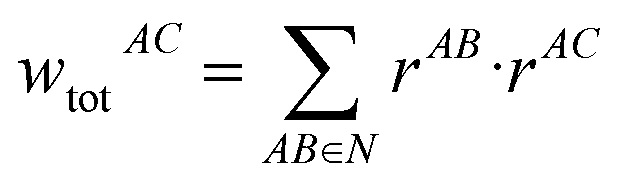 | (9) |
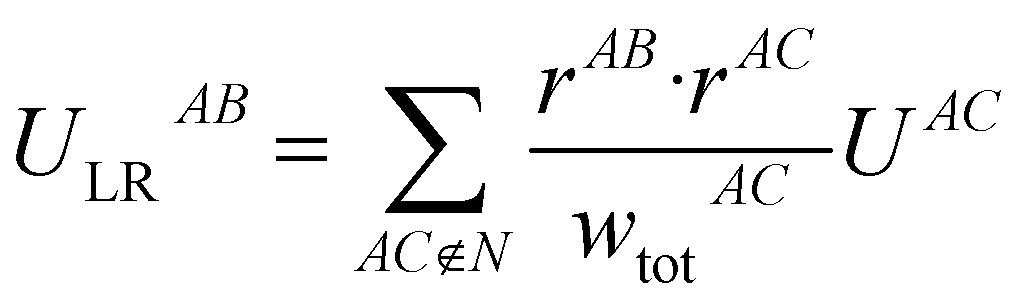 | (10) |
This procedure satisfies two essential criteria; the total energy is preserved, and the directionality of the contribution is (largely) maintained. This also has the side-effect that the total lattice energy estimate only involves the sum of these modified nearest-neighbour interaction energies, though obviously the non-nearest-neighbour energies must still be calculated. Typically, even in polar crystals, individual non-nearest-neighbour interactions only have magnitudes of less than 5 kJ mol−1 per interaction but, as they are numerous, they can significantly affect the total lattice energy and thus the estimated solubility. Further, since these interactions are generally a mix of binding and non-binding interactions, the relative energies between nearest-neighbour interactions can shift significantly. It should be noted, however, that the treatment of these long-range contributions is entirely optional in the accompanying software implementation, and for some systems they may be safely neglected. In the present work, these were incorporated out to a maximum nearest-atom separation of up to 30 Å, or until the lattice energy was suitably converged (whichever was reached first).
4.3 Solvent contribution
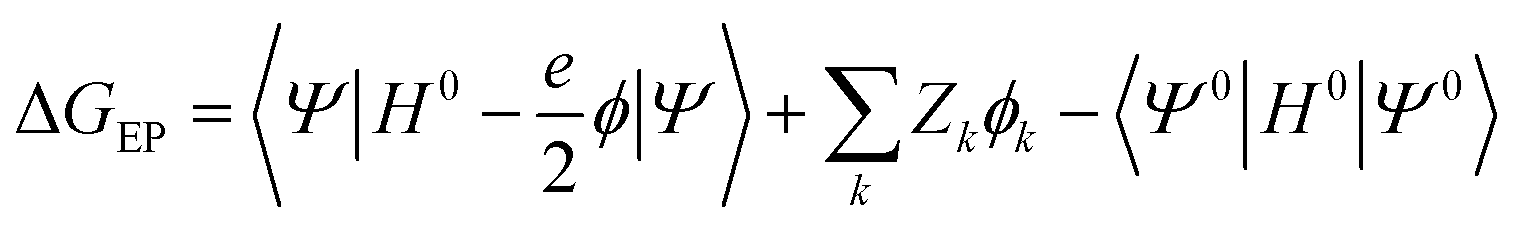
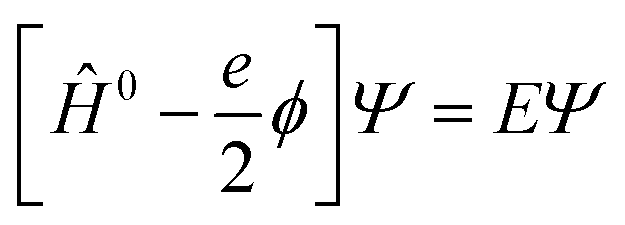
A key feature of the simulation of crystallisation here is that the molecular crystal is usually growing or dissolving in the presence of a solvent, rather than via gas phase transport. As a result, the role of the solvent must be accounted for, both in solvating the growth unit prior to attachment (or conversely after detachment) and via solvation of the crystal surface. Thermodynamically, the contribution of the solvent can be incorporated via the free energy of solvation of the individual molecular components of the crystal, as will be shown below. Accurate determination of free energies of solvation generally requires explicit atomistic simulations, such as the use of free energy perturbation to introduce the molecule into the solvent.66 However, this approach is not suited to automated, rapid determination, which is the objective here, since it would require the choice of a force field and convergence of a statistical quantity. Instead, more approximate approaches that avoid explicit simulation and can be almost universally applied are preferable. For these reasons, our approach focuses on the use of continuum solvation models that can be used in conjunction with molecular quantum mechanical treatment of the growth unit.67Free energies of solvation, ΔGsolv, are calculated for each symmetry unique molecule in the crystal, utilising the SMD solvation model.36 While there are many different continuum solvent models available, SMD was chosen because of the wide range of solvents that have been parameterised, as well as the method not being tied to a specific level of theory and basis set. The determination of the induced charges on the solvent accessible surface is performed self-consistently, i.e., using the self-consistent reaction field (SCRF) paradigm, so that changes in the electron density of the molecule may be properly incorporated. Of course, this requires two complete wavefunction calculations (i.e. two SCF procedures), but is necessary to estimate the molecular polarisation, i.e., differences in molecular orbitals and the associated energy, in order to accurately estimate ΔGsolv. SMD approximates the solvation free energy of a molecule as the sum of three parts;
| ΔGsolv = ΔGENP + ΔGCDS + ΔGstd | (11) |
The electrostatic term of SMD is determined as follows;
 | (12) |
 | (13) |
| Ĥ0Ψ0 = E0Ψ0 | (14) |
 | (15) |
4.4 Solvent accessible surface generation and charge determination
In our implementation of SMD, the molecular surfaces are generated using atom-centred Lebedev grids (with 146 points). The radii used for atoms are different for the Coulomb and CDS surfaces, with the values corresponding to those in the original paper.36 The surface generation is performed as follows:(1) The molecule is projected onto its principal axes (ignoring mass),
(2) Each atom is surrounded by a grid of points, and accompanying weights (surface areas) based on its intrinsic radius, plus the radius of the solvent.
(3) Any points inside the surface, i.e., within the radius of more than one sphere surrounding an atom, are discarded.
(4) The points are contracted toward their original atomic centre by a vector with magnitude equal to the solvent radius.
Due to the symmetry of Lebedev grids, aligning the axes of the grid with those of the molecule via (step 1) helps to maintain symmetry throughout the calculations without increasing the grid size. The radius of the solvent used in SMD calculations is 0 Å, which may indicate that the expansion by solvent radius (step 2) and subsequent contraction (step 4) is unnecessary, but for this procedure a value of 0.001 Å is used in order to avoid points being too close together on the surface (i.e., singularities in the surface–surface energy term which may otherwise arise).
Two surfaces are generated, one for the Coulomb/electrostatic contribution and used in the SCRF, and another for the CDS contribution. The corresponding surface for each interaction type is used when the energy partitioning is performed later.
In the original SMD work, the electrostatics involving the solvent accessible surface were calculated using the IEF-PCM68–70 method. In our implementation, we use a model akin to that in COSMO71 to solve for the surface charges;
 | (16) |
 | (17) |
| Q = Aq | (18) |
4.5 Partitioning the solvation free energy
In order for a new molecule to be incorporated into a crystal growth site in solution, solvent must be displaced. This displacement occurs both where solvent is replaced on the surface of the crystal and where solvent is surrounding the solute molecule. This means that in order to accurately model crystal growth energies, the effect of ΔGsolv on each interaction in the crystal must be determined. To this end, we utilise the existing molecular surfaces which are calculated as part of the SMD procedure; one each for both the electrostatic/Coulomb component and the cavitation-dispersion/surface term (CDS). While these surfaces differ, essentially in their proximity to the solute, the same procedure can be used to partition both components of ΔGsolv into intermolecular interaction terms, ΔGsolv. The procedure is as follows:(1) The continuum solvation surface is rotated to match the orientation of the molecule in the crystal environment.
(2) Each point on the surface is assigned to the nearest neighbouring molecule, as determined by the nearest atom outside of the surface, normalised by the van der Waals radius (i.e., excluding the atoms of the molecule to which the surface belongs).
(3) The surface area of each point (i.e., integration weight) is used to partition the total energetic contribution.
This partitioning scheme is convenient, as all components of the SMD solvation model depend directly on the surface area.
The above procedure is used both to model the removal of solvent of molecule A in the direction of B,  , and vice versa for the removal of solvent of surrounding molecule B in the direction of A,
  , note that this is, in general, not symmetric, which may be seen in Fig. 10, where the red and grey (or green and orange) parts of the surface are complementary with respect to dimer interactions, but are not equivalent.
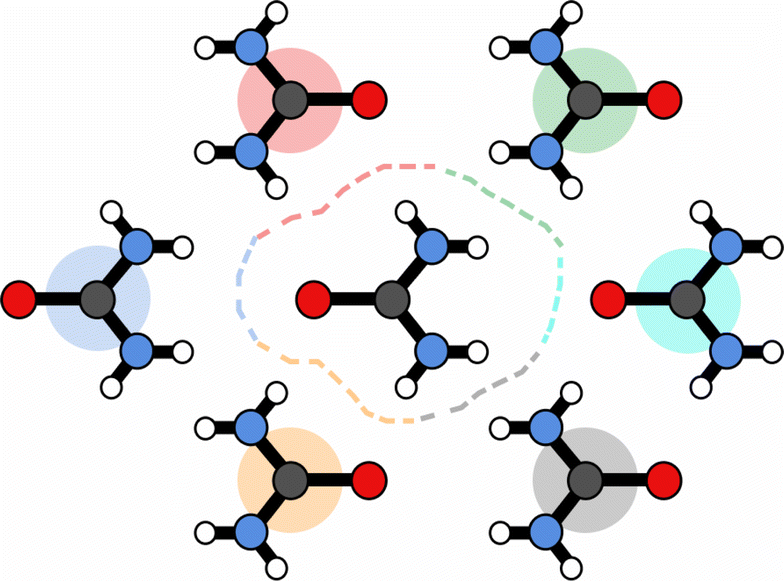 | ||
| Fig. 10 Schematic of surface partitioning for urea. Points on the surface are coloured according the nearest-neighbour molecule. | ||
If the solvation component of interaction AB is set to be simply  then this asymmetry will, by construction, disappear. This is undesirable, as the process being modelled is that of a solute molecule in solution ‘crystallising’ i.e. binding to the crystal, so one of the molecules is in the crystal, the other in solvent. However, merely ignoring desolvation of one side is also a poor representation of the process. A simple solution is as follows:
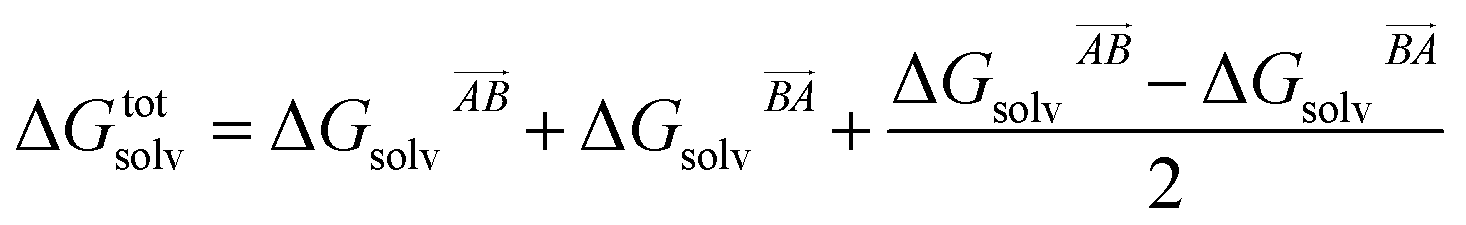 | (19) |
This equation satisfies the preservation of the total energy, while maintaining the asymmetry of the interaction sites and produces correct results for the total energy.
Because SMD has been fitted to experiment, entropy contributions in the solution are implicitly incorporated into the solvation free energies. However, this means that the present approach is only strictly applicable close to standard temperature.
4.6 Gas-phase entropy
While the primary objective of the present method is to compute the interaction parameters between molecules that can be used in CrystalGrower simulations, it is also possible to estimate the solubility from the same methodology. In order to do this, it is necessary to account for the rotational and translational entropy contributions in the gas-phase, which are calculated assuming an ideal gas and allowing for the molecular point group. It should be noted that while we are not performing a gas-phase optimisation of the molecule, the molecular point group is compatible with the point group of the crystal, but must be determined based on the molecular geometry.The rotational and translational contributions are calculated using the standard formulae based on the ideal gas, where for the rotational contribution the principal moments of inertia and symmetry number determine the entropy, and for the translational contribution only the total mass of the molecule, m is required. These terms are given by the following equations for the case of a non-linear molecule;
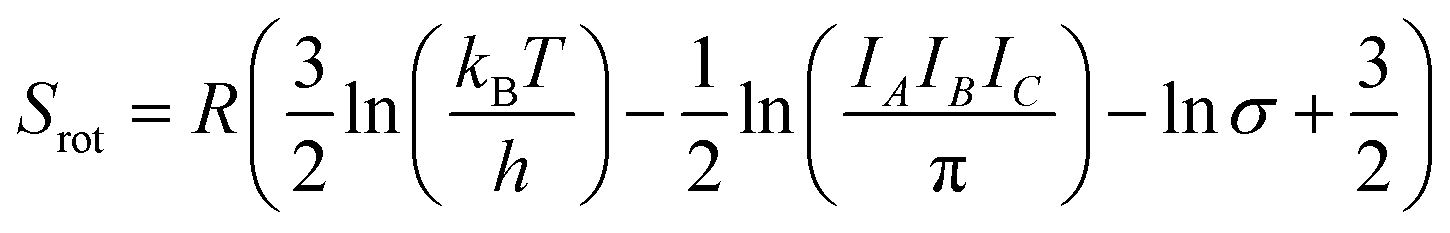 | (20) |
 | (21) |
4.7 Normalisation of hydrogen bond lengths
The X–H bond lengths in crystals obtained from diffraction data can vary substantially depending on whether X-rays or neutrons are used, with the former yielding distances that are often too short. In order to address this potential source of variability associated with the choice of crystal structure, we opt to standardise the bond lengths involving hydrogen such that they adopt typical values while maintaining the orientation determined experimentally. The standard bond lengths used throughout this work for C–H, N–H and O–H bonds are 1.083, 1.009 and 0.983 Å, respectively.4.8 Availability of the software
All methods and procedures for determining the energies for crystal growth have been implemented and incorporated into the Open Computational Chemistry (OCC) library and an accompanying program (occ-cg). This includes the wavefunction calculations, CrystalExplorer model energies, SMD solvation model, surface construction etc. This software and its source are freely available under the GNU Public License (GPL) version 3. The current version of the software has been made available on GitHub.4.9 CrystalGrower
The simulated crystal habits within this work have been generated using the CrystalGrower software. The CrystalGrower input files were obtained using the occ-cg module and CIF files from provided CSD ref. codes, these contain both the structural and nearest neighbour connection information.28 For each simulation, the supersaturation profile used involved a high starting supersaturation (100 kcal mol−1), to ensure nucleation and growth, and then the supersaturation was dropped to equilibrium over a period of 100000 iterations. The OVITO software was used to visualise the output crystal shapes,72 where the colouring applied to each simulated crystal reflects the growth layers found on each surface.
For the predicted crystal habits, the energies calculated by the theoretical model were used. These simulations were carried out over a period of 5 million iterations including 4 million iterations at the high starting supersaturation.
The experimental morphologies for each system were recreated, in STL format, using the specified crystal structures with the aid of the VESTA software.73 This involved manually constructing the crystal morphology, inserting planes at specified distances (see Section S3 in the ESI† for more details) based on visual inspection of micrographs of experimental crystals (references are provided in the following subsections on each system discussed in this work). Following that, a novel shape comparison method was then employed to assess the goodness of fit of each CrystalGrower simulation to the recreated experimental morphology. This method was based on the spherical harmonic shape descriptor approach introduced by Spackman et al.74,75 A complete description and extension of this shape comparison and fitting procedure is currently being prepared for publication.
092 simulations.
000 simulations. The case study of ibuprofen was used to explore the effects of solvent, therefore multiple morphologies were recreated based on optical images provided by Nguyen et al.76 Four shape files, namely for ibuprofen grown in ethanol, ethyl acetate, acetonitrile and toluene, were then compared against the large series resulting in four sets of fitted CrystalGrower energies (Table S5†).
The 3 separate series of simulations for YT04, R and Y polymorphs resulted in 5625, 15625, 24000 simulations, respectively.
In YT04, following the very low predicted interaction energies, interactions H and I were omitted from the CrystalGrower input files in order to reduce the computational cost per simulation. Interactions D and F were also fixed to the predicted value. For R, interactions E, F, H, I and K were fixed to their respective predicted energy values. The rest were varied within the specified ranges (Table S13†). Each series of simulations (per polymorph) was compared against the experimental morphology, in order to determine the best fit CrystalGrower energy values for each interaction.
Data availability
The relevant data for this work are included in the ESI,† and the software is available (open source) on GitHub: https://github.com/peterspackman/occAuthor contributions
Conceptualization was by JDG, PRS and MWA, methodology by PRS and JDG, software, validation and writing – original draft by PRS, investigation, data analysis and visualisation by PRS and AJW, funding acquisition by JDG and MWA, formal analysis and writing – review & editing by all authors.Conflicts of interest
There are no conflicts to declare.Acknowledgements
JDG thanks the Australian Research Council for funding under grant FL180100087. JDG and PRS thank the Pawsey Supercomputing Centre and National Computational Infrastructure for provision of computing resources. MWA thanks BASF for partial support for AJW. The authors would also like to acknowledge the use of the Computational Shared Facility (CSF3) at The University of Manchester.Notes and references
- D. Amabilino and X. Obradors, Chem. Soc. Rev., 2014, 43, 2009 RSC.
- P. Dandekar, Z. B. Kuvadia and M. F. Doherty, Annual Reviews in Materials Research, 2013, 43, 359–386 CrossRef CAS.
- M. Lovette and M. F. Doherty, Cryst. Growth Des., 2013, 13, 3341–3352 CrossRef CAS.
- G. Wulff, Zeitschrift für Kristallographie – Crystalline Materials, 1901, 34, 449–530 CrossRef CAS.
- A. Bravais, Études cristallographiques, Gauthier-Villars, 1886 Search PubMed.
- G. Friedel, Bull. Soc. Fr. Mineral., 1907, 30, 326 Search PubMed.
- J. D. H. Donnay and D. Harker, Am. Mineral., 1937, 22, 446–467 CAS.
- P. Hartman and W. G. Perdok, Acta Crystallogr., 1955, 8, 49–52 CrossRef.
- A. S. Barnard and P. Zapol, J. Chem. Phys., 2004, 121, 4276–4283 CrossRef CAS PubMed.
- A. Navrotsky, Proc. Natl. Acad. Sci. U. S. A., 2004, 101, 12096–12101 CrossRef CAS PubMed.
- S. R. Yeandel, C. L. Freeman and J. H. Harding, J. Chem. Phys., 2022, 157, 084117 CrossRef CAS PubMed.
- B. Delley, Mol. Simul., 2006, 32, 117–123 CrossRef CAS.
- O. Andreussi and N. Mazari, Phys. Rev. B: Condens. Matter Mater. Phys., 2014, 90, 245101 CrossRef CAS.
- C. Yip and M. Ward, Biophys. J., 1996, 71, 1071–1078 CrossRef CAS PubMed.
- A. McPherson, A. J. Malkin and Y. G. Kuznetsov, Annu. Rev. Biophys. Biomol. Struct., 2000, 29, 361–410 CrossRef CAS PubMed.
- E. H. H. Chow, D.-K. Bučar and W. Jones, Chem. Commun., 2012, 48, 9210–9226 RSC.
- D. Musumeci and M. D. Ward, CrystEngComm, 2011, 13, 1067–1069 RSC.
- M. K. Choudhary, R. Jain and J. D. Rimer, Proc. Natl. Acad. Sci. U. S. A., 2020, 117, 28632–28639 CrossRef CAS PubMed.
- J. R. Agger, N. Pervaiz, A. K. Cheetham and M. W. Anderson, J. Am. Chem. Soc., 1998, 120, 10754–10759 CrossRef CAS.
- J. R. Agger, N. Hanif and M. W. Anderson, Angew. Chem., Int. Ed., 2001, 40, 4065–4067 CrossRef CAS PubMed.
- M. Shoaee, M. Anderson and M. Attfield, Angew. Chem., Int. Ed., 2008, 47, 8525–8528 CrossRef CAS PubMed.
- S. X. M. Boerrigter, G. P. H. Josten, J. van de Streek, F. F. A. Hollander, J. Los, H. M. Cuppen, P. Bennema and H. Meekes, J. Phys. Chem. A, 2004, 108, 5894–5902 CrossRef CAS.
- I. Kurganskaya, N. Trofimov and A. Luttge, Minerals, 2022, 12, 639 CrossRef CAS.
- S. Piana, M. Reyhani and J. D. Gale, Nature, 2005, 438, 70–73 CrossRef CAS PubMed.
- S. Piana and J. D. Gale, J. Am. Chem. Soc., 2005, 127, 1975–1982 CrossRef CAS PubMed.
- A. G. Stack, P. Raiteri and J. D. Gale, J. Am. Chem. Soc., 2012, 134, 11–14 CrossRef CAS PubMed.
- A. Silvestri, P. Raiteri and J. Gale, J. Chem. Theory Comput., 2022, 18, 5901–5919 CrossRef CAS PubMed.
- A. R. Hill, P. Cubillas, J. T. Gebbie-Rayet, M. Trueman, N. d. Bruyn, Z. a. Harthi, R. J. S. Pooley, M. P. Attfield, V. A. Blatov, D. M. Proserpio, J. D. Gale, D. Akporiaye, B. Arstad and M. W. Anderson, Chem. Sci., 2021, 12, 1126–1146 RSC.
- M. W. Anderson, J. T. Gebbie-Rayet, A. R. Hill, N. Farida, M. P. Attfield, P. Cubillas, V. A. Blatov, D. M. Proserpio, D. Akporiaye, B. Arstad and J. D. Gale, Nature, 2017, 544, 456–459 CrossRef CAS PubMed.
- M. Rak, M. Izdebski and A. Brozi, Comput. Phys. Commun., 2001, 138, 250–263 CrossRef CAS.
- M. Andersen, C. Panosetti and K. Reuter, Front. Chem., 2019, 7, 202 CrossRef CAS PubMed.
- R. P. Bell and C. N. Hinshelwood, Proc. R. Soc. London, Ser. A, 1936, 154, 414–429 Search PubMed.
- M. G. Evans and M. Polanyi, Trans. Faraday Soc., 1936, 32, 1333–1360 RSC.
- C. F. Mackenzie, P. R. Spackman, D. Jayatilaka and M. A. Spackman, IUCrJ, 2017, 4, 575–587 CrossRef CAS PubMed.
- P. R. Spackman, M. J. Turner, J. J. McKinnon, S. K. Wolff, D. J. Grimwood, D. Jayatilaka and M. A. Spackman, J. Appl. Crystallogr., 2021, 54, 1006–1011 CrossRef CAS PubMed.
- A. V. Marenich, C. J. Cramer and D. G. Truhlar, J. Phys. Chem. B, 2009, 113, 6378–6396 CrossRef CAS PubMed.
- S. P. Thomas, P. R. Spackman, D. Jayatilaka and M. A. Spackman, J. Chem. Theory Comput., 2018, 14, 1614–1623 CrossRef CAS PubMed.
- X.-Y. Liu and P. Benema, J. Chem. Phys., 1993, 98, 5863–5872 CrossRef CAS.
- D. Winn and M. F. Doherty, AIChE J., 1998, 44, 2501–2514 CrossRef CAS.
- G. Clydesdale, R. Doherty and K. Roberts, Comput. Phys. Commun., 1991, 64, 311–328 CrossRef CAS.
- D. Gay and A. Rohl, J. Chem. Soc., Faraday Trans., 1995, 91, 925–936 RSC.
- G. Watson, E. Kelsey, N. de Leeuw, D. Harris and S. Parker, J. Chem. Soc., Faraday Trans., 1996, 92, 433–438 RSC.
- J. Gale and A. Rohl, Mol. Simul., 2003, 29, 291–341 CrossRef CAS.
- P. Hartman and W. G. Perdok, Acta Crystallogr., 1955, 8, 521–524 CrossRef CAS.
- P. Hartman and W. G. Perdok, Acta Crystallogr., 1955, 8, 525–529 CrossRef CAS.
- P. Hartman and P. Bennema, J. Cryst. Growth, 1980, 49, 145–156 CrossRef CAS.
- G. H. Gilmer and P. Bennema, J. Appl. Phys., 1972, 43, 1347–1360 CrossRef CAS.
- Y. Zhao, C. J. Tilbury, S. Landis, Y. Sun, J. Li, P. Zhu and M. F. Doherty, Cryst. Growth Des., 2020, 20, 2885–2892 CrossRef CAS.
- J. Wang, R. M. Wolf, J. W. Caldwell, P. A. Kollman and D. A. Case, J. Comput. Chem., 2004, 25, 1157–1174 CrossRef CAS PubMed.
- D. S. Palmer, A. Llinàs, I. Morao, G. M. Day, J. M. Goodman, R. C. Glen and J. B. O. Mitchell, Mol. Pharmaceutics, 2008, 5, 266–279 CrossRef CAS PubMed.
- H. Cano, N. Gabas and J. Canselier, J. Cryst. Growth, 2001, 224, 335–341 CrossRef CAS.
- T. T. H. Nguyen, I. Rosbottom, I. Marziano, R. B. Hammond and K. J. Roberts, Cryst. Growth Des., 2017, 17, 3088–3099 CrossRef CAS.
- C. D. Cappa, E. R. Lovejoy and A. R. Ravishankara, J. Phys. Chem. A, 2007, 111, 3099–3109 CrossRef CAS PubMed.
- L. Yu, Acc. Chem. Res., 2010, 43, 1257–1266 CrossRef CAS PubMed.
- T. B. Borchardt, J. G. Stowell and S. R. Byrn, Mol. Cryst. Liq. Cryst. Sci. Technol., Sect. A, 1998, 313, 271–276 CrossRef CAS.
- D. S. Coombes, C. R. A. Catlow and B. Slater, Mol. Simul., 2008, 34, 873–877 CrossRef CAS.
- D. J. Fowles, D. S. Palmer, R. Guo, S. L. Price and J. B. O. Mitchell, J. Chem. Theory Comput., 2021, 17, 3700–3709 CrossRef CAS PubMed.
- J. Mitchell, ADMET and DMPK, 2020, 8, 215–250 Search PubMed.
- M. Trueman, D. Akporiaye and M. Anderson, Faraday Discuss., 2022, 235, 343–361 RSC.
- S. Spicher and S. Grimme, Angew. Chem., Int. Ed., 2020, 59, 15665–15673 CrossRef CAS PubMed.
- J. D. Gale, L. M. LeBlanc, P. R. Spackman, A. Silvestri and P. Raiteri, J. Chem. Theory Comput., 2021, 17, 7827–7849 CrossRef CAS PubMed.
- C. Bannwarth, S. Ehlert and S. Grimme, J. Chem. Theory Comput., 2019, 15, 1652–1671 CrossRef CAS PubMed.
- M. S. Gordon, D. G. Fedorov, S. R. Pruitt and L. V. Slipchenko, Chem. Rev., 2012, 112, 633–672 CrossRef PubMed.
- B. Wang, K. R. Yang, X. Xu, M. Isegawa, H. R. Leverentz and D. G. Truhlar, Acc. Chem. Res., 2014, 47, 2731–2738 CrossRef CAS PubMed.
- M. J. Turner, S. Grabowsky, D. Jayatilaka and M. A. Spackman, J. Phys. Chem. Lett., 2014, 5, 4249–4255 CrossRef CAS PubMed.
- W. L. Jorgensen and L. L. Thomas, J. Chem. Theory Comput., 2008, 4, 869–876 CrossRef CAS PubMed.
- J. Tomasi, B. Mennucci and R. Cammi, Chem. Rev., 2005, 105, 2999–3093 CrossRef CAS PubMed.
- E. Cancès, B. Mennucci and J. Tomasi, J. Chem. Phys., 1997, 107, 3032–3041 CrossRef.
- B. Mennucci and J. Tomasi, J. Chem. Phys., 1997, 106, 5151–5158 CrossRef CAS.
- B. Mennucci, E. Cancès and J. Tomasi, J. Phys. Chem. B, 1997, 101, 10506–10517 CrossRef CAS.
- A. Klamt and G. Schüürmann, J. Chem. Soc., Perkin Trans. 2, 1993, 799–805 RSC.
- A. Stukowski, Modell. Simul. Mater. Sci. Eng., 2010, 18, 015012 CrossRef.
- K. Momma and F. Izumi, J. Appl. Crystallogr., 2011, 44, 1272–1276 CrossRef CAS.
- P. R. Spackman, S. P. Thomas and D. Jayatilaka, Sci. Rep., 2016, 6, 22204 CrossRef CAS PubMed.
- P. R. Spackman, L.-J. Yu, C. J. Morton, M. W. Parker, C. S. Bond, M. A. Spackman, D. Jayatilaka and S. P. Thomas, Angew. Chem., Int. Ed., 2019, 58, 16780–16784 CrossRef CAS PubMed.
- T. T. H. Nguyen, R. B. Hammond, K. J. Roberts, I. Marziano and G. Nichols, CrystEngComm, 2014, 16, 4568–4586 RSC.
Footnote |
| † Electronic supplementary information (ESI) available. See DOI: https://doi.org/10.1039/d2sc06761g |
| This journal is © The Royal Society of Chemistry 2023 |