 Open Access Article
Tumor identification via in vivo portable Raman detection of sialic acid with a dual gold nanoprobe system†
Yuru
Wang
a,
Yuanjiao
Yang
a,
Jingxing
Guo
b,
Huangxian
Ju
 *a and
Yunlong
Chen
 *a
*a
aState Key Laboratory of Analytical Chemistry for Life Science, School of Chemistry and Chemical Engineering, Nanjing University, Nanjing 210023, China. E-mail: hxju@nju.edu.cn; ylc@nju.edu.cn
bSchool of Chemistry, Chemical Engineering and Life Sciences, Wuhan University of Technology, Wuhan 430070, P. R. China
First published on 21st December 2022
Abstract
A dual gold nanoprobe system was designed for in vivo portable Raman detection of sialic acid (SA) for tumor identification. The dual gold nanoprobe system contained two gold nanoprobes, Au10-DTTC/PEG-PBA and Au40-PEG-SA. Au10-DTTC/PEG-PBA was constructed on a 10 nm gold nanoparticle modified with 3,3′-diethylthia tricarbocyanine iodide (DTTCI) as the Raman reporter and 3-aminophenylboronic acid (APBA) through a thiol PEG succinimidyl carboxymethyl ester (HS-PEG-NHS) linker for specific recognition of SA. Au40-PEG-SA was constructed on a 40 nm gold nanoparticle modified with SA through HS-PEG-NHS. For in vivo detection of SA, Au10-DTTC/PEG-PBA and Au40-PEG-SA were subsequently injected into tumor xenografted mice with optimal interval and retention times. Through the specific recognition between PBA and SA, the conjugates of Au10-DTTC/PEG-PBA and Au40-PEG-SA formed in the tumor region emitted strong SERS signals of DTTC, which could be detected by a portable Raman detector. This work provides a convenient and portable method to detect SA in tumor xenografted mice, which is useful for family-stay identification and clinical cleavage of tumors.
Introduction
Sialic acid (SA) is a negatively charged monosaccharide, which generally occupies the termini of glycans on the cell surface and mammalian tissues.1,2 As the outmost end, SA determines the functions of many glycans, which further play critical roles in diverse physiological and pathological processes.3,4 Furthermore, numerous cancer cells often exhibit upregulated expression of SAs,5,6 which make SA an attractive cancer biomarker. Therefore, in situ detection of SA on cells or tissues, best in vivo, could greatly promote the development of cancer-related diagnostic and therapeutic approaches.Many methods based on fluorescence have been successfully used for in situ detection of SA on cells. These methods generally use fluorescent lectins to directly target SA,7–9 and functional dyes to label SA after chemical covalent recognition10,11 or metabolic labeling.12,13 Despite the successful application of SA detection on living cells and animals,14,15 these methods suffer the inherent defects of high bioluminescence background, low sensitivity, and fluorescence bleaching. Different from fluorescence methods, Raman spectroscopy, especially surface-enhanced Raman scattering (SERS), is a highly sensitive and non-bleaching method,16 which also possesses fingerprinting capability for high-throughput analysis.17 The SERS based method can be used for direct detection of glycans on living cells after metabolic labeling.18 Our group has also developed functional gold nanoprobe systems to image SA or protein-specific glycans on the cell surface19,20 and quantification of intracellular glycans.21 However, all these methods cannot achieve in vivo detection of SAs due to the inherent defects in design. Furthermore, they need large instruments such as a Raman spectrometer and confocal Raman microscope, which limits the clinical applications in diagnosis and therapy.
Herein, this work developed an updated dual gold nanoprobe system to detect sialic acid in vivo by a portable Raman detector. The dual gold nanoprobe system consisted of gold nanoparticles (AuNPs) prepared by the Frens method22 with diameters of 10 nm (Au10) and 40 nm (Au40). Au10 with a negligible SERS effect23 was loaded with 3,3′-diethylthia tricarbocyanine iodide (DTTCI) as the Raman reporter and thiol PEG 2K succinimidyl carboxymethyl ester (HS-PEG-NHS) as the linker. 3-Aminophenylboronic acid (APBA) for specific recognition of SA24–26 was further conjugated to obtain Au10-DTTC/PEG-PBA (Scheme 1a). Au40 with a strong SERS effect23 was modified with SA through the HS-PEG-NHS linker, and was defined as Au40-PEG-SA (Scheme 1a). For in vivo detection of SA (Scheme 1b), Au10-DTTC/PEG-PBA was firstly injected around the tumor periphery of xenograft mice models. After the unbound Au10-DTTC/PEG-PBA were completely cleaned by systemic circulation, Au40-PEG-SA was subsequently injected around the tumor periphery. In this case, Au10-DTTC/PEG-PBA bound with highly expressed SA in the tumor region could further conjugate Au40-PEG-SA to form AuNP conjugates and emit strong SERS signals of DTTC, which could be detected by a portable Raman detector. This work provides a convenient and portable method to detect SA in tumor xenografted mice, and further provides a convenient and powerful tool for the applications of family-stay identification and clinical cleavage of tumors.
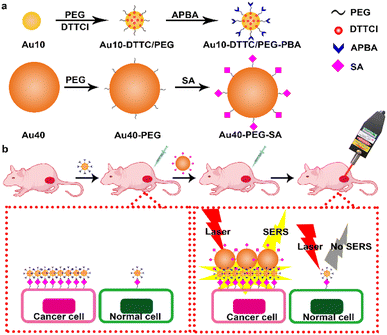 | ||
| Scheme 1 Schematic illustration. (a) Preparation of Au10-DTTC/PEG-PBA and Au40-PEG-SA. (b) In vivo detection of SA on a tumor xenografted mouse. | ||
Results and discussion
Characterization of AuNP probes
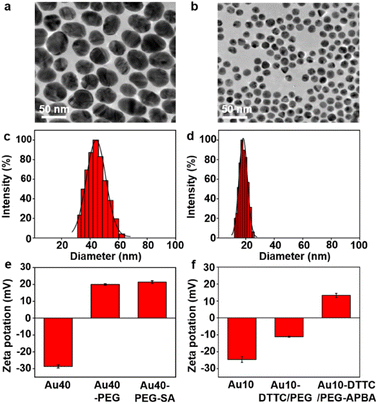
The AuNP probes with different sizes were firstly characterized with TEM images (Fig. 1a and b), which exhibited uniform size distributions of around 42 nm for Au40-PEG-SA and 13 nm for Au10-DTTC/PEG-PBA (Fig. S1†). The DLS analysis also exhibited narrow size distributions of hydrodynamic diameters around 44 nm and 18 nm (Fig. 1c and b), which agreed with the TEM results and indicated good dispersity of the AuNP probes. The zeta potentials of the AuNP probes exhibited obvious variations after step-by-step modifications (Fig. 1e and f), which also verified the success modification of the functional groups on AuNP probes. Besides, an obvious red shift was observed for Au10-DTTC/PEG-PBA compared to the unmodified Au10 in UV spectra, but that was tiny for Au40-PEG-SA compared to Au40 (Fig. S2†), which may be attributed to the strong UV absorption of DTTCI but weak UV absorption of SA and PEG linkers.To further confirm the successful modification of SA on Au40-PEG-SA, Au40-PEG-SA was incubated with fluorescent Sambucus Nigra agglutinin (FSNA), which can specifically recognize SA.27 Compared to the supernatants of FSNA incubated with Au40-PEG, the supernatants of FSNA incubated with Au40-PEG-SA exhibited an obvious decrease of the fluorescence intensity of FSNA (Fig. S3†), demonstrating the existence of SA on Au40-PEG-SA.
Specific binding of AuNP probes
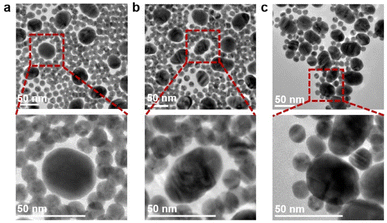
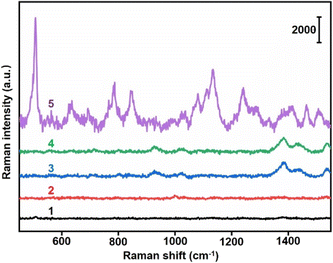
The specific binding between Au40-PEG-SA and Au10-DTTC/PEG-PBA was firstly verified by TEM images. The mixtures of Au10-DTTC/PEG-PBA with Au40-PEG, and Au10-DTTC/PEG with Au40-PEG-SA exhibited randomly dispersed distributions of the two AuNP probes (Fig. 2a and b). However the mixture of Au10-DTTC/PEG-PBA with Au40-PEG-SA exhibited obviously overlapped boundary between Au10 and Au40 (Fig. 2c), which demonstrated the PBA-SA specific interaction induced binding of the two AuNP probes.The specific binding of AuNP probes induced an SERS response which was further verified by in vitro Raman spectrometry analysis. Au10-DTTC/PEG-PBA or Au40-PEG-SA solutions did not exhibit any characteristic peak in 400–1800 cm−1 (Fig. 3, spectrum 1 and 2). Meanwhile, the mixtures of Au10-DTTC/PEG-PBA with Au40-PEG, Au10-DTTC/PEG with Au40-PEG-SA also did not exhibit any characteristic peak (Fig. 3, spectrum 3 and 4). Only the mixture of Au10-DTTC/PEG-PBA with Au40-PEG-SA solution could exhibit obvious characteristic peaks in 400–1800 cm−1 (Fig. 3, spectrum 5). Meanwhile, the mixture of Au10-PEG-PBA with Au40-PEG-SA and Au40-PEG-PBA solutions exhibited tiny characteristic peaks of PBA, which were covered by the strong DTTC characteristic peaks (Fig. S4†). Thus, Au10-DTTC/PEG-PBA and Au40-PEG-SA could specifically form AuNP conjugates to emit strong DTTC SERS signals. Besides, the Raman intensity of DTTC from the Au10-DTTC/PEG-PBA and Au40-PEG-SA aggregates kept stable after long-lasting incubations for 1–6 h (Fig. S5†), which indicated the stability of DTTC in the Au10 probe.
Detection of SA on cells
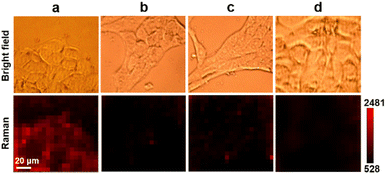
Prior to in vivo detection of SA in living animals, Au10-DTTC/PEG-PBA and Au40-PEG-SA were firstly used to detect SA on the living cell surface by Raman imaging. Excessive Au10-DTTC/PEG-PBA would not aggregate to bring false signals on or inside cells before washing (Fig. S6†), which could be completely removed by twice washing with PBS (Fig. S7†). After sequentially incubating with Au10-DTTC/PEG-PBA and Au40-PEG-SA, the mouse cancer cell line 4T1 cells exhibited an obvious Raman signal of DTTC (Fig. 4a). Meanwhile, characteristic peaks of DTTC at 506, 842, 1126, 1241, and 1293 cm−1 were detected only within the area of cell coverage (Fig. S8†), and the SEM images exhibited obvious Au40-PEG-SA binding on the cell surface (Fig. S9†). In contrast, 4T1 cells incubated with combination of Au10-DTTC/PEG and Au40-PEG-SA or Au10-DTTC/PEG-PBA and Au40-PEG did not exhibit any Raman signals of DTTC (Fig. 4b and c), which demonstrated the feasibility of using PBA-SA specific interactions for SA detection on the living cell surface. Besides, no Raman signals of DTTC were observed on human normal epithelial MCF-10A cells after incubation with Au10-DTTC/PEG-PBA and Au40-PEG-SA (Fig. 4d). The difference of SA expression on 4T1 and MCF-10A cells was investigated by confocal fluorescence images using FSNA (Fig. S10†). As a result, MCF-10A cells have an extremely low level of SA expression compared to 4T1 cells. Thus, the Raman imaging results were in good agreement with the fluorescence imaging results as well as the literature reports.28 Despite the advantages of higher sensitivity and non-photobleaching, the dual gold nanoprobe system for SA detection also displays excellent biocompatibility, which maintained cell viabilities higher than 90% after 6 h incubation of two different AuNP probes (Fig. S11†). Thus, the designed dual gold nanoprobe-based Raman method could be successfully used to distinguish normal and cancer cells, which provided great potential in in vivo application.In vivo detection of SA in tumor xenografted mice
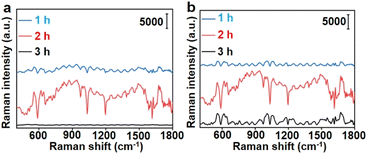
To demonstrate the in vivo application of the designed dual AuNP probe system, 4T1 tumor xenograft mice models were established by subcutaneous inoculation of 4T1 cells in the hind leg of the nude mice. Au10-DTTC/PEG-PBA and Au40-PEG-SA were sequentially injected at different locations with a distance of 2 cm from the tumor centre to prevent the reaction of two probes before reaching the tumor region.29 After a period of reaction, the Raman signals of DTTC at representative locations around the tumor region were collected with a portable Raman detector.To investigate the optimal retention period of different AuNP probes in vivo, different interval times between two injections and retention time before Raman detection were tested. Among the interval times of 1, 2, or 3 h and followed retention times of 1, 2, or 3 h, an interval time of 2 h and a retention time of 2 h could emit the strongest Raman signals (Fig. 5).
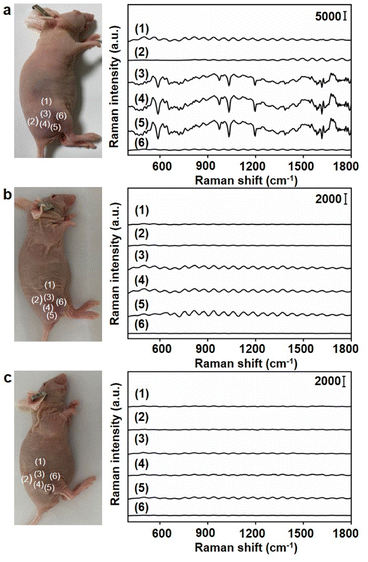
Under the optimal conditions, the Raman signals at six different locations around the tumor region were detected (Fig. 6a). Locations close to the tumor centre exhibited strong Raman signals (Fig. 6a, (3), (4) and (5)), while those far from tumor centre exhibited weak Raman signals (Fig. 6a, (1), (2) and (6)). To further demonstrate the accuracy of the designed dual gold nanoprobe system, Au40-PEG and Au10-DTTC/PEG were used to replace Au40-PEG-SA and Au10-DTTC/PEG-PBA respectively in in vivo analysis. As a result, the combination of Au10-DTTC/PEG-PBA and Au40-PEG or Au10-DTTC/PEG and Au40-PEG-SA did not exhibit any Raman signal (Fig. 6b and c). Besides, although the single gold nanoprobe system using Au40-DTTC/PEG-PBA was beneficial to SERS imaging of cells (Fig. S12a†), it brought false positive signals in the normal mice (Fig. S12b†) due to the residual of the ‘always-on’ probes. Thus, the designed dual gold nanoprobe system exhibited excellent specificity and reliability for in vivo detection of SA.
The biocompatibility of the designed dual gold nanoprobe system was further investigated by AAS analysis of the gold concentration remained in different organs (Fig. S13†),30 histological analysis of the main tissues (Fig. S14†), and a hemolysis test (Fig. S15†), which indicated that the AuNP probes could be fast cleaned up from the main organs, and no obvious damage or toxicity to the normal tissues and blood was detected. Thus, the designed dual gold nanoprobe system exhibited excellent safety and practicability for in vivo detection of SA, which provided a convenient and powerful tool for the applications of family-stay identification and clinical cleavage of tumors.
Conclusions
In conclusion, a dual gold nanoprobe system is designed for in vivo detection of sialic acid in tumor xenografted mice. This system utilizes Au10-DTTC/PEG-PBA and Au40-PEG-SA to specifically recognize SA and form gold conjugates in the tumor region, which can emit strong SERS signals. By simply using a portable Raman detector, SA in the tumor region of the tumor xenografted mice can be easily detected, which is useful to distinguish tumor and normal regions. The designed dual nanoprobe system exhibits high sensitivity and excellent biocompatibility. By using other recognition compounds, the dual nanoprobe system can be expanded for in vivo detection of different biomarkers, which provides a convenient and extensible tool for family-stay identification and clinical cleavage of human tumors.Data availability
All relevant data are presented in the paper and ESI.† Raw data are available upon request by email to the corresponding author.Author contributions
Y. C. and H. J. initiated the projects. Y. C., Y. W. and J. G. conceived the experiments. Y. W. and Y. Y. performed the experiments. Y. C. and H. J. analysed the data and wrote the manuscript.Conflicts of interest
The authors declare no competing financial interests.Acknowledgements
This work was supported by the National Natural Science Foundation of China (21974063, 21827812, and 21890741). This study was performed in strict accordance with the Laboratory Animal Management of Jiangsu Province for the care and use of laboratory animals (License No. SYXK 2019-0056) and was approved by the Department of Science and Technology of Jiangsu Province (Nanjing, China).Notes and references
- T. Angata and A. Varki, Chem. Rev., 2002, 102, 439–470 CrossRef CAS.
- A. L. Lewis, N. Desa, E. E. Hansen, Y. A. Knirel, J. I. Gordon, P. Gagneux, V. Nizet and A. Varki, Proc. Natl. Acad. Sci. U. S. A., 2009, 106, 13552–13557 CrossRef CAS PubMed.
- A. Varki, Nature, 2007, 446, 1023–1029 CrossRef CAS PubMed.
- X. Chen and A. Varki, ACS Chem. Biol., 2010, 5, 163–176 CrossRef CAS.
- M. M. Fuster and J. D. Esko, Nat. Rev. Cancer, 2005, 5, 526–542 CrossRef CAS.
- D. H. Dube and C. R. Bertozzi, Nat. Rev. Drug Discovery, 2005, 4, 477–488 CrossRef CAS.
- H. Lis and N. Sharon, Chem. Rev., 1998, 98, 637–674 CrossRef CAS PubMed.
- M. Xie, J. Hua, Y. M. Long, Z. L. Zhang, H. Y. Xie and D. W. Pang, Biosens. Bioelectron., 2009, 24, 1311–1317 CrossRef CAS.
- W. I. Weis and K. Drickamer, Annu. Rev. Biochem., 1996, 65, 441–473 CrossRef CAS.
- Y. Zeng, T. N. C. Ramya, A. Dirksen, P. E. Dawson and J. C. Paulson, Nat. Methods, 2009, 6, 207–209 CrossRef CAS.
- J. Nilsson, U. Ruetschi, A. Halim, C. Hesse, E. Carlsohn, G. Brinkmalm and G. Larson, Nat. Methods, 2009, 6, 809–811 CrossRef CAS PubMed.
- J. A. Prescher and C. R. Bertozzi, Cell, 2006, 126, 851–854 CrossRef CAS.
- S. T. Laughlin and C. R. Bertozzi, Nat. Protoc., 2007, 2, 2930–2944 CrossRef CAS.
- R. Xie, L. Dong, R. Huang, S. Hong, R. Lei and X. Chen, Angew. Chem., Int. Ed., 2014, 53, 14082–14086 CrossRef CAS PubMed.
- R. Xie, L. Dong, Y. Du, Y. Zhu, R. Hua, C. Zhang and X. Chen, Proc. Natl. Acad. Sci. U. S. A., 2016, 113, 5173–5178 CrossRef CAS.
- D. Graham and R. Goodacre, Chem. Soc. Rev., 2008, 37, 883–884 RSC.
- Y. Wang, B. Yan and L. Chen, Chem. Rev., 2013, 113, 1391–1428 CrossRef CAS PubMed.
- L. Lin, X. Tian, S. Hong, P. Dai, Q. You, R. Wang, L. Feng, C. Xie, Z.-Q. Tian and X. Chen, Angew. Chem., Int. Ed., 2013, 52, 7266–7271 CrossRef CAS.
- W. Song, L. Ding, Y. Chen and H. Ju, Chem. Commun., 2016, 52, 10640–10643 RSC.
- Y. Chen, L. Ding, W. Song, M. Yang and H. Ju, Chem. Sci., 2016, 7, 569–574 RSC.
- Y. Yang, Y. Chen, S. Zhao, H. Liu, J. Guo and H. Ju, Chem. Sci., 2022, 13, 9701–9705 RSC.
- G. Frens, Nat. Phys. Sci., 1973, 241, 20–22 CrossRef CAS.
- M. Moskovits, J. Raman Spectrosc., 2005, 36, 485–496 CrossRef CAS.
- H. Otsuka, E. Uchimura, H. Koshino, T. Okano and K. Kataoka, J. Am. Chem. Soc., 2003, 125, 3493–3502 CrossRef CAS PubMed.
- A. Matsumoto, N. Sato, K. Kataoka and Y. Miyahara, J. Am. Chem. Soc., 2009, 131, 12022–12023 CrossRef CAS.
- A. Matsumoto, H. Cabral, N. Sato, K. Kataoka and Y. Miyahara, Angew. Chem., Int. Ed., 2010, 49, 5494–5497 CrossRef CAS PubMed.
- E. Fischer and R. Brossmer, Glycoconjugate J., 1995, 12, 707–713 CrossRef CAS PubMed.
- X. Ma, W. Dong, Z. Su, L. Zhao, Y. Miao, N. Li, H. Zhou and L. Jia, Cell Death Dis., 2016, 7, e2561 CrossRef CAS PubMed.
- R. Hu, K.-T. Yong, I. Roy, H. Ding, W.-C. Law, H. Cai, X. Zhang, L. A. Vathy, E. J. Bergey and P. N. Prasad, Nanotechnology, 2010, 21, 145105 CrossRef.
- Y. Akiyama, T. Mori, Y. Katayama and T. Niidome, J. Controlled Release, 2009, 139, 81–84 CrossRef CAS.
Footnote |
| † Electronic supplementary information (ESI) available. See DOI: https://doi.org/10.1039/d2sc05163j |
| This journal is © The Royal Society of Chemistry 2023 |

