
Course letter grades and rates of D, W, F grades can introduce variability to course comparisons
Nicole M.
James

Chemistry Department, Reed College, Portland, Oregon 97202, USA. E-mail: njames@reed.edu
First published on 13th December 2022
Abstract
Course grades are commonly used as an evaluation metric within institutions and as part of education research. However, using grades to compare across course sections may implicitly assume that grades are awarded similarly and consistently. This article details how different sections of the same course offered differing amounts of extra credit and adjusted letter grades to different extents at the end of the term (post hoc). In one section, extra credit altered the letter grades of 26.6% of students, and post hoc adjustments altered the letter grades of 35.4% of students. In contrast, in a concurrently-offered section, 1.7% of student grades changed due to extra credit, and 4.3% due to post hoc adjustments. This may complicate some grade-based assessments of instructors, curricula, pedagogical practices, or students. We hope this catalyzes further study into how widespread this phenomenon is, what mechanisms influence it, and what the implications are. Meanwhile, we suggest that education researchers might consider explicitly discussing any available evidence that grades are consistently awarded and/or the possible repercussions of any inconsistency. When not possible, this might be discussed as a study limitation.
Introduction
In this article, we examine the degree to which course grades are awarded in alignment with the stated policy in the course syllabus, and how this varies between sections of a course. Course grades are generally defined as an aggregate measure of student achievement on individual course assignments (e.g. homework and exams). In the United States, this is typically accomplished through assigning A, B, C, D, or F letter grades. The A–F grade scale emerged in the United States in the 1920s–1940s (Brookhart et al., 2016); prior to this, various number and letter systems, as well as narrative accounts of student learning, were in use (Tocci, 2010).Naturally, the character of individual assessments, what they assess, and how they constitute the course grade, varies considerably (Lipnevich et al., 2020). In many courses, grades are determined by a numerical score reflecting the accuracy of students’ work on assignments. However, in some cases, grades may be determined based on a contract agreed upon by the student(s) and instructor (Elbow and Danielewicz, 2008), or by “ungrading,” which emphasises narrative feedback and assigns letter grades based on student self-assessments with instructor oversight (Blum, 2020). In all cases, grades may incorporate behavioral aspects such as attendance and participation (Lipnevich et al., 2020).
It has been argued that grades should not include behavioral attributes and should instead be determined based on assignment performance alone (Allen, 2005; Guskey, 2006). However, many learning frameworks, such as Novak's theory of meaningful learning (Novak, 1977), explicitly identify affective and behavioral characteristics as inherent to the learning process. Even when not explicit, affective and behavioral components are often implicitly integrated in learning frameworks. For example, the Conceptual Change framework has been discussed as having salient affective components (Sinatra, 2010). In practice, it has been established that teachers take perceptions of non-cognitive traits such as neatness or effort into consideration when assigning grades, even when those traits are not explicitly part of evaluation criteria (Brookhart, 1990; Guskey and Link, 2018; Bowers, 2019). Thus, non-cognitive attributes could be seen as practically and philosophically impossible to extricate from the assigned grade.
There has long been avid scholarly discussion about the purpose of grades and their potential for variability between courses and instructors. It is unclear if the primary purpose of grades is to provide feedback, measure learning, and/or rank students—or if grades even can achieve any of these purposes (Schinske and Tanner, 2014; Schwab et al., 2018). The very nature of course letter grades has been critiqued as providing only partial insight into learning (Rosenthal, 2004) and being misaligned with how students construct knowledge (Maki, 2004). The practice of ‘curving’ course grades has been criticized as having inherent, problematic equity implications (Bowen and Cooper, 2022). In addition, an examination of the literature by Brookhart et al. concludes that course grades are highly variable (Brookhart et al., 2016). In agreement with this, a recent study examined multiple instructors’ grading of identical chemistry assignments, using a rubric. There was substantial variation in the nature of feedback and how credit was awarded (Herridge and Talanquer, 2020). Relatedly, the use of grades as a research measure has been questioned (Brown et al., 2018).
However, grades have been shown to correlate to future academic success (Salvatori, 2001; Pascarella and Terenzini, 2005; Brookhart et al., 2016; Harris et al., 2020) and retention (Ost, 2010; Cromley et al., 2013; King, 2015). It is not necessarily clear if this correlation arises because passing grades are required for continued degree progress, or because of differences in learning. For example, in the health sciences grades do generally predict academic progress, but not clinical performance (Salvatori, 2001).
In summary, there is extensive debate about the purpose of grades, what they should include, what they should mean, and how much this actually manifests in practice. Regardless, our current reality is that course letter grades and the rates of D, F, or withdrawal grades (DWF rates) are commonly used assessment metrics that hold power. Students use them to make decisions about their major and career (Witherspoon et al., 2019). Selection committees use them to evaluate applicants. Institutions in the US often use grades and DWF rates to make planning decisions, identify courses in need of improvement, and/or evaluate instructors. Governmentally, the US National Assessment of Educational Progress regularly surveys high school course grades and GPAs as a method of characterizing national K-12 academic achievement (Nord et al., 2009).
It is also not uncommon for the literature to use letter grades and/or the rates of students earning passing or failing letter grades as a metric for evaluating pedagogical practices. For example, Lewis (2011) evaluates the Peer-Led Team Learning (PLTL) model by comparing the pass rates and ACS exam scores of courses using PLTL instruction and courses using ‘traditional’ instruction. Alzen et al. (2018) evaluate the Learning Assistant model by comparing the fail rates of students in courses that do and do not use Learning Assistants. Mack et al. (2019) examine 24 articles that conduct quantitative evaluations of instructional interventions, and find that pass/fail rates derived from letter grades are the second most commonly used metric, behind scores on instructor-authored exams. Throughout these studies, it is not uncommon for the research designs to compare across years and across instructors with no discussion of how grades are attributed. When there is discussion of how grades are attributed, it is typically done through reporting the assignment weights in the syllabus and it is unclear if authors checked for any deviations in practice. In these studies, grades are commonly triangulated through additional metrics such as exam scores. However, arguably, triangulation alone does not remove the value of discussing the variability of the evaluation metrics when possible.
Meta-analyses compare collections of articles like these to broadly evaluate categories of pedagogical practices. For example, Freeman et al. (2014) evaluate active learning pedagogies by performing a meta-analysis on 225 studies that compare exam scores and/or fail rates associated with active vs. traditional instructional practices. Theobald et al. (2020) evaluate the impact of active learning pedagogies on students from underrepresented groups through a meta-analysis of studies that include either exam scores (15 studies) or failure rates (26 studies). Walker and Warfa (2017) evaluate the impact of POGIL implementations via a meta-analysis of 21 studies that enable the comparison of effect sizes and/or pass/fail rates. These articles do not explicitly discuss the potential variability in grade attribution, or how the reader should weigh this possibility.
Thus in general, it is not uncommon for grade outcomes to be used to evaluate teaching practices. When this is done in education research, studies may use course policy statements such as the syllabus to establish how grades were determined. It can be unclear if the authors verified that course grades were being assigned in alignment with these policies, or if alignment with the policy is consistent between sections. In some cases this may be impossible to do so, particularly if the researchers are using institutional databases of archived grades. This article highlights a methodological reason for increased consideration and discussion of if course grades are determined in alignment with the stated policy, and if this alignment is consistent between sections. In Fall 2019, author N. M. J. implemented a pedagogical reform in one section of a large lecture format introductory chemistry course. A holistic evaluation of this reform effort has been reported (James and Ladue, 2021). This article focuses on an emergent observation encountered during this prior study, regarding section-to-section variability in student letter grades with the potential to conceal reform outcomes.
Research questions
This study emerged during the course of a prior study (James and Ladue, 2021). In the prior study, we collected syllabi, student grades on individual assignments, and letter grades from archived institutional data. The individual assignment data included entries for extra credit. Thus, we had the choice of comparing letter grades across sections based on: (a) students’ performance on individual assignments and the syllabus (“Syllabus” grade), (b) students performance on individual assignments, plus extra credit, and the syllabus (“Syllabus + EC” grade), (c) institutionally recorded grades (“Assigned” grade).This study emerged through us attempting to answer the questions:
(1) Is there a substantial difference in observed student outcomes, based on if we use the Syllabus, Syllabus + EC, or Assigned letter grade?
(2) If there are substantial differences, what are their potential implications?
Since these questions arose during the analysis of data collected for the prior study, they did not drive the experimental design and data collection. However, they are the questions that guide our analysis of this data.
Methods
This study was conducted at a high research activity (R2) university in the Midwestern United States and approved by the Northern Illinois University Institutional Review Board (#HS20-0052). Informed consent was solicited from both students and instructors. Instructors were informed of the scope of the study, detailing the data to be collected and that data would be de-identified but confidentiality could not be guaranteed. All instructors consented to these procedures. Students and instructors were notified that they could withdraw participation at any time.Prior study
This work evolved from a prior study assessing a pedagogical reform in an introductory chemistry course that historically has a high DWF rate (35–50%). Reform efforts were driven by a deliberate practice framework (Ericsson et al., 1993), which has been used in other STEM course interventions (Ericsson, 2008; Deslauriers et al., 2011; Hobbs et al., 2013; Hodges et al., 2017). In addition to the reformed section (Section R, taught by author N. M. J.), there were two concurrent unreformed comparison sections (Sections UA and UB), taught by different instructors. Our prior publication (James and Ladue, 2021) examines the course reform through course observations, course artifacts, student pre/post surveys, individual student assessment grades, and institutional grades assigned at the end of the term. Grade data was conveyed by adding N. M. J. to the course learning management system (LMS). All sections maintained their official grade records in the course LMS.Present study
This study involves the course syllabi and grade-related components collected as part of the prior study. The Syllabus and Syllabus + EC grades were calculated according to this grade data and the grading schemes outlined by each course syllabus. Assigned course grades were obtained through institutional request. Plus and minus designations are not recorded at this institution. The institution and department do not have a standard DWF target, or standard curve to normalize grade distributions.This study occurs in a department that establishes a required grading scheme. All course sections state letter-grade cut-offs in their syllabus that are in alignment with the required scheme (≥90.0% A, 89.9–80.0% B, 79.9–70.0% C, 69.9–60.0% D, <60.0% F). The required scheme's assessment weights detail 300 points for mid-term exams, 100 points for the final exam, and 100 points for “homework/participation.” There were two categories of homework assigned to students: (1) problem sets, and (2) reading assignments with associated questions. Section UA implemented this as 100 points for each problem sets and reading assignments (600 course points total). Section UB implemented this as 100 points combined (500 course points total). This introduces a slight difference in the relative weights in Sections UA and UB. As a pilot course reform, Section R received an exemption from the required weights. Section R attributed 36% of course points to exams, 15% to the final exam, and 49% to problem sets and reading assignments.
Because of this inconsistency in grading schemes, we considered each section's course grades based on that sections’ syllabus. In this way, each section is being evaluated relative to their own grading scheme. What we compare between sections is the degree to which adjustments to these grades are made as a result of extra credit offerings and end-of-term grade adjustments.
Sample sizes for Sections R, UA, and UB are 121, 171, and 82 respectively, including withdrawals. Data was analyzed in Python 3.7.4, using the numpy, scipy, and pandas packages. Data was visualised in Python 3.7.4 using the matplotlib.pyplot, seaborn, and plotly packages.
Results
Student course grades were calculated using student scores on individual assessments and the grade scheme and letter cut-offs described in each section's syllabus (“Syllabus” grades). All sections administered pre/post surveys worth a small amount of extra credit. This is the only extra credit offered by Section R, and it constitutes up to 0.8% of the overall course grade. Sections UA and UB offered additional extra credit constituting up to 4.37% and 7.40% of the course grade, respectively. Since this is an emergent observation, we did not anticipate the need to capture how and why extra credit was offered. However, from the grade column listings in the course LMS, it appears that Section UA's additional extra credit was awarded for completing practice exams. In Section UB, it appears the additional extra credit was awarded for attending optional Supplemental Instruction sessions that occurred on evenings and weekends.As shown in Fig. 1, taking extra credit into consideration (Syllabus + EC) substantially changes student letter grades in the unreformed sections: in Sections UA and UB, 30 students (19.6%) and 21 students (26.6%) see their letter grade change as a result of extra credit, respectively. However, in the reformed Section R, extra credit changes the letter grades of 2 students (1.7%).
 | ||
| Fig. 1 Student letter grade variation in each section, across conditions: (1) as outlined by the section's syllabus grading information (“Syllabus”, first column of each panel); (2) The syllabus grade, with extra credit taken into account (“Syllabus + EC”); (3) the institutionally-reported letter grade (“Assigned”). In these Sankey diagrams, the vertical height of each bar corresponds to the fraction of students within that category (i.e., earning that letter grade based on the grade conditions listed along the top). The height of the connectors depicts what fraction of these students have their letter grade change or remain the same, as a result of moving between grade conditions. | ||
At the end of the term, instructors assign a letter grade (Assigned grade). Assigned grades are what appears on transcripts and in institutional records. Fig. 1 shows the extent to which instructors make end-of-term, “post hoc” adjustments after extra credit, before submitting Assigned grades. In Sections UA and UB, post hoc adjustments result in letter grade changes for 39 students (25.5%) and 28 students (35.4%), respectively. In Section R, 5 students (4.3%) see their letter grades change as a result of post hoc adjustments. Letter grade changes primarily shift students up one unit (e.g., from C to B), however in both unreformed sections one student's letter grade decreases (B to C). In Section UB, one student climbs two letter grades (D to B).
Due to the emergent nature of this study, we are unable to identify the mechanism or reasoning for why these adjustments—or their exceptions—occurred. We do not intend to make a value judgement of these practices, and we fully respect instructor authority over determining course grades. There could be many explanations for these results. One possibility is that the extra credit offerings and post hoc adjustments emerged as a way for instructors to correct the assigned grades and provide a more accurate reflection of student learning. The instructor is the individual most qualified to speak to student learning. However, this work did not anticipate the need to capture instructor reasoning. In lieu of this, we examined if any collected evidence did indicate the possibility for obvious differences in student learning that coincide with increased extra credit offerings or post hoc adjustments. We consider two findings detailed in the reform evaluation study (James and Ladue, 2021): (1) the mean difference in difficulty index on shared exam items (Fig. 2A), and (2) a rescaled numerical course grade that weights all assessments (homework, exams, final) equally between sections (Fig. 2B). Difficulty index is the fraction of students in the course that correctly answer the item. Sections UA and R shared 39 exam items across all exams including the cumulative final; Sections UB and R shared 7 exam items, all of which were on the cumulative final exam. The mean difference in difficulty index for R-UB and R-UA are both >0, indicating that a higher fraction of students in the reformed section correctly answer these shared items. The rescaled course grade standardizes the weights of assessments that were included in all sections (exams, final exam, problem sets, weighted to 63.33%, 23.33%, 13.33%, respectively). All possible weight combinations were considered and yield the same trend: students in the reformed section earn a higher total course grade (see James and Ladue, 2021).
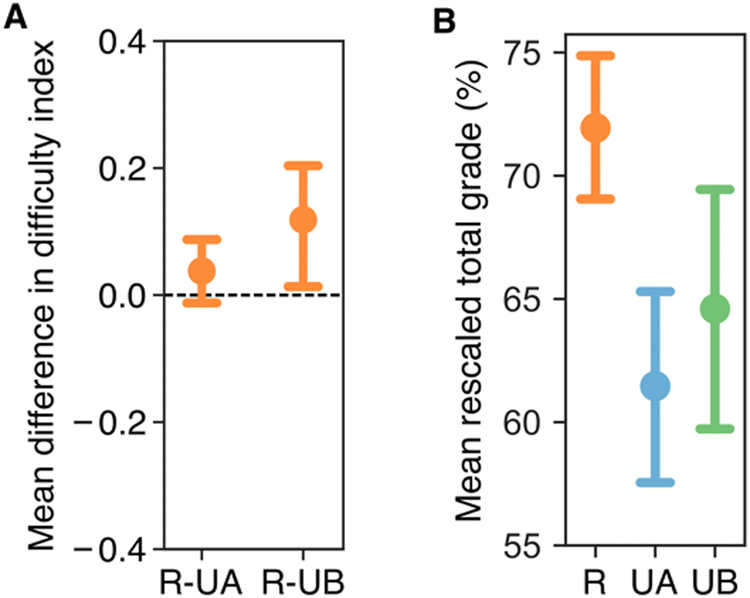 | ||
| Fig. 2 Assessment performance comparisons between course sections. (A) Shared exam items, and (B) the total numerical course grade, rescaled such that all sections have the same assessment weights (extra credit is excluded). Error bars indicate 95% confidence intervals. Reprinted (adapted) with permission from James and LaDue (2021). Copyright 2021, American Chemical Society. | ||
There is substantial variability between sections in terms of what numerical percentage Syllabus + EC grades students must earn to receive a post hoc grade adjustment (see Fig. 3). In effect, this manifests as courses using different grade cut-offs. In Section R, all students within 1% of the A and B letter grade cutoffs were assigned the higher grade. This resulted in 5 total post hoc grade adjustments.
 | ||
| Fig. 3 Relationship between students’ numerical, percentage Syllabus + EC grade, and post hoc grade adjustments granted, for each section. Vertical dashed lines are a guide to the eye of where the syllabus' grade scale cut-offs are (listed on the top of the figure). | ||
In Section UA, all students with a Syllabus + EC grade ≥87.2% were assigned an A, resulting in 9 post hoc B-to-A grade adjustments. Similar affects are seen at the other grade boundaries, essentially re-assigning letter grade cutoffs to be: ≥87.2% A, 87.1–77.0% B, 76.9–67.8% C, 67.7–54.9% D, <54.9% F. The one exception to this is a student earning a grade of 83.8% who was assigned a C for reasons uncaptured by this study.
Post hoc grade adjustments in Section UB show a similar but inconsistent adjustment of letter grade cut-offs (Table 1). All students with a Syllabus + EC grade ≥86.7% were awarded an A, with the exception of one student with a Syllabus + EC grade of 87.6% who is assigned a B. At the B-C grade cutoff, students earning Syllabus + EC grades in the range 86.6–77.2% are assigned B grades, with two exceptions (Syllabus + EC = 80.2%, assigned C; Syllabus + EC = 64.6%, assigned B). Similar occurrences, and similar inconsistencies, are seen at the C–D and D–F cutoffs as well. Students in the range 77.1–63.8% are assigned a C, with two exceptions (Syllabus + EC = 64.6%, and the previously mentioned Syllabus + EC = 64.6% that was assigned a B). Without exceptions, students with grades in the range 63.7–29.4% are assigned a D, and students earning <29.4% are assigned an F.
| Letter grade | Section R (%) | Section UA (%) | Section UB (%) |
|---|---|---|---|
| A | ≥89.1 | ≥87.2 | ≥86.7 |
| B | 89.0–79.0 | 87.1–77.0 | 86.6–77.2 |
| C | 78.9–70.0 | 76.9–67.8 | 77.1–63.8 |
| D | 69.9–60.0 | 67.7–54.9 | 63.7–29.4 |
| F | <59.9 | <54.9 | <29.3 |
We again emphasize that we do not intend to make value judgements about these phenomena, and fully acknowledge that many factors may reasonably influence instructor decisions. All instructors indicated that the course LMS, from which these data were obtained, was the official grade record. Thus, to the best of our ability we present here the full grade data regarding the course. However, it is possible instructors incorporate other impressions of student learning into grade determination. Additionally, some deviations may be the result of grading errors, students submitting incomplete work not recorded in the LMS, or other influences.
Within the scope of this study, what the captured data show is that these three sections are, in effect, adopting grade cut-offs distinct from those reported in the syllabus (see Table 1). Overall, this change of grade cutoff affects 5 Students in Section R (4.3%), 39 students in Section UA (25.5%), and 28 students in Section UB (35.0%). Section R's effective grading cut-offs most closely follow the departmentally-established grading scheme's cut-offs (see Methods), with Sections UA and UB adjusting cut-offs progressively further from the department standard.
Extra credit and post hoc grade adjustments alter students’ letter grades, and thus also affect the course DWF rates. Section R did not involve any letter grade changes for students earning D and F grades, and thus Section R's DWF rate is constant across all grade conditions (see Table 2). However, in Sections UA and UB, the DWF rate drops 4–6 percentage points due to extra credit, and drops and additional 4–8 percentage points due to post hoc adjustments.
| Grade condition | Section R | Section UA | Section UB |
|---|---|---|---|
| Syllabus grade | 33.9 | 53.2 | 46.3 |
| Syllabus + EC | 33.9 | 49.1 | 43.9 |
| Assigned grade | 33.9 | 45.6 | 35.4 |
Discussion
This observation emerged unexpectedly from a study designed to assess the impact of the course reform in Section R, and consequently we did not capture data that would provide insight on how or why instructors offered extra credit or made post hoc adjustments. Our goal is not to speculate on instructor intent or critique instructors for their decisions. We fully respect instructors' autonomy over course grades, as instructors are the individuals most knowledgeable about students’ context, learning, and abilities. Our goal is to discuss the implications of using letter grades as research metrics or for institutional teaching assessments, in light of variation in how different sections may offer extra credit or make post hoc grade adjustments.In a department with an established grading structure, we observe three different sections of the same introductory chemistry course to offer substantially different amounts of extra credit, and make post hoc adjustments to letter grades to differing extents. In Section R, very few students’ (<5%) letter grades improve as a result of extra credit or post hoc grade adjustments. In contrast, in Sections UA and UB extra credit and post hoc grade adjustments change the letter grades of 19.6–35.4% of students. Thus, across sections, the recorded institutional grade is not a consistent measure of the grades earned through the structure communicated by the course syllabus. This calls into question what it means to compare Section R's institutionally assigned grades to those in Sections UA and UB, as is often done by institutions and studies assessing course reforms or pedagogical practices.
Post hoc adjustments create substantial variation in how many course points a student must earn to receive a particular letter grade. For example, students in Section UB who earned anywhere from 29–64% of all possible course points (with extra credit) were assigned a D. In Section UA, all students assigned a D earned ≥53% of all possible course points. In Section R, all students assigned a D earned ≥62% of all possible course points (with extra credit). While this is most stark at the lower end of the grade scale, structural similarities occur at all the other grade cutoffs as well. These large inconsistencies have the potential to overwhelm systematic trends between sections and bias conclusions drawn from comparing the sections’ institutional grade. In our case, using institutional grades to assess the course reform may conceal the impact of the course reform.
We also observe some cases that motivate future investigation into the extent of grade consistency. In Section UB, one student earned 63.82% of course points and was institutionally assigned a C, but another student earned 64.56% and was assigned a D. This is not an isolated case: similar instances occur at the C-to-B and B-to-A boundaries. Unfortunately, this study did not capture insight into how or why these grade decisions were made. There may exist a reasonable explanation for these occurrences. However, based on our available data it does not appear that these grade adjustments result from a straightforward curve or change in cut-offs. We hope to motivate future studies to explore how common such occurrences are and the associated rationale or potential equity impacts.
When used as an assessment metric, letter grades are often reduced to a single value: the DWF rate, or the fail rate. Here we find that DWF rates are no more robust to these effects than the letter grades they are derived from. If a researcher were to examine the efficacy of this course reform by comparing the DWF rate in Section R to Section UB, they would find the difference (ΔDWF, UB-R) to be 12.5% if they were using the Syllabus grade. Researchers or pracitioners might use this as evidence that the course reform benefits students and/or merits sustained effort. However, if the researcher did not collect the data to allow them to calculate the Syllabus grade, and rather based their analysis on the institutional Assigned grade, ΔDWF would be only 1.5%. This could conceal the perceived impact of the reform and may result in beneficial reform efforts being abandoned or undersupported. A similar trend is seen when comparing Section R to Section UA, ΔDWF drops from 19.3% to 11.7% depending on if the comparison is made using the Syllabus or Assigned grade. This raises the question: which grade should one use for these comparisons?
It is possible that extra credit and post hoc adjustments are “correcting” for perceived inaccuracies in the assessments’ measurement of student learning. For example, an instructor might adjust grades because they believe an exam under-reports the students’ true learning. Our study limitations preclude us from definitively addressing this question. We cannot rule out that instructors may have other insight into student learning that they are using when e.g. making post hoc adjustments. However, these decisions do not obviously connect to student learning as demonstrated in submitted course assessments and shared exam items (Fig. 2). This does not necessarily mean these adjustments are not founded in students’ learning, but it might motivate scholarly examination of course assessment structures.
Based on the data available to us, it appears that institutionally assigned grades diminish the perceived impact of the course reform to the extent it could be effectively undetectable, despite other evidence that student performance was improved in the reform section. Again, we emphasize the limitations of our study and do not wish to make assumptions about how or why these adjustments were made, or make value judgements. We do not intend to prescribe what instructors should or should not do. Rather, we wish to raise discussion of these implications to the education research literature.
To speculate, it is possible that instructors piloting course reforms may be reluctant to offer extra credit or make post hoc adjustments for fear of biasing reform assessments. Instructors of unreformed courses used as comparison groups may not weigh this consideration as highly when they make these decisions. In such a case, assigned grades and DWF rates might systematically benefit comparison group sections, as seen here. This study examines only one course section at one school, but if this result is more widespread, that would suggest institutional grades under-report the outcomes of course reforms. Prior work has established that effect sizes associated with course reforms are highly variable (Association for the Advancement of Science, 2011; Rahman and Lewis, 2020). Section-to-section variability in extra credit offerings could possibly contribute to or exacerbate variance observed in studies using numerical course grades as comparison metrics.
The impact of EC offerings and post hoc adjustments on students’ assigned grades also raises potential concerns about classroom equity. How are these decisions being made? What are the equity implications? In Section UB, it appears that extra credit is awarded for attendance in Supplemental Instruction meetings that occur during evenings and weekends. Out-of-class events like Supplemental Instruction, office hours, or seminars may not be accessible to all students, particularly those who work or have child-care obligations. We emphatically acknowledge that instructors must respond to students in-the-moment, within a variety of constraints, and our goal is not to pass value judgements or critique instructors for any of these decisions. Rather, we mention the potential for EC and post hoc grade adjustments to have unintended equity implications in order to encourage further study. We would argue that such studies should partner with instructors, leveraging our shared goal of equitably supporting students, in order to identify, understand, and address any underlying structural issues that might motivate substantial use of EC and post hoc adjustments.
Limitations
This study has several important limitations resulting from its emergent nature. We captured grade data from the course LMSs because instructors communicated to the researcher that the LMS was the official grade record for the course. If there were exceptional cases of grade alterations (e.g. dropping an extra exam, or end-of-term corrections) that occurred off of the course LMS, we would be unable to resolve that mechanism. In such a case, the grade change would manifest as a post hoc grade adjustment.Additionally, because we did not anticipate extra-credit offerings or post hoc course adjustments, we did not directly capture how or why these occurred. The lack of insight into the rationale behind these practices leaves us with many questions and severely limits our ability to interpret these findings or make recommendations based on their implications. We do not wish to critique or criticize the instructors of these sections, and we fully respect instructors’ autonomy over determining course grades. We recognize that the instructors are the ones best informed about student learning and abilities, and do not believe researchers should prescribe how instructors assign grades. We think there are many plausible contexts in which these adjustments are appropriate and convey positive consequences, but we also highlight the potential for unintended negative consequences. The scope of this article is limited to reporting this emergent finding that we encountered, with the aim of motivating further studies to investigate these questions that we cannot answer.
Conclusions
In conclusion, this article describes an introductory chemistry course with a standardized, department-mandated syllabus and grading policy. However, different course sections offer different amounts of extra credit, resulting in substantial letter grade changes for some students. Furthermore, different sections adjust end-of-term grades to different extents. The differential nature of these adjustments across sections can present additional variability in comparing institutional course grades between sections. In this case, it appears to conceal the perceived impact a course reform has on improving student performance.There has long been scholarly discussion about the meaningfulness of using student grades as a measure of student outcomes. This work highlights an additional limitation that has not been well acknowledged in the chemistry education literature: if the grades determined in the manner articulated by the syllabus are meaningful measures, differential extra credit and post hoc course adjustments might obfuscate that meaning, particularly in cross-sectional comparisons. We hope this serves to catalyze further research about the extent, rationale, and repercussions of these practices. Meanwhile, we suggest that studies using grades as a comparison metric might consider capturing and including evidence that grades are awarded in alignment with course policies as communicated in syllabi. This might be accomplished by collecting data that allows the calculation of a standardized grade. This may not always be possible, particularly for studies using institutional databases of archived data. In such a case, we suggest explicit discussion of potential grade variability and any corresponding limitations that might introduce. We believe awareness of this potential variability in grades is relevant to practitioners reviewing the literature, to institutional administrators using grades and DWF rates to inform decision-making, and to selection committees using grades to make decisions about applicant admission and awards.
In addition to raising awareness about potential variability in grades that impact their use as a cross-sectional assessment metric, we hope this work will motivate future study. We argue that it is particularly important to examine how widespread the phenomena observed here is, and what the typical motivations are. We hope future work will examine these questions in partnership with instructors. We also note the importance of these studies adopting an equity lens, as the opacity of extra credit offerings and post hoc adjustments has the potential to inadvertently create or exacerbate course inequities.
Conflicts of interest
There are no conflicts to declare.Acknowledgements
N. M. J. would like to thank Nicole D. LaDue, Jack Barbera, and Ryan Stowe for helpful discussions. Jessica Karch is thanked for essential encouragement. N. M. J. acknowledges financial support from the Northern Illinois University Office of Academic Diversity, Equity, and Inclusion and the Division of Research and Innovation Partnerships.References
- Allen, J. D., (2005), Grades as Valid Measures of Academic Achievement of Classroom Learning, Clearing House: J. Educ. Strategies, Issues Ideas, 78(5), 218–223 DOI:10.3200/tchs.78.5.218-223.
- Alzen J. L., Langdon L. S. and Otero V. K., (2018), A logistic regression investigation of the relationship between the Learning Assistant model and failure rates in introductory STEM courses, Int. J. STEM Educ., 5, 56 DOI:10.1186/s40594-018-0152-1.
- Association for the Advancement of Science, (2011), Impact of Undergraduate Science Course Innovations on Learning, Science, 331, 1269–1270 DOI:10.1126/science.1198976.
- Blum S. D. (ed.), (2020), Ungrading: Why Rating Students Undermines Learning (and What to Do Instead), United States of America, West Virginia: University Press.
- Bowen R. S. and Cooper M. M., (2022), Grading on a Curve as a Systemic Issue of Equity in Chemistry Education, J. Chem. Educ., 99(1), 185–194 DOI:10.1021/acs.jchemed.1c00369.
- Bowers A. J., (2019), Towards Measures of Different and Useful Aspects of Schooling, in Brookhart, S. M. and McMillan, J. H. (ed.), Classroom Assessment and Educational Measurement, New York, NY: Routledge, pp. 209–223.
- Brookhart S. M., (1990), Grading Practices and Validity, Educ. Meas.: Issues Pract., 10(1), 35–36.
- Brookhart S. M. et al., (2016), A Century of Grading Research: Meaning and Value in the Most Common Educational Measure, Rev. Educ. Res., 86(4), 803–848 DOI:10.3102/0034654316672069.
- Brown A. V., Plonsky L. and Teimouri Y., (2018), The use of course grades as metrics in L2 research: A systematic review, Foreign Lang. Ann., 51(4), 763–778 DOI:10.1111/flan.12370.
- Cromley J. G. et al., (2013), Changes in race and sex stereotype threat among diverse STEM students: Relation to grades and retention in the majors, Contemp. Educ. Psychol., 38(3), 247–258 DOI:10.1016/j.cedpsych.2013.04.003.
- Deslauriers L., Schelew E. and Wieman C., (2011), Improved Learning in a Large-Enrollment Physics Class, Science, 332, 862–864 DOI:10.1126/science.1202043.
- Elbow P. and Danielewicz J., (2008), A unilateral grading contract to improve learning and teaching, Coll. Compos. Commun., 3, 1–25.
- Ericsson K. A., (2008), Deliberate practice and acquisition of expert performance: A general overview, Acad. Emerg. Med., 15(11), 988–994 DOI:10.1111/j.1553-2712.2008.00227.x.
- Ericsson K. A., Krampe R. T. and Tesch-Römer C., (1993), The role of deliberate practice in the acquisition of expert performance, Psychol. Rev., 100(3), 363–406 DOI:10.1037/0033-295X.100.3.363.
- Freeman S. et al., (2014), Active learning increases student performance in science, engineering, and mathematics, Proc. Natl. Acad. Sci. U. S. A., 111(23), 8410–8415 DOI:10.1073/pnas.1319030111.
- Guskey T. R., (2006), Making High School Grades Meaningful, Phi Delta Kappan, 87(9), 670–675.
- Guskey T. R. and Link L. J., (2018), Exploring the factors teachers consider in determining students’ grades, Assess. Educ., 303–320 DOI:10.1080/0969594X.2018.1555515.
- Harris R. B. et al., (2020), Reducing achievement gaps in undergraduate general chemistry could lift underrepresented students into a “hyperpersistent zone”, Sci. Adv., 6, 1–8 DOI:10.1126/sciadv.aaz5687.
- Herridge M. and Talanquer V., (2020), Dimensions of Variation in Chemistry Instructors’ Approaches to the Evaluation and Grading of Student Responses, J. Chem. Educ., 98(2), 270–280 DOI:10.1021/acs.jchemed.0c00944.
- Hobbs F. C., Johnson D. J. and Kearns K. D., (2013), A Deliberate Practice Approach to Teaching Phylogenetic Analysis, Life Sciences Education, 12, 676–686 DOI:10.1187/cbe-13-03-0046.
- Hodges L. C. et al., (2017), Using Clickers for Deliberate Practice in Five Large Science Courses, J. Coll. Sci. Teach., 47(2), 22–28.
- James N. M. and Ladue N. D., (2021), Pedagogical Reform in an Introductory Chemistry Course and the Importance of Curricular Alignment, J. Chem. Educ., 98(11), 3421–3430 DOI:10.1021/acs.jchemed.1c00688.
- King B., (2015), Changing College Majors: Does It Happen More in STEM and Do Grades Matter? J. Coll. Sci. Teach., 44(3), 44–51.
- Lewis S. E., (2011), Retention and Reform: An Evaluation of Peer-Led Team Learning, J. Chem. Educ., 88, 703–707 DOI:10.1021/ed100689m.
- Lipnevich A. A. et al., (2020), What do grades mean? Variation in grading criteria in American college and university courses, Assess. Educ., 27(5), 480–500 DOI:10.1080/0969594X.2020.1799190.
- Mack M. R., Hensen C. and Barbera J., (2019), Metrics and Methods Used To Compare Student Performance Data in Chemistry Education Research Articles, J. Chem. Educ., 96, 401–413 DOI:10.1021/acs.jchemed.8b00713.
- Maki P. L., (2004), Assessing for Learning, Sterling, Virginia: Stylus Publishing, LLC.
- Nord et al., (2009), The Nation's Report Card: America's High School Graduates (NCES 2011-462), Washington, D.C.: U.S. Government Printing Office.
- Novak J. D., (1977), A theory of education, Cornell University Press (Cornell paperbacks).
- Ost B., (2010), The role of peers and grades in determining major persistence in the sciences, Econ. Educ. Rev., 29(6), 923–934 DOI:10.1016/j.econedurev.2010.06.011.
- Pascarella E. and Terenzini P., (2005), How College Affects Students: A Third Decade of Research, San Fransisco, CA: Jossey-Bass.
- Rahman T. and Lewis S. E., (2020), Evaluating the evidence base for evidence-based instructional practices in chemistry through meta-analysis, J. Res. Sci. Teach., 57(5), 765–793 DOI:10.1002/tea.21610.
- Rosenthal L. J., (2004), Outcomes Assessment, the Public Research University, and the Humanities, Assess. Learn., 153–166.
- Salvatori P., (2001), Reliability and Validity of Admissions Tools Used to Select Students for the Health Professions, Adv. Health Sci. Educ., 6(2), 159–175 DOI:10.1023/A:1011489618208.
- Schinske J. and Tanner K., (2014), Feature Approaches to Biology Teaching and Learning Teaching More by Grading Less (or Differently), CBE—Life Sci. Educ., 13, 159–166 DOI:10.1187/cbe.cbe-14-03-0054.
- Schwab K., Moseley B. and Dustin D., (2018), Grading Grades as a Measure of Student Learning, SCHOLE: J. Leisure Stud. Recreation Educ., 33(2), 87–95 DOI:10.1080/1937156x.2018.1513276.
- Sinatra G. M., (2010), Educational Psychologist The “Warming Trend” in Conceptual Change Research: The Legacy of Paul R. Pintrich, Educ. Psychol., 40(2), 107–115 DOI:10.1207/s15326985ep4002_5.
- Theobald E. J. et al., (2020), Active learning narrows achievement gaps for underrepresented students in undergraduate science, technology, engineering, and math, Proc. Natl. Acad. Sci. U. S. A., 117(12), 6476–6483 DOI:10.1073/pnas.1916903117.
- Tocci C., (2010), An immanent machine: Reconsidering grades, historical and present, Educ. Philosophy Theory, 42(7), 762–778 DOI:10.1111/j.1469-5812.2008.00440.x.
- Walker L. and Warfa A. R. M., (2017), Process oriented guided inquiry learning (POGIL®) marginally effects student achievement measures but substantially increases the odds of passing a course, PLoS One, 12(10), 1–17 DOI:10.1371/journal.pone.0186203.
- Witherspoon E. B., Vincent-Ruz P. and Schunn C. D., (2019), When Making the Grade Isn’t Enough: The Gendered Nature of Premed Science Course Attrition, Educ. Res., 48(4), 193–204 DOI:10.3102/0013189X19840331.
| This journal is © The Royal Society of Chemistry 2023 |