 Open Access Article
Creative Commons Attribution 3.0 Unported Licence
Efficient degassing and ppm-level oxygen monitoring flow chemistry system†
Paulius
Baronas
 a,
Jacob Lynge
Elholm
 a and
Kasper
Moth-Poulsen
 *abcd
*abcd
aThe Institute of Materials Science of Barcelona, ICMAB-CSIC, Bellaterra, 08193 Barcelona, Spain
bCatalan Institution for Research & Advanced Studies, ICREA, Pg. Lluís Companys 23, 08010 Barcelona, Spain
cChalmers University of Technology, Department of Chemistry and Chemical Engineering, SE-412 96 Gothenburg, Sweden
dDepartment of Chemical Engineering, Universitat Politècnica de Catalunya, EEBE, Eduard Maristany 10-14, 08019 Barcelona, Spain. E-mail: kasper.moth-poulsen@upc.edu; Web: https://www.moth-poulsen.com
First published on 28th April 2023
Abstract
Low oxygen levels are critical for a long range of chemical transformations carried out in both flow and batch chemistry. Here, we present an inline continuous flow degassing system based on a gas-permeable membrane inside a vacuum chamber for achieving and monitoring ppm-level oxygen concentrations in solutions. The oxygen presence was monitored with a molecular oxygen probe and a continuously running UV-vis spectrometer. An automated setup for discovering optimal reaction conditions for minimal oxygen presence was devised. The parameters tested were: flow rate, vacuum pressure, solvent back-pressure, tube material, tube length and solvent oxygen solubility. The inline degassing system was proven to be effective in removing up to 99.9% of ambient oxygen from solvents at a flow rate of 300 μl min−1 and 4 mbar vacuum pressure inside the degassing chamber. Reaching lower oxygen concentrations was limited by gas permeation in the tubing following the degassing unit, which could be addressed by purging large volume flow reactors with an inert gas after degassing or by using tubing with lower gas permeability, such as stainless steel tubing. Among all factors, oxygen solubility in solvents was found to play a significant role in achieving efficient degassing of solvents. The data presented here can be used to choose optimal experimental parameters for oxygen-sensitive reactions in flow chemistry reaction setups. The data were also fitted to an analytically derived model from simple differential equations in physical context of the experiment.
1 Introduction
Recent advances in continuous-flow systems show their large potential in the automation of chemistry and chemical analyses.1–8 By utilising continuous-flow platforms, computer-assisted screening of the photophysical properties of molecular probes can significantly accelerate reaction discovery.9–11 This shows the importance of developing continuous-flow analogues of experimental techniques that are currently used in regular batch processing.High oxygen reactivity and its concentrations in ambient air require measures to degas solvents and solutions for some chemical reactions or to degas samples for spectroscopic characterisation. Reducing oxygen contents in sensitive reactions, such as metal-mediated cross-coupling, could offer substantial material savings as well as change the outcome of reactions.12,13 Similarly, the characterisation of organic molecules whose emission efficiency relies on triplet energy levels requires degassing to remove oxygen that acts as a triplet energy quencher.14 While there are multiple methods to achieve ppm-level oxygen concentrations in batch processing e.g. inertisation manifolds, inert gas purging or freeze–pump–thaw techniques, inline oxygen removal in continuous-flow systems can be more challenging.
Oxygen removal in flow can be based on oxygen-scavenging or membrane-based degassing systems. Micro-scale oxygen degassing chips produced from oxygen-scavenging polymers have been shown to reduce oxygen concentrations down to 0.4% (removing 99.8% of ambient oxygen) in passing solutions.14,15 Unfortunately, oxygen-scavenging microchips are not ideal for the microliter to milliliter volume scales that most flow chemistry and analysis systems are operating at. In such flow systems, degassing as well as gas–liquid mixing can be achieved by using membranes with high gas permeabilities. For example, Teflon AF-2400 has an oxygen permeability of 960 barrers, which is hundreds of times higher than that of other typical fluoropolymers.16 Therefore, the Teflon AF-2400 polymer is a popular choice of material to introduce gases in tube-in-tube reactors.17–29 Similarly, Teflon AF-2400 membrane reactors can also be used for the degassing of a solution, where the oxygen concentration is regulated by the vacuum level in the degassing chamber and the flow rate of the liquid.30
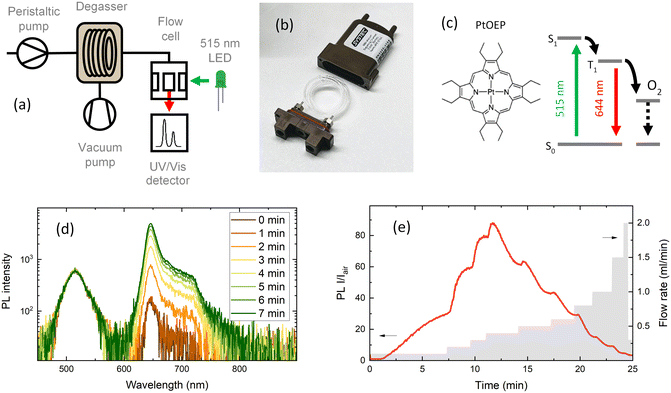
In this paper, we present a flow chemistry-based automated setup for discovering optimal conditions (i.e. flow rate, vacuum pressure, solvent gas solubility) for minimal oxygen concentration. The oxygen concentration was monitored using the photoluminescence (PL) quenching of an oxygen-sensitive molecular probe. Fig. 1a shows the scheme used to degas and monitor the oxygen concentration in solution. Inline oxygen removal was performed by using a commercial mini degassing unit with gas permeable tubing (Fig. 1b), which is generally used to remove air bubbles for improving HPLC instrument accuracy. The system is designed to operate at a pressure of 60 mbar; however, as we show here, the degassing unit showed reliable performance for oxygen removal at lower than recommended vacuum pressures. Under optimised conditions, this technique allowed us to achieve a level of oxygen below the ppm level (removing up to 99.9% of the molecular oxygen) present in the solution exposed to atmospheric air. The degassing setup was thoroughly tested to find the optimal parameters for reducing the oxygen level. The parameters tested were: flow rate, vacuum pressure, tube material and tube length. Different tube materials have different gas permeabilities,16 which impact the reabsorption of atmospheric gases in the tubes between the degassing unit and the PL flow cell. Investigating the flow rate impact showed two opposite effects. With slower flow rates, the residence time of the solution within the tube increases, and therefore the reintroduction of atmospheric gases increases. To limit the reintroduction of gases, the residence time within the tube should be as short as possible to keep the oxygen concentration as low as possible. However, the degassing efficiency within the mini vacuum unit increases with longer residence times, that is, with slower flow rates. The task is then to find the optimal flow rate that satisfies a long enough residence time for degassing and a short enough residence time to limit the reabsorption of gases.
2 Experimental setup
A molecular oxygen probe platinum(II) octaethylporphyrin (PtOEP) was purchased from Sigma-Aldrich and used as received. Tubes of perfluoroalkoxy alkanes (PFAs) and Tefzel™ ethylene tetrafluoroethylene (ETFE) were purchased from IDEX. Tubing pieces of 0.04′′ (1 mm) internal diameter (I.D.) and 1/16′′ (1.56 mm) external diameter (O.D.) were used in all experiments. A mini degassing unit with a 925 μl internal tube volume (Fig. 1b) was purchased from IDEX. The dimensions of the Teflon AF-2400 tubing inside the degassing unit were 0.04′′ I.D. and 1/16′′ O.D. A simplified scheme of the flow setup and fluorescence detection system is shown in Fig. 1a. The liquid flow in the system was provided by peristaltic pumps (Vapourtec V-3) integrated into a flow chemistry module (Vapourtec R-Series). An absolute vacuum pressure inside the degassing chamber in the range of 4 to 60 mbar of atmospheric air was achieved with a membrane vacuum pump (Buchi V-300) and monitored with an evaporation system (Buchi Rotavapor R-300). A minimum of 0.5 mbar pressure inside the degassing chamber was reached using a dual-stage rotary vane mechanical vacuum pump (Edwards RV3). The vacuum pressure was measured with an electronic vacuum gauge (Vacuubrand Vacuu-View extended). The fluorescence signal was measured in flow through a fluorescence cell with an internal volume of 100 μl (Starna Cells Type 583F). The flow cell was placed in a sample holder with fiber coupling (Avantes CUV-ALL/UV/VIS). A 515 nm LED light source (Thorlabs M530L4) coupled to a 400 μm optical fiber (Avantes FC-UVIR400) was used for excitation. The fluorescence was detected with a UV-vis spectrometer (Avantes AvaSpec-ULS2048CL-EVO-RS-UA). The high detection sensitivity needed for weak emission was achieved by placing a 200 μm slit and using a 400 μm optical fiber. A 10 ml stainless steel reactor with 1 mm I.D. tubing was purchased from Vapourtec. A commercial oxygen gas sensor (MBRAUN MB-OX-SE1) connected to a glovebox system was used to calibrate the oxygen concentration in the degassed solution. A Python program was written to control the flow rates of a set of Vapourtec pumps and the detection of the fluorescence signal from the Avantes spectrometer using the OPC-UA standard and Python API examples provided by the manufacturer. The code repository can be found here (https://github.com/Elholm/KMP-Group).3 Results and discussion
3.1 Photoluminescence quenching-based oxygen concentration measurements
Among the methods to determine oxygen levels, optical sensing is advantageous due to the possibility of remote sensing.31 The majority of commercial optical oxygen sensors are based on the measurement of PL quenching of a molecular probe by oxygen. Here, the probe material is in a solution, which is excited with LED light and emits a red-shifted PL with an intensity inversely proportional to the oxygen concentration. One of the most explored classes of materials for oxygen probes is metal–ligand complexes. The long excited state lifetime of metal–ligand complexes extends the limits of oxygen detection, resulting in PL ratios extending over several orders of magnitude when compared to those under hypoxic and oxygen-saturated conditions. In this work, PtOEP was selected as the oxygen sensing probe, which shows a broad absorption band in the 470–550 nm region and a significantly red-shifted emission centered at 644 nm (Fig. 1c and d). In PtOEP, the excitation of the singlet state S1 is followed by ultrafast intersystem crossing, where phosphorescence occurs from the lowest triplet state T1.32 In an oxygen-saturated environment, phosphorescence quenching is induced by energy transfer from the triplet state to molecular oxygen. This results in a low phosphorescence quantum yield when the PtOEP solution is exposed to ambient air and a significant increase in emission intensity upon degassing of the solution. Bansal et al. reported the phosphorescence quantum yield in an air-saturated PtOEP toluene solution to be 0.125% which increased up to 40.15% after 2 hours of ultrapure nitrogen gas purging, resulting in an increase in PL intensity of 320 times.32The oxygen content in a degassed PtOEP solution was quantified by the Stern–Volmer equation that describes the quenching process in a homogeneous system:33,34
 | (1) |
Here, I0/I is the ratio of PL intensities in the absence of O2 (I) and at oxygen concentration x[O2] (I0), and KSV is the Stern–Volmer constant. The ratio I0/Iair was measured by degassing the PtOEP solution in a glovebox with a known O2 concentration of 2.4 ppm and comparing its PL intensity to that of an air-saturated sample where an ambient oxygen level of 20.95% was assumed. The true concentrations of oxygen in solution at room temperature were determined using Henry's law:
 | (2) |
To evaluate the oxygen removal efficiency of the inline flow degassing system, a 5 μM solution of PtOEP in toluene was pumped through the degassing unit towards the flow cell (Fig. 1a). The degassing unit and flow cell were connected with a short (10 cm) PFA tube with an internal diameter of 1 mm and volume of 78.5 μl. The solution was excited with a 515 nm LED, and the resulting emission was recorded using a UV-vis spectrometer, which collected spectra every two seconds. Fig. 1d shows the increase in emission intensity of the 644 nm phosphorescence band of PtOEP after setting a 4 mbar vacuum pressure inside the degassing chamber at a steady solution flow rate of 100 μl min−1. Taking into account the large 925 μl tube volume inside the degassing chamber, the maximum degassing efficiency at 100 μl min−1 is reached after approximately 10 minutes.
Fig. 1e shows the emission intensity ratio recorded at the 644 nm emission maximum as a function of time (left y-axis), for every flow rate (right y-axis). The PL intensity ratio (I/Iair) visualises how many times the emission intensity is increased in a degassed solution compared to that under air-saturated conditions. Interestingly, I/Iair as a function of flow rate shows that the highest degassing efficiency was recorded at intermediate flow rates of 300–400 μl min−1, suggesting that at long residence times, the degassing rate becomes slower than the reabsorption of gases in the tubing between the degassing unit and the flow cell. This shows that the gas permeability of the tubing following the degassing unit is an important parameter when aiming for low oxygen concentrations.
3.2 Effects of vacuum pressure inside the degassing chamber
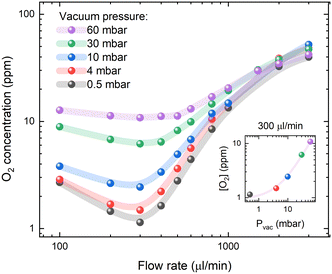
According to Henry's law (eqn (2)), the oxygen concentration in solution under steady-state conditions is mainly influenced by the partial oxygen pressure in the environment. However, the dynamic movement of the liquid within the membrane tubing must lead to inefficient degassing at higher flow rates. The estimated O2 concentrations as a function of vacuum pressure inside the degassing chamber and solution flow rates are presented in Fig. 2. The highest degassing efficiency is reached at a flow rate of 300 μl min−1, while the oxygen concentration increases at slow flow rates due to oxygen reabsorption and at high flow rates due to insufficient degassing. Interestingly, at flow rates higher than 1 ml min−1, the vacuum pressure in the degassing chamber has minimal effects on the degassing efficiency, while the oxygen contents are still up to 10 times lower than the ambient oxygen concentration of [O2] = 200 ppm in toluene. This suggests that [O2] = 10–20 ppm oxygen concentrations in a 925 μl degassing unit can be achieved at a relatively short residence time (less than 1 minute) and low vacuum pressure, but lower O2 concentrations require a higher vacuum as well as longer residence times.At a flow rate of 300 μl min−1, the decrease in vacuum pressure inside the degassing chamber from 60 to 4 mbar results in a similar magnitude decrease in oxygen concentration in solution. This is indicated by the linear relation shown in the inset of Fig. 2. Deviation from linear behaviour at vacuum pressure below 4 mbar indicates that oxygen reabsorption becomes significant; therefore, no lower oxygen concentration can be achieved by further reducing the vacuum pressure inside the degassing chamber. According to Henry's law (eqn (2)), oxygen concentration in toluene at 4 mbar vacuum pressure is equal to [O2] = 20.95%·(4 × 10⁻³ bar)/(1050 bar) = 0.8 ppm, which can be achieved at long residence times. The measured oxygen concentration in solution already approaches this value at a flow rate of 300 μl min−1. It is only limited by gas reabsorption in the tubing between the degassing unit and the fluorescence flow cell.
Another parameter that can be controlled in the flow system and could influence the degassing and gas reabsorption rates is the solvent back-pressure. To test this, a back-pressure regulator was connected after the fluorescence flow cell to create 5 bar of solvent pressure in the flow system. Oxygen concentration measurements were performed for short (10 cm) and long (100 cm) tubing between the degassing unit and the fluorescence cell to investigate both degassing efficiency and gas reabsorption in the tubing following the degassing unit (see Fig. S3 in the ESI†). However, when comparing oxygen concentrations at the different flow rates, only a marginal decrease in oxygen concentration was observed at slow flow rates (below 300 μl min−1) after the solution passed the short tube (10 cm) at 5 bar compared to that with no back-pressure. This could indicate that gas permeation into the solvent through tubing after the degassing unit occurs at a slower rate when back-pressure is applied.
3.3 Effects of tubing gas permeability on gas reabsorption
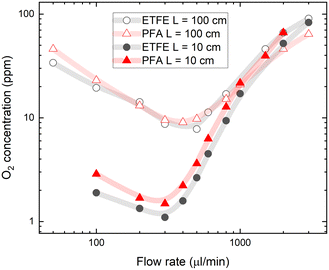
A practical challenge for carrying out flow chemistry reactions at low O2 concentrations can be oxygen reabsorption through the tubing walls, which happens downstream from the degassing unit. The gas permeability of tubes outside the degassing unit should be considered when aiming for a lower oxygen concentration in the flow system. To explore the effects of reabsorption of O2, we tested different tubing materials and lengths. For experiments shown in Fig. 2, PFA tubing material was used between the degassing unit and the flow cell with an oxygen permeability of 10.3 barrers.36 This resulted in significant gas reabsorption even in the short 10 cm PFA tube after the degassing unit. Lower gas reabsorption after the degassing unit can be achieved using ETFE fluoropolymer tubing, which has up to 10 times lower gas permeability.37Fig. 3 shows the O2 concentration measured in toluene after passing short (10 cm) and long (100 cm) PFA and ETFE tubes between the degassing unit and the flow cell. Despite the large difference in the gas permeability of the tubing materials, the measured oxygen concentrations are only slightly lower after passing the short ETFE tube compared to that of the same-length PFA tube.In the longer, 100 cm tubing, the oxygen concentration in solution was increased almost 10-fold at a flow rate of 300 μl min−1 due to oxygen reabsorption given the longer residence time. Interestingly, for long tubes, the different gas permeabilities of PFA and ETFE did not influence the final oxygen contents measured at the flow cell. This shows that the majority of gas reabsorption occurs at the beginning of the tubing after the degassing unit, where the oxygen concentration difference (inside the tube relative to the ambient concentration outside the tube) is high enough to drive the permeation of oxygen through the tube walls. Oxygen reabsorption becomes irrelevant at high flow rates (above 1 ml min−1), which is reflected in converging oxygen concentrations for both tube materials and tube lengths (see Fig. 3).
These findings show that low oxygen concentrations are difficult to achieve in large volume reactors due to significant oxygen permeability via tubing downstream from the degassing unit. However, from the data presented here, predictions on oxygen levels in large-volume reactors can be made and will be presented in the section on computational modelling. Furthermore, other measures can be taken to reduce oxygen concentration by purging reactors with inert gases after degassing. This can be achieved with an inline tube-in-tube reactor purged with inert gases at low pressures to avoid bubble formation.24 A significant reduction in oxygen concentration was achieved by fitting 1 m of 1 mm I.D. PFA tubing inside 3 mm I.D. PVC tubing and purging the internal volume with a low pressure (40 mbar) of N2 gas (see Fig. S4 in the ESI†). This shows that inline degassing coupled with inert gas purging is a good strategy to reduce oxygen concentration.
3.4 Computational approach
In the literature, several methods have been studied to model the evolution of gas or solute concentration throughout an experiment based on differential equations.38–41 This particular system can be simulated using a relatively simple model to predict the oxygen concentration of the solvent at the measurement point. Based on the flow rate of the full system, the residence times within the vacuum degassing unit and the tubing can vary from seconds to minutes. The simulation starts at the beginning of the vacuum degassing unit and predicts the reduction in oxygen concentration based on the residence time calculated from the flow rate. The oxygen concentration gradient within the vacuum degassing unit is given as | (3) |
 | (4) |
| Degassing unit concentration: [O2]degas = −C·exp(−kout·t) + C·[O2]vac | (5) |
| Tubing concentration: [O2]tub = C − exp(−kout·t) | (6) |
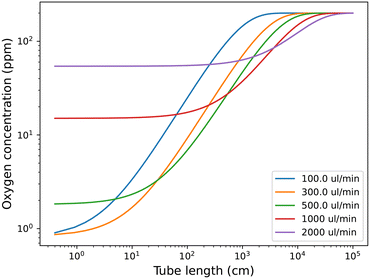
The rate constants were fitted to the experimental data, but they should be quite explainable with the chemical properties of the tubing material, e.g., gas permeability. The fit for the analytical solution to the experimental data is available in Fig. S5 in the ESI.† The rate constants obtained from the fittings can be used to predict oxygen levels at other tube lengths and flow rates, as shown in Fig. 4. This can be used to predict which flow rate to use, at a relevant tube length (reactor volume) to obtain the lowest possible oxygen level in the solution.
3.5 Effects of solvent oxygen solubility
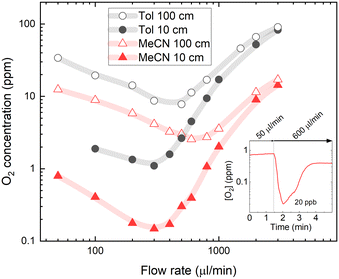
Another factor that could influence degassing properties is the oxygen solubility of the solvent used in the flow system. To test how oxygen solubility affects the degassing efficiency, oxygen concentrations in acetonitrile (MeCN) were also measured. Henry's constant for oxygen solubility in MeCN at room temperature is 2040 bar.42 This indicates a two times lower oxygen solubility compared to toluene (Tol). For the MeCN solution, the Stern–Volmer constants were recalculated by performing calibration using an oxygen-free solution degassed in the glovebox (for more details, see Fig. S2 in the ESI†).Fig. 5 shows estimated molar oxygen concentrations in 5 μM PtOEP solutions in MeCN and Tol. Note that the molar oxygen concentrations in MeCN appear twice as low as those in Tol due to the approximately two times smaller molecular weight of the former. Nevertheless, almost an order of magnitude lower O2 concentration in the 0.3–3 ml min−1 flow rate range measured after passing short (10 cm) ETFE tubing suggests highly efficient degassing associated with low oxygen solubility in MeCN. The higher degassing efficiency in MeCN is also supported by a slight shift of the lowest achieved oxygen concentration toward a higher flow rate, which shows that a shorter residence time inside the degassing unit is required to remove oxygen from the solvent. Higher degassing efficiency is particularly evident in reduced oxygen concentrations measured after passing the long (100 cm) ETFE tube that could also indicate slower oxygen reabsorption in MeCN solvent.
Interestingly, the recorded below ppm-level oxygen concentrations in MeCN were lower than the concentrations predicted by Henry's law at vacuum pressure in the degassing unit. After passing the short tubing at an optimal degassing flow rate of 300 μl min−1, the oxygen concentration in the MeCN solution was reduced to 0.15 ppm, which is lower than the 0.4 ppm predicted by Henry's law for a vacuum pressure of 4 mbar inside the degassing chamber. This suggests that oxygen diffusion from solution via membrane to the degassing chamber driven by an oxygen concentration difference may not be the only mechanism causing a degassing of the solvent. The possibility of solvent evaporation through the membrane inside the degassing chamber that would effectively increase the solution concentration was investigated by repeating experiments with a rhodamine B luminescent probe diluted in solvent with luminescence insensitive to oxygen content; however, no changes in solution concentration could be detected. This can be explained by the significantly lower permeability of solvent vapour through the tube membrane. Furthermore, even lower oxygen concentrations (down to 20 ppb) can be achieved by using a sequence of slow-to-fast flow rates (see inset in Fig. 5). Here, the slow flow rate (50 μl min−1) leads to a long residence time in the degassing unit, followed by a fast flow rate (600 μl min−1), which allows minimisation of the oxygen reabsorption in the tubing after the degassing unit. Similar slow-to-fast flow rate sequences can be applied when extremely low oxygen concentrations are required in small volumes and can be measured at stopped flow, for example, in determining the PL quantum efficiencies of oxygen-sensitive emitter molecules in solution.
3.6 Oxygen permeation in large-volume reactors
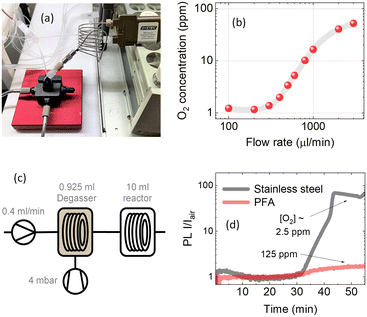
The permeation of gases through fluoropolymer tubes has been discussed, but stainless steel as tubing material could also be relevant for compatible chemical reactions. The primary disadvantage of stainless steel tubes compared to fluoropolymer tubes is that they are not acid-resistant. In addition, stainless steel tubes are very sturdy and thus lack the flexibility of polymer tubes.43 An advantage of the stainless steel tube is the lower oxygen permeability, which in turn should lead to lower oxygen reabsorption.44 This should especially be considered in ethereal solvents due to the risk of producing peroxides within the tubes in the presence of molecular oxygen.45To test oxygen reabsorption in stainless steel tubing, the degassing unit was connected to the measurement cell with a 1 m long 1 mm I.D. stainless steel tube as shown in Fig. 6a. Oxygen concentration measurements as a function of solution flow rate showed almost no increase in oxygen content at slow flow rates <300 μl min−1 (see Fig. 6b). This indicates an almost negligible gas reabsorption after passing 1 m of steel tubing, allowing reaching full degassing capacity even in large-volume stainless steel reactors.
Here we demonstrate that in stainless steel reactors commonly used for high-temperature reactions in flow chemistry, a barrier for gas exchange with the environment is created. Fig. 6c shows a scheme, where a 5 μM PtOEP toluene solution was pumped at a constant 400 μl min−1 flow rate through a 925 μl degassing unit kept at 4 mbar vacuum pressure to reach approximately 1 ppm molar oxygen fraction before the solution was passed through a 10 ml reactor. Fig. 6d shows the comparison between the 10 ml PFA and stainless steel reactors tested under the same conditions. The almost 100-fold increase in PL intensity of the solution after passing through the stainless steel reactor indicated that the oxygen concentration in the solution was retained at the 2.5 ppm level even after more than 30 minutes of residence time in the reactor. In comparison, after passing through the 10 ml PFA reactor, the oxygen concentration in solution closely reached the ambient oxygen level due to the strong permeation of gases through the polymer tubing.
4 Conclusion
In this work, we present a method for efficient solvent and solution degassing and oxygen content monitoring in a continuous flow system based on a commercial degassing unit combined with a photoluminescence flow cell. We demonstrate that remote optical detection of photoluminescence quenching using micro-molar concentrations of oxygen-sensitive probes diluted in solvent is a highly sensitive technique to monitor below ppm-levels of oxygen in flowing liquids. Despite being rated at higher vacuum pressures, the commercial degassing unit showed robust and repeatable performance at 1–10 mbar vacuum pressures that allowed achieving oxygen concentrations 2–3 orders of magnitude lower than ambient oxygen concentrations in solvents under optimal conditions. Furthermore, the degassing system can be operated at hundreds of microliters per minute, which is relevant for performing oxygen-sensitive reactions in flow chemistry. Similarly, the flow degassing systems allow for automated measurements of oxygen-sensitive species without the burden of glovebox operation or inertisation procedures. A simple analytical model was developed and fitted to the experimental data. Using the model, it was possible to predict optimal flow rates to obtain the lowest possible oxygen concentrations at given lengths of tubing.Conflicts of interest
There are no conflicts to declare.Acknowledgements
The authors thank the European Research Council (ERC) under grant agreement CoG, PHOTHERM – 101002131, and the Catalan Institute of Advanced Studies (ICREA). The authors also thank Hannes Schomaker for fruitful discussions and Zacharias Liasi for assistance in preparing the manuscript.References
- M. Abolhasani and E. Kumacheva, Nat. Synth., 2023, 1–10 Search PubMed.
- C. J. Taylor, A. Pomberger, K. C. Felton, R. Grainger, M. Barecka, T. W. Chamberlain, R. A. Bourne, C. N. Johnson and A. A. Lapkin, Chem. Rev., 2023, 123, 3089–3126 CrossRef CAS PubMed.
- J. S. Manzano, W. Hou, S. S. Zalesskiy, P. Frei, H. Wang, P. J. Kitson and L. Cronin, Nat. Chem., 2022, 14, 1311–1318 CrossRef CAS PubMed.
- S. Knoll, C. E. Jusner, P. Sagmeister, J. D. Williams, C. A. Hone, M. Horn and C. O. Kappe, React. Chem. Eng., 2022, 7, 2375–2384 RSC.
- M. Seifrid, R. Pollice, A. Aguilar-Granda, Z. Morgan Chan, K. Hotta, C. T. Ser, J. Vestfrid, T. C. Wu and A. Aspuru-Guzik, Acc. Chem. Res., 2022, 55, 2454–2466 CrossRef CAS PubMed.
- S. Chatterjee, M. Guidi, P. H. Seeberger and K. Gilmore, Nature, 2020, 579, 379–384 CrossRef CAS PubMed.
- M. Guidi, P. H. Seeberger and K. Gilmore, Chem. Soc. Rev., 2020, 49, 8910–8932 RSC.
- C. W. Coley, D. A. Thomas, J. A. M. Lummiss, J. N. Jaworski, C. P. Breen, V. Schultz, T. Hart, J. S. Fishman, L. Rogers, H. Gao, R. W. Hicklin, P. P. Plehiers, J. Byington, J. S. Piotti, W. H. Green, A. J. Hart, T. F. Jamison and K. F. Jensen, Science, 2019, 365, eaax1566 CrossRef CAS PubMed.
- A. A. Volk, Z. S. Campbell, M. Y. Ibrahim, J. A. Bennett and M. Abolhasani, Annu. Rev. Chem. Biomol. Eng., 2022, 13, 45–72 CrossRef PubMed.
- A. A. Volk, R. W. Epps, D. T. Yonemoto, B. S. Masters, F. N. Castellano, K. G. Reyes and M. Abolhasani, Nat. Commun., 2023, 14, 1403 CrossRef CAS PubMed.
- K. P. L. Kuijpers, C. Bottecchia, D. Cambié, K. Drummen, N. J. König and T. Noël, Angew. Chem., Int. Ed., 2018, 57, 11278–11282 CrossRef CAS PubMed.
- J. M. Merritt, J. Y. Buser, A. N. Campbell, J. W. Fennell, N. J. Kallman, T. M. Koenig, H. Moursy, M. A. Pietz, N. Scully and U. K. Singh, Org. Process Res. Dev., 2014, 18, 246–256 CrossRef CAS.
- M. S. Kharasch and F. R. Mayo, J. Am. Chem. Soc., 1933, 55, 2468–2496 CrossRef CAS.
- J. Isokuortti, I. Kiiski, T. Sikanen, N. Durandin and T. Laaksonen, J. Mater. Chem. C, 2022, 10, 4871–4877 RSC.
- I. Kiiski, P. Järvinen, E. Ollikainen, V. Jokinen and T. Sikanen, Lab Chip, 2021, 21, 1820–1831 RSC.
- T. C. Merkel, I. Pinnau, R. Prabhakar and B. D. Freeman, Materials Science of Membranes for Gas and Vapor Separation, John Wiley & Sons, Ltd, 2006, pp. 251–270 Search PubMed.
- C. A. Hone and C. O. Kappe, Chem. – Eur. J., 2020, 26, 13108–13117 CrossRef CAS PubMed.
- S. Han, M. Alsadat Kashfipour, M. Ramezani and M. Abolhasani, Chem. Commun., 2020, 56, 10593–10606 RSC.
- M. Ramezani, M. A. Kashfipour and M. Abolhasani, J. Flow Chem., 2020, 10, 93–101 CrossRef CAS.
- C. J. Mallia and I. R. Baxendale, Org. Process Res. Dev., 2016, 20, 327–360 CrossRef CAS.
- M. Brzozowski, M. O'Brien, S. V. Ley and A. Polyzos, Acc. Chem. Res., 2015, 48, 349–362 CrossRef CAS PubMed.
- N. C. Neyt, C. J. v. d. Westhuizen, J.-L. Panayides and D. L. Riley, React. Chem. Eng., 2022, 7, 1718–1727 RSC.
- L. Yang and K. F. Jensen, Org. Process Res. Dev., 2013, 17, 927–933 CrossRef CAS.
- M. O'Brien, N. Taylor, A. Polyzos, I. R. Baxendale and S. V. Ley, Chem. Sci., 2011, 2, 1250–1257 RSC.
- M. O'Brien, I. R. Baxendale and S. V. Ley, Org. Lett., 2010, 12, 1596–1598 CrossRef PubMed.
- T. P. Petersen, A. Polyzos, M. O'Brien, T. Ulven, I. R. Baxendale and S. V. Ley, ChemSusChem, 2012, 5, 274–277 CrossRef CAS PubMed.
- M. Brzozowski, J. A. Forni, G. Paul Savage and A. Polyzos, Chem. Commun., 2015, 51, 334–337 RSC.
- S. Sharma, R. A. Maurya, K.-I. Min, G.-Y. Jeong and D.-P. Kim, Angew. Chem., Int. Ed., 2013, 52, 7564–7568 CrossRef CAS PubMed.
- J. H. Park, C. Y. Park, M. J. Kim, M. U. Kim, Y. J. Kim, G.-H. Kim and C. P. Park, Org. Process Res. Dev., 2015, 19, 812–818 CrossRef CAS.
- P. Koos, U. Gross, A. Polyzos, M. O'Brien, I. Baxendale and S. V. Ley, Org. Biomol. Chem., 2011, 9, 6903–6908 RSC.
- X.-d. Wang and O. S. Wolfbeis, Chem. Soc. Rev., 2014, 43, 3666–3761 RSC.
- A. K. Bansal, W. Holzer, A. Penzkofer and T. Tsuboi, Chem. Phys., 2006, 330, 118–129 CrossRef CAS.
- W. R. Ware, J. Phys. Chem., 1962, 66, 455–458 CrossRef CAS.
- E. Armagan, K. Wei, G. Fortunato, E. Amstad and R. M. Rossi, ACS Appl. Polym. Mater., 2021, 3, 2480–2488 CrossRef CAS.
- G. Wu, E. Cao, S. Kuhn and A. Gavriilidis, Chem. Eng. Technol., 2017, 40, 2346–2350 CrossRef CAS.
- F. W. Giacobbe, J. Appl. Polym. Sci., 1990, 39, 1121–1132 CrossRef CAS.
- H. Fitz, Fluorocarbon films-present situation & future outlook, Kunststoffe with German Plastics, 1980, vol. 70(1), pp. 11–16 Search PubMed.
- T. Ono, Y. Kanai, K. Inoue, Y. Watanabe, S.-i. Nakakita, T. Kawahara, Y. Suzuki and K. Matsumoto, Nano Lett., 2019, 19, 4004–4009 CrossRef CAS PubMed.
- X. Duan, J. Tu, A. R. Teixeira, L. Sang, K. F. Jensen and J. Zhang, React. Chem. Eng., 2020, 5, 1751–1758 RSC.
- M. O'Brien and R. Moraru, ChemPlusChem, 2023, 88, e202200401 Search PubMed.
- M. O'Brien, J. CO2 Util., 2017, 21, 580–588 CrossRef.
- S. Horstmann, A. Grybat and R. Kato, J. Chem. Thermodyn., 2004, 36, 1015–1018 CrossRef CAS.
- M. B. Plutschack, B. Pieber, K. Gilmore and P. H. Seeberger, Chem. Rev., 2017, 117, 11796–11893 CrossRef CAS PubMed.
- F. Boeschoten, W. Van Egmond and H. M. J. Kinderdijk, Appl. Sci. Res., Sect. B, 1960, 8, 378–386 CrossRef.
- T. Uchida, M. Wakakura, A. Miyake and T. Ogawa, J. Therm. Anal. Calorim., 2008, 93, 247–251 CrossRef CAS.
Footnote |
| † Electronic supplementary information (ESI) available. See DOI: https://doi.org/10.1039/d3re00109a |
| This journal is © The Royal Society of Chemistry 2023 |

