
Effect of the nickel impregnation method on clay supports in the hydroconversion reaction of n-decane
Jahaziel
Amaya†
 ,
Cesar
Calderón
,
Rafael
Molina
and
Sonia
Moreno
*
,
Cesar
Calderón
,
Rafael
Molina
and
Sonia
Moreno
*
Estado Sólido y Catálisis Ambiental (ESCA), Departamento de Química, Facultad de Ciencias, Universidad Nacional de Colombia, Kra 30 N°45-03 Bogotá, Colombia. E-mail: smorenog@unal.edu.co
First published on 13th October 2022
Abstract
Ni bifunctional catalysts supported on vermiculite, halloysite and bentonite previously modified by means of delamination or acid treatment were synthesized. The Ni was incorporated using three synthesis methods: auto-combustion (AC), microwave-assisted auto-combustion (AM) and the wet impregnation method (WI). The solids obtained were characterized under different conditions: i) as oxides prior to the reaction, using X-ray diffraction (XRD), N2 physisorption and temperature programmed reduction (H2-TPR), ii) under “in situ” reaction conditions using infrared spectroscopy with probe molecule (NH3-DRIFTS) accompanied by titration with HCl, iii) “ex situ” using high resolution transmission electron microscopy (HRTEM) and iv) post-reaction catalysts were characterized using thermogravimetric analysis (TGA-DSC), Raman and infrared spectroscopy. The catalytic performance of the materials was evaluated in the hydroconversion of decane (C10). In addition, the influence of the impregnation method on the mineral used was analyzed. In the case of the solids obtained from bentonite and halloysite, the methods that most favored the catalytic activity were those of auto-combustion, while in the case of the catalysts obtained with vermiculite as a support, the most favorable method was wet impregnation (WI), which was related to the number of reducible species, the dispersion and acid properties that each method favored depending on the clay mineral used. Finally, all the catalysts presented a high resistance to the formation of carbonaceous residues on their surface, indicating a high activity and low deactivation of the materials.
1. Introduction
Currently, bifunctional catalysts are at the heart of a wide variety of processes,1,2 where hydroconversion reactions are prominent and which are of vital importance in the petrochemical industry, allowing for the transformation of heavy compounds into smaller hydrocarbons which can be used as fuels.3–5 In this transformation, the long-chain alkanes undergo hydrogenation/dehydrogenation (at the metallic sites), a rearrangement of the chain and excisions of the carbon–carbon bonds (at the acid sites) on the surface of a bifunctional catalyst (acid and metallic sites).1–5 One of the most studied reactions in this field is the hydroconversion of decane, which is a reaction of industrial interest in which low octane hydrocarbons are transformed into branched isomers with superior fuel properties. This reaction model is recognized as a useful tool for determining the characteristics of the solid under conditions of pressure and temperature relevant to practical application6 and it permits, among other aspects, elucidating valuable information on acidity (it permits evaluating the type, strength and distribution of the acid sites) and material porosity (pore size distribution).7,8New catalysts are continually being developed in order to improve the performance of hydroconversion reactions as well as the selectivity of the products.9 The main catalysts reported for hydroconversion reactions are based on Pt,1,2,10 or bimetallic systems (Ni/Mo or Co/Mo)2,11,12 supported mainly on zeolites,13–15 but also on silico–alumina16 carbon–alumina17 and clay minerals. Among the latter, beidelite,18 montmorillonite,19,20 saponite,21 metakaolinite,22 vermiculite20 and halloysite23 stand out.
However, metals such as Pt are costly and are sensitive to poisoning and deactivation when used in hydroconversion reactions.1 Supports such as zeolites are essentially of synthetic origin, reflecting disadvantages such as high synthesis and purification costs,24 since natural zeolites have a low interchange capacity and low purity of the zeolitic phase.25 Among the alternatives for avoiding these drawbacks we find the use of Ni (more economical than Pt) reported for its high catalytic activity in hydroconversion reactions;26–28 additionally, and in order to obtain economical, active and environmentally friendly materials, the use of clay minerals has been reported, which have modulable textural and acid characteristics,29,30 which can be used in a wide range of applications31 and, by their very nature, generate a low impact on the environment at the time of their final disposal.19,32
On the other hand, the transcendental importance of the synthesis method in achieving the modulation of the properties of a solid (textural, structural, dispersion, acid, etc.) is of general knowledge. One of the widely reported methodologies for the synthesis of supported metal catalysts is wet impregnation, which consists of anchoring the metallic precursor by diffusion of the metal on the support.33,34 However, in the search for new synthesis methods that allow for better control of particle size, metallic dispersion, distance between metallic and acid sites and larger surface areas, auto-combustion (which requires an external heat source) and Microwave-assisted auto-combustion (where the heat required for ignition is generated from inside the solid) appear as interesting, versatile, simple and accessible methods for the preparation of said solids in short times and at low costs, generating materials with high surface areas, small particle sizes, high crystallinity and purity of the metallic phases, resistance to sintering and greater access to active sites.35–37 Auto-combustion methods involve an oxide-reduction reaction between a fuel such as glycine and an oxidant (generally nitrates) that react exothermically when they reach ignition.36–38 However, obtaining bifunctional catalysts by means of these auto-combustion processes has not been sufficiently studied and there is only one report related to this system where active catalysts are achieved in the hydroconversion reaction.39
In this context and in order to evaluate the effect of the method of metal incorporation (Ni) in properties such as metallic dispersion and metal–support interaction, in this work three synthesis routes are proposed, i) auto-combustion, ii) microwave assisted auto-combustion and iii) wet impregnation, for the supported metallic phase, while the acid function is modulated based on the support using different clays: a bentonite and a vermiculite (clays type 2![[thin space (1/6-em)]](https://www.rsc.org/images/entities/char_2009.gif) :1, two layers of silicon tetrahedra per one layer of aluminum octahedra),40 whose fundamental difference is their interlaminar charge (bentonite has a lower charge compared to vermiculite)41 and a halloysite (clay 1:1, has a layer of silicon tetrahedra for a layer of aluminum octahedra) which has the particularity of forming nanotubes with the silicon groups on the exterior surface and the aluminum groups on the interior surface of the nanotubes.42
:1, two layers of silicon tetrahedra per one layer of aluminum octahedra),40 whose fundamental difference is their interlaminar charge (bentonite has a lower charge compared to vermiculite)41 and a halloysite (clay 1:1, has a layer of silicon tetrahedra for a layer of aluminum octahedra) which has the particularity of forming nanotubes with the silicon groups on the exterior surface and the aluminum groups on the interior surface of the nanotubes.42
In this sense, to our knowledge, the study of the method of Ni incorporation via auto-combustion or microwave-assisted auto-combustion on natural clay minerals (bentonite, vermiculite and halloysite) has not yet been reported in the specialized literature and could open up new alternatives to traditional impregnation for controlling and adapting the properties of the bifunctional catalyst based on simple syntheses, with short times and with structural, textural, reductive and acid characteristics comparable or superior to those obtained by impregnation, and active in the hydroconversion reactions of alkanes.
2. Experimental
2.1. Supports
The supports used in this work to obtain the different bifunctional catalysts have been previously characterized and reported23,30,43,44 and correspond to a delaminated bentonite and a delaminated vermiculite, and a halloysite modified with acid treatment. In their order, the structural formulas are as follows: Si4O10(OH)2·(Al3.33Mg0.67)·Si4O10(OH)2·(Na,K)0.67,[(Si3.04Al0.92Ti0.04)(Al0.11Fe3+0.35Fe2+0.07Mg2.41Mn0.003)O10(OH)2]Ca0.21K0.05Na0.10 and Al2Si2O5(OH)4*2H2O. These materials were called “DB”, “DV” and “Ha” and presented surface area values of 137; 274 and 121 m2 g−1 respectively. The acidity, determined by TPD-NH3 for the supports in μmol NH3 per g, is: “DB” = 110, “DV” = 257 and “Ha” = 94.23,30,43,442.2. Ni incorporation method
Nickel nitrate hexahydrate (Ni(NO3)2*6H2O 98% supplied by PanReac) was used for the incorporation of nickel (2% Ni p/p) on the different clay minerals.Impregnation by means of auto-combustion (AC) was carried out by adding a solution of Ni(NO3)2*6H2O on each clay, and glycine (CH2NH2COOH 99.5% supplied by PanReac) was added to the mixture, maintaining a stoichiometric Ni/glycine ratio, taking into account that this ratio is the one that has been reported to generate the highest catalytic performance.39 Stirring was maintained for 30 min, subsequently the water from the mixture was evaporated and the auto-combustion process was carried out, increasing the temperature to 250 °C. The solids obtained by this method were called AC–Ni/support used; thus, the solid composed of Ni supported on delaminated bentonite and obtained by auto-combustion will be called: AC–Ni/DB.
The second method was microwave-assisted auto-combustion (AM) impregnation, which was carried out with the same Ni/glycine stoichiometric ratio and the same previous procedure, only that, at the time of promoting auto-combustion, the mixture was taken to microwave equipment (SINEO Uwave-1000) where it was irradiated using the following parameters: T = 300 °C; t = 6 min; and 800 W of power. The solids obtained are mentioned correspondingly to the previous case, indicating that the synthesis method is (AM); thus, the solid composed of Ni supported on delaminated bentonite and obtained by microwave-assisted auto-combustion will be called: AM–Ni/DB.
Finally, for the preparation of the solid by means of wet impregnation (WI), a solution of Ni(NO3)2*6H2O was slowly added to each clay, maintaining constant stirring. Following the addition, stirring the suspension was continued for 2 h and subsequently, the mixture was dried. This solid will be called: WI–Ni/DB.
All the solids obtained from the different synthesis methods were calcined at 400 °C with a ramp of 10 °C min−1 for 4 h.
2.3. Characterization techniques
:100, 150 scans and a resolution of 4 cm−1. Before each measurement, an atmospheric target was carried out and subsequently the KBr pellet was incorporated into the IR chamber to obtain the respective spectrum.
2.4. Catalytic performance
The hydroconversion of decane was carried out using 300 mg of solid in a U-reactor. All the details about the dimensions of the reactor and its operation have been widely reported.23,30,43,44 The catalytic activity was conducted with a H2/hydrocarbon ratio of 17 and a flow of 16 mL min−1 and a WHSV = 1.16 h−1 in a temperature range of 150 °C to 400 °C taking measurements at intervals of 25 °C. The reaction products were analyzed online by means of gas chromatography using a Shimadzu GC-17 chromatograph, with a ZB-1 column (60 m × 0.53 mm × 0.32 μm) and an FID detector as reported.23,30,43,44 The percentage of error for this catalytic test was determined to be 3% in all cases.19,20,303. Results and discussion
3.1. Characterization of the catalysts prior to the reaction
 | ||
| Fig. 1 Diffractograms of the Ni catalysts supported in the respective clay minerals obtained by different methods: a) series with bentonite; b) series with vermiculite; and c) series with halloysite. q: quartz, m: montmorillonite, v: vermiculite, Ha: halloysite. | ||
In both minerals type 2:1, no signals are observed near 6.40° 2θ which is attributed to the d(001) plane when the minerals meet in a face–face type arrangement, indicating that the materials obtained after the modification present a face–face, face–edge and edge–edge arrangement56 associated with a successful delamination of the minerals.19,30,32,43,57 On the other hand, the “Ha” series (clay 1:1) presents signals corresponding to halloysite at °2θ = 12.31°, 20.10°, 24.98°, 35.07°, 36.09°, 38.53° (JCPDS No. 29-1487)58 accompanied by the presence of quartz (signals mentioned above) which is a common contaminant in this mineral.44,59,60 The diffraction profiles for this series evidence that the structure of the material is preserved following the acid treatment, which indicates that the loss of the Al3+ was partial and did not cause destruction of the long-range order.44
Finally, it can be established that none of the Ni incorporation methods generate new phases or structures different from those of the original clays, since the planes of the catalysts coincide with those of the clays modified without the presence of Ni, which have already been previously reported.19,30,32,57 Additionally, no characteristic Ni peaks were observed (°2θ = 37.1 and 43.1) which implies either that it is highly dispersed on the surface61 or that, due to the low percentage used, it is below the detection limit of the technique.62
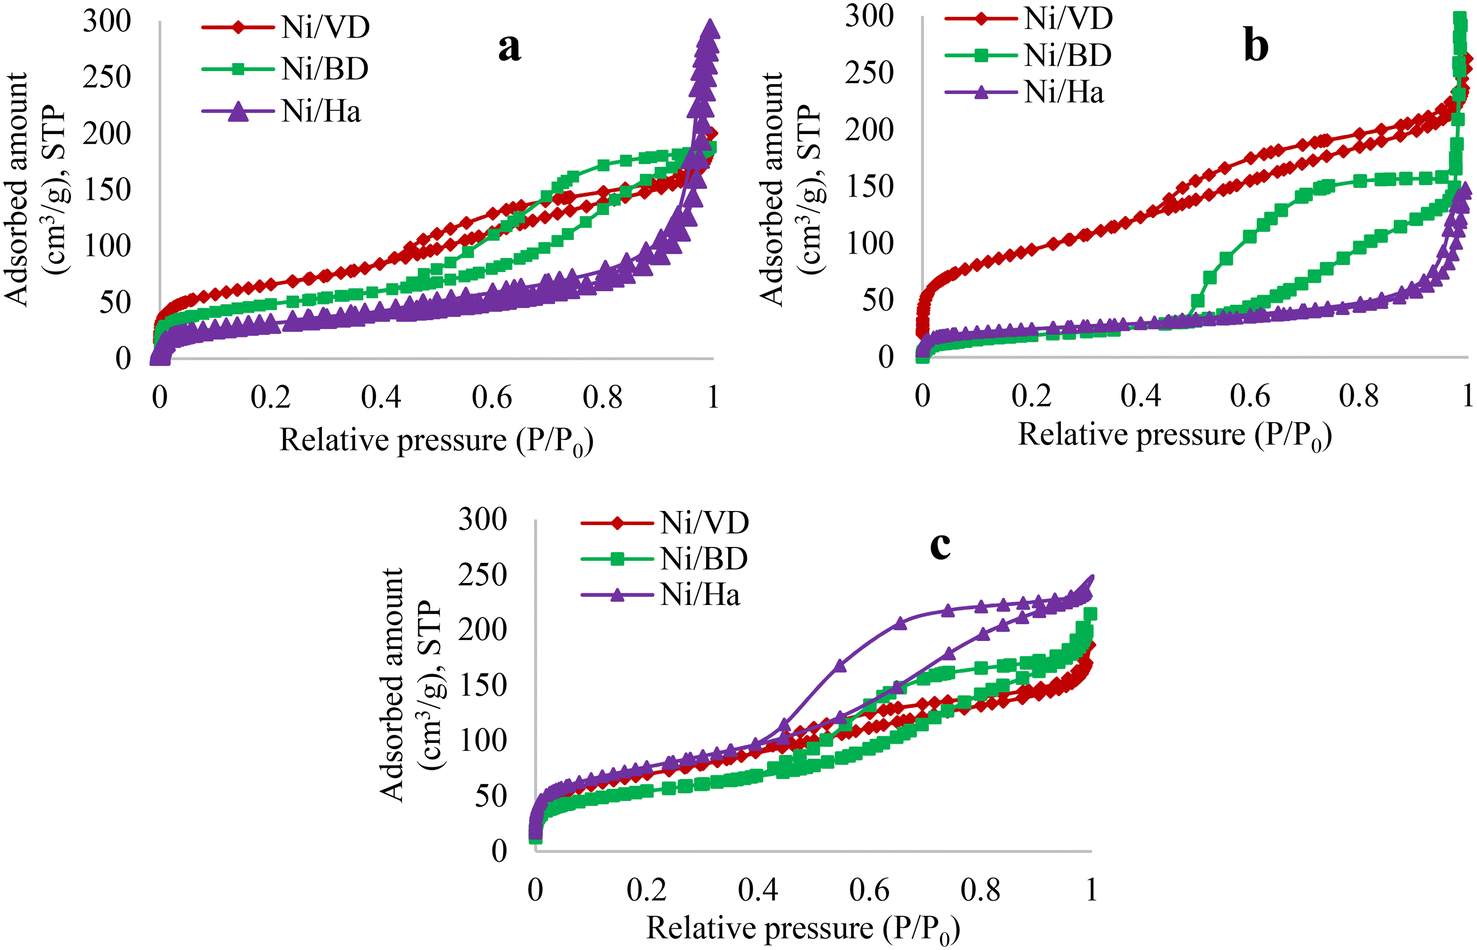 | ||
| Fig. 2 Adsorption isotherms for the different solids obtained by synthesis method, a: “AC”, b: “AM”, c: “WI”. | ||
| Solid | Specific surface areaa (m2 g−1) | Pore volumed (cm3 g−1) | ||||
|---|---|---|---|---|---|---|
| BET | Microporeb | Mesopore | S (External) | Microporeb | Totalc | |
| a Sensitivity of the technique ±10 m2 g−1. b The Harkins–Jura equation was used to calculate the value of t. c Determined using the Gurvitsch method. d Liquid volume. | ||||||
| AC–Ni/BD | 166 | 14 | 152 | 152 | 0.015 | 0.28 |
| AC–Ni/Ha | 110 | 2 | 108 | 100 | 0.011 | 0.45 |
| AC–Ni/VD | 225 | 31 | 194 | 194 | 0.016 | 0.30 |
| AM–Ni/BD | 92 | 1 | 91 | 91 | 0.007 | 0.51 |
| AM–Ni/Ha | 81 | 16 | 65 | 65 | 0.006 | 0.22 |
| AM–Ni/VD | 330 | 28 | 302 | 302 | 0.030 | 0.40 |
| WI–Ni/BD | 185 | 21 | 164 | 164 | 0.016 | 0.33 |
| WI–Ni/Ha | 236 | 21 | 215 | 243 | 0.024 | 0.38 |
| WI–Ni/VD | 242 | 22 | 220 | 220 | 0.022 | 0.28 |
On the other hand, a change in the type of hysteresis is noticeable depending on the support used. For the “Ha” series, a hysteresis type H1 is generated, characteristic of materials with cylindrical and uniform pores. It is verified that for Ha there is a loss of area when the auto-combustion methods are used in comparison with the wet impregnation method and the reference material,23,44 which seems to suggest that this material is susceptible to changes caused by the temperatures reached in auto-combustion methods. It has been reported that there is a competition between the heat of combustion and the amount of gases released during high temperature synthesis (auto-combustion), which influences the textural properties of the final catalysts,64 thus, the significant decrease in surface area in this mineral can be attributed to the large amount of reaction energy released during auto-combustion, facilitating the formation of a denser structure with loss of porosity. On the other hand, following the incorporation of Ni, two opposite effects occur depending on the starting mineral and the synthesis method used, which does not show a clear trend in the textural properties of the materials obtained in the 2:1 mineral, regardless of the synthesis method used. In the case of “DB”, there is only a decrease in surface area when the “AM” method is used (compared to the support without Ni (ref. 30)), but for “DV” when the “AM” method is used it is in the only material that presents an increase in surface area (when compared to the support without Ni (ref. 43)), which is attributed to the characteristics of vermiculite such as its greater thermal stability, as has been reported in the literature.65,66 In this sense, it is evident that the structural properties of the starting minerals influence the impregnation method, demonstrating the importance of the selected mineral in the desired textural characteristics. Thus, there is an increase in area when the “WI” method is used in the case of “Ha”; for the case of “DB” the increase occurs with the “WI” and “AC” methods and finally, for “DV” the method that favors the best textural properties is “AM”, in comparison with previously reported starting minerals.19,23,29,30,32,44,57,67 Changes in the textural properties of the materials can also directly influence the dispersion of Ni in the support.28 It has been reported that in general, when the surface area increases the average pore size decreases (Fig. 3), which could suggest that Ni is collocated inside the pores formed in the support, thus increasing the surface area of the solids and decreasing the average pore size,19,57 which occurs for “DB” when impregnation methods “AC” and “WI” are used. Another explanation for the increases in surface area could be associated with the fact that Ni deposition is confined to the external surface of the support, which would induce a surface roughness causing the number of pores in the material to increase.68 This second possibility fits perfectly into the behavior observed for “Ha” when using the “WI” method.
 | ||
| Fig. 3 Pore size distribution for the different solids obtained by synthesis method, a: “AC”, b: “AM”, c: “WI”. | ||
In contrast, in cases where there is a decrease in area, this may be associated with the method and with a low thermal stability of the starting materials, (case of “Ha” and “DB”, associated with a collapse of the laminae of the materials29). However, another possible explanation can be directly associated with the disposition of Ni on the surface of the supports, forming aggregates in the pores of the mineral, which decrease the surface area. Finally, for the case of “DV” a change in the pore population is not observed when high temperatures are used, due to its high thermal stability. Moreover, when the “WI” method is used with “DV” the pore population decreases, attributed to the fact that the incorporated Ni is possibly blocking several pores. Additionally, and to verify the effects, an HR-TEM analysis was performed which will be discussed in depth further on.
Finally, a more detailed analysis of the pore size distribution behavior in the materials is recorded in Fig. 3. In addition to indicating increases or decreases in the pore population regardless of the method used (previously discussed), it also reveals, in most cases, a multimodal distribution in pore sizes, indicating that the materials present micro and mesoporosity associated with the formation of different intraparticle and interparticle pores, formed by the random arrangement of the laminae, obtaining a distribution similar to that of hierarchical zeolites, which favors the hydrocarbon reacting in the micropores and the products are able to diffuse freely through the mesopores.69,70 The only exception to this behavior is the solid WI–Ni/Ha which presents a monomodal distribution with diameters mainly in the mesopore interval (20 to 500 Å), indicating that for “Ha” the “WI” method does not change the textural properties of the starting material,23,44 attributed to the moderate characteristics of the method, compared to thermal methods.
 | ||
| Fig. 4 Temperature programmed reduction profiles (H2-TPR) for synthesized solids, a: “AC”, b: “AM”, c: “WI”. | ||
When comparing the influence of the Ni incorporation method, it is observed that “WI” synthesis facilitates the reduction process given that the maximum temperatures shifted towards lower values, as did the H2 consumptions (Table 2), possibly indicating the formation of particles of smaller size, which may be related to the higher surface area values found when this method was used, as previously discussed. In the case of the auto-combustion methods, the higher H2 consumptions found at high temperatures can be related to the hot spots that are generated during synthesis, which would facilitate the migration of NiO species and given that the NiO Tamman temperature is 261 °C, values that can be exceeded during auto-combustion, it would become easier for NiO to diffuse and agglomerate, generating larger particle sizes, which would displace the reduction signals at higher temperatures. Another possibility is that the high temperatures reached during the synthesis facilitate the formation of nickel aluminates, which are more difficult to reduce.72 In this sense, the Ni dispersion on the surface of the materials is analyzed in detail by means of HR-TEM.
| Solid | Consumption of H2a | Total reducibility (%)e | ||
|---|---|---|---|---|
| Low Tb | High Tc | Totald | ||
| a Sensitivity of the technique ±0.01 mmol H2 per g. b Low temperature (250–450). c High temperature (450–950). d Total (total consumption sum of consumption at low and high temperature). e Theoretical consumption based on the amount of Ni incorporated, 0.312 mmol g−1. | ||||
| AC–Ni/BD | 0.04 | 0.23 | 0.27 | 86% |
| AC–Ni/Ha | 0.10 | 0.25 | 0.35 | ≈100% |
| AC–Ni/VD | 0.02 | 0.29 | 0.31 | 99% |
| AM–Ni/BD | 0.02 | 0.17 | 0.19 | 61% |
| AM–Ni/Ha | 0.6 | 0.34 | 0.40 | ≈100% |
| AM–Ni/VD | 0.39 | 0.0 | 0.39 | ≈100% |
| WI–Ni/BD | 0.08 | 0.20 | 0.28 | 90% |
| WI–Ni/Ha | 0.07 | 0.27 | 0.34 | ≈100% |
| WI–Ni/VD | 0.29 | 0.0 | 0.29 | 93% |
In addition to this, an important effect of the starting mineral is observed on the reductive properties of the materials. For the “DB” series and “Ha” a broad signal and several reduction peaks are observed regardless of the synthesis method. The lowest temperature signal (≈470 °C) is associated with the NiO groups formed on the outer surface of the mineral, species that are more exposed (which would favor an increase in surface area as discussed above), have weak interaction with the support and are therefore easier to reduce. The peaks between 550 °C and 750 °C can be associated with the reduction of the NiO species formed in the interlaminar spaces of the delaminated support73 or of nickel aluminates (NiAl2O4 or Ni2AlO4) formed between alumina and NiO after the calcination process, which are more difficult to reduce.72
The existence of these different types of nickel species can be explained by the encrustation effect of Ni in the mesopores of minerals, improving the interaction between the NiO and the clay. In addition, these results are in coherence with the XRDs which suggest a possible high dispersion of Ni2+ species, indicating that a low metal load favors the formation of small Ni particles, which are in close contact with the support and therefore are reduced with greater difficulty.74 On the other hand, in the case of catalysts obtained from “DV”, a signal is mainly observed at low temperatures, around 250 and 450 °C, as well as the highest H2 consumptions at low temperatures, (Table 2). This signal is attributed to the reduction of the Ni (NiO → Ni0 (ref. 57)), in this case, the appearance of a single signal may be associated with the mineral having a low interaction with Ni, or possibly with its greater surface area in comparison with the other minerals in this work, favoring the presence of Ni species with similar distribution and particle size, exposed on the external surface of the material, thus aiding reduction at lower temperatures. Likewise, a clear influence of the starting mineral on the total reducibility of the materials was determined, finding that for “DV” and “Ha” very close values are obtained (above 90%) being very different from those of the materials obtained based on “DB” (values between 61–90%) Table 2, which could indicate that for this latter support, the Ni is possibly confined in the interlaminar space of the delaminated clay, making its reduction difficult. These values of total reducibility are within those reported in the literature.39,44,75
Finally, the results of total reducibility could indicate that only in the case of the solids obtained from “DV” and “Ha” would the highest amount of Ni reduced under the reaction conditions (H2/400 °C/2 h), be found, it being necessary to reach higher temperatures to reduce the Ni completely when using “DB”.28 This can have a direct influence on the catalytic activity of the materials, affecting the performance under the reaction conditions used and, although the H2-TPR conditions are dynamic unlike the activation conditions of the catalytic test (static: 400 °C, 2 h), this characterization allows for an approximate idea of what is happening during the reaction.19,32,57
3.2. Characterization of catalysts “in–ex situ”
The materials obtained from “DV”, and “Ha” were evaluated by means of diffuse reflectance infrared spectroscopy (NH3-DRIFTS using ammonia as probe molecule), considering that they were the supports that presented the highest and lowest content of acid sites respectively (acidity values reported in the methodology). These tests were carried out for the materials obtained by the “WI” impregnation method, in oxidized form, and under reaction conditions, and for the “AC” method under reaction conditions. Considering that the characteristics of the materials obtained by “AM” were very similar to those obtained by “AC”, these were not included in this analysis.
The tests confirmed the existence of Brønsted-type and Lewis-type acid sites present in the materials, Fig. 5. The signal around 1450 cm−1 present in previously degassed materials increases with the adsorption of NH3, which is associated with the vibrations of the ammonium ion (NH4+) that is formed when NH3 interacts with the protons of the OH groups of the material, corresponding to the Brønsted acid sites. Another signal that increases in intensity when ammonia is adsorbed is the one which appears at 1640 cm−1, which is due to asymmetric bending vibrations of the NH3 N–H bond coordinated to Lewis acid sites.79 On the other hand, by increasing the ammonia desorption temperature (desorption temperatures 100–400 °C), a decrease is observed in the bands attributed to the Brønsted and Lewis acid sites, the change being negligible after 200 °C. When comparing the acidity values obtained by the titration with HCl (μmol values of NH3 per g of catalyst included in the graph), an increase in acidity is observed in all cases when evaluated under reaction conditions compared to the solid in its oxidic phase, going from 120 to 1120 μmol of NH3 per g in the case of solid WI–Ni/DV and from 60 to 760 μmol of NH3/g for solid WI–Ni/Ha, which can be associated with the formation of metallic Ni, which, when reduced, favors an increase in OH sites on the surface of the material, obtaining a higher content of acid sites with the “WI” method compared to the “AC” method. The latter could be related to the high temperatures reached during the synthesis by auto-combustion, which can extinguish the presence of low strength acid sites, the loss of acid sites being more significant for solid AC–Ni/DV. On the other hand, a clear effect of the support is evident since the materials obtained from “DV” present the highest acidity compared to those obtained from “Ha”, a result that is consistent with several previous reports,23,30,43,44 and mainly associated with the high interlaminar load of vermiculite compared to halloysite.41,81 This charge decompensation generated by the isomorphic substitution described, promotes the formation of sites with an acid character, either because the vulnerability of positive charges allows for the acceptance of electronic pairs (Lewis acidity) or because protons can be captured and then yielded (Brønsted acidity).53,82
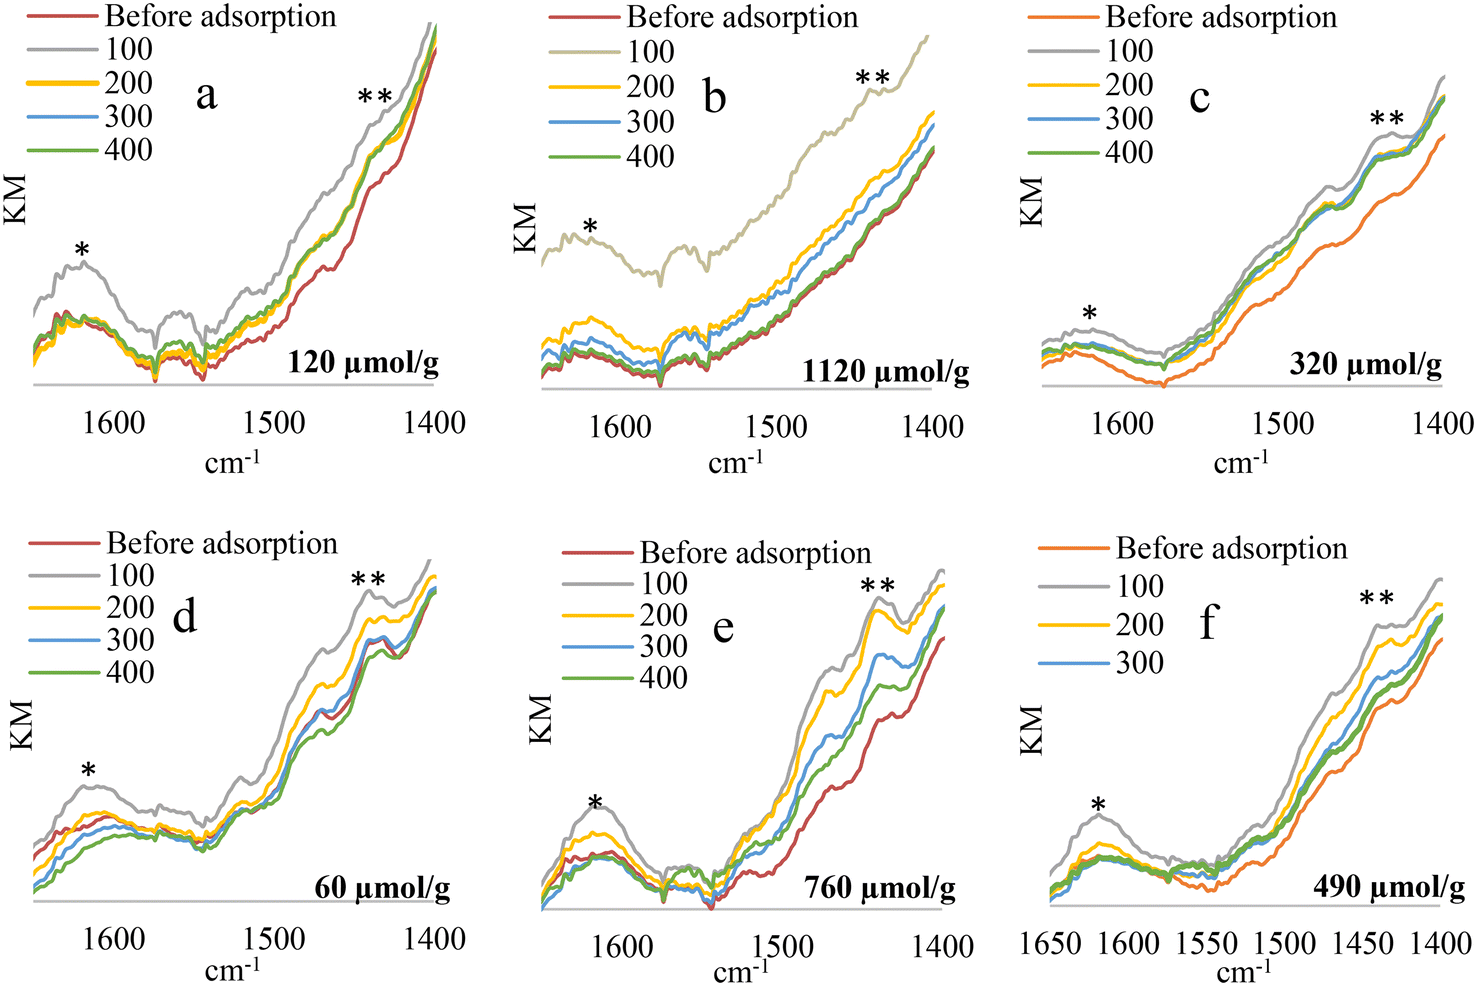 | ||
| Fig. 5 DRIFTS spectra of WI–Ni/DV and WI–Ni/Ha in their oxide form (a–d), WI–Ni/DV WI–Ni/Ha under reaction conditions (b–e) and AC–Ni/DV, AC–Ni/Ha under reaction conditions (c–f) after degassing, and desorption of NH3 at each of the different temperature. *Lewis-type acidity, **Brønsted-type acidity. | ||
The results presented up to here show that the best textural, reductive, and acidic properties are favored mainly by the “WI” method, the best material being obtained from “DV”, which, as will be discussed later, presents a direct relationship with the catalytic activity.
 | ||
| Fig. 6 HRTEM images of delaminated bentonite (DB), delaminated vermiculite (DV) and halloysite (Ha) with Ni catalysts, measured under reaction conditions. | ||
In all catalysts, the successful incorporation of Ni can be observed, which is found in its metallic form (under reaction conditions). The Ni in vermiculite presents the highest dispersions, which can be directly related to the previously reported lowest reduction temperatures, and although observing nickel under reaction conditions is an arduous task,28 this analysis allows for an approach to understanding the effect of the synthesis method and the type of support on the catalytic activity in hydroconversion reactions. A clear effect of the synthesis method is observed on the dispersion of the metallic particles, if the solids obtained by both conventional and microwave auto-combustion and those obtained by wet impregnation are compared, reflecting that the auto-combustion process is more advantageous compared to the wet impregnation method for obtaining a more homogeneous dispersion of the metal, regardless of the support chosen. These results are consistent with reports previously registered.39
In the case of the “DB” and “DV” supports, an irregular morphology associated with the opening of the natural mineral laminae is presented,83 generating edge–edge or edge–face type aggregates.84 On the other hand, in the case of materials obtained from halloysite, the nanotubular structure is observed, indicating that this structure of the material is maintained. Smaller particle sizes or greater dispersion, such as those observed when the support was vermiculite, regardless of the Ni impregnation method, are associated with greater catalytic activity.85 This effect is mainly attributed to a greater number of metallic sites on the surface, possibly generating a greater proximity between the acid sites, mainly favoring cracking reactions.86 Simultaneously, smaller sizes favor greater diffusion, according to kinetic studies.85
A superficial analysis of the chemical composition of the catalysts was carried out by means of EDX (Energy Dispersive X-ray) Fig. 7, obtaining in all the materials the presence of the characteristic elements of the clay laminae (Al, Si, O). The solids obtained from Ha and DV were selected (taking into account that they are the materials that presented the best and worst catalytic performance), and the Ni content was evaluated, taking into account that it has been reported that the Ni values in clay minerals are not detected by EDX.28
 | ||
| Fig. 7 EDX analysis of the different catalysts, a) AC–Ni/DB, b) AM–Ni/DB, c) WI–Ni/DB, d) AC–Ni/Ha, e) AM–Ni/Ha, f) WI–Ni/Ha, g) AC–Ni/DV, h) AM–Ni/DV, i) WI–Ni/DV. | ||
It was observed that in some cases the incorporated Ni values were very close to the nominal values (2%), again demonstrating the successful incorporation of Ni in the minerals.28 Notwithstanding and although the successful incorporation of Ni can be demonstrated regardless of the method and support used, it is observed in Fig. 7 that the % of incorporated Ni depends on the synthesis method used, verifying higher Ni values when wet impregnation is used compared to the auto-combustion methods, (in vermiculite 2.15% and 1.25% respectively and 1.78 and 1.19% for the case of Ni contents in halloysite by means of wet impregnation and auto-combustion respectively). This seems to indicate that when the auto-combustion method is used, part of the Ni can be sublimated, which could be associated with the migration of NiO species as discussed in TPR, favoring not only the diffusion of Ni, but also its possible loss from the catalyst surface.72 In contrast, bearing in mind that a factor that influences catalytic activity is the metallic phase,24 the phenomenon described here would seem to be a possible explanation for the higher catalytic activity found for catalysts obtained from vermiculite by the impregnation method, while for the materials obtained from DB and Ha, the autocombustion methods are those that generate an adequate balance of acid–metallic sites.
3.3. Hydroconversion of decane
 | ||
| Fig. 8 Conversion percentage based on temperature, for the solids obtained by the methods: a: “AC”, b: “AM”, c: “WI”. | ||
| Solid | T max conver. (°C) | T 50 conver. (°C) | % crac | T max iso (°C) | % iso | T 10 iso (°C) |
|---|---|---|---|---|---|---|
| a Temperature at which the maximum conversion of decane is reached (±3). b Temperature at which 50% conversion is reached. c Temperature with maximum isomerization. d Temperature with 10% isomerization. | ||||||
| Pt/Al2O3 | 300 | 270 | 68 | 300 | 54 | 240 |
| AC–Ni/BD | 275 | 240 | 99 | 225 | 5 | — |
| AC–Ni/Ha | — | 220 | 94 | 250 | 8 | — |
| AC–Ni/VD | 225 | 210 | 99 | 200 | 11 | 190 |
| AM–Ni/BD | 275 | 250 | 99 | 250 | 3 | — |
| AM–Ni/Ha | 300 | 270 | 95 | 275 | 12 | 270 |
| AM–Ni/VD | 225 | 210 | 99 | 200 | 12 | 190 |
| WI–Ni/BD | 350 | 260 | 99 | 275 | 19 | 260 |
| WI–Ni/Ha | — | 320 | 68 | 225 | 8 | — |
| WI–Ni/VD | 225 | 180 | 99 | 200 | 6 | — |
As reported, the supports in the absence of active phase do not exceed 20% conversion and the reaction without catalyst (only with SiC) is less than 2%, indicating the absence of thermal cracking.23,30,43 This allows for reaffirming that, under the reaction conditions, the process will be governed by a bifunctional mechanism, which involves acid sites (provided by the clay) and metallic sites (provided by the Ni). In this sense, it is observed that in most cases the incorporation of the metallic phase (Ni) greatly increases the conversion levels until reaching 100% at temperatures below 300 °C. This behavior indicates a catalytic performance superior to the reference catalyst (1% Pt/alumina, 100% conversion at 300 °C), except for the materials obtained from “Ha”. A clear effect of the impregnation method on the activity of the solids is observed, where the auto-combustion and microwave-assisted auto-combustion methods favor the best catalytic performance, without finding significant differences between the two mentioned methods, highlighting once again that this superior performance is only observed in the case of the solids synthesized from bentonite and halloysite. Evidently the effect of the impregnation method is related to the starting mineral used. In addition, there is a clear effect of the starting mineral on the catalytic activity. The solids obtained from “DV” show the highest activity regardless of the impregnation method used, reaching 100% conversion before 250 °C.
In the case of vermiculite, the impregnation method that most favored catalytic activity was “WI”, which is related to the best reductive and acidic properties found in this material. In the case of the auto-combustion methods, no significant differences were found between “AC” and “AM” when “DV” was used as the starting support. These results suggest that the acid sites found in vermiculite can be drastically affected by the high temperatures reached in the auto-combustion process, while when using “WI” impregnation, a greater number of acid sites is maintained, generating a greater proximity between these and the metallic sites, favoring the catalytic activity.86 In the case of the other two minerals, the few acid sites present in these materials are not remarkably affected by high temperatures, indicating that the metallic dispersion in this case favors the balance between metallic and acid sites, thus increasing the catalytic activity.86 On the other hand, the mineral that presented the lowest catalytic performance was halloysite, which, when the “WI” method was used, only approached 69% of total decane conversion. This behavior is related to the lower acid properties of this support compared to the other two minerals.19,30,39,44,57 Another possible explanation may be associated with the large pore sizes of “Ha”,44 which may be detrimental to a confinement effect,89 which is achieved in pores close to the dynamic radius of decane (0.4 nm–1.3 nm).
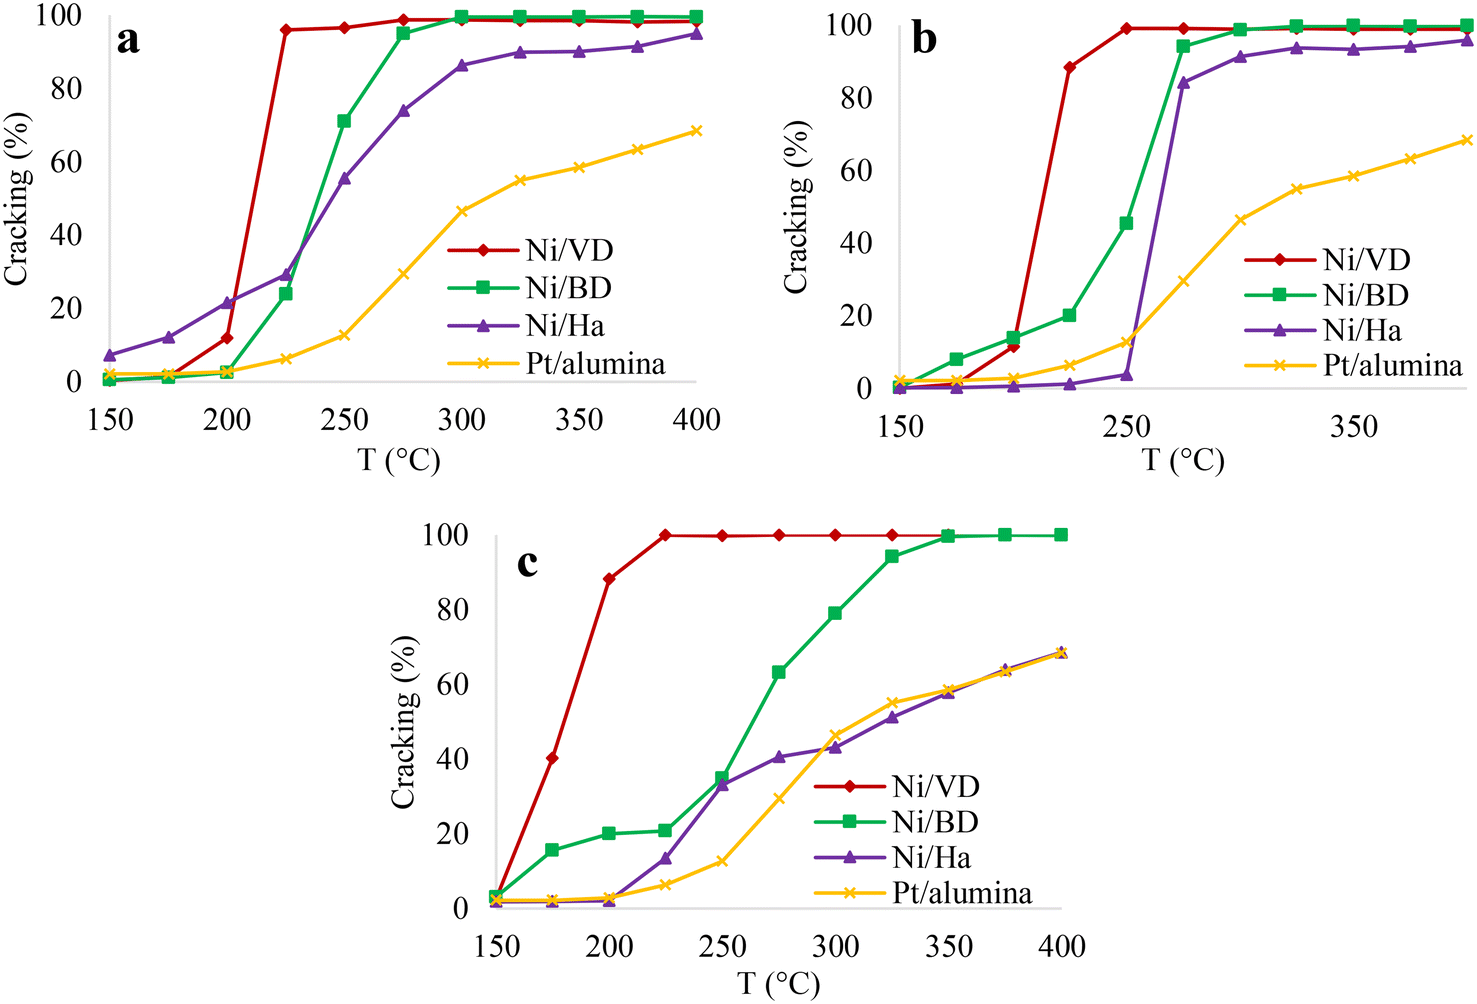 | ||
| Fig. 9 Percentage of cracking based on temperature, for the solids obtained by methods a: “AC”, b: “AM”, c: “WI”. | ||
This effect is related to the residence time of the intermediate compounds which, at lower pressures, have a short residence time and thus a rearrangement of the molecules is not achieved, thus reducing the isomerized products.90 Once again, it is evident that in the case of catalysts obtained from bentonite and halloysite, the “AC” and “AM” methods show the highest performance towards cracking products, without finding differences between these two methods. An effect of the starting mineral is also observed. In the case of vermiculite, the highest selectivity to cracking products is obtained, regardless of the Ni impregnation method, followed by bentonite and finally halloysite. However, with vermiculite, the method that most favored the formation of cracking products was that of “WI”. This behavior of “DV” can be associated with the greater number of acid sites found in that support and with this impregnation method, possibly generating a greater proximity between the acid and metallic sites and mainly favoring cracking reactions86 as has been discussed previously. In order to obtain more information on the adequate balance between the acid and metallic sites, the distribution of cracking products was carried out taking the products at 35% conversion, and, although there are a large amount of cracking products: i) mono-branched: 2-methylnonane, 3-methylnonane, 4-methylnonane, 5-methylnonane, ii) diramified: 2,2-dimethyloctane, 2,3-dimethyloctane, 2,4-dimethyloctane, 2,6-dimethyloctane, 2,7-dimethyloctane, 2,5-dimethyloctane, 3,4-dimethyloctane, 3,5-dimethyloctane, 3,3-dimethyloctane, 3,6-dimethyloctane, 4,4-dimethyloctane, 4,5-dimethyloctane and iii) triramified: methyl-ethylheptane91,92 these are generally grouped depending on the number of carbon atoms, as has been reported in the literature.7 The results are recorded in Fig. 10.
 | ||
| Fig. 10 Distribution of the carbon number of cracking products obtained at 35% n-decane hydrocracking conversion for the solids obtained by the methods of a: “AC”, b: “AM”, c: “WI”. | ||
It is evident that the catalysts obtained from bentonite and halloysite always present an adequate balance between the acid and metallic sites regardless of the method of incorporation of the metallic phase. However, in the case of catalysts obtained from “DV” by the “AC” and “AM” methods, there is a clear imbalance between the acid and metallic sites, indicated by the greater amount of C2 and C8 product obtained, which results from hydrogenolysis reactions. In the case of the catalyst obtained from “DV” by the “WI” method, it is clearly observed that the cracking products are centered on C5, which indicates an appropriate balance between the acid and metallic sites in this catalyst.
 | ||
| Fig. 11 Percentage of isomerization based on temperature, for the solids obtained by the methods of a: “AC”, b: “AM”, c: “WI”. | ||
On the other hand, it has been reported that the selectivity to the different isomers provides an idea of the pore size distribution and the textural characteristics of the catalyst, which can favor mono-branched isomers, when presenting microporosity, or di- or tri-branched isomers for the case of meso and macro porous systems.92 Obtaining di- or tri-branched isomers also provides an idea of the quantity and strength of the acid sites of the catalyst,93 because the same molecule repeatedly undergoes the processes of dehydrogenation-rearrangement of carbenium ions and hydrogenation, giving rise to more branched isomers and cracking products. In this sense, the main isomerized products that can be obtained for the decane molecule are: i) mono-branched isomers (2-methylnonane, 3-methylnonane, 4-methylnonane, 5-methylnonane), ii) diramified isomers (2,2-dimethyloctane, 2,3-dimethyloctane, 2,4-dimethyloctane, 2,6-dimethyloctane, 2,7-dimethyloctane, 2,5-dimethyloctane, 3,4-dimethyloctane, 3,5-dimethyloctane, 3,3-dimethyloctane, 3,6-dimethyloctane, 4,4-dimethyloctane, 4,5-dimethyloctane and iii) triramified isomers (methyl-ethylheptane).92
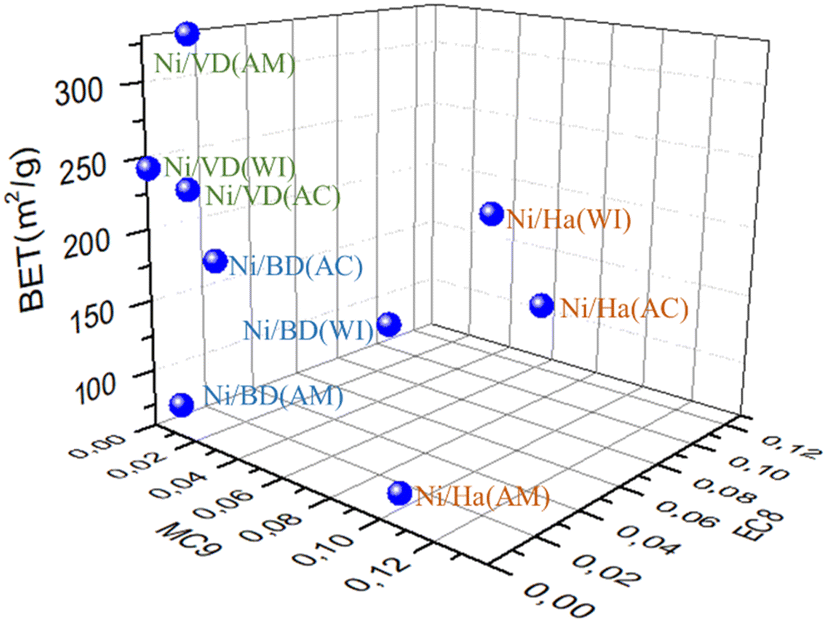 | ||
| Fig. 12 Relationship between selectivity to E-C8 and M-C9 at 175 °C and the surface area of the catalysts.95 | ||
It is clearly observed that the different catalysts are in different regions of the graph depending on the starting mineral and regardless of the Ni incorporation method, which indicates that the different impregnation methods do not significantly alter the properties of the starting minerals. On the other hand, a clear effect of the starting material is evident in the distribution of MC9 and MC8. In the case of materials obtained from vermiculite (DV), low MC9 and MC8 values were presented, indicating the possible presence of a large number of micropores in the material, as well as a large number of acid sites, which would favor a possible decane confinement effect by increasing catalytic activity.89
On the other hand, in the case of bentonite (DB), this is in a central region of the graph, which indicates the presence of both micro and mesopores, which concurs with the results obtained by N2 physisorption and the catalytic behavior. At the other end of the figure are the materials obtained from halloysite (solids that presented the least catalytic activity), which present a large amount of EC8 and is consistent with the mesoporosity present in these materials,44 since ethyl-octanes have a greater effective kinetic diameter than methylnonanes, and therefore their formation is favored upon increasing pore size.
3.4. Characterization of the solids following the reaction
 | ||
| Fig. 13 TGA and DSC analysis for materials before and after reaction, a and b) Ni/DB, c and d) Ni/DV and e and f) Ni/Ha. | ||
None of the catalysts exhibited coke formation, evidencing the absence of mass loss near 350 and 550 °C as well as the absence of signals in the DSC97 in comparison with the fresh materials. The absence of coke is associated with the reaction conditions. Also, it has recently been reported that the presence of mesopores favors the diffusion of the products, leading to superior catalytic behavior and lower coke content.96 The mesoporosity present in all the materials makes it difficult for coke to form on their surface. These results are associated with the catalytic mechanism. In this sense, the distance from the metal–acid sites can play a crucial role in the activity of the catalysts, a lesser trajectory between the metal groups and the acid sites would facilitate hydrogenation reactions. Thusly, the activity of a catalyst is a function of the total acidity, but it also depends on the proximity between the metallic and acid sites (favored when there are a greater number of acid sites), which can improve the catalytic performance favoring the obtaining of hydrogenolysis products that discourage the formation of coke.86 The absence of coke on the surface of the materials indicates that the materials can exhibit high resistance to carbon poisoning and can be re-used.
Notwithstanding, the analysis presented here is not conclusive regarding the formation of carbonaceous deposits on the surface of the solid. This is attributed to the presence of confined species masking the results obtained in the analysis of catalysts used by means of TGA.96 Therefore, for further analysis and better understanding of the possible deactivation of catalysts due to coke formation, post-reaction materials were evaluated using RAMAN and IR as illustrated below.
 | ||
| Fig. 14 Micrographs of the solids analyzed by Raman, for the materials before and after reaction WI–Ni/Ha (upper) WI–Ni/DB (lower) and Raman spectra for WI–Ni/Ha (upper) WI–Ni/DB (lower) before and after reaction. | ||
In both cases, for the solids before reaction, no signals were found associated with Ni or with the metallic species typical of clay minerals, which may be related to a phenomenon of fluorescence,98 or to the absence of Ni oxides on the surface of materials. In this sense, a band around 525 cm−1 would indicate the presence of NiO agglomerates, which in this case is not observed, suggesting that the incorporated Ni could possibly be highly dispersed,99 which correlates with what was discussed by XRD and what has been observed by HRTEM. Nevertheless, it should be noted that the inherent nature of NiO makes it difficult to detect by means of Raman, even if it is quite crystalline.99
On the other hand, with the WI–Ni/Ha catalyst, a signal is evidenced at 1600 cm−1 (Fig. 14), which could be related to the formation of carbon attributed to the emergence of carbon phases such as graphite or amorphous “diamond-like-carbon” (DLC).100 Furthermore, the formation of carbon becomes evident when microscopes of the WI–Ni/Ha post-reaction catalyst are observed. In actuality, the materials before the reaction have a light tone, and after the reaction, dark solids are obtained, attributed to the formation of carbon on their surface. The results obtained for WI–Ni/DB show the absence of signals that can be attributed to carbon. These results can be extrapolated to the rest of the solids in the present study, where the catalytic activity was higher. In this case, after the reaction, the materials are much less dark than those of Ha.
 | ||
| Fig. 15 IR spectra obtained for the different catalysts before and after reaction, a) WI–Ni/DB and AC–Ni/DB before and after reaction, b) representative spectra of all solids before and after reaction. | ||
On the other hand, an interesting phenomenon is observed in the DB family. In all cases, the catalysts post-reaction showed a decrease in most of the bands associated with clay minerals (the main bands are illustrated in Fig. 15).30 The vibration with the greatest decrease is found at 3600–3650 cm−1 l which is associated with SiOH groups close to aluminum in tetrahedral coordination and AlOH species.30 The decrease in this band indicates a dehydrogenation of the materials during the reaction,101 which can be correlated with the acid properties of the materials, necessary for this process to take place (Brønsted acid sites). Finally, Fig. 15b illustrates the IR results in a representative way for all the solids obtained prior to the reaction as well as post-reaction, where the disappearance of the 3600–3650 cm−1 signal becomes evident.
Conclusions
The influence of the Ni incorporation method by means of auto-combustion, microwave-assisted auto-combustion and wet impregnation was demonstrated in the catalysts obtained with different supports (modified bentonite, vermiculite and halloysite), obtaining active solids in the n-decane hydroconversion reaction.The catalysts obtained from vermiculite presented higher conversions compared to the other two clay minerals, attributed to the intrinsic acid nature of vermiculite (superior to the others).
The wet impregnation method favored the textural, reductive, and acid characteristics of the solids, especially those obtained from vermiculite, where the WI–Ni/DV catalyst was the most active. This method contributes to preserving the acid sites of the material, in addition to favoring smaller particle sizes and greater reducibility.
All the catalysts were active mainly in hydrocracking reactions, being superior even to the reference material (Pt/Al2O3).
The catalysts presented a low formation of carbon deposits, attributed to the excellent textural and catalytic properties that favor the hydrogenation reaction, indicating a high stability and the possibility of reusing the catalysts.
The materials synthesized from natural clay minerals offer a promising pathway for the development of catalysts in alkane hydroconversion reactions, generating economic and environmentally friendly catalysts.
Author contributions
Jahaziel Amaya: conceptualization; data curation; formal analysis; original draft; writing. Cesar Calderón: conceptualization; data curation; formal analysis. Rafael Molina: conceptualization; funding acquisition; project administration; writing – review & editing. Sonia Moreno: conceptualization; funding acquisition; project administration; writing – review & editing.Conflicts of interest
There are no conflicts to declare.Acknowledgements
This research was carried out thanks to the financial support of the Universidad Nacional de Colombia through the Hermes 41247 project and others.References
- Y. Tan, W. Hu, Y. Du and J. Li, Appl. Catal., A, 2021, 611, 117916 CrossRef CAS.
- Z. Cao, X. Zhang, C. Xu, X. Huang, Z. Wu, C. Peng and A. Duan, J. Energy Chem., 2021, 52, 41–50 CrossRef CAS.
- M. V. Bukhtiyarova, A. V. Toktarev, M. O. Kazakov, E. G. Kodenev, V. Y. Pereyma, A. A. Gabrienko, A. V. Bukhtiyarov and G. V. Echevsky, Appl. Catal., A, 2020, 598, 117573 CrossRef CAS.
- J. Sun, Y. Li, C. Mu, J. Wei, Y. Zhao, X. Ma and S. Wang, Appl. Catal., A, 2020, 598, 117556 CrossRef CAS.
- M. Zhang, L. Wang, Y. Chen, Q. Zhang and C. Liang, J. Energy Chem., 2016, 25, 539–544 CrossRef.
- J. A. Martens, M. Tielen, P. A. Jacobs and J. Weitkamp, Zeolites, 1984, 4, 98–107 CrossRef CAS.
- E. Verheyen, C. Jo, M. Kurttepeli, G. Vanbutsele, E. Gobechiya, T. I. Korányi, S. Bals, G. Van Tendeloo, R. Ryoo, C. E. A. Kirschhock and J. A. Martens, J. Catal., 2013, 300, 70–80 CrossRef CAS.
- H. Jin, X. Yi, X. Sun, B. Qiu, W. Fang, W. Weng and H. Wan, Fuel, 2010, 89, 1953–1960 CrossRef CAS.
- L. Carlos, D. De Oliveira and R. Caetano, Fuel, 2017, 209, 521–528 CrossRef.
- X.-T. Ren, N. Li, J.-Q. Cao, Z.-Y. Wang, S.-Y. Liu and S.-H. Xiang, Appl. Catal., A, 2006, 298, 144–151 CrossRef CAS.
- Y. Rezgui and M. Guemini, Appl. Catal., A, 2005, 282, 45–53 CrossRef CAS.
- M. Roussel, S. Norsic, J.-L. Lemberton, M. Guisnet, T. Cseri and E. Benazzi, Appl. Catal., A, 2005, 279, 53–58 CrossRef CAS.
- A. Palčić and V. Valtchev, Appl. Catal., A, 2020, 606, 117795 CrossRef.
- S. Triwahyono, A. A. Jalil, S. M. Izan, N. S. Jamari and N. A. A. Fatah, J. Energy Chem., 2019, 37, 163–171 CrossRef.
- H. Imai, M. Abe, K. Terasaka, H. Yamazaki, R. Osuga, J. N. Kondo and T. Yokoi, Fuel Process. Technol., 2020, 197, 106182 CrossRef CAS.
- P. Y. Looi, A. R. Mohamed and C. T. Tye, Chem. Eng. J., 2012, 181–182, 717–724 CrossRef CAS.
- P. A. Nikulshin, V. A. Salnikov, A. V. Mozhaev, P. P. Minaev, V. M. Kogan and A. A. Pimerzin, J. Catal., 2014, 309, 386–396 CrossRef CAS.
- A. Patrigeon, E. Benazzi, C. Travers and J. Y. Bernhard, Catal. Today, 2001, 65, 149–155 CrossRef CAS.
- J. Amaya, N. Suárez, A. Moreno, S. Moreno and R. Molina, New J. Chem., 2020, 2966–2979 RSC.
- A. Castro, J. Amaya, R. Molina and S. Moreno, Catal. Today, 2019, 356, 284–294 CrossRef.
- E. J. M. Hensen, D. G. Poduval, D. A. J. M. Ligthart, J. A. R. Van Veen and M. S. Rigutto, J. Phys. Chem. C, 2010, 114, 8363–8374 CrossRef CAS.
- R. Kumar, B. S. Rana, D. Verma, S. Rayaroth, V. S. Prasad and A. K. Sinha, RSC Adv., 2015, 5, 39342–39349 RSC.
- J. A. Torres-Luna, S. Moreno, R. Molina and J. G. Carriazo, Energy Fuels, 2019, 33, 12647–12655 CrossRef CAS.
- D. Romero, R. Rohling, L. Meng, M. Rigutto and E. J. M. Hensen, J. Catal., 2021, 394, 284–298 CrossRef CAS.
- J. Behin, H. Kazemian and S. Rohani, Ultrason. Sonochem., 2016, 28, 400–408 CrossRef CAS PubMed.
- Y. Rezgui and M. Guemini, Appl. Catal., A, 2010, 374, 31–40 CrossRef CAS.
- D. Karthikeyan, N. Lingappan, B. Sivasankar and N. J. Jabarathinam, Appl. Catal., A, 2008, 345, 18–27 CrossRef CAS.
- K. Wijaya, M. A. Kurniawan, W. D. Saputri, W. Trisunaryanti, M. Mirzan, P. L. Hariani and A. D. Tikoalu, J. Environ. Chem. Eng., 2021, 9, 105399 CrossRef CAS.
- J. Amaya, S. Moreno and R. Molina, in Heterogeneous Catalysis for Energy Applications, ed. J. A. O. Tomas and R. Reina, Royal Society of Chemistry, 2020, pp. 16–45 Search PubMed.
- J. Amaya, L. Bobadilla, L. Azancot, M. Centeno, S. Moreno and R. Molina, Mater. Res. Bull., 2020, 123, 110728 CrossRef CAS.
- E. Gutierrez-Acebo, C. Leroux, C. Chizallet, Y. Schuurman and C. Bouchy, ACS Catal., 2018, 8, 6035–6046 CrossRef CAS.
- J. Amaya, S. Moreno and R. Molina, Appl. Catal., B, 2021, 297, 120464 CrossRef CAS.
- J. Huang, A. Veksha, W. P. Chan and G. Lisak, Appl. Catal., A, 2021, 622, 118222 CrossRef CAS.
- A. Bonnin, J.-D. Comparot, Y. Pouilloux, V. Coupard, D. Uzio and L. Pinard, Appl. Catal., A, 2021, 611, 117974 CrossRef CAS.
- M. H. Castaño, R. Molina and S. Moreno, Appl. Catal., A, 2015, 492, 48–59 CrossRef.
- S. Pengnarapat, P. Ai, P. Reubroycharoen, T. Vitidsant, Y. Yoneyama and N. Tsubaki, J. Energy Chem., 2018, 27, 432–438 CrossRef.
- J. Huang, Z. Teng, R. Kang, F. Bin, X. Wei, Q. Hao, K. Nam Hui, K. San Hui and B. Dou, Fuel, 2021, 292, 120289 CrossRef CAS.
- O. H. Ojeda-Niño, F. Gracia and C. Daza, Ind. Eng. Chem. Res., 2019, 58, 7909–7921 CrossRef.
- J. C. Cortés, M. Muñoz, L. Macías, R. Molina and S. Moreno, Catal. Today, 2017, 296, 205–213 CrossRef.
- T. Missana, U. Alonso and M. García-Gutiérrez, Chemosphere, 2021, 272, 129877 CrossRef CAS.
- R. A. Schoonheydt, C. T. Johnston and F. Bergaya, Dev. Clay Sci., 2018, 9, 1–21 CAS.
- A. Y. Sidorenko, Y. M. Kurban, I. V. Il'ina, N. S. Li-Zhulanov, D. V. Korchagina, O. V. Ardashov, J. Wärnå, K. P. Volcho, N. F. Salakhutdinov, D. Y. Murzin and V. E. Agabekov, Appl. Catal., A, 2021, 618, 118144 CrossRef CAS.
- J. Amaya, L. Bobadilla, L. Azancot, M. Centeno, S. Moreno and R. Molina, J. Mater. Sci., 2020, 55, 6482–6501 CrossRef CAS.
- J. A. Torres-Luna, S. Moreno, R. Molina and J. G. Carriazo, Energy Fuels, 2018, 32, 9782–9792 CrossRef CAS.
- P. C. Carman, Proc. R. Soc. London, Ser. A, 1951, 209, 69–81 CAS.
- J. Hua, J. Environ. Chem. Eng., 2018, 6, 156–168 CrossRef CAS.
- N. Cai, X. Li, S. Xia, L. Sun, J. Hu, P. Bartocci, F. Fantozzi, P. T. Williams, H. Yang and H. Chen, Energy Convers. Manage., 2021, 229, 113794 CrossRef CAS.
- M. A. Álvarez, L. F. Bobadilla, V. Garcilaso, M. A. Centeno and J. A. Odriozola, J. CO2 Util., 2018, 24, 509–515 CrossRef.
- C. Sunyol, R. E. Owen, M. D. González, P. Salagre and Y. Cesteros, Appl. Catal., A, 2021, 611, 117903 CrossRef CAS.
- Y. Wang, Y. Zhu, H. Wang and G. Feng, J. Energy Chem., 2015, 24, 512–519 CrossRef.
- M. R. Abukhadra, A. Adlii and B. M. Bakry, Int. J. Biol. Macromol., 2019, 126, 402–413 CrossRef CAS PubMed.
- V. Krupskaya, L. Novikova, E. Tyupina, P. Belousov, O. Dorzhieva, S. Zakusin, K. Kim, F. Roessner, E. Badetti, A. Brunelli and L. Belchinskaya, Appl. Clay Sci., 2019, 172, 1–10 CrossRef CAS.
- A. Campos, B. Gagea, S. Moreno, P. Jacobs and R. Molina, Appl. Catal., A, 2008, 345, 112–118 CrossRef CAS.
- X.-Q. Xu, R. Xu, X.-B. Cheng, Y. Xiao, H.-J. Peng, H. Yuan and F. Liu, J. Energy Chem., 2021, 56, 391–394 CrossRef CAS.
- A. Węgrzyn, W. Stawiński, O. Freitas, K. Komędera, A. Błachowski, Ł. Jęczmionek, T. Dańko, G. Mordarski and S. Figueiredo, Appl. Clay Sci., 2018, 155, 37–49 CrossRef.
- K. A. Carrado, Appl. Clay Sci., 2000, 17, 1–23 CrossRef CAS.
- J. Amaya, N. Suarez, A. Moreno, S. Moreno and R. Molina, Catal. Today, 2019, 356, 271–283 CrossRef.
- J. Kurczewska, M. Cegłowski and G. Schroeder, Int. J. Biol. Macromol., 2019, 123, 398–408 CrossRef CAS PubMed.
- Y. M. Kwon, J. Kim, K. Y. Cho and S. Yoon, J. Energy Chem., 2021, 60, 334–340 CrossRef CAS.
- M. R. Shaik, M. Bissannagari, Y. M. Kwon, K. Y. Cho, J. Kim and S. Yoon, Chem. Eng. J., 2021, 424, 130326 CrossRef CAS.
- F. Shen, T. Guo, C. Bai, M. Qiu and X. Qi, Fuel Process. Technol., 2018, 169, 244–247 CrossRef CAS.
- J. Lee, S. Hwang, J. G. Seo, S.-B. Lee, J. C. Jung and I. K. Song, J. Ind. Eng. Chem., 2010, 16, 790–794 CrossRef CAS.
- Y. Cardona, S. A. Korili and A. Gil, Chem. Eng. J., 2021, 425, 130708 CrossRef CAS.
- M. H. Castaño, R. Molina and S. Moreno, J. Mol. Catal. A: Chem., 2015, 398, 358–367 CrossRef.
- Z. Liu, F. Yu, K. Pan, X. Zhou, R. Sun, J. Tian, Y. Wan, J. Dan and B. Dai, Chem. Eng. J., 2021, 422, 130099 CrossRef CAS.
- S. Zhao, Z. Meng, X. Fan, R. Jing, J. Yang, Y. Shao, X. Liu, M. Wu, Q. Zhang and A. Liu, Chem. Eng. J., 2020, 390, 124554 CrossRef CAS.
- J. A. Torres-Luna, J. G. Carriazo and N. R. Sanabria, Environ. Technol., 2016, 37, 1346–1356 CrossRef CAS PubMed.
- L. Frattini, M. A. Isaacs, C. M. A. Parlett, K. Wilson, G. Kyriakou and A. F. Lee, Appl. Catal., B, 2017, 200, 10–18 CrossRef CAS.
- X. Liu, Y. Zhang, Z. Wang, B. Zhang, Z. Yao, Z. Wang, X. Li, H. Wang and M. Hu, Chem. Eng. J., 2018, 346, 600–605 CrossRef CAS.
- M. J. Angeles, C. Leyva, J. Ancheyta and S. Ramírez, Catal. Today, 2014, 220–222, 274–294 CrossRef CAS.
- I. V. Shamanaev, A. O. Suvorova, E. Y. Gerasimov, V. P. Pakharukova, M. A. Panafidin, I. V. Yakovlev and G. A. Bukhtiyarova, Catal. Today, 2021, 378, 24–32 CrossRef CAS.
- T. Li, J. Zhang, X. Xie, X. Yin and X. An, Fuel, 2015, 143, 55–62 CrossRef CAS.
- C. E. Daza, O. A. Gamba, Y. Hernández, M. A. Centeno, F. Mondragón, S. Moreno and R. Molina, Catal. Lett., 2011, 141, 1037–1046 CrossRef CAS.
- A. Jasik, R. Wojcieszak, S. Monteverdi, M. Ziolek and M. M. Bettahar, J. Mol. Catal. A: Chem., 2005, 242, 81–90 CrossRef CAS.
- R. G. Kukushkin, P. M. Yeletsky, C. T. Grassin, B.-H. Chen, O. A. Bulavchenko, A. A. Saraev and V. A. Yakovlev, Chem. Eng. J., 2020, 396, 125202 CrossRef CAS.
- V. T. Sagar and A. Pintar, Appl. Catal., A, 2020, 599, 117603 CrossRef.
- H. Li, J. Pang, N. R. Jaegers, L. Kovarik, M. Engelhard, A. W. Savoy, J. Hu, J. Sun and Y. Wang, J. Energy Chem., 2021, 54, 7–15 CrossRef CAS.
- C. E. Webster, R. S. Drago and M. C. Zerner, J. Am. Chem. Soc., 1998, 120, 5509–5516 CrossRef CAS.
- D. Liu, P. Yuan, H. Liu, J. Cai, D. Tan, H. He, J. Zhu and T. Chen, Appl. Clay Sci., 2013, 80–81, 407–412 CrossRef CAS.
- L. Zhang, G. Xi, Z. Chen, D. Jiang, H. Yu and X. Wang, Chem. Eng. J., 2017, 307, 868–876 CrossRef CAS.
- R. C. Moore and D. M. Reynolds, in X-Ray Diffraction and the Identification and Analysis of Clay Minerals, Oxford University Press, 2nd edn, 1997 Search PubMed.
- W. Liu, L. Li, S. Lin, Y. Luo, Z. Bao, Y. Mao, K. Li, D. Wu and H. Peng, J. Energy Chem., 2022, 65, 34–47 CrossRef CAS.
- X. Wen, Z. Zeng, C. Du, D. Huang, G. Zeng, R. Xiao, C. Lai, P. Xu, C. Zhang, J. Wan, L. Hu, L. Yin, C. Zhou and R. Deng, Chemosphere, 2019, 222, 865–871 CrossRef CAS PubMed.
- J. Liu, X.-Q. Wang, B.-B. Yang, C.-L. Liu, C.-L. Xu and W.-S. Dong, Renewable Energy, 2018, 120, 231–240 CrossRef CAS.
- W. Wang, C.-J. Liu and W. Wu, Catal. Sci. Technol., 2019, 9, 4162–4187 RSC.
- J. Zecevic, G. Vanbutsele, K. P. de Jong and J. A. Martens, Nature, 2015, 528, 245–248 CrossRef CAS PubMed.
- B. Browning, I. Pitault, F. Couenne, T. Jansen, M. Lacroix, P. Alvarez and M. Tayakout-Fayolle, Chem. Eng. J., 2019, 377, 119811 CrossRef CAS.
- J. Weitkamp, ChemCatChem, 2012, 4, 292–306 CrossRef CAS.
- P. Sazama, J. Pastvova, D. Kaucky, J. Moravkova, J. Rathousky, I. Jakubec and G. Sadovska, J. Catal., 2018, 364, 262–270 CrossRef CAS.
- B. H. Cooper and B. B. L. Donnis, Appl. Catal., A, 1996, 137, 203–223 CrossRef CAS.
- Y. Tian, B. Zhang, H. Liang, X. Hou, L. Wang, X. Zhang and G. Liu, Appl. Catal., A, 2019, 572, 24–33 CrossRef CAS.
- J. A. Martens, P. A. Jacobs and J. Weitkamp, Appl. Catal., 1986, 20, 283–303 CrossRef CAS.
- N. Batalha, L. Pinard, C. Bouchy, E. Guillon and M. Guisnet, J. Catal., 2013, 307, 122–131 CrossRef CAS.
- M. Heuchel, C. Dörr, R. Boldushevskii, S. Lang, E. Klemm and Y. Traa, Appl. Catal., A, 2018, 553, 91–106 CrossRef CAS.
- J. A. Martens, D. Verboekend, K. Thomas, G. Vanbutsele, J. Pérez-ramírez and J. Gilson, Catal. Today, 2013, 218–219, 135–142 CrossRef CAS.
- M. Díaz, E. Epelde, J. Valecillos, S. Izaddoust, A. T. Aguayo and J. Bilbao, Appl. Catal., B, 2021, 291, 120076 CrossRef.
- M. A. Salam, K. Ahmed, N. Akter, T. Hossain and B. Abdullah, Int. J. Hydrogen Energy, 2018, 43, 14944–14973 CrossRef CAS.
- S. Prasad, S. Bansal and S. P. Pandey, Mater. Today: Proc., 2022, 49, 3022–3027 CAS.
- X. Fan, D. Liu, Z. Zhao, J. Li and J. Liu, Catal. Today, 2020, 339, 67–78 CrossRef CAS.
- S. Muninathan and S. Arumugam, Int. J. Hydrogen Energy, 2021, 46, 6532–6546 CrossRef CAS.
- M. Asgari, G. Vitale and U. Sundararaj, Appl. Clay Sci., 2021, 205, 106064 CrossRef CAS.
Footnote |
| † Current address: Facultad de Ciencias, Universidad Antonio Nariño, Bogotá D. C 110231, Colombia. |
| This journal is © The Royal Society of Chemistry 2023 |