 Open Access Article
An ‘active site anchoring’ strategy for the preparation of PBO fiber derived carbon catalyst towards an efficient oxygen reduction reaction and zinc–air batteries†
Weihua Zhong*ab,
Zuoxu Xiao b,
Yunjun Luo
 *a,
Dianbo Zhangb,
Xiangdong Chenb and
Jinwang Baib
aSchool of Materials Science & Engineering, Beijing Institute of Technology, 100081, Beijing, China. E-mail: yjluo@bit.edu.cn
bShandong Institute of Nonmetallic Materials, Jinan, 250031, Shandong, China
First published on 14th December 2023
Abstract
In order to promote the wide application of clean energy-fuel cells, it is urgent to develop transition metal-based high-efficiency oxygen reduction reaction (ORR) catalytic materials with a low cost and available rich raw material resources to replace the currently used precious metal platinum-based catalytic materials. Herein, a novel ‘active-site-anchoring’ strategy was developed to synthesize highly-activated carbon-based ORR catalysts. Firstly, poly(p-phenylene benzobisoxazole) (PBO) fiber with a stable chemical structure was selected as the main precursor, and iron was complexed on its surface, and then poly-dopamine (PDA) was coated on the surface of PBO–Fe to form a PBO–Fe–PDA composite structure. Therefore, carbon-based catalyst PBO–Fe–PDA-900 with abundant Fe2O3 active sites was prepared by anchoring iron sites by PDA after pyrolysis. As a result, the PBO–Fe–PDA-900 catalyst displayed a 30 mV higher half-wave potential (0.86 V) than that of a commercial Pt/C electrocatalyst. Finally, PBO–Fe–PDA-900 was used as a cathode material for zinc–air batteries, showing a high peak power density superior to Pt/C. This work offers new prospects for the design of efficient, non-precious metal-based materials in zinc–air batteries.
Introduction
With the rapid development of society, the environmental pollution and energy shortage caused by the extensive use of traditional fossil fuels (coal, oil and natural gas) by mankind have generated much interest towards renewable and environment-friendly energy systems, including hydrogen–oxygen fuel cells and metal–air batteries.1–5 In the above devices, the oxygen reduction reaction (ORR) is an indispensable key step. However, the ORR is a multi-electron reaction process, and its slow reaction kinetics severely hinders the performance of various renewable energy systems. Up to now, platinum-based materials are the best electrocatalyst for the ORR because of their low overpotential. However, the high price, high scarcity and poor durability seriously limit the large-scale production and commercial application of platinum-based materials.6,7 Therefore, researchers are committed to obtaining platinum-free catalysts with a high activity and low costs, such as transition metal oxides, transition metal-modified carbon materials and heteroatom-doped carbon materials.8–12 Among them, iron/nitrogen co-doped carbon-based (Fe/N–C) electrocatalysts are considered the most promising ORR catalytic material to replace platinum because of their low cost, good conductivity, and high catalytic activity.13–15 Iron/nitrogen–carbon electrocatalysts are usually prepared by the physical mixing of iron salts and carbon and nitrogen precursor compounds, followed by pyrolyzing at a high temperature.16,17 Although this synthetic method is relatively simple, it is difficult to control the effective loading of active sites, which leads to their uneven distribution or obvious phase separation from the carbon matrix, thus destroying the catalytic activity and stability of the corresponding catalysts.18 Therefore, it is very important to prepare catalysts with various separated active sites by reasonably designing precursors to promote the ORR process. Jiang et al. proposed a kind of MOF-based Fe monatomic electrocatalyst with a high loading capacity assisted by the SiO2 nano-casting method. By introducing SiO2 into MOF–PCN-222(Fe), a thermally stable FeN4/SiO2 interface can be formed, which can increase the migration energy barrier of Fe atoms and inhibit the aggregation of Fe atoms during pyrolysis. The prepared catalyst FeSA–N–C has an excellent ORR performance in both alkaline and acidic electrolytes.19 Although using a template can help maintain the structural stability of the precursor, there are also some problems, such as the template is difficult to be removed after the reaction and the nitrogen component is difficult to be effectively fixed during pyrolysis. Some researchers used water-soluble carrageenan as the precursor for preparing carbon-based catalysts. The carrageenan solution was cooled to room temperature at 80 °C and converted into carrageenan gel. The aerogel obtained by freeze-drying was pyrolyzed at 700 °C and converted into carbon aerogels, and the active sites were dispersed through the porous characteristics of aerogel. However, the aerogel structure is unstable during pyrolysis and will collapse and agglomerate.The high conjugation of poly(p-phenylene benzobisoxazole) (PBO) fiber provides suitable structural properties for the preparation of carbon-based catalysts by high-temperature pyrolysis, which can reduce the degradation of the structure during pyrolysis, and can gently realize the transformation from precursors with specific chemical composition to carbon materials, which is beneficial for the maintenance of the molecular composition and morphological structure of the precursors. At the same time, the uniform distribution of nitrogen atoms in PBO facilitates the preparation of carbon materials doped with nitrogen atoms. The addition of nitrogen atoms can reduce the band gap and increase the charge mobility of the graphite lattice, which is conducive to catalyzing the ORR process.
Taking these aspects into account, we herein present a novel strategy of ‘active site anchoring’ by leveraging the spatial isolation of polymers to separate and safeguard the Fe active sites, thereby enhancing the oxygen reduction performance of the prepared catalysts. By growing a layer of PDA on the surface of PBO fibers modified with Fe ions, we fabricated a PBO–Fe–PDA composite structure, in which Fe atoms were anchored in situ. This unique structure of the precursor effectively circumvents the sintering of Fe sites during the pyrolysis process, resulting in the formation of evenly distributed Fe2O3 nanoparticles on the surface of the PBO–Fe–PDA-900 catalyst. Consequently, PBO–Fe–PDA-900 demonstrates superior ORR catalytic efficiency with a half-wave potential (E1/2) of 0.89 V under 0.1 M KOH. The primary zinc–air battery based on PBO–Fe–PDA-900 exhibits a high peak power density of 78 mW cm−2, which is also superior to that of Pt/C.
Experimental section
Pretreatment of the PBO fiber
Before coordination modification, PBO fibers were placed in a beaker, and then a certain amount of acetone was added to soak the fibers, and they were cleaned in an ultrasonic cleaner for 3 hours to remove the pollutants and oily coating on the fiber surface. Finally, the cleaned PBO fiber was dried at 100 °C for later use.Synthesis of the PBO–Fe
1 g of FeCl3 was added to a glass reactor containing 100 mL of an EtOH–H2O mixture (H2O 30 mL), then 40 g PBO fiber was added, and the mixture was heated to 50 °C, under stirring, and reacted for 6 hours to coordinate Fe ions on the surface of the PBO fiber, and the prepared PBO–Fe sample was cleaned and dried for later use.Synthesis of the PBO–Fe–PDA
0.20 g of dopamine hydrochloride was added into 100 mL H2O for ultrasonic dissolution, then 0.12 g of trimethylaminomethane was added into the solution to adjust the pH value of the solution, and then 0.5 g of PBO–Fe was completely immersed into the dopamine hydrochloride aqueous solution and reacted for 24 h so that the PDA could coat on the surface of PBO–Fe to obtained PBO–Fe–PDA.Synthesis of the PBO–Fe–PDA-900 catalyst
The obtained PBO–Fe–PDA precursor was pyrolyzed at 900 °C for 2 h in an N2 atmosphere. After cooling, the target sample PBO–Fe–PDA-900 was obtained. Meanwhile, PBO-900 and PBO–Fe-900 were synthesized by pyrolyzing PBO and PBO–Fe precursors, respectively. The preparation procedure for PBO–Fe–PDA-900 is shown in Scheme 1.Results and discussion
Chemical characterization
As displayed in Fig. 1a and b, the scanning electron microscopy (SEM) image of the self-made PBO fiber showed that the diameter of the PBO fiber was about 12 μm, the thickness was uniform, and the surface was smooth. In addition, the mapping images exposed homogeneous allocation of Fe, N, and C elements on the PBO fiber surface, Fig. 1c. After the PBO fiber was complexed with Fe ion, the surface morphology of the PBO–Fe sample was almost unchanged compared with the PBO fiber, but Fe element appeared in the mapping images of PBO–Fe sample, which indicated that Fe ion was successfully complexed to the surface of PBO fiber, Fig. 1d–f. Furthermore, polydopamine (PDA) coating was grown on the surface of PBO–Fe to obtain the PBO–Fe–PDA samples. Compared with the PBO fiber and PBO–Fe samples, the surface morphology of the PBO–Fe–PDA samples changed greatly, and there were obvious PDA nanoparticles on the surface, which indicated the successful coating of PDA, Fig. 1g–i. After PBO–Fe–PDA was modified, the surface of the PBO–Fe–PDA showed remarkable roughness. The PDA nanospheres, with a particle size of approximately 50 nm, were uniformly loaded onto the surface of the PBO fiber, resulting in a dense coating that slightly augmented the diameter of the PBO fiber. Simultaneously, a small number of the larger PDA nanospheres were present on the surface of PBO–Fe–PDA. These nanospheres were generated by the polymerization of PDA that was not adsorbed on the PBO fiber in the reaction solution and was adsorbed on the fiber surface after the reaction.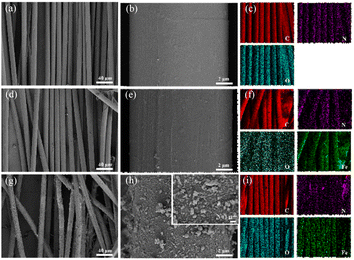 | ||
| Fig. 1 (a)–(c) SEM and elemental mapping images of PBO; (d)–(f) SEM and elemental mapping images of PBO–Fe; (g)–(i) SEM and elemental mapping images of PBO–Fe–PDA. | ||
PBO, PBO–Fe, and PBO–Fe–PDA precursors were then pyrolyzed at 900 °C to transform them into carbon-based catalysts (noted as PBO-900, PBO–Fe-900, and PBO–Fe–PDA-900). The SEM images show the surface morphology and microstructures of the as-prepared catalysts. As depicted in Fig. 2a, c and e, the PBO-900, PBO–Fe-900, and PBO–Fe–PDA-900 showed fibrous structures similar to the PBO fiber, indicating that the conjugate structure of PBO was highly stable and could be smoothly transformed into carbon-based materials during pyrolysis. However, in the enlarged view of Fig. 2b, it can be seen that there are many pores on the surface of the PBO-900 catalyst, which were formed by the structural rearrangement during the process of H and O elements leaving and forming graphite structures. It is further seen that the surface pores of the PBO–Fe-900 catalyst were significantly larger than the PBO-900 catalyst (Fig. 2d), the addition of Fe can promote the graphitization during the pyrolysis process of organic materials, thus forming more obvious pores because of the introduction of Fe enhances the dehydrogenation and condensation of polycyclic aromatic compounds, thereby facilitating the graphitization of organic materials during pyrolysis. Simultaneously, the promoted chemical structure rearrangement generates more pronounced pores.20–23 Although the pore size on the surface of the PBO–Fe–PDA-900 catalyst prepared by the PDA coating method is smaller than that of the PBO–Fe-900 catalyst, the pores are relatively dense. This rich pore structure provides sufficient reaction sites for the catalytic reaction, which is conducive to the progress of the ORR reaction (Fig. 2f).
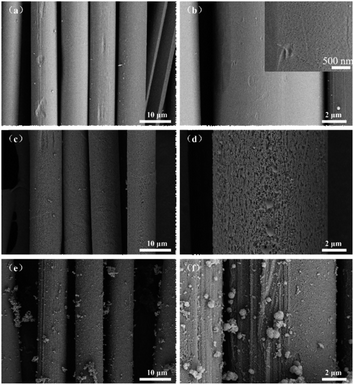 | ||
| Fig. 2 (a) and (b) SEM images of PBO-900; (c) and (d) SEM images of PBO–Fe-900; (e) and (f) SEM images of PBO–Fe–PDA-900. | ||
The porosity of PBO-900, PBO–Fe-900, and PBO–Fe–PDA-900 catalysts was studied by nitrogen adsorption/desorption isotherms. The BET surface area of PBO–Fe-900 (368 m2 g−1) was revealed to be much larger than that of PBO-900 (245 m2 g−1), Fig. S1.† Meanwhile, PBO–Fe–PDA-900 exhibits a more rapid increase of the adsorbed nitrogen quantity in the relative pressure (P/P0) range of 0–0.10 than PBO–Fe-900. This results in a larger BET surface area of PBO–Fe–PDA-900 (438 m2 g−1) than PBO–Fe-900 indicating the presence of more abundant micropores in PBO–Fe–PDA-900, as illustrated in Fig. S2.† The increased surface area of PBO–Fe–PDA-900 is advantageous for promoting mass transfer and exposing catalytic sites, thereby enhancing its ORR catalytic activity.
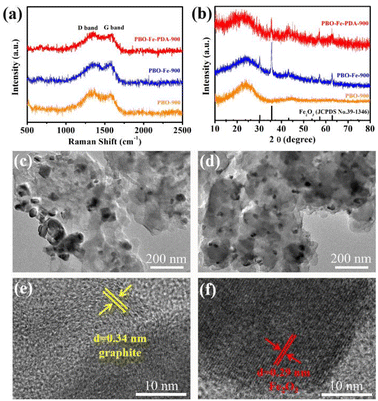
The degree of graphitization of the three catalyst materials was further evaluated by Raman spectroscopy. As shown in Fig. 3a, PBO-900, PBO–Fe-900, and PBO–Fe–PDA-900 exhibited two peaks at 1340 and 1590 cm−1, corresponding to the D band (from the E2g mode of sp2-bonded pairs) and G band (from the sp3 defect mode), respectively.24 The appearance of the graphite peak (G peak) of PBO-900 catalyst reveals the graphitization of PBO fiber after pyrolysis, and, as such, PBO fiber can be used as an excellent precursor of carbon-based catalyst. With the repyrolysis of the PBO fiber after complexing Fe ions, Fe promotes the graphitization process, leading to PBO–Fe-900 (1.01) having a smaller ID/IG value than PBO-900 (1.14), indicating the relatively high graphitization degree of PBO–Fe-900. While the ID/IG value of PBO–Fe-PPD-900 (1.05) was slightly increased by the pyrolysis of the PBO–Fe coated with PDA. The above results show that PBO–Fe-900 and PBO–Fe–PDA-900 catalysts are well graphitized during pyrolysis, which is helpful for electron transport in catalytic reactions.
The composition and phase of PBO-900, PBO–Fe-900, and PBO–Fe–PDA-900 samples were analyzed by the XRD technique, Fig. 3b. PBO-900 shows only two broad peaks at approximately 25° (002) and 43° (101), indicating the carbon nature of the catalyst. Compared with PBO-900, PBO–Fe-900 and PBO–Fe–PDA-900 exhibit a series of new peaks at 30.1°, 36.2°, 43.5°, 57.0°, and 63.4°, that can be assigned to the Fe2O3 phase (PDF#39-1346), confirming the existence of Fe2O3 nanocrystals in PBO–Fe-900 and PBO–Fe–PDA-900 samples. Under the influence of the elevated temperature, the oxygen atoms within the PBO molecule undergo departure and react with the iron ion present on the surface, ultimately generating Fe2O3. Meanwhile, compared with PBO–Fe-900, the intensity of the Fe2O3 peak of PBO–Fe–PDA-900 is relatively weaker, which may be due to the smaller crystal size of the resulting iron-based nanoparticles. Consequently, the PDA-coated PBO–Fe can effectively avoid the accumulation of Fe atoms during pyrolysis and reduce the Fe2O3 particle size.25 The XRD data showed that this active site anchoring strategy is effective in preparing the active-site-dispersed carbon-based catalysts.
The microstructures of PBO–Fe-900 and PBO–Fe–PDA-900 were further studied by transmission electron microscopy (TEM). As shown in Fig. 3c, large nanoparticles (diameter greater than 100 nm) caused by random aggregation of iron species during pyrolysis were found in the PBO–Fe-900 sample. However, many small nanoparticles (less than 50 nm in diameter) are evenly distributed on the surface of the PBO–Fe–PDA-900, confirming the effectiveness of the PDA protection strategy on the isolated Fe active sites, Fig. 3d. As shown in Fig. 3e and f, the high-resolution TEM images of PBO–Fe–PDA-900 show well-defined lattices with 0.34 nm and 0.29 nm spacing corresponding to the (002) and (220) planes of graphitic carbon (GC), Fe2O3, respectively, which are consistent with the XRD results.26–29
In addition, the surface element composition of PBO–Fe–PDA-900 was analyzed by X-ray photoelectron spectroscopy (XPS). As can be seen from Fig. 4a, the high-resolution C 1s spectrum for Fig. 4a can be deconvoluted to produce three peaks centered at 284.7, 285.7 eV, and 287.5 eV, corresponding to C![[double bond, length as m-dash]](https://www.rsc.org/images/entities/char_e001.gif) C/C–C, C–N/C–S, and C
C/C–C, C–N/C–S, and C![[double bond, length as m-dash]](https://www.rsc.org/images/entities/char_e001.gif) N, respectively. This indicates that N atoms are retained in the carbon matrix.30 As for the high-resolution N 1s spectra for PBO–Fe–PDA-900 (Fig. 4b), the peaks at 398.4, 399.9, 401.0 eV, and 402.7 eV, correspond to pyridinic N, pyrrolic N, graphitic N, and oxidized N, respectively.31,32 Meanwhile, the highly electro-active pyridinic N and graphitic N contributed to the dominant percentage of the four kinds of N configurations. The strong electronegativity of N from the C
N, respectively. This indicates that N atoms are retained in the carbon matrix.30 As for the high-resolution N 1s spectra for PBO–Fe–PDA-900 (Fig. 4b), the peaks at 398.4, 399.9, 401.0 eV, and 402.7 eV, correspond to pyridinic N, pyrrolic N, graphitic N, and oxidized N, respectively.31,32 Meanwhile, the highly electro-active pyridinic N and graphitic N contributed to the dominant percentage of the four kinds of N configurations. The strong electronegativity of N from the C![[double bond, length as m-dash]](https://www.rsc.org/images/entities/char_e001.gif) N unit in pyridine N and graphite N results in an enhanced positivity of the adjacent sp2 bonded C atoms, which facilitated the adsorption of reactants (e.g., OH−, O2), effectively catalyzing ORR.33,34 In the case of O 1s spectra for PBO–Fe–PDA-900 (Fig. 4c), the peaks at 531.0, 532.2, and 533.2 eV correlate to the binding energies of Fe–O in Fe2O3, O–H in chemisorbed water, and C–O in graphene, respectively, which further confirmed the formation of Fe2O3.35,36 In the Fe 2p spectra (Fig. 4d), the peaks at 711.4 and 724.9 eV are due to the binding energies of the 2p3/2 and 2p1/2 bands revealing the presence of Fe3+, with two satellite peaks at 719.3 eV and 732.3 eV. The peaks at 711.0 and 724.9 eV originated from the Fe–O species. The above results confirm the formation of the existing Fe2O3 nanoparticles anchored on the N-doped carbon matrix, and the Fe–O species can enhance the ORR catalytic activity.37–39
N unit in pyridine N and graphite N results in an enhanced positivity of the adjacent sp2 bonded C atoms, which facilitated the adsorption of reactants (e.g., OH−, O2), effectively catalyzing ORR.33,34 In the case of O 1s spectra for PBO–Fe–PDA-900 (Fig. 4c), the peaks at 531.0, 532.2, and 533.2 eV correlate to the binding energies of Fe–O in Fe2O3, O–H in chemisorbed water, and C–O in graphene, respectively, which further confirmed the formation of Fe2O3.35,36 In the Fe 2p spectra (Fig. 4d), the peaks at 711.4 and 724.9 eV are due to the binding energies of the 2p3/2 and 2p1/2 bands revealing the presence of Fe3+, with two satellite peaks at 719.3 eV and 732.3 eV. The peaks at 711.0 and 724.9 eV originated from the Fe–O species. The above results confirm the formation of the existing Fe2O3 nanoparticles anchored on the N-doped carbon matrix, and the Fe–O species can enhance the ORR catalytic activity.37–39
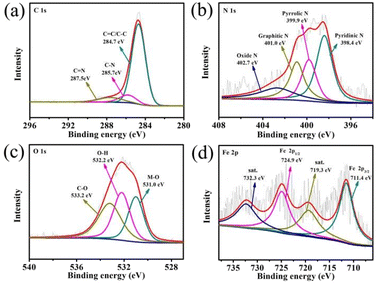 | ||
| Fig. 4 High-resolution XPS spectra of (a) C 1s, (b) N 1s, (c) O 1s and (d) Fe 2p core levels for PBO–Fe–PDA-900. | ||
Electrochemical characterization
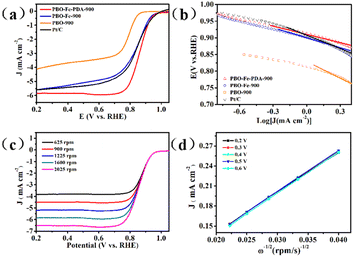
In order to evaluate the electrocatalytic ORR activity, the catalyst obtained was evaluated in 0.1 M KOH electrolyte. As shown in Fig. S3,† the CV curves of PBO-900, PBO–Fe-900, and PBO–Fe–PDA-900 showed an obvious peak at 0.7–0.9 V in O2-saturated electrolyte, but it did not appear in the N2-saturated electrolyte, indicating their electrocatalytic activity toward ORR. Moreover, the CV curves showed the peak potential with the sequence PBO–Fe–PDA-900 > PBO–Fe-900 > PBO-900, which proved that the uniform distribution of the Fe-based active sites on N-doped carbon materials is effective in enhancing the catalytic activity of ORR. Linear sweep voltammetry (LSV) curves were used to further study the ORR activity of these catalysts, Fig. 5a. For comparative purposes, the ORR activity of the commercial 20 wt% Pt/C was also investigated. Being in good agreement with the CV study results, PBO–Fe–PDA-900 exhibited prominent ORR activity with a half-wave potential (E1/2) of 0.86 V versus RHE. The measured E1/2 was higher than those of Pt/C (0.84 V), PBO–Fe-900 (0.83 V), and PBO-900 (0.78 V) tested under the same conditions. The ORR performance of PBO–Fe–PDA-900 was superior to those of most of the non-noble metal-based catalysts reported recently in alkaline electrolytes, Table S1.† In order to further compare the reaction rate of the oxygen reduction catalyzed by the catalyst, the Tafel slope of PBO–Fe–PDA-900 was calculated to be 73 mV dec−1, lower than that of PBO–Fe-900 (79 mV dec−1), PBO-900 (132 mV dec−1), and Pt/C (82 mV dec−1), demonstrating the faster ORR kinetics of PBO–Fe–PDA-900 (Fig. 5b). To further understand the reaction mechanism of PBO–Fe–PDA-900, LSV tests were conducted at different rotation rates, Fig. 5c. The current density is enhanced following the increase of the rotation speed, which can overcome diffusion bottleneck. In addition, the Koutecky–Levich (K–L) plots revealed excellent linearity at every potential, indicating the same electron transfer numbers for oxygen reduction. The calculated electron transfer number (n) for PBO–Fe–PDA-900 was ca. 4, suggesting a complete 4 e− reaction mechanism, thus PBO–Fe–PDA-900 possessed high ORR catalytic efficiency, Fig. 5d.40,41 The RRDE measurement was further managed to monitor H2O2 yield together with the n, Fig. S4 and S5.† As can be seen, the H2O2 yields of PBO–Fe–PDA-900 and Pt/C were all below 10% at the applied potential range, whereas the H2O2 yield of PBO–Fe-900 was above 10% and that of PBO-900 was above 20%. Furthermore, the average n values of FPBO–Fe–PDA-900 and Pt/C were determined to be above 3.8, which were higher than those obtained over the other two catalysts (n ≈ 3.6 for PBO–Fe-900 and n ≈ 3.2 for PBO-900). The results agreed with the result of the K–L plot, indicating the favored 4 e− transfer pathway of PBO–Fe–PDA-900. Except for the catalytic activity, the catalytic stability of PBO–Fe–PDA-900 and Pt/C was performed by the chronoamperometric response. As shown in Fig. S6,† PBO–Fe–PDA-900 shows excellent stability for ORR, and about 93% of its initial current density was retained over 20![[thin space (1/6-em)]](https://www.rsc.org/images/entities/char_2009.gif) 000 s, while the Pt/C catalyst had approximately 80% retention. These results indicate the superior ORR catalytic stability of PBO–Fe–PDA-900.
000 s, while the Pt/C catalyst had approximately 80% retention. These results indicate the superior ORR catalytic stability of PBO–Fe–PDA-900.
Zinc–air battery performance
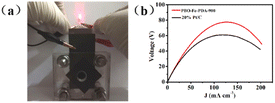
Finally, PBO–Fe–PDA-900 was used to construct a zinc–air battery, so as to expand its potential application. The catalyst coated on the carbon paper was used as the cathode of the zinc–air battery with zinc foil as the anode and 6 M KOH as the electrolyte. The commercial Pt/C catalyst was also tested under the same conditions for comparison. As shown in Fig. 6a, the zinc–air battery based on PBO–Fe–PDA-900 was effectively used to supply power for the red light-emitting diode (LED, 1.5 V). Fig. 6b shows the polarization curves and corresponding power density plots of the zinc–air batteries. The zinc–air battery assembled from FeTPP-MP@PTh-900 exhibited a higher peak power density of 78 mW cm−2 than the one with Pt/C (64 mW cm−2). Due to the faster ORR kinetics of the PBO–Fe–PDA-900 catalyst, the PBO–Fe–PDA-900 cathode catalyst could obtain a superior battery performance than Pt/C.Conclusions
In conclusion, an ‘active site anchoring’ strategy was developed for the preparation of PBO–Fe–PDA-900 electrocatalytic material, which was prepared using iron ions as the active sites and was effectively dispersed on the surface of the carbon-based material PBO fibers, with a coating of PDA to avoid excessive aggregation of the active site of Fe2O3. Meanwhile, the abundant pore structure generated by the PBO fiber material during the process of pyrolysis provided a suitable loading position for the catalytic active sites. These characteristics contributed to the improvement of ORR properties of PBO–Fe–PDA-900. Compared with the Pt/C catalyst, the PBO–Fe–PDA-900 showed a higher half-wave potential (0.86 V). At the same time, the zinc–air battery assembled with the PBO–Fe–PDA-900 catalyst showed a peak power density of 78 mW cm−2. This work provides a simple and feasible strategy for further development of high-performance ORR catalysts and provides a direction for the future development of low-priced and efficient electrocatalysts.Conflicts of interest
There are no conflicts to declare.Acknowledgements
This work was financially supported by the Shandong Province Major Scientific and Technological Innovation Project (No. 2019JZZY020201).Notes and references
- R. Jiang, X. Chen, J. Deng, T. Wang, K. Wang, Y. Chen and J. Jiang, J. Energy Chem., 2020, 47, 79–85 CrossRef.
- J. Pan, Y. Y. Xu, H. Yang, Z. Dong, H. Liu and B. Y. Xia, Adv. Sci., 2018, 5, 1700691 CrossRef.
- T. Wang, L. Xu, C. Sun, X. Li, Y. Yan and F. Li, RSC Adv., 2022, 12, 9543–9549 RSC.
- J. Zhao, J. Deng, J. Han, S. Imhanria, K. Chen and W. Wang, Chem. Eng. J., 2020, 389, 124323 CrossRef CAS.
- T. Wang, C. Sun, Y. Yan and F. Li, RSC Adv., 2022, 12, 9543–9549 RSC.
- J. Yang, H. Sun, H. Liang, H. Ji, L. Song, C. Gao and H. Xu, Adv. Mater., 2016, 28, 4606–4613 CrossRef CAS PubMed.
- W. Wang, Y. Dong and Y. Yang, et al., Int. J. Hydrogen Energy, 2018, 43, 12119–12128 CrossRef CAS.
- X. Yan, Y. Jia and X. Yao, Chem. Soc. Rev., 2018, 47, 7628–7658 RSC.
- J. Meng, H. Lei, X. Li, J. Zhang and W. Rui, ACS Catal., 2019, 9, 4551–4560 CrossRef CAS.
- W. Zhang, S. Pei, K. Xu, Z. Han, J. Ma, Y. Zhang, G. Liu and X. Xu, RSC Adv., 2022, 12, 33981 RSC.
- Y. Wu, Y. Chen, H. Wang, C. Wang, A. Wang, S. Zhao, X. Li, D. Sun and J. Jiang, J. Mater. Chem. A, 2018, 6, 12018–12028 RSC.
- X. Chen, Z. Ning, Z. Zhou, X. Liu, J. Lei, S. Pei and Y. Zhang, RSC Adv., 2018, 8, 27246–27252 RSC.
- H. Cheng, J. Chen, Q. Li, C. Su, A. Chen, J. Zhang, Y. Tong and Z. Liu, Chem. Commun., 2017, 53, 11596–11599 RSC.
- S. Zhang, H. Zhang, W. Zhang, X. Yuan, C. Chen and Z. Ma, Chin. J. Catal., 2018, 39, 1427–1435 CrossRef CAS.
- X. Wei, X. Luo, H. Wang, W. Gu, W. Cai, Y. Lin and C. Zhu, Appl. Catal., B, 2020, 263, 118347 CrossRef CAS.
- K. Chen, S. Ci, Q. Xu, H. Zhang, W. Zhang, X. Yuan, C. Chen and Z. Ma, Chin. J. Catal., 2020, 41, 858–867 CrossRef CAS.
- X. Wang, T. Ouyang, L. Wang and T. Ma, Angew. Chem., 2019, 131, 13425–13430 CrossRef.
- W. Liu, H. Jiang and H. Yu, Energy Environ. Sci., 2019, 12, 1751–1779 RSC.
- L. Jiao, R. Zhang, G. Wan, W. Yang and H. Jiang, Nat. Commun., 2020, 11, 1–7 CrossRef.
- Y. Huang, W. Liu, S. Kan, P. Liu, R. Hao, H. Hu and K. Liu, Int. J. Hydrogen Energy, 2020, 45, 6380–6390 CrossRef CAS.
- H. Jin, H. Zhou, W. Li, Z. Wang, J. Yang, Y. Xiong, D. He, L. Chen and S. Mu, J. Mater. Chem. A, 2018, 6, 20093–20099 RSC.
- Y. Qiao, P. Yuan, Y. Hu, J. Zhang, S. Mu, J. Zhou, H. Li, H. Xia, J. He and Q. Xu, Adv. Mater., 2018, 30, 1804504 CrossRef PubMed.
- W. Yan, Y. Wu, Y. Chen, Q. Liu, K. Wang, N. Cao, F. Dai, X. Li and J. Jiang, J. Energy Chem., 2020, 44, 121–130 CrossRef.
- L. Jiao, G. Wan, R. Zhang, H. Zhou, S. H. Yu and H. L. Jiang, Angew. Chem., Int. Ed., 2018, 57, 8525–8529 CrossRef CAS.
- Y. Mun, M. J. Kim, S.-A. Park, E. Lee, Y. Ye, S. Lee, Y.-T. Kim, S. Kim, O.-H. Kim and Y.-H. Cho, Appl. Catal., B, 2018, 222, 191–199 CrossRef CAS.
- J. Zhao, Y. Xie, Z. Le, J. Yu, Y. Gao, R. Zhong, Y. Qin and Y. Huang, Synth. Met., 2013, 181, 110–116 CrossRef CAS.
- M. Wang, C. Su, M. Saunders, J. Liang, Z. Shao, S. Wang and J. Liu, Part. Part. Syst. Charact., 2017, 34, 1700158 CrossRef.
- M. Jafari, H. Gharibi and M. Parnian, J. Power Sources, 2021, 499, 229956 CrossRef CAS.
- Y. Huang, W. Liu, S. Kan, P. Liu, R. Hao, H. Hu and K. Liu, Int. J. Hydrogen Energy, 2020, 45, 6380–6390 CrossRef CAS.
- Z. Li, L. Wei, W. Jiang, Z. Hu, H. Luo, W. Zhao, T. Xu, M. Mu and J. Hu, Appl. Catal., B, 2019, 251, 240–246 CrossRef CAS.
- Z. Xiao, Y. Wu, S. Cao, W. Yan, B. Chen, T. Xing, Z. Li, X. Lu, Y. Chen and K. Wang, Chem. Eng. J., 2021, 413, 127395 CrossRef CAS.
- D. Wang and D. Su, Energy Environ. Sci., 2014, 7, 576–591 RSC.
- J. Guo, Q. Niu, Y. Yuan, I. Maitlo, J. Nie and G. Ma, Appl. Surf. Sci., 2017, 416, 118–123 CrossRef CAS.
- C.-L. Zhang, B.-R. Lu, F.-H. Cao, Z.-Y. Wu, W. Zhang, H.-P. Cong and S.-H. Yu, Nano Energy, 2019, 55, 226–233 CrossRef CAS.
- Z. Xiao, C. Yang, S. Liu, W. Yan, F. Wang, X. Liu, T. Yang, X. Li and Y. Chen, Sustainable Energy Fuels, 2021, 5, 5184–5192 RSC.
- L. Wu, Y. Lu, W. Shao, H. Wei, G. Tong and W. Wu, Adv. Mater. Interfaces, 2020, 7, 2000736 CrossRef CAS.
- Z. Guan, X. Zhang, W. Chen, J. Pei, D. Liu, Y. Xue, W. Zhu and Z. Zhuang, Chem. Commun., 2018, 54, 12073–12076 RSC.
- Z. Xiao, X. Lv, S. Liu, Q. Liu, F. Wang, W. Yan, T. Xing, Z. Li, X. Li and Y. Chen, Adv. Mater. Interfaces, 2022, 9, 2101386 CrossRef CAS.
- Z. Wang, J. Yang, Y. Tang, Z. Chen, Q. Lu, G. Shen, Y. Wen, X. Liu, F. Liu, R. Chen and L. Feng, Sustainable Energy Fuels, 2021, 5, 2985–2993 RSC.
- S. Zhang, W. Xia, Q. Yang, Y. V. Kaneti, X. Xu, S. M. Alshehri, T. Ahamad, M. S. A. Hossain, J. Na and J. Tang, Chem. Eng. J., 2020, 396, 125154 CrossRef CAS.
- J. Ren, Y. Ying, Y. Liu and Z. Yuan, J. Energy Chem., 2022, 71, 619–630 CrossRef CAS.
Footnote |
| † Electronic supplementary information (ESI) available. See DOI: https://doi.org/10.1039/d3ra07694f |
| This journal is © The Royal Society of Chemistry 2023 |


