 Open Access Article
Ternary heterogeneous Z-scheme photocatalyst TiO2/CuInS2/OCN incorporated with carbon quantum dots (CQDs) for enhanced photocatalytic degradation efficiency of reactive yellow 145 dye in water†
Manh B. Nguyen‡
 ab,
Pham Thi Lan‡c,
Nguyen Tuan Anh
 c,
Nguyen Ngoc Tungd,
Shaoliang Guanefi,
Valeska P. Tinggh,
T.-Thanh-Bao Nguyenj,
Huan V. Doang,
Mai Thanh Tungj and
Tran Dai Lam
 *c
*c
aInstitute of Chemistry (ICH), Vietnam Academy of Science and Technology, 18 Hoang Quoc Viet Street, Cau Giay, Hanoi, Vietnam
bGraduate University of Science and Technology (GUST), Vietnam Academy of Science and Technology, 18 Hoang Quoc Viet Street, Cau Giay, Hanoi, Vietnam
cInstitute for Tropical Technology, Vietnam Academy of Science and Technology, 18 Hoang Quoc Viet, Cau Giay, Hanoi, Vietnam. E-mail: trandailam@gmail.com
dCenter for Research and Technology Transfer, Vietnam Academy of Science and Technology (VAST), 18 Hoang Quoc Viet Street, Cau Giay, Ha Noi, Vietnam
eSchool of Chemistry, Cardiff University, Cardiff CF10 3AT, UK
fHarwellXPS, Research Complex at Harwell, Rutherford Appleton Laboratory, Didcot OX11 0FA, UK
gResearch School of Chemistry, The Australian National University, AT 2601, Canberra, Australia
hCollege of Engineering, Computing and Cybernetics, The Australian National University, ACT 2601, Canberra, Australia
iInstitute of Physics, Vietnam Academy of Science and Technology, 18 Hoang Quoc Viet, Cau Giay, Hanoi, Viet Nam
jHanoi University of Science and Technology, 1 Dai Co Viet, Bach Khoa, Hai Ba Trung, Hanoi, Vietnam
First published on 5th December 2023
Abstract
This study delves into the advanced integration of a ternary heterogeneous Z-scheme photocatalyst, TiO2/CuInS2/OCN (OCN: O-g-C3N4), with carbon quantum dot (CQD) to improve the degradation efficiency of reactive yellow 145 (RY145) dye in water. Through a systematic examination, we elucidated the photocatalytic mechanisms and the role of radicals, electrons, and holes in the treatment process. Our findings revealed that this novel catalyst integration significantly boosted RY145 degradation efficiency, achieving 98.2%, which is markedly higher than the efficiencies which could be achieved using TiO2/CuInS2/OCN alone. Moreover, the TiO2/CuInS2/OCN/CQD photocatalyst demonstrated superior rate performance over its components. Comprehensive evaluations, including photoelectrochemical and radical tests, further confirmed the efficiency of the integrated system, adhering to Z-scheme principles. The catalyst showcased remarkable stability, with over 94% reusability after five reaction cycles. These findings pave the way for the potential use of the TiO2/CuInS2/OCN/CQD photocatalyst as an innovative solution for water pollutant treatment via photocatalytic technology.
1. Introduction
Water is crucial for the sustenance and growth of humans, plants and animals. By 2050, it's estimated that dwindling freshwater resources could impact 6 billion people.1 A significant contributor to this crisis is the improper treatment or release of wastewater from the textile industry.2–4 Around 2![[thin space (1/6-em)]](https://www.rsc.org/images/entities/char_2009.gif) 80
80![[thin space (1/6-em)]](https://www.rsc.org/images/entities/char_2009.gif) 000 tons of dye are used each year, with 10–15% ending up in waste water.5 RY145 dye, which is resistant to natural decomposition, is of particular concern.6–8 Exposure to water tainted with RY145 dye has been linked to a plethora of health issues including neurological disorders, cancer, and kidney failure, and poses environmental risks.9–11 Photocatalytic technology has emerged as a solution and is being used in diverse fields.12–16 In water treatment, photocatalysts effectively treat contaminants such as antibiotics, dyes, and pesticides, as well as heavy metals.14,17–19 However, traditional photocatalysts like ZnO and TiO2 suffer from limited surface area and quick electron–hole recombination, compromising their efficacy.20–22 This has spurred the development of advanced photocatalytic materials like AgBr, g-C3N4, CdS, and notably, CuInS2, which boasts strong sunlight absorption and low toxicity.23–28 However, the biggest drawback of CuInS2 is its low surface area, which leads to rapid recombination of electrons and holes, thereby affecting the photocatalytic efficiency of this semiconductor material.29 To address this, CuInS2 has been combined with other semiconductors like ZnS, TiO2, and g-C3N4, yielding a direct Z-scheme composite which excels in hazardous compound decomposition and energy conversion.30–33 In particular, the combination of CuInS2 and TiO2 shifts the absorption wavelength towards visible light and reduces electron–hole recombination.34 Additionally, pairing CuInS2 with a non-metallic carbon nitride (CN) semiconductor can also enhance visible light absorption reduce and electron–hole recombination efficiency.28,35–38
000 tons of dye are used each year, with 10–15% ending up in waste water.5 RY145 dye, which is resistant to natural decomposition, is of particular concern.6–8 Exposure to water tainted with RY145 dye has been linked to a plethora of health issues including neurological disorders, cancer, and kidney failure, and poses environmental risks.9–11 Photocatalytic technology has emerged as a solution and is being used in diverse fields.12–16 In water treatment, photocatalysts effectively treat contaminants such as antibiotics, dyes, and pesticides, as well as heavy metals.14,17–19 However, traditional photocatalysts like ZnO and TiO2 suffer from limited surface area and quick electron–hole recombination, compromising their efficacy.20–22 This has spurred the development of advanced photocatalytic materials like AgBr, g-C3N4, CdS, and notably, CuInS2, which boasts strong sunlight absorption and low toxicity.23–28 However, the biggest drawback of CuInS2 is its low surface area, which leads to rapid recombination of electrons and holes, thereby affecting the photocatalytic efficiency of this semiconductor material.29 To address this, CuInS2 has been combined with other semiconductors like ZnS, TiO2, and g-C3N4, yielding a direct Z-scheme composite which excels in hazardous compound decomposition and energy conversion.30–33 In particular, the combination of CuInS2 and TiO2 shifts the absorption wavelength towards visible light and reduces electron–hole recombination.34 Additionally, pairing CuInS2 with a non-metallic carbon nitride (CN) semiconductor can also enhance visible light absorption reduce and electron–hole recombination efficiency.28,35–38
Recent research supports the promise of these combinations. For instance, Feng Guo et al. found that CuInS2/g-C3N4 exhibited an enhanced decomposition rate for tetracycline that is 11 and 15 times higher, respectively, compared to CuInS2 and g-C3N4 used separately.39 Xu et al. used a photocatalyst with a Z-scheme heterojunction between CuInS2 and TiO2 to directly convert CO2 into CH3OH and CH4 with respective yields of 0.86 and 2.5 μmol g−1 h−1, which is higher than CuInS2 and TiO2 used individually.31 Zhang et al. reported a Z-scheme heterogenous g-C3N4/CuInS2 photocatalyst that degraded 52.16% of tetracycline in 2 hours under visible light irradiation, with a degradation rate nearly 3.4 times higher than the g-C3N4 sample.28 This research demonstrated that the Z-scheme photocatalysts are capable of expanding the visible light absorption range and increasing electron–hole separation efficiency.28 Yet, they have inherent limitations, notably poor active phase contact, resulting in slower charge transfers.40–42 To enhance semiconductor contact and boost photocatalysis efficiency, recent studies have explored the use of metal–organic frameworks (MOFs) and carbon quantum dots (CQDs). CQDs, with their low cost, biocompatibility, and broad light absorption range, present a promising solution.43–48 Our study introduces a TiO2/CuInS2/OCN heterogeneous photocatalyst combined with a CQD bridge. We synthesized OCN via a thermal condensation method to separate the CN layer and doped with O to reduce the rate of electron–hole recombination. This was then integrated with TiO2 and CuInS2, and the resulting TiO2/CuInS2/OCN/CQD photocatalysts were tested for RY145 dye degradation. We also examined the factors influencing RY145 degradation such as RY145 concentration, photocatalyst dosage, pH value, and water source and proposed an LC-MS-based degradation pathway for RY145.
2. Experimental methods
2.1. Synthesis of carbon quantum dot (CQD)
Carbon quantum dots were synthesized using the hydrothermal method from a chitosan precursor. First, 0.1 g of chitosan was dissolved in 20 mL of 1% CH3COOH solution, stirred until dissolved, and then heated at 180 °C for 12 hours. After cooling, the mixture was centrifuged to yield a yellowish solution (CQD), which was utilized in subsequent syntheses.2.2. Synthesis of OCN material
Following a previously reported protocol, 9 g of urea was dissolved in 80 mL of 30% H2O2 and stirred for an hour.49,50 The solution, when crystallized for 12 hours at 60 °C, yielded white solids. These were mixed with ammonium chloride and heated in a melamine foam cup at 550 °C for 2 hours to obtain the OCN sample.2.3. Synthesis of CuInS2 material
Using the thermal decomposition method, 2.884 g of sodium dodecyl sulfate was dissolved in 50 mL of ethylene glycol and stirred at 70 °C for 15 minutes. A separate solution containing 20 mL of distilled water, 0.586 g of InCl3·4H2O, 0.483 g of Cu(NO3)2, and 0.375 g of thioacetamide was then added and stirred vigorously at 600 rpm for 30 minutes at 70 °C. Next, the mixture was transferred to a Teflon flask and stirred at 180 °C for 1 day to obtain a black colloidal mixture. Finally, the mixture was separated by centrifugation, washed several times with ethanol and distilled H2O, and dried at 80 °C for 12 hours to obtain the CuInS2 material.2.4. Synthesis of TiO2/CuInS2/OCN and TiO2/CuInS2/OCN/CQD materials
The TiO2/CuInS2/OCN material was synthesized according to our previous report. Specifically, 0.4 g of CuInS2 and 1.0 g of OCN were added to 120 mL of C2H5OH and dispersed evenly in ethanol by ultrasonic treatment for 1 hour (mixture A). At the same time, 2.28 mL of titanium isopropoxide (TIP) was added to an 80 mL mixture of acetic acid and ethanol (1![[thin space (1/6-em)]](https://www.rsc.org/images/entities/char_2009.gif) :
:![[thin space (1/6-em)]](https://www.rsc.org/images/entities/char_2009.gif) 1) and vigorously stirred to form a homogeneous mixture (mixture B). Then, mixture B was added dropwise to mixture A and vigorously stirred for 30 minutes before introducing the resulting mixture of A and B into the Teflon reaction system. This mixture was reacted in a microwave device (power 700 W) for 0.5 hours at 100 °C. The formed precipitate was isolated using centrifugation and repeatedly rinsed with distilled water to ensure all unreacted materials were removed. Finally, the product was dried at 80 °C for 12 hours and ground in a mortar before being heated at 450 °C for 4 hours to obtain the TiO2/CuInS2/OCN material.
1) and vigorously stirred to form a homogeneous mixture (mixture B). Then, mixture B was added dropwise to mixture A and vigorously stirred for 30 minutes before introducing the resulting mixture of A and B into the Teflon reaction system. This mixture was reacted in a microwave device (power 700 W) for 0.5 hours at 100 °C. The formed precipitate was isolated using centrifugation and repeatedly rinsed with distilled water to ensure all unreacted materials were removed. Finally, the product was dried at 80 °C for 12 hours and ground in a mortar before being heated at 450 °C for 4 hours to obtain the TiO2/CuInS2/OCN material.
The TiO2/CuInS2/OCN/CQD material was synthesized by dispersing 10 mL of the CQD solution synthesized above in a mixture of water and ethanol (volume ratio 4![[thin space (1/6-em)]](https://www.rsc.org/images/entities/char_2009.gif) :
:![[thin space (1/6-em)]](https://www.rsc.org/images/entities/char_2009.gif) 1). Next, 1 g of TiO2/CuInS2/OCN material was added to the above mixture and subjected to ultrasonic treatment for 0.5 hours and stirred at 120 °C for 5 hours. The mixture was allowed to cool naturally to room temperature and the solid was separated by centrifugation and washed with distilled water. Finally, the solid was dried at 70 °C for 12 hours to obtain the TiO2/CuInS2/OCN/CQD material (see Fig. S1†). The weight ratios between TiO2, CuInS2, OCN and CQD in TiO2/CuInS2/OCN and TiO2/CuInS2/OCN/CQD materials are 3/2/5 and 3/2/5/0.2, respectively.
1). Next, 1 g of TiO2/CuInS2/OCN material was added to the above mixture and subjected to ultrasonic treatment for 0.5 hours and stirred at 120 °C for 5 hours. The mixture was allowed to cool naturally to room temperature and the solid was separated by centrifugation and washed with distilled water. Finally, the solid was dried at 70 °C for 12 hours to obtain the TiO2/CuInS2/OCN/CQD material (see Fig. S1†). The weight ratios between TiO2, CuInS2, OCN and CQD in TiO2/CuInS2/OCN and TiO2/CuInS2/OCN/CQD materials are 3/2/5 and 3/2/5/0.2, respectively.
2.5. Characterization methods
The phase structure, surface valence state, elemental composition, specific surface area, morphology and optical properties of ZnO, TiO2, OCN and 20%ZnO–TiO2/OCN material samples were analyzed by X-ray diffraction (XRD, D8 ADVANCE, Bruker, Germany), X-ray photoelectron spectroscopy (XPS, Thermo VG Multilab 2000), Energy Dispersive X-ray Spectroscopy (EDS, JED-2300), transmission electron microscopy (TEM, Leica IEO 906E), photoluminescence (PL, Varian), Mott–Schottky (MS), electrochemical impedance spectroscopy (EIS) and UV-vis diffuse reflectance spectra (UV-vis DRS, UV-2600, Shimadzu).2.6. Evaluation of photocatalyst activity
The TiO2, CuInS2, OCN, TiO2/CuInS2/OCN, and TiO2/CuInS2/OCN/CQD materials were tested for photocatalytic activity using the RY145 photodegradation reaction. To evaluate the efficiency of the photocatalytic process for RY145 degradation, the reaction system was designed with a glass reaction vessel, with circulating water outside to maintain a reaction temperature of 25 °C throughout the reaction. In addition, a light source consisting of 4 solar lamps with a power of 15 W/lamp was placed at a distance of 15 cm from the lamp to the transparent surface of the reaction system, providing a light intensity of 2280 Lux to the reaction system.First, 30 mg (0.3 g L−1) of different photocatalysts (TiO2, CuInS2, OCN, TiO2/CuInS2/OCN, and TiO2/CuInS2/OCN/CQD) were added to a 100 mL RY145 solution with a concentration of 50 mg L−1 and vigorously stirred in the dark for 60 minutes to achieve adsorption–desorption equilibrium of the materials. Then, simulated solar irradiation was introduced to the system, to initiate the RY145 photocatalytic degradation reaction. To determine the RY145 concentration at different time points, after different reaction times of about 10 minutes, 2 mL aliquots of the reaction mixture were taken and the solid phase was separated by centrifugation for UV-vis spectroscopy. Based on the intensity at 421 nm and using the calibration curve y = 0.0118x + 0.0053, the RY145 concentration at different time points was determined. The photocatalytic degradation efficiency of RY145 on the TiO2/CuInS2/OCN/CQD photocatalyst was determined based on eqn (1):
| H = (Co − Ct) × 100/Co | (1) |
The factors affecting the RY145 degradation process on the TiO2/CuInS2/OCN/CQD photocatalyst, such as concentration, catalyst mass, pH value, water source, anions, and participating radicals, were investigated according to the evaluation procedure.
3. Result and discussion
3.1. Physicochemical and morphological properties of CuInS2, OCN, TiO2 and TiO2/CuInS2/OCN/CQD materials
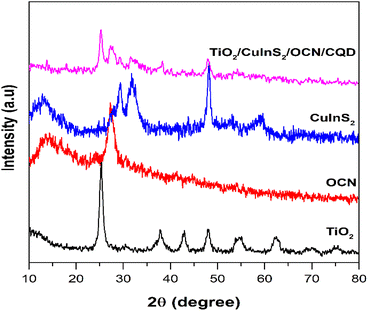
The XRD patterns of CuInS2, OCN, TiO2 and TiO2/CuInS2/OCN/CQD are presented in Fig. 1. Notably, the CuInS2 sample reveals diffraction peaks at 2θ of 27.74°, 29.34°, 31.81°, and 48.07°, which are assigned to the (112), (101), (200), and (204) planes of chalcopyrite-type CuInS2 (JCPDS card number 85-1575).39,51 Similarly, TiO2 exhibits peaks at 2θ of 25.40°, 37.84°, 47.94°, 54.10°, and 62.35°, corresponding to the (101), (004), (200), (105), and (204) planes of TiO2 anatase phase.52–54 The OCN sample shows diffraction peaks at 2θ ∼27.4° and 13.2°, corresponding to the (002) and (100) planes of graphitic carbon nitride.55–57 The combined TiO2/CuInS2/OCN samples display all expected peaks but with overlap between OCN (peak at 27.6°) and CuInS2 (peak at 27.5°). Due to the amorphous structure and low content of CQD, peaks relating to this phase were not visible.41,47 The TiO2/CuInS2/OCN/CQD maintains its phase structure through the synthesis process with slight modifications in the 2θ angle due to inter-material interactions.47 Employing the Debye–Scherrer equation, the crystal sizes for CuInS2 and TiO2 were estimated at 5 nm and 8.3 nm, respectively.The XPS method was used to analyze the surface chemical state and chemical composition of all samples, as shown in Fig. S2 and Table S1.† The OCN sample has binding energies at 284.24 eV (sp2 C–C), 285.34 eV (C–O), 287.64 eV (sp2 N–C![[double bond, length as m-dash]](https://www.rsc.org/images/entities/char_e001.gif) N), 398.97 eV (sp2 C–N
N), 398.97 eV (sp2 C–N![[double bond, length as m-dash]](https://www.rsc.org/images/entities/char_e001.gif) C), 399.64 eV (sp3 N), 401.18 eV (C2–NH), 530.47 eV (N–C–O), and 531.69 eV (physically adsorbed –OH) (Fig. 2).58 The formation of C–O and N–C–O bonds indicates the partial substitution of N atoms with O in the CN aromatic rings.59 In the TiO2 sample, binding energies at 458.80 eV (Ti4+, Ti 2p3/2), 464.56 eV (Ti4+, Ti 2p1/2), 529.98 eV (Ti–O), and 531.94 eV (–OH) were observed from the high-resolution XPS spectrum of Ti 2p and O 1s.31,60,61 The binding energy peaks at 163.36 eV (S2−, S2p1/2), 162.04 eV (S 2p3/2), In2+ (446.14 and 453.64 eV), In3+ (448.37 and 455.84 eV), Cuo (929.52 and 949.22 eV), Cu+ (932.13 and 952.01 eV), and Cu2+ (933.42 and 953.78 eV) were observed from the high-resolution spectra of CuInS2 (Fig. S3†).62 After combining with OCN and TiO2, a shift in binding energy to lower energy levels of Cu 2p (Cu+: 931.94 and 951.74 eV; Cu2+: 933.19 and 953.78 eV), In 3d (In2+: 445.67 and 452.73 eV; In3+: 446.25 and 453.62 eV), and S 2p (161.64 and 162.95 eV) was observed for the TiO2/CuInS2/OCN/CQD sample.
C), 399.64 eV (sp3 N), 401.18 eV (C2–NH), 530.47 eV (N–C–O), and 531.69 eV (physically adsorbed –OH) (Fig. 2).58 The formation of C–O and N–C–O bonds indicates the partial substitution of N atoms with O in the CN aromatic rings.59 In the TiO2 sample, binding energies at 458.80 eV (Ti4+, Ti 2p3/2), 464.56 eV (Ti4+, Ti 2p1/2), 529.98 eV (Ti–O), and 531.94 eV (–OH) were observed from the high-resolution XPS spectrum of Ti 2p and O 1s.31,60,61 The binding energy peaks at 163.36 eV (S2−, S2p1/2), 162.04 eV (S 2p3/2), In2+ (446.14 and 453.64 eV), In3+ (448.37 and 455.84 eV), Cuo (929.52 and 949.22 eV), Cu+ (932.13 and 952.01 eV), and Cu2+ (933.42 and 953.78 eV) were observed from the high-resolution spectra of CuInS2 (Fig. S3†).62 After combining with OCN and TiO2, a shift in binding energy to lower energy levels of Cu 2p (Cu+: 931.94 and 951.74 eV; Cu2+: 933.19 and 953.78 eV), In 3d (In2+: 445.67 and 452.73 eV; In3+: 446.25 and 453.62 eV), and S 2p (161.64 and 162.95 eV) was observed for the TiO2/CuInS2/OCN/CQD sample.
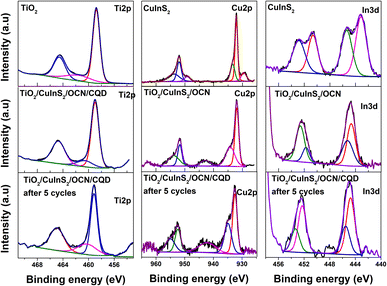 | ||
| Fig. 2 High-resolution Ti 2p, Cu 2p and In 3d XPS spectra of CuInS2, OCN, TiO2, TiO2/CuInS2/OCN/CQD samples. | ||
On the contrary, the bonding energies of Ti 2p (458.99 and 464.71 eV), C (284.40, 285.55 and 287.66 eV), N 1s (399.01, 400.05 and 401.51) and O 1s (530.92 and 532.01 eV) in the TiO2/CuInS2/OCN/CQD sample show a shift to higher energy levels compared to the pure TiO2 and OCN samples (Fig. 2). This result demonstrates the formation of a ternary bond between CuInS2, TiO2 and OCN, as opposed to a mere mechanical mixture of CuInS2, TiO2, and OCN.39 There was also evidence of electron transfer between phases, denoting changes in charge density due to the establishment of a hybrid interface when combined with CQD.31 This result demonstrates that OCN and TiO2 are electron donors in the TiO2/CuInS2/OCN/CQD sample (due to their decreased electron density) while CuInS2 acts as an electron acceptor (due to its increased electron density). The surface –OH groups are expected to be pivotal for producing active radicals such as ˙OH and ˙O2− under visible light.47,63
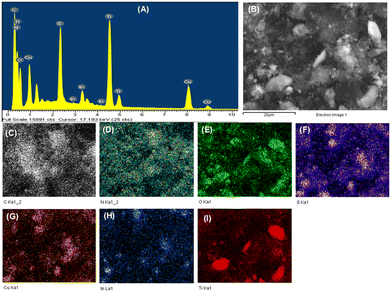
The EDS spectrum of the OCN sample (Fig. S4†) verifies successful O integration into the CN framework. Fig. 3 showcases the EDS spectrum and EDS mapping of the TiO2/CuInS2/OCN/CQD material, which indicates an even distribution of its elements. The respective weight percentages of elements in the samples are tabulated in Table S2.† The chemical composition of the OCN sample is 3.68% O, 52.32% C, and 44% N, respectively (Table S2†). The TiO2/CuInS2/OCN/CQD material shows the presence of elements C (23.47%), N (28.75%), O (17.62%), Cu (4.65%), In (6.88%), S (4.92%), and Ti (13.71%) in the EDS spectrum and EDS-mapping.
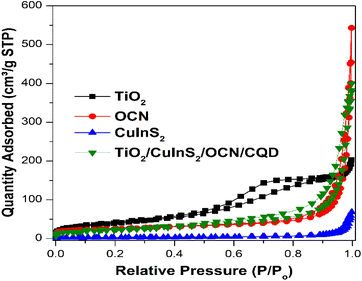
Fig. 4 presents the N2 adsorption–desorption isotherms for the discussed materials, measured at 77 K. These isotherms provide insights into the samples' porosity. The TiO2 isotherm is categorized as type IV according to IUPAC classification, and combined with the evidence of the hysteresis loop, indicates a mesoporous material, which is consistent with the BET surface area measurement (SBET ∼139 m2 g−1). The OCN also appears to have some mesoporosity (as evidenced by the presence of the hysteresis loop), and has a pronounced pore volume (0.649 cm3 g−1) but lower surface area (SBET ∼88 m2 g−1). The CuInS2 isotherm can be identified as type III (indicating a non-porous material), which is further confirmed by the low measured surface area (12 m2 g−1) and low pore volume (0.094 cm3 g−1). The TiO2/CuInS2/OCN/CQD isotherm can be considered to be a combination of all of these features, with a surface area and pore volume of 79 m2 g−1 and 0.554 cm3 g−1, respectively.
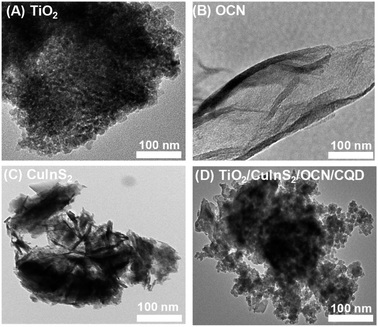
SEM and TEM images reveal that the TiO2 particles are spherical and uniformly sized between 10 and 20 nm (see Fig. 5A and S5A†). In contrast, OCN particles exhibit a plate-like shape, and CuInS2 particles resemble flower formations (as depicted in Fig. 5B and S5†). TEM imaging of the TiO2/CuInS2/OCN/CQD composite indicates that nano-sized TiO2 particles, approximately 5–10 nm in size, adhere to the CuInS2 petals and distribute uniformly over the OCN plates. In higher-resolution images, the darker spherical areas correlate to the nano TiO2 and CuInS2 particles, whereas the brighter peripheries correspond to the OCN plates. The TEM visuals confirm a close interaction between the nano TiO2, CuInS2, and OCN particles, amalgamating to form a distinct heterostructure.
The optical and photoelectrochemical properties of TiO2, CuInS2, OCN, and TiO2/CuInS2/OCN/CQD materials were analyzed using UV-vis DRS, photoluminescence (PL), cyclic voltammetry (CV) and electrochemical impedance spectroscopy (EIS) methods. Fig. 6A shows that TiO2 primarily absorbs ultraviolet light with a bandgap energy exceeding 3.30 eV. In contrast, OCN and CuInS2 exhibit absorption in the visible light spectrum, having bandgap energies of 2.76 eV and 1.09 eV, respectively. Notably, the heterojunction in the TiO2/CuInS2/OCN/CQD photocatalyst extends its visible light absorption range, reaching a bandgap energy of 2.57 eV (see Fig. S6†). This shift arises due to the intensified quantum confinement effect of CQD combined with the establishment of a dual Z-scheme heterojunction.41,47,64 This enhanced visible light absorption fosters the creation of reaction intermediates, augmenting photocatalytic activity.31 Mott–Schottky plots (Fig. S7†) provide the conduction band (CB) levels of the photocatalysts. Using this method, the flat band energy levels of TiO2, CuInS2, and OCN were identified as −1.06, −1.57, and −1.32 eV, respectively. By correlating the Ag/AgCl electrode with the standard hydrogen electrode, we discerned the CB energy levels of these materials as −0.45, −0.96, and −0.71 eV respectively. Their corresponding valence band (VB) energies stand at 2.85, 0.13, and 2.05 eV.
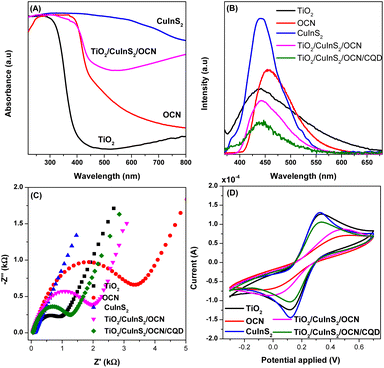 | ||
| Fig. 6 (A) UV-vis DRS spectra, (B) photoluminescence spectra (PL), (C) transient photocurrent response and (D) cyclic voltammetry (CV) of TiO2, CuInS2, OCN and TiO2/CuInS2/OCN/CQD samples. | ||
Electron–hole recombination rates are assessed using the PL method. As per Fig. 6B, the order of PL intensity, which relates to recombination of electrons and holes, is (in descending order): CuInS2 > OCN > TiO2 > TiO2/CuInS2/OCN > TiO2/CuInS2/OCN/CQD. The CuInS2 sample, with the highest PL intensity and the lowest energy level,47 exhibits the greatest recombination propensity. After combining TiO2, CuInS2 and OCN together (TiO2/CuInS2/OCN), the PL intensity decreased significantly compared to the individual semiconductors. The electron transfers from the CB of OCN and TiO2 to the VB of CuInS2 elevate the separation efficiency and curb recombination in the semiconductor. The TiO2/CuInS2/OCN/CQD composite showcases the lowest PL intensity, pointing to reduced recombination and improved separation. The presence of CQD enables dual Z transfer, further suppressing electron–hole recombination and supporting faster charge transfer.47 As Fig. 6C reveals, CuInS2 and OCN respectively demonstrate the best and poorest charge transfer capabilities, reflected in their Nyquist EIS diagrams. After integrating TiO2 and CuInS2 with OCN, the TiO2/CuInS2/OCN/CQD material's semicircle diameter reduces notably, an indicator of altered photoelectric properties. This change, due to CQD-mediated heterojunction formation, underlines the enhanced optical attributes of the TiO2/CuInS2/OCN composite over OCN. The introduction of CQD also appears to boost charge carrier transport. Cyclic voltammetry (Fig. 6D) further characterizes charge transfer capabilities. Here, the CuInS2 and TiO2 samples excel due to the oxidation and reduction of metal ions (Cu2+, Cu+, In3+, In2+ and Ti4+) at 0.32 and 0.12 V, respectively.65 In contrast, OCN, a non-metallic semiconductor, presents a starkly inferior charge transfer ability.66 However, after its amalgamation with other semiconductors, this ability doesn't markedly improve, attributable to inadequate semiconductor phase contact. Remarkably, the introduction of CQD enhances the TiO2/CuInS2/OCN/CQD semiconductor's oxidation–reduction potential, thanks to bolstered inter-semiconductor interactions.46,67–69
3.2. Photocatalytic activity
The photocatalytic activity of the different materials against RY145 dye degradation was assessed. As illustrated in Fig. 7, under only visible light, RY145 dye exhibited a minimal degradation of about 2.2%. However, the introduction of various photocatalysts accelerated the dye's removal. After 60 minutes of light exposure, the removal efficiencies achieved by TiO2, CuInS2, OCN, and the composite TiO2/CuInS2/OCN/CQD were 56.81%, 40.31%, 67.64%, and 95.44%, respectively. In individual sample evaluations, TiO2 displayed the lowest efficiency in degrading RY145 (43.25%) due to its significant bandgap energy and ultraviolet light absorption (3.3 eV). It should be noted that nano TiO2 showed significant RY145 adsorption (25% under dark conditions) due to its relatively high surface area of 139 m2 g−1 (Table 1). By contrast, CuInS2 with its limited surface area (12 m2 g−1), led to modest RY145 removal efficiencies of 5.2% via adsorption under dark conditions and 50.12% post-100 minute photocatalysis, demonstrating strong visible light absorption. OCN outperformed both TiO2 and CuInS2, achieving a removal efficiency of 82.1%. Remarkably, the concurrent integration of TiO2, CuInS2, and OCN, connected through the CQD bridge into a heterostructure (TiO2/CuInS2/OCN/CQD), boosted photocatalytic efficiency by factors of 5.1, 6.09, and 3.06 relative to the individual TiO2, CuInS2, and OCN constituents. The highest removal efficiency of RY145 after 60 minutes was achieved by the TiO2/CuInS2/OCN/CQD catalyst (95.44%). The enhanced performance is credited to an increased surface area, improved visible light absorption, diminished electron–hole recombination, and the heterostructure's efficient electron transport. Notably, the combined TiO2/CuInS2/OCN/CQD system exhibited a 2.13-fold higher efficiency than the TiO2/CuInS2/OCN system, highlighting the contribution of the CQD bridge. Reaction rate details for RY145 degradation by each sample are presented in Fig. 7B. Factors influencing RY145 degradation include, photocatalyst concentration, pH, dye concentration and the initial water source. Fig. 7C highlights that reducing the concentration of photocatalyst from 0.6 to 0.3 g L−1 barely affects the removal efficiency of RY145 by the TiO2/CuInS2/OCN/CQD photocatalyst. However, a further decrease to 0.2 g L−1 sees a drop from 98.80% to 82.17% efficiency. Thus, for subsequent studies, an optimal photocatalyst concentration of 0.4 g L−1 was chosen. pH variation influences the TiO2/CuInS2/OCN/CQD's surface properties.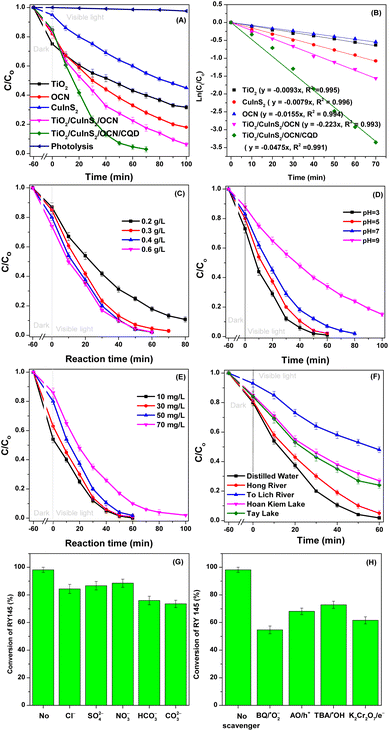 | ||
| Fig. 7 (A) C/Co as a function of reaction time and (B) first-order reaction kinetics over TiO2, CuInS2, OCN, TiO2/CuInS2/OCN and TiO2/CuInS2/OCN/CQD samples; C/Co as a function of reaction time over the TiO2/CuInS2/OCN/CQD photocatalyst, showing dependence on (C) the concentration of photocatalyst used; (D) pH value; (E) different RY145 concentrations; (F) different water sources; conversion of RY145 by theTiO2/CuInS2/OCN/CQD photocatalyst, as affected by: (G) different anions and (H) radical scavengers. As Fig. 7D indicates, a pH drop from 10 to 4 elevates RY145 degradation from 66.18% to 98%. This result is because, at low pH values, the TiO2/CuInS2/OCN/CQD material and RY145 have opposite charges, encouraging electrostatical interactions which increase reaction rates, resulting in increased adsorption efficiency.50 Conversely, at pH values >7, the efficiency drops to 68.18% due to TiO2/CuInS2/OCN/CQD and RY145 having similar negative charges, leading to a significant decrease in the RY145 reaction rates, lowering degradation efficiency from 98% to 68.18% after 60 minutes of visible light irradiation. These results are similar to those reported by our previous research where we used Co–Fe-BTC/CN and ZnO–Ag@AgBr/SBA-15 catalysts to treat dyes and phenol red in an aqueous environment.50,63 | ||
| Samples | SBET | Vpore | DBJH | Eg |
|---|---|---|---|---|
| TiO2 | 139 | 0.193 | 5.58 | 3.30 |
| OCN | 88 | 0.649 | 22.30 | 2.76 |
| CuInS2 | 12 | 0.094 | 31.12 | 1.09 |
| TiO2/CuInS2/OCN/CQD | 79 | 0.554 | 19.77 | 2.57 |
To probe the effect of RY145 dye concentrations on removal efficiencies, we investigated dye concentrations from 10 to 70 mg L−1, using a catalyst concentration of 0.4 g L−1 at pH 5. This range was based on the study by Yaseen and Scholz, which stated that dyeing plants discharge industrial wastewater containing RY145 dye concentrations ranging between 10 and 50 mg L−1.70 As illustrated in Fig. 7E, the photocatalytic efficiency of the TiO2/CuInS2/OCN/CQD material is contingent on the starting RY145 concentration. Notably, there's a direct correlation between dye concentration and treatment duration. At dye concentrations of 10, 30, 50, and 70 mg L−1, we observed RY145 treatment efficiencies surpassing 98% over irradiation periods of 40, 50, 60, and 100 minutes, respectively. Consequently, higher RY145 dye concentrations necessitate an extended treatment duration with the TiO2/CuInS2/OCN/CQD photocatalyst to achieve the desired efficiencies. With a reaction time of 60 minutes, the TiO2/CuInS2/OCN/CQD material achieves 98.2% RY145 removal efficiency, surpassing the performance of other previously reported TiO2/activated carbon, g-C3N4–SrTiO3, CuO–ZnO, and Cu–NiO/ZnO photocatalyst materials (Table S3†).
To replicate real-world conditions, we prepared the RY145 dye solution using water samples sourced from rivers and lakes, around Hanoi, Vietnam, specifically the To Lich River, Red River, Tay Lake, and Hoan Kiem Lake, as depicted in Fig. 7F. This figure reveals a notable decline in RY145 treatment efficiency for samples from the To Lich River, Tay Lake, and Hoan Kiem Lake when compared to those prepared with distilled water. After 60 minutes of light exposure, the RY145 dye treatment efficiency using the TiO2/CuInS2/OCN/CQD photocatalyst for the aforementioned water sources were 52.13%, 95.32%, 73.96%, and 76.42%, in sequence. This diminished efficiency seen in the water from To Lich River can be attributed to the high concentrations of organic materials and suspended particles in the water. These compounds hinder and react with reactive species such as ˙O2− and ˙OH, thereby considerably reducing the efficiency of RY145 treatment. This observation aligns with findings reported by our previous studies.50,71
We also explored the effects of anion including Cl−, CO32−, NO3−, SO42− and HCO3− at a concentration of 10 mM on the RY145 treatment process, as these are ions that may well be found in wastewater streams. As shown in Fig. 7H, these anions were found to influence RY145 treatment efficiency. They engage with the photocatalyst's surface and counteract reactive species, leading to diminished reactive species formation.71 Among the investigated anions, CO32− and HCO3− considerably affected the RY145 treatment, as they interact with reactive species and simultaneously elevate the pH of the reaction environment, shifting it to alkaline and reducing the degradation efficiency.50
The stability of the TiO2/CuInS2/OCN/CQD photocatalyst was demonstrated through the repeated oxidation reactions of RY145, indicating >94% oxidation efficiency after five reaction cycles (Fig. S8†). No marked differences appear in the XRD, TEM, and XPS results following these cycles (Fig. S9 and S10,† as compared to Fig. 2 and 3). However, high-resolution spectra of O 1s, C 1s, N 1s, Cu 2p, In 3d, and S 2p show bond energy shifts to higher levels, confirming electron loss during reactive species formation involved in RY145 degradation (see Fig. 2 and 3).50 After five reaction cycles, the catalyst remains highly stable and reusable, thus the photocatalyst has a stable structure, tightly bound together by carbon quantum dots and the photocatalytic reaction is carried out under environmental temperature and pressure conditions. Furthermore, this Z-scheme photocatalyst has dual charge transfer, which protects the conduction bands of higher energy semiconductors.72
3.3. Photocatalytic mechanism
Fig. 7H reveals the significant influence of ˙O2−, ˙OH radicals, electrons (e−), and holes (h+) on the efficiency of RY145 treatment. Specifically, after 60 minutes of visible light exposure, the treatment efficiencies for O2− radicals, ˙OH radicals, electrons (e−), and holes (h+) are 54.71%, 72.86%, 68.12%, and 61.63%, respectively. These results indicate that the ˙O2− radical has the most profound effect on the reaction rate.In Fig. 8A, due to the negative redox potentials of TiO2 (−0.45 eV), CuInS2 (−0.96 eV), and OCN (−0.68 eV) relative to the O2/˙O2− potential (−0.33 eV), ˙O2− radicals are produced across all three photocatalysts.73 In CuInS2 and OCN's conduction band (CB), the redox energy is lower than H2O/˙OH (2.4 eV), preventing formation of ˙OH radicals in the valence band.74 Conversely, the redox energy of TiO2 (2.85 eV) exceeds the energy of formation of H2O/˙OH, leading to ˙OH radical formation. When integrating the third-generation heterogeneous catalysts TiO2/CuInS2/OCN through CQD bridges at each interface, conditions favour electron and hole movement, as shown in Fig. 8B. After visible light excites the electrons, they transition from the valence to the conduction band. Electrons from OCN and TiO2 then transition to CuInS2's valence band via the CQD bridges (OCN → CQD → CuInS2 and TiO2 → CQD → CuInS2), increasing the electron density on CuInS2. Surface vacancies and oxygen defects can trap these electrons or holes, reducing their recombination rate. Additionally, the reactive species participate in the decomposition of RY145 dye, which is expected to result in a range of degradation products.
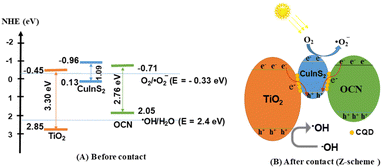 | ||
| Fig. 8 Schematic of the separation transfer before contact (A) and possible Z-scheme transfer (B) in the TiO2/CuInS2/OCN/CQD photocatalyst. | ||
3.4. Degradation mechanism of RY-145 dye
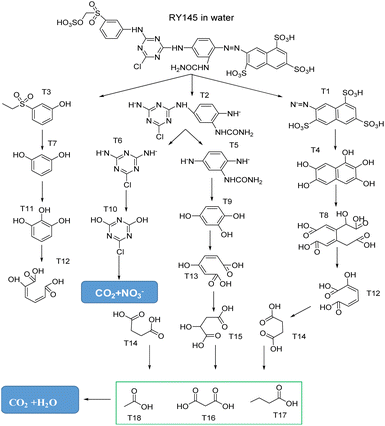
LC-MS analyzed RY145 dye samples to understand the photocatalytic reaction under optimal conditions. Fig. 9 presents the degradation mechanism of RY145 on the TiO2/CuInS2/OCN/CQD photocatalyst, based on LC-MS results at different intervals. Following the formation of reactive species, they contribute to the cleavage of the –SO3− group and the C–N bond, yielding intermediate products T1 (m/z 396.30), T2 (m/z 292.54), T3 (m/z 186.07), T4 (m/z 208.12), T5 (m/z 163.23), T6 (m/z 145.52) and T7 (m/z 110.21).63,75 These intermediates undergo further oxidation, leading to lower molecular weight products during the cleavage processes with m/z values of T8 (m/z 274.05), T9 (m/z 126.23), T10 (m/z 148.50) and T11 (m/z 126.23). The LC-MS results show that low molecular weight products such as T12, T13 (m/z 158.22), T14 (m/z 118.13), T15 (m/z 134.16), malonic acid (T16, m/z 104.06), butyric acid (T17, m/z 88.15) and acetic acid (T18, m/z 60.12) are formed during the cleavage process of the intermediate products T8–T11. After 60 minutes, the TOC, BOD, and COD removal efficiencies are 50.38%, 80.36%, and 75.82%, respectively, underscoring the TiO2/CuInS2/OCN/CQD photocatalyst's high mineralization efficiency (Fig. S12†).4. Conclusion
This research synthesized a cutting-edge heterogeneous Z-scheme photocatalyst, TiO2/CuInS2/OCN combined with CQD. The CQD's ultra-small particles amplify the interaction between active phases, enhancing RY145 oxidation process in water, reaching 98.2% degradation efficiency. The degradation rate outpaces standalone TiO2, CuInS2, and OCN. The Z-scheme principles underline the photocatalyst's efficiency, with all reactive species significantly impacting RY145 treatment. Factors like RY145 concentration, catalyst concentration, pH, anions, and water source majorly influence the process. The catalyst achieves TOC, BOD, and COD removal efficiencies of 50.38%, 80.36%, and 75.82%, respectively, maintaining over 94% efficiency after five cycles. These results highlight the synergistic effect of combining these components, and the resulting TiO2/CuInS2/OCN/CQD photocatalyst's potential for treating water pollutants.Author contributions
Manh B. Nguyen: investigation, formal analysis, data curation, writing – original draft. Pham Thi Lan: conceptualization, investigation, formal analysis, data curation. Nguyen Tuan Anh: conceptualization, investigation, formal analysis, data curation. Nguyen Ngoc Tung: conceptualization, investigation. Shaoliang Guan: investigation, formal analysis, data curation. Valeska P. Ting: conceptualization, investigation, formal analysis, data curation. T.-Thanh-Bao Nguyen: formal analysis, data curation. Huan V. Doan: conceptualization, investigation, data curation, writing – reviewing and editing. Mai Thanh Tung: formal analysis, data curation. Tran Dai Lam: investigation, formal analysis, data curation, writing – original draft and reviewing and editing.Conflicts of interest
There are no conflicts to declare.Acknowledgements
This work was funded by The Vietnam Academy of Science and Technology (VAST) under the grant number NCXS 01.01/22-24.References
- A. Boretti and L. Rosa, npj Clean Water, 2019, 2, 15 CrossRef.
- Y. Yang, Chem. Eng. J., 2023, 146150 Search PubMed.
- Y. Song, L. Wang, X. Qiang, W. Gu, Z. Ma and G. Wang, J. Water Process. Eng., 2023, 55, 104242 CrossRef.
- M. I. H. Mondal and U. M. Takebira, Sci. Total Environ., 2023, 903, 166854 CrossRef CAS PubMed.
- S. A. El-Kholy, E. K. Radwan, M. E. El-Naggar, S. T. El-Wakeel and I. El-Tantawy El Sayed, J. Environ. Chem. Eng., 2023, 11, 110652 CrossRef CAS.
- M. Solís, A. Solís, H. I. Pérez, N. Manjarrez and M. Flores, Process Biochem., 2012, 47, 1723–1748 CrossRef.
- N. Garg, A. Garg and S. Mukherji, J. Environ. Manage., 2020, 263, 110383 CrossRef CAS PubMed.
- N. Al-Zaqri, Opt. Mater., 2023, 143, 114139 CrossRef CAS.
- M. J. Khosravi, S. M. Hosseini and V. Vatanpour, J. Environ. Chem. Eng., 2022, 10, 108644 CrossRef CAS.
- R. R. Mathiarasu, A. Manikandan, K. Panneerselvam, M. George, K. K. Raja, M. A. Almessiere, Y. Slimani, A. Baykal, A. M. Asiri, T. Kamal and A. Khan, J. Mater. Res. Technol., 2021, 15, 5936–5947 CrossRef CAS.
- E. Erusappan, S. Thiripuranthagan, R. Radhakrishnan, M. Durai, S. Kumaravel, T. Vembuli and N. J. Kaleekkal, J. Environ. Chem. Eng., 2021, 9, 105776 CrossRef CAS.
- D. Van Le, M. B. Nguyen, P. T. Dang, T. Lee and T. D. Nguyen, RSC Adv., 2022, 12, 22367–22376 RSC.
- X. N. Pham, T. D. Pham, B. M. Nguyen, H. T. Tran and D. T. Pham, J. Chem., 2018, 2018, 8418605 Search PubMed.
- Y. Zhang, K. Li, M. Zang, Y. Cheng and H. Qi, Chemosphere, 2023, 341, 140038 CrossRef CAS PubMed.
- W. Feng, Y. Lei, X. Wu, J. Yuan, J. Chen, D. Xu, X. Zhang, S. Zhang, P. Liu, L. Zhang and B. Weng, J. Mater. Chem. A, 2021, 9, 1759–1769 RSC.
- J. Li, X. Lv, B. Weng, M. B. J. Roeffaers and H. Jia, Chem. Eng. J., 2023, 461, 142022 CrossRef CAS.
- D. E. Lee, M. K. Kim, M. Danish and W. K. Jo, Catal. Commun., 2023, 183, 106764 CrossRef CAS.
- K. He, Int. J. Hydrogen Energy, 2023 DOI:10.1016/j.ijhydene.2023.08.050.
- M. B. Nguyen, X. N. Pham and H. V. Doan, RSC Adv., 2021, 11, 31738–31745 RSC.
- A. Umar, M. S. Chauhan, S. Chauhan, R. Kumar, G. Kumar, S. A. Al-Sayari, S. W. Hwang and A. Al-Hajry, J. Colloid Interface Sci., 2011, 363, 521–528 CrossRef CAS PubMed.
- H. Bahiraei, S. Azarakhsh and S. Ghasemi, Ceram. Int., 2023, 49, 21050–21059 CrossRef CAS.
- M. Faisal, J. Ahmed, J. S. Algethami, A. M. El-Toni, J. P. Labis, A. Khan and F. A. Harraz, Mater. Sci. Semicond. Process., 2023, 167, 107798 CrossRef CAS.
- J. Li, Y. Wang, Y. Wang, Y. Guo, S. Zhang, H. Song, X. Li, Q. Gao, W. Shang, S. Hu, H. Zheng and X. Li, Nano Mater. Sci., 2023, 5, 237–245 CrossRef CAS.
- N. T. Dung, N. Van Hiep, M. B. Nguyen, V. D. Thao and N. N. Huy, Korean J. Chem. Eng., 2021, 38, 2034–2046 CrossRef CAS.
- X. N. Pham, M. B. Nguyen, H. S. Ngo and H. V. Doan, J. Ind. Eng. Chem., 2020, 90, 358–370 CrossRef CAS.
- Z. Zhang, R. Guo, C. Xia, C. Li and W. Pan, Sep. Purif. Technol., 2023, 323, 124461 CrossRef CAS.
- Y. Yang, X. Zheng, Y. Song, Y. Liu, D. Wu, J. Li, W. Liu, L. Fu, Y. Shen and X. Tian, Int. J. Hydrogen Energy, 2023, 48, 3791–3806 CrossRef CAS.
- J. Zhang, Y. Zhao, K. Qi and S. Yuan Liu, J. Mater. Sci. Technol., 2024, 172, 145–155 CrossRef.
- H. V. T. Nguyen, M. B. Nguyen, H. V. Doan and X. N. Pham, Mater. Res. Express, 2023, 10, 085506 CrossRef.
- Y. Nakamura, Y. Iso and T. Isobe, ACS Appl. Nano Mater., 2020, 3, 3417–3426 CrossRef CAS.
- F. Xu, J. Zhang, B. Zhu, J. Yu and J. Xu, Appl. Catal., B, 2018, 230, 194–202 CrossRef CAS.
- S. Luo, J. Ke, M. Yuan, Q. Zhang, P. Xie, L. Deng and S. Wang, Appl. Catal., B, 2018, 221, 215–222 CrossRef CAS.
- D. Scheunemann, S. Wilken, J. Parisi and H. Borchert, Phys. Chem. Chem. Phys., 2016, 18, 16258–16265 RSC.
- Y. Lan, Y. Lu and Z. Ren, Nano Energy, 2013, 2, 1031–1045 CrossRef CAS.
- M. Bigdeli, H. Azimi and R. Yousefi, J. Alloys Compd., 2023, 968, 172033 CrossRef.
- J. Wen, J. Xie, X. Chen and X. Li, Appl. Surf. Sci., 2017, 391, 72–123 CrossRef CAS.
- J. Liang, X. Yang, Y. Wang, P. He, H. Fu, Y. Zhao, Q. Zou and X. An, J. Mater. Chem. A, 2021, 9, 12898–12922 RSC.
- W. J. Ong, L. L. Tan, Y. H. Ng, S. T. Yong and S. P. Chai, Chem. Rev., 2016, 116, 7159–7329 CrossRef CAS PubMed.
- F. Guo, W. Shi, M. Li, Y. Shi and H. Wen, Sep. Purif. Technol., 2019, 210, 608–615 CrossRef CAS.
- Y. Wang, J. Chen, X. Yang, X. Liu, M. Que and Y. Ma, Mater. Today Commun., 2023, 37, 106969 CrossRef CAS.
- X. Wu, X. Wang, I. Lynch, Z. Guo, P. Zhang, L. Wu, P. Ning and N. Ren, J. Hazard. Mater., 2023, 640, 132323 CrossRef PubMed.
- X. Wang, H. Jing, C. Yu, Q. Li, H. Sun and Z. Chen, J. Solid State Chem., 2023, 325, 124165 CrossRef CAS.
- H. Jiang, Y. Zhong, K. Tian, H. Pang and Y. Hao, Appl. Surf. Sci., 2022, 577, 151902 CrossRef CAS.
- D. L. Zhao, H. Jin, Q. Zhao, Y. Xu, L. Shen, H. Lin and T. S. Chung, J. Membr. Sci., 2023, 679, 121706 CrossRef CAS.
- J. Zhang, R. Liu, M. Kuang, S. Xie, J. Wang and Z. Ji, Mater. Lett., 2023, 101, 135004 CrossRef.
- H. Teymourinia, H. A. Alshamsi, A. Al-nayili, E. Sohouli and M. Gholami, J. Ind. Eng. Chem., 2023, 125, 259–268 CrossRef CAS.
- A. Kumar, S. K. Sharma, G. Sharma, M. Naushad and F. J. Stadler, J. Alloys Compd., 2020, 838, 155692 CrossRef CAS.
- S. Li, X. Liu, Y. Zheng, J. Ma, S. You and H. Zheng, Chin. Chem. Lett., 2023, 108971 CrossRef.
- X. N. Pham, H. T. Nguyen, T. N. Pham, T. T. B. Nguyen, M. B. Nguyen, V. T. T. Tran and H. V. Doan, J. Taiwan Inst. Chem. Eng., 2020, 114, 91–102 CrossRef CAS.
- M. B. Nguyen, D. T. Sy, V. T. K. Thoa, N. T. Hong and H. V. Doan, J. Taiwan Inst. Chem. Eng., 2022, 140, 104543 CrossRef CAS.
- X. Fu, J. Tao, Z. He, Y. Gao, Y. Xia and Z. Zhao, J. Mater. Sci.: Mater. Electron., 2022, 33, 24663–24676 CrossRef CAS.
- A. A. Silahua-Pavón, C. G. Espinosa-González, F. Ortiz-Chi, J. G. Pacheco-Sosa, H. Pérez-Vidal, J. C. Arévalo-Pérez, S. Godavarthi and J. G. Torres-Torres, Catal. Commun., 2019, 129, 105723 CrossRef.
- A. K. John, S. Palaty and S. S. Sharma, J. Mater. Sci.: Mater. Electron., 2020, 31, 20868–20882 CrossRef CAS.
- B. Bruno, M. Vallet, S. Hurand, F. Maudet, C. Sartel, M. Fr, S. Nowak, G. Amiri, S. Hassani, D. Aureau, V. Sallet, Y. Dumont and G. André, Appl. Surf. Sci., 2023, 641, 158446 CrossRef.
- L. Tan, J. Xu, X. Zhang, Z. Hang, Y. Jia and S. Wang, Appl. Surf. Sci., 2015, 356, 447–453 CrossRef CAS.
- R. Tamilselvan and A. I. Selwynraj, Fuel, 2024, 357, 129901 CrossRef CAS.
- C. N. A. Cu, ECSN, 2023, 140125 Search PubMed.
- H. Wei, W. A. McMaster, J. Z. Y. Tan, L. Cao, D. Chen and R. A. Caruso, J. Phys. Chem. C, 2017, 121, 22114–22122 CrossRef CAS.
- L. Ming, H. Yue, L. Xu and F. Chen, J. Mater. Chem. A, 2014, 2, 19145–19149 RSC.
- Y. C. Chu, T. J. Lin, Y. R. Lin, W. L. Chiu, B. S. Nguyen and C. Hu, Carbon, 2020, 169, 338–348 CrossRef CAS.
- C. Saka, Fuel, 2022, 310, 122444 CrossRef CAS.
- C. Liu, B. Zhang, E. Liu, X. Hu, Q. Q. Hao and J. Fan, Opt. Mater., 2020, 109, 110379 CrossRef CAS.
- G. T. T. Pham, H. T. Vu, T. T. Pham, N. N. Thanh, V. N. Thuy, H. Q. Tran, H. V. Doan and M. B. Nguyen, RSC Adv., 2023, 13, 12402–12410 RSC.
- C. Lai, J. Zhong, J. Chen and Y. Zhu, J. Ind. Eng. Chem., 2023, 128, 306–316 CrossRef CAS.
- B. Pant, G. P. Ojha, Y. S. Kuk, O. H. Kwon, Y. Wan Park and M. Park, Nanomaterials, 2020, 10, 1–12 CrossRef PubMed.
- M. Karimi-Nazarabad and E. K. Goharshadi, Sol. Energy Mater. Sol. Cells, 2017, 160, 484–493 CrossRef CAS.
- Y. He, J. Huang, B. Wang and Y. Qu, Appl. Surf. Sci., 2023, 610, 155255 CrossRef CAS.
- M. Preeyanghaa, V. Vinesh, P. Sabarikirishwaran, A. Rajkamal, M. Ashokkumar and B. Neppolian, Carbon, 2022, 192, 405–417 CrossRef CAS.
- X. Chen, C. Chen and J. Zang, Diamond Relat. Mater., 2023, 139, 110385 CrossRef CAS.
- D. A. Yaseen and M. Scholz, Textile Dye Wastewater Characteristics and Constituents of Synthetic Effluents: A Critical Review, Springer Berlin Heidelberg, 2019, vol. 16 Search PubMed.
- N. Trung Dung, N. Hoang Duc, V. Thai Binh, V. Dinh Thao, M. B. Nguyen, L. Viet Ngan and N. Nhat Huy, Sep. Purif. Technol., 2021, 285, 120358 CrossRef.
- A. Kumar, S. Kumar, G. Sharma, M. Naushad and F. J. Stadler, J. Alloys Compd., 2020, 838, 155692 CrossRef CAS.
- H. Li, S. Xue, F. Cao, C. Gao, Q. Wei, R. Li, A. Zhou, S. Wang and X. Yue, Chemosphere, 2023, 325, 138336 CrossRef CAS PubMed.
- X. Li, F. Ye, H. Zhang, M. Ahmad, Z. Zeng, S. Wang, S. Wang, D. Gao and Q. Zhang, J. Environ. Chem. Eng., 2023, 11, 110329 CrossRef CAS.
- M. B. Nguyen, G. H. Le, T. Duy, Q. K. Nguyen, T. Trang, T. Pham, T. Lee and T. A. Vu, J. Hazard. Mater., 2021, 420, 126560 CrossRef PubMed.
Footnotes |
| † Electronic supplementary information (ESI) available. See DOI: https://doi.org/10.1039/d3ra07546j |
| ‡ The authors contributed equally to this work. |
| This journal is © The Royal Society of Chemistry 2023 |

