 Open Access Article
Enhanced near infrared-to-visible upconversion in the CaTiO3:Yb3+/Er3+ phosphor via the host lattice modification using co-doping of Mg2+ ions†
Neeti Tripathi *,
Kenji Kamada
 ,
Hitomi Nakamura
 and
Tomoko Akai
Nanomaterials Research Institute (NMRI), National Institute of Advanced Industrial Science and Technology (AIST), Ikeda, Osaka 563-8577, Japan. E-mail: n-tripathi@aist.go.jp
First published on 5th December 2023
Abstract
The CaTiO3:Er3+/Yb3+ upconversion phosphor was synthesized using a simplified co-precipitation method and the effect of Mg2+ ion co-doping was investigated on the structural and optical properties focusing on the near-infrared (NIR)-to-visible upconversion. The introduction of Mg2+ ions into the host lattice produced substantial changes in the crystal structure, grain size, and absorption, thus leading to the enhancement in upconversion emission intensities. X-ray diffraction (XRD) analysis indicated the formation of polycrystalline CaTiO3–Ca4Ti3O10 composite crystals and an increase in the crystallite size was observed upon increasing the Mg2+ ion concentration in the samples. Elemental analysis by energy dispersive spectroscopy (EDS) suggested the substitution of Ca2+ ions by Mg2+ ions in the CaTiO3 host lattice. Moreover, a change in the Yb3+/Er3+ ratio from 0.25 to 1.1 indicated the redistribution of the Er3+ or Yb3+ ions caused by the Mg2+ ions. These lattice deformations further resulted in an improved absorption of Er3+ ions, exhibiting a ∼3-fold enhancement in the upconversion emission intensity (at the excitation intensity of ∼1 W cm−2).
1 Introduction
Rare earth (RE) ion doped near-infrared (NIR)-to-visible upconversion (UC) nanocrystals (NCs) have attracted tremendous attention in the past decade due to their remarkable and unique optical properties, which makes them favourable in optoelectronic and bio-medical fields.1 Usually, these UCNCs are incorporated into a host lattice with a low phonon energy typically in the range 300–500 cm−1. For that reason, fluoride host materials (phonon energy ∼ 350 cm−1) are being popularly used to incorporate RE ions.2 However, fluoride hosts suffer from a limited stability and are likely to have adverse effects on biosafety and the environment.3 Alternatively, oxide host lattices possess stable physicochemical properties with a moderate phonon energy of ∼500 cm−1. Particularly, CaTiO3 is considered to be a novel host for the doping of RE ions for achieving a good upconversion intensity and excellent stability against ambience. The CaTiO3 host, belonging to the perovskite (ABO3) family, is flexible for the cation substitution at both A and B sites without destroying the matrix structure, which allows for more flexibility to alter the compositional characteristics of the host matrix, and may have substantial influence on the optical transitions of RE ions. Deren et al. demonstrated the upconversion emission in CaTiO3:Er3+ crystals for the first time.4 However, due to a small absorption cross-section, a high excitation power is needed to observe the upconverted emission. Yang et al. used the combination of Yb3+/Er3+ to increase the absorption of the cross-section of Er3+ ions.5 As a result much higher upconversion intensities at a lower excitation power were obtained.6 This combination of Yb3+ sensitizer and Er3+ activator ions has been frequently reported in various host matrices as well.7–9 Apart from the combination and concentration of the sensitizer/activator pairs, various other factors, such as synthesis methods, the crystallite size, and different host lattices, have also shown a significant impact on the upconversion performances.10–12 Particularly, host lattice modulation by the doping of inactive ions has often been used to alter the f–f transition probability, which helps in improving the UC intensity.13,14 These ions may occupy the substitutional or interstitial sites in the crystal lattice and modify the crystal symmetry around the RE ions. The after-effects are interpreted in terms of induced lattice strain, a change in the crystallite size, phase transformations, and other factors. Moreover, hypersensitive transitions of Er3+ ions have shown extreme sensitivity to the small changes in the surrounding environments.15,16 Recently, Jiajia et al.17 reported improved upconversion intensity in CaTiO3:Yb3+/Er3+ nano-cubes by co-doping of Zn2+ ions, due to changes in the crystal field environment of RE ions. Similarly, co-doping of alkali metal ions (Li+, Na+, K+) was also used to relax the forbidden f–f transitions, caused by the local distortion of crystal fields surrounding the activator ions.18,19 Nevertheless, the realization of efficient NIR-to-visible upconversion at low excitation power (close to the magnitude of solar power density) still remains challenging and strategies are needed to systematically modulate the excitation conditions of UCNPs.Here, we designed Ca1−xMgxTiO3:Yb3+/Er3+ upconversion phosphor with varying concentrations of Mg2+ ions into the CaTiO3 host lattice, synthesized by co-precipitation method. In order to simplify the synthesis procedure, TiO2 powder is used as a starting material for the Ti source, whereas nitrates precursors were used for Ca, Mg, Er, and Yb. A series of samples were prepared by varying the concentration of Mg2+ ions (x = 0, 0.02, 0.04, and 0.06), whereas, the ratios of Yb3+ and Er3+ were kept fixed. Co-doping of Mg2+ ions was introduced into the CaTiO3 host lattice to modify the surrounding crystal symmetry of the Yb3+/Er3+ ions, and structural, morphological, optical, and upconversion properties were investigated as a function of Mg2+ ion co-doping.
2 Experimental details
Materials
Titanium dioxide (Fujifilm Wako Pure Chemical Corp., Rutile, 99.9%) powder was used as a titanium source and Ca(NO3)2·6H2O (Sigma-Aldrich, 99.99%) was used as a calcium source. For the doping of Er, Yb, and Mg, nitrates of respective ions (i.e., Er(NO3)2·5H2O, Yb(NO3)2·5H2O, and Mg(NO3)2) were used as received without any further purification. Sodium hydroxide was used as the alkaline medium.Method
Aqueous solutions of all the nitrates and NaOH were prepared beforehand in deionized (DI) water with fixed molarity. To prepare the precursor solution, at first, 0.4 g of TiO2 powder was added to 10 ml of deionized water and kept in an ultrasonication bath for approximately 5 minutes to break the agglomerates. After that, precursor solutions of Ca, Er, Yb, and Mg were added to the TiO2 solution in appropriate volume and stirred at room temperature for about 30 min for homogeneous mixing. Then, 2 ml of 10 M NaOH solution was added dropwise to the above precursor solution to obtain the precipitate (pH > 10), and stirring was continued for another 1 hour to complete the reaction. Solutions were then aged overnight and washed several times with deionized water to remove the excess NaOH. Subsequently, the slurry was centrifuged at 5000 rpm repeatedly, with deionized water until the pH value of the centrifuged liquid reached to 7. After that, the solid precipitate was dried at 250 °C for 3 hours using an air oven. The dried powder was then grinded and sintered at 1100 °C for 5 hours in an air furnace to obtain the CaTiO3:Yb3+/Er3+ upconversion nanocrystals. The same procedure was followed to prepare the series of Ca1−xMgxTiO3:Yb3+/Er3+ (x = 0, 0.02, 0.04 and 0.06) samples with varying Mg2+ contents, and ratio of Er3+ and Yb3+ was kept fixed (1![[thin space (1/6-em)]](https://www.rsc.org/images/entities/char_2009.gif) :
:![[thin space (1/6-em)]](https://www.rsc.org/images/entities/char_2009.gif) 1).
1).
Characterizations
The crystal structure of the powders was identified by X-ray diffraction (XRD) using a Bruker diffractometer with Cu Kα (λ = 0.15406 nm) operating at 40 kV and 40 mA at room temperature. The morphology and elemental composition of the synthesized samples were characterized by scanning electron microscopy (SEM) and energy dispersive spectrometry (EDS) using a JEOL JSM-6510 instrument. Absorption spectra of samples were recorded in a diffused reflectance mode with an integration sphere, using a Shimadzu UV-3150 UV-visible-NIR spectrophotometer. UC emission was recorded using an OceanOptics USB2000-FLG spectrometer through 700 nm short pass filters under excitation by continuous wave (cw) laser light at λexc 980 nm. Excitation intensity was varied using a calibrated dual neutral density (ND) filter wheel. The detailed method for the upconversion quantum efficiency measurement is given in the ESI file.† X-ray photoemission spectra (XPS) were recorded using a PHI5000-VersaProbe photo spectrometer.3 Results and discussion
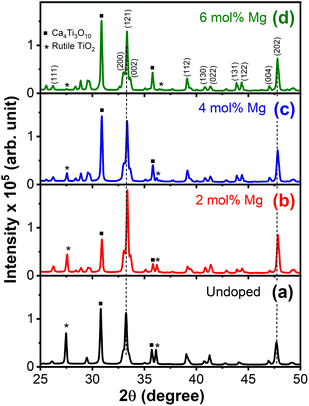
Fig. 1(a)–(d) show the XRD patterns of Ca1−xMgxTiO3:Yb3+/Er3+ at varying doping concentrations of Mg2+ ions. The XRD pattern revealed the coexistence of mixed phases of CaTiO3 and Ca4Ti3O10 in all the samples;20 however, CaTiO3, the orthorhombic phase with the Pbnm space group was the primary phase. The main identified diffraction peaks were in good agreement with the CaTiO3 crystal structure were consistent with the JCPDS card no. 42-0423. Meanwhile, two diffraction peaks corresponding to the pure TiO2 (unreacted) also appeared in the undoped sample; however, the intensity of those peaks decreased gradually, with increasing doping concentration of Mg2+ ions. The suppression of the TiO2 peak with increasing Mg2+ ions could be due to the reaction between TiO2 and Mg2+ ions, however, a clear 2θ shift toward higher angle suggested the incorporation of Mg2+ ions into the CaTiO3 lattice (Fig. S1†). Taking CaTiO3 diffraction peaks into consideration, the average crystallite size was calculated using Debye–Scherrer's equation,21 where K is the shape factor (0.89), λ is the wavelength (0.154 nm), β is the full width at half maximum, and θ is the diffraction angle. Contrary to the 2θ shift, the average crystallize size appeared to increase with increasing Mg2+ doping concentration. This might be due to the interplay between CaTiO3 and Ca4Ti3O10 phases, which have significant differences in their lattice constants (a = 5.37 Å, b = 5.46 Å, c = 7.64 Å for CaTiO3, and a = 5.44 Å, b = 5.53 Å, c = 27.18 Å for Ca4Ti3O10). To estimate the amount of defects in the samples, dislocation density (δ) was calculated by using the formula δ = 1/D2, where D is the crystallite size in nm.21 The obtained values of the grain size and defect density are listed in Table 1. Similar results have been obtained with other rare-earth activated phosphor materials, under the influence of metal ion co-doping.22,23 These changes are attributed to the difference in the cations radii of dopants and the host compound, which results in some distortion in the sublattice structure.
| Sample | D (nm) | δ × 10−4 (nm−2) |
|---|---|---|
| Undoped | 58 | 2.97 |
| 2 mol% Mg | 62 | 2.60 |
| 4 mol% Mg | 65 | 2.37 |
| 6 mol% Mg | 67 | 2.22 |
Further influence of Mg2+ ion doping on the morphology was studied using SEM. Fig. 2(a)–(d) shows the SEM micrographs of Ca1−xMgxTiO3:Yb3+/Er3+, with varying fractions (x = 0, 0.02, 0.04, and 0.06 mol%) of Mg2+ ions. The non-uniform agglomerated spherical particles were observed in all the samples. However, a clear difference in the sizes of these particles can be observed in Fig. 2(a)–(d). A detailed particle size analysis was performed on the SEM images to obtain the statistical data of the particle size distribution for each sample. Fig. 3(a)–(d) depicts the histograms, obtained for about 150 particles for each sample. The undoped sample (Fig. 2(a)) showed a narrow size distribution with an average particle size value of 192 ± 30 nm, whereas Mg2+ doped samples showed a comparatively wide distribution covering a range of small as well as larger size particles. The estimated values of the average particle sizes follow an increasing order with the increasing concentration of Mg2+ concentrations. The incorporation of Mg2+ ions leads to bigger size crystal growth as compared to the pure CaTiO3:Yb3+/Er3+ sample. High-resolution SEM images are shown in the ESI, Fig. S2.†
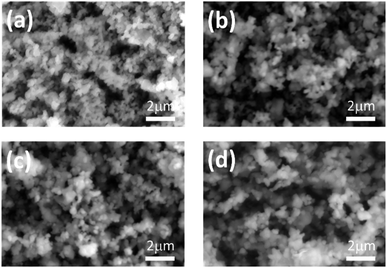 | ||
| Fig. 2 The SEM micrographs of Ca1−xMgxTiO3:Yb3+/Er3+ samples at (a) x = 0, (b) x = 0.02 (c) x = 0.04, and (d) x = 0.06. | ||
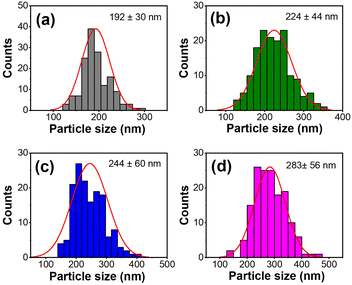 | ||
| Fig. 3 The size distribution histogram of Ca1−xMgxTiO3:Yb3+/Er3+ samples at (a) x = 0, (b) x = 0.02 (c) x = 0.04, and (d) x = 0.06. | ||
To obtain information on the composition, elemental EDS spectra were recorded for all samples. The presence of Ca, Ti, O, Mg, Er, and Yb elements was confirmed from the EDS spectrum (Fig. S3 in ESI†). Further, EDS data was recorded on four or, more different spots in the samples, to obtain qualitative information about the elemental distribution over a wider area. The atomic weight percentage of the Ca2+ was found to be reduced, where Mg2+ content was higher, supporting the fact that Ca2+ ions are substituted by the Mg2+ ions in the CaTiO3 host lattice (Fig. S4a†). Interestingly, the ratio of Yb3+/Er3+ increased from 0.25 to ∼1 for the undoped and Mg2+ ion-doped samples, respectively (Fig. S4b†). This gives an indication of local elemental redistribution, and perhaps increased interactions of the Yb3+/Er3+ ions in Mg2+ doped samples. The compositional analysis from XPS measurement was in good agreement with the Mg2+ doping ratio used in our samples (Fig. S5 and Table S1†).
The optical absorption characteristics and band gap of the pure and Mg2+ ion doped CaTiO3:Yb3+/Er3+ phosphor were evaluated from the, UV-vis diffused reflectance (DR) spectroscopy, as shown in Fig. 4 and 5. Five absorption peaks locations of Er3+ ions located at 452, 490, 523, 544, and 657 nm, were observed for all samples, corresponding to the 4f–4f electronic transitions from ground state 4I15/2 to various excited states.24 The absorption band, 4I15/2 → 2H11/2 located at 523 nm, is the most intense, known as hypersensitive transition (HST).16 This transition is sensitive to any minor change in the surrounding environment of Er3+ ions. We observed an increased absorption in all the transitions including HST transition in the Mg2+-doped sample. This suggests that the doping of Mg2+ ions caused an increase in the energy transferred to the Er3+ ions. Furthermore, the optical bandgap of pure and Mg2+-ion doped samples were estimated using the Schuster–Kubelka–Munk (SKM) relation,21 which expressed as F(R) = (1 − R)2/2R, where R = Rsample/Rreference, and Rsample and Rreference are diffuse reflectances of the sample and the standard (BaSO4). The SKM function F(R) is equivalent to the absorption coefficient (α), therefore, the band gap can be estimated using the Tauc's relation21 between the energy band gap (Eg) and α using the equation; αhν = C(hν − Eg)n/2, where C is the proportionality constant and n is the integer value, which is 1 for direct transitions and 4 for indirect transitions. Putting the SKM function in Tauc's equation, it becomes F(R)hν = C(hν − Eg)n/2. As the CaTiO3 host lattice is a direct band gap material, here, the value of n is taken to be 1. Fig. 4, shows the [F(R)hν]2 versus Eg graph for x = 0 (Fig. 4(a)) to x = 0.06 (Fig. 4(d)). These samples showed a sharp band edge corresponding to the band gap of the host matrix. As the amount of Mg2+ ion doping was increased, the sharp band edge shifted towards the higher energy side. The estimated bad gap values are in the range of 2.94 eV < Eg < 3.12 eV, agreeing with the band gap of CaTiO3. Noticeably, an additional lower energy band edge around 2.97 eV was also observed for the sample with x = 0.06. Theoretical studies25,26 showed that the electronic transition of CaTiO3 occurs inside the [TiO6] octahedral clusters since 2p orbitals of the oxygen atoms in the valence band and 3d orbitals of the titanium atoms can be associated with the conduction band. However, these electronic states tend to relocate to the addition of dopants at cation or anion sites. Rizwan et al.27 reported a first-principal calculation of electronic band structure and optical and structural properties of pure and Mg2+-doped CaTiO3. Calculations suggested that doping Mg2+ ions, not only changes the partial density of states of O 2s states, O 2p states, and Ti d states, but also introduces new states, causing significant changes in optical properties. As a result, an increase in the optical band gap is observed. These observations agree well with the experimental results obtained on our samples at increasing concentrations of Mg2+ ions.
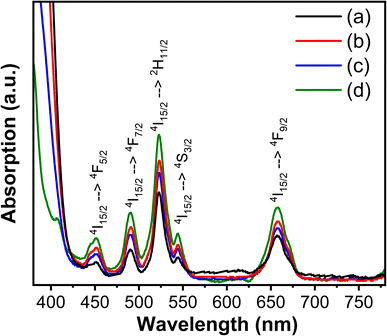 | ||
| Fig. 4 The absorption spectra of Ca1−xMgxTiO3:Yb3+/Er3+ samples at (a) x = 0, (b) x = 0.02 (c) x = 0.04, and (d) x = 0.06. | ||
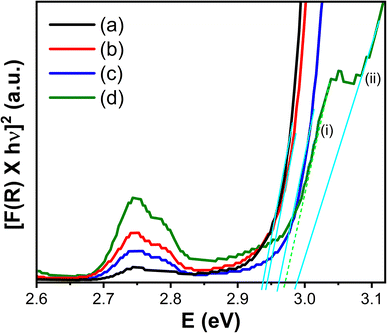 | ||
| Fig. 5 The Schuster–Kubelka–Munk plot for the Ca1−xMgxTiO3:Yb3+/Er3+ samples at (a) x = 0, (b) x = 0.02, (c) x = 0.04, and (d) x = 0.06. | ||
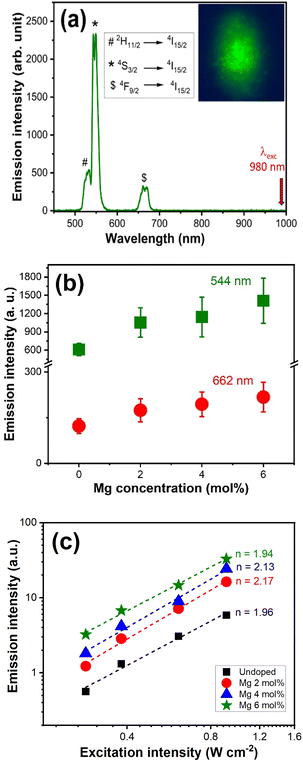
Upconversion emissions of Ca1−xMgxTiO3:Yb3+/Er3+ (x = 0, 0.02, 0.04, and 0.06) were recorded at the excitation wavelength of 980 nm (and at excitation intensity 5 W cm−2). Fig. 6(a) shows the UC emission spectra of the x = 0.06 sample and the inset shows its emission image. The emission spectra of CaTiO3:Yb3+/Er3+ phosphors exhibit three main characteristic transitions of Er3+, from 2H11/2 → 4I15/2 (526 nm), 4S3/2 → 4I15/2 (544 nm), and 4F9/2 → 4I15/2 (662 nm).7,17,21 The green emission is associated with the stepwise two-photon absorbing process of Er3+, popularly known as excited state absorption (ESA) energy transfer from Yb3+ ions followed by 2H11/2 to 4I15/2 and 4S3/2 to 4I15/2 transitions. The upconversion intensity counts of Er3+, as well as the red (R)/green (G) ratio strongly depend on the content of Yb3+ ions. Usually, higher emission intensities of Er3+ emissions are observed at Yb3+ and Er3+ concentrations ratios of 15–20 mol% and 1–2 mol%, respectively. Nonetheless, we were able to achieve a bright upconverted of Er3+ at a relatively lower concentration of Yb3+ ions, i.e., 6 mol%. Emission intensities are optimized to obtain the intense green emission, which was obtained at a Yb3+/Er3+ concentration ratio of 1![[thin space (1/6-em)]](https://www.rsc.org/images/entities/char_2009.gif) :
:![[thin space (1/6-em)]](https://www.rsc.org/images/entities/char_2009.gif) 1.
1.
In this work, Mg2+ ions co-doping was used as a variable parameter, while the Yb3+/Er3+ ratio was kept fixed for all the samples. Therefore, the observed changes in the structural, optical, and upconverted emissions are driven by the inclusion of Mg2+ ions. Considering the non-uniformity of the sample, the emission spectra were collected from 20 different spots on the sample, covering the broad area of the sample, and then average values on the emission intensities were plotted for undoped and Mg2+-doped CaTiO3:Yb3+/Er3+ samples, for green (544 nm) and red (662 nm) emission peaks, as shown in Fig. 6(b). The UC emission intensity counts increased significantly with increasing concentrations of Mg2+ ions in the CaTiO3 host lattice, and at 6 mol% of Mg2+ doping concentration, ∼3-fold enhancement in the upconversion emission intensity of green and red emission was achieved. To obtain the quantitative information, emission quantum efficiencies (UC-QEs) were estimated using the relative method (see ESI file†). Average values of UC-QEs were obtained by collecting the emission and absorbance spectra from more than 20 spots for each sample. UC-QE values of 0.25 ± 0.04% and 0.53 ± 0.14% were obtained for undoped and 6 mol% Mg-doped samples, respectively as shown in Fig. S6.† Based on the observations, this enhancement in the UC-QE is attributed to the following three factors: (i) crystal deformation, allowing the f–f transition of the emission process of Er3+ (ii) increased the size of the crystal and redistribution of the activator ions, and (iii) increased absorption, due to the localized density of the optically active Er3+ ions at the non-equivalent crystallographic sites. As evident from XRD, deformation in the host matrix is likely to alter the crystal field and coordination environment around the activator Er3+ ions favouring the probabilities for f–f transition. Moreover, increased crystal size is helpful in reducing the bulk defects, which reduces non-radiative deactivation, thereby helping to increase the upconversion intensity. Redistribution of the activator ions locally resulted in the increased energy transfer between Yb3+–Er3+. This might further contribute to the decreased cross-relaxation pathways within Er3+ and breaking the concentration quenching effect. In addition to that, increased cross-section absorption is also a contributing factor to the enhanced emission intensity. Previous studies13–15,17 have revealed that f–f transitions of RE ions are much stronger in the lower symmetry sites leading to higher emission intensities. A comparative study on the role of host matrix, ATiO3 (A = Mg, Ca, Sr, Ba) by Luitel et al.14 suggested, that UC properties Er3+ ions located at the lower symmetry Mg2+ and Ca2+ sites exhibit more intense UC emission than those at the higher symmetry Sr2+ and Ba2+ sites. Similar observations have also been reported upon co-doping of Zn2+ ions,17 which are in good agreement with the observed behaviour of CaTiO3:Yb3+/Er3+ phosphor in the presence of Mg2+ ions.
To identify the upconversion photon excitation mechanisms, excitation-intensity (Iex) dependence of UC emission intensity (IUC) was measured under 980 nm. Fig. 6(c) shows the double logarithmic graph of IUC versus Iex in W cm−2. For an unsaturated UC process, the input power dependence of the UC emission intensity (IUC) will be proportional to the n-th power of Iex for the n-photon absorption process (IUC ∝ Iexn). In other words, n represents the number of infrared photons absorbed per visible photon emitted.17 From the linear fitting, the slopes obtained for green and red emission were ∼2, suggesting the existence of a (stepwise) two-photon process in green and red transitions.
4 Conclusions
Ca1-xMgxTiO3:Yb3+/Er3+ (x = 0, 0.02, 0.04, and 0.06) phosphors were prepared by using a non-conventional co-precipitation route, taking TiO2 as the titanium source. The effect of Mg2+ ions co-doping was investigated on the structural and upconversion properties of the phosphor. The crystal structure of CaTiO3 pertained to the doping of Mg2+ ions, suggesting the substitution of Ca2+ by Mg2+ ions in a host lattice. Upconversion intensity was found to be improved for the Mg2+-doped samples, and a ∼3-fold enhancement in the UC emission intensity was observed at a Mg2+-doping concentration of 6 mol%. A bright upconverted emission was observed at the low excitation intensity of ∼1 W cm−2. These results revealed that the co-doping of Mg2+ ions could facilitate three-fold advantages, i.e., increased crystal size, modification of crystal field environment, and increased absorption cross-section. Therefore, this strategy could be beneficial to solve the problem of low absorption-cross section and concentration quenching of RE ions towards the development of an efficient upconversion system.Author contributions
N. T. conceptualized the work, conducted experiments, data analysis, and manuscript writing. K. K. provided experimental support in upconversion measurements and was involved in useful discussions. H. N. helped in conducting the SEM measurements. T. A. was involved in various discussions regarding the data interpretation.Conflicts of interest
There are no conflicts to declare.Notes and references
- K. Zheng, K. Y. Loh, Y. Wang, Q. Chen, J. Fan, T. Jung, S. H. Nam, Y. D. Suh and X. Liu, Nano Today, 2019, 29, 100797 CrossRef CAS.
- V. Bastos, P. Oskoei, E. Andresen, M. I. Saleh, B. Rühle, U. R. Genger and H. Oliveira, Sci. Rep., 2022, 12, 3770 CrossRef CAS PubMed.
- M. F. Torresan and A. Wolosiuk, ACS Appl. Bio Mater., 2021, 4(2), 1191 CrossRef CAS PubMed.
- P. J. Deren, R. Mahiou, R. Pazik, K. Lemanski, W. Sterk and P. Boutinaud, J. Lumin., 2008, 128, 797 CrossRef CAS.
- Z. Yang, K. Zhu, Z. Song, D. Zhou, Z. Yin, L. Yan and J. Qiu, Thin Solid Films, 2011, 519, 5696 CrossRef CAS.
- J. Mu, W. Sun, F. Li, Y. Guan, X. Zhou, J. Li and L. Chen, J. Alloys Compd., 2019, 797, 1002 CrossRef CAS.
- V. Singh, V. K. Rai, N. Singh, M. S. Pathak, M. Rathaiah, V. Venkatramu, R. V. Patel, P. K. Singh and S. J. Dhoble, Spectrochim. Acta, Part A, 2017, 171, 229 CrossRef CAS PubMed.
- Z. Xu, S. Bian, J. Wang, T. Liu, L. Wang and Y. Gao, RSC Adv., 2013, 3, 1410 RSC.
- W. Yu, W. Xu, H. Song and S. Zhang, Dalton Trans., 2014, 43, 6139 RSC.
- P. Ramasamy, P. Manivasakan and J. Kim, RSC Adv., 2014, 4, 34873 RSC.
- Y. Tian, B. Tian, C. Cui, P. Huang, L. Wang and B. Chen, RSC Adv., 2015, 5, 14123 RSC.
- A. K. Singh, P. K. Shahi, S. B. Raib and B. Ullrich, RSC Adv., 2015, 5, 16067 RSC.
- A. Chauhan, S. Kataria, D. Busko, F. A. Cardona, A. Turshatov and B. S. Richards, J. Mater. Chem. C, 2021, 9, 16709 RSC.
- H. N. Luitel, S. Mizuno, T. Tani and Y. Takeda, J. Ceram. Soc. Jpn, 2017, 125, 821 CrossRef CAS.
- Z. Zhao, B. Ai, C. Liu, Q. Yin, M. Xia, X. Zhao and Y. Jiang, J. Am. Ceram. Soc., 2015, 98, 2117 CrossRef CAS.
- M. Seshadri, K. V. Rao, G. N. H. Kumar and Y. C. Ratnakaram, Mater. Sci. Eng., 2009, 2, 012032 Search PubMed.
- M. Jiajia, L. Jinyu and G. Lili, Optoelectron. Lett., 2022, 18, 129 CrossRef.
- Y. Guo, L. Zhao, Y. Fu, H. Dong and H. Yu, CrystEngComm, 2020, 22, 686 RSC.
- P. Li, L. Guo, C. Liang, T. Li, P. Chen, M. Liu and Y. Wu, RSC Adv., 2017, 7, 51233 RSC.
- W. Dong, Q. Bao, X. Gu and G. Zhao, J. Ceram. Soc. Jpn., 2015, 123, 643 CrossRef CAS.
- D. K. Singh, P. K. Baitha and J. Manam, Appl. Phys. A: Mater. Sci. Process., 2016, 122, 668 CrossRef.
- N. Dhananjaya, H. Nagabhushana, B. M. Nagabhushana, B. Rudraswamy, C. Shivakumara, K. Narahari and R. P. S. Chakradhar, Spectrochim. Acta, Part A, 2012, 86, 8 CrossRef CAS PubMed.
- P. K. Vishwakarma, A. Bahadur, A. Maurya and S. B. Rai, Mater. Res. Bull., 2019, 115, 219 CrossRef CAS.
- P. Babu, H. J. Seo, K. H. Jang, R. Balakrishnaiah, C. K. Jayasankar, K.-S. Lim and V. Lavín, J. Opt. Soc. Am. B, 2007, 24, 2218 CrossRef CAS.
- K. Ueda, H. Yanagi, H. Hosono and H. Kawazoe, J. Phys.: Condens. Matter, 1999, 11, 3535 CrossRef CAS.
- M. L. Moreira, E. C. Paris, G. S. do Nascimento, V. M. Longo, J. R. Sambrano, V. R. Mastelaro, M. I. B. Bernardi, J. Andrés, J. A. Varela and E. Longo, Acta Mater., 2009, 57, 5174 CrossRef CAS.
- M. Rizwan, A. Shahid, T. Mahmood, A. A. Zafar, I. Aslam, N. Adnan, T. Hussain, H. B. Jin and C. B. Cao, Phys. B, 2019, 568, 88 CrossRef CAS.
Footnote |
| † Electronic supplementary information (ESI) available: EDX, elemental distribution graph. See DOI: https://doi.org/10.1039/d3ra05938c |
| This journal is © The Royal Society of Chemistry 2023 |

