
 Open Access Article
 This Open Access Article is licensed under a Creative Commons Attribution-Non Commercial 3.0 Unported Licence
Effects of crystal structure and electronic properties on lithium storage performance of artificial graphite
Zhiwei Liu†
 ,
Yang Shi†,
Qinghe Yang,
Haiping Shen,
Qiming Fan and
Hong Nie*
,
Yang Shi†,
Qinghe Yang,
Haiping Shen,
Qiming Fan and
Hong Nie*
Research Institute of Petroleum Processing, SINOPEC, Beijing, 100083, PR China. E-mail: niehong.ripp@sinopec.com
First published on 13th October 2023
Abstract
Graphite is nowadays commonly used as the main component of anode materials of lithium-ion batteries (LIBs). It is essential to deeply investigate the fundamentals of artificial graphite to obtain excellent anode, especially crystal structure and electronic properties. In this report, a series of graphite with different crystal structure were synthesized and used for anodes of LIBs. Meanwhile, a concise method is designed to evaluate qualitatively the conductivity of lithium ion (σLi) and a profound mechanism of lithium storage was revealed in terms of solid state theory. The conductivity analysis demonstrates that the graphite with longer crystal plane and lower stacking layers possesses higher conductivity of electron (σe). On the other hand, lower initial charge/discharge voltage indicates the graphite with lower La and higher Lc holds higher conductivity of lithium ion (σLi). According to the solid state theory, graphite is considered to be a semi-conductor with zero activation energy, while the lithium intercalated graphite is like a conductor. The conductivity of graphite mainly depends on the σe, while the conductivity of lithium intercalated graphite can be determined by the summation of σe and σLi. In lower charge/discharge rate, Li+ have enough time to insert into the graphitic layer, making the special capacity of graphite primarily determined by σe. However, with the increase of charge/discharge rate, Li+ insertion/extraction will become more difficult, making σLi become the mainly factor of the graphite special capacity. Therefore, the graphite with longer crystal plane and lower stacking layers owns higher specific capacity under slow charge/discharge rate, the graphite with shorter crystal plane and higher stacking layers shows relatively lower specific capacity under rapid charge/discharge rate. These results provide important insights into the design and improvement of graphite's electrochemical performance.
Introduction
The large consumption of non-renewable fossil fuels brings about a series of environmental problems. Nowadays low-carbon renewable economic development has become the consensus in many countries, renewable energy from solar and wind resources are becoming increasingly popular.1 Meanwhile, the demand for environmentally friendly electronic devices, such as mobile phones, laptops, electric vehicles, has continuously undergone rapid expansion, which is an unprecedented opportunity for the development of rechargeable batteries.2,3 Lithium-ion batteries (LIBs) have been widely applied in many devices due to their ideal energy storage capability and reliable electrochemical performance.4–6 As one of the crucial constituents, the composition, structure and surface properties of the anode materials play important roles in LIBs.Carbon materials have been extensively studied as the key anodes for LIBs because of high stability, excellent conductivity and structural diversity,7,8 i.e. soft carbon,9 hard carbon,10,11 mesoporous carbon,12 carbon nanotubes13 and carbon fibers.14,15 However, these carbon materials usually show low initial coulombic efficiency and high discharge-voltage plateau caused by high surface area and large amorphous carbon structure, limiting their application in LIBs.16 Over a period of time, graphite is still served as an ideal component for LIBs anode materials owing to its low average discharge potential (0.2 V vs. Li|Li+), high coulombic efficiency, outstanding cyclic performance and low cost.3,17
Petroleum coke, the readily available raw material of artificial graphite, contains high content of non-metallic heteroatoms, i.e. S, N, O.18,19 Heteroatoms would be gradually removed from carbon network while undergoing the heat treatment process (about 1300–1600 °C) and graphitization processes (about 3000 °C) in the form of volatile hydrocarbons, SOx and NOx emission,20 causing various defects of microcrystalline. These defects change the graphitic electronic properties, influencing the specific capacity in terms of Li+ intercalation/deintercalation in a great extent. Graphite derived-from oil-based needle coke graphitization possesses an initial discharge specific capacity ranging from 350 mA h g−1 to 360 mA h g−1 under a slow charge/discharge rate. On the contrary, graphite derived-from conventional petroleum coke graphitization has an initial discharge specific capacity ranging from 320 mA h g−1 to 350 mA h g−1.
On the other hand, in order to obtain more excellent graphitic anode materials, extensive efforts have been engaged in adjusting the surface structure, chemical composition and crystal structure of graphitic materials.21–23 Qian et al. fabricated a multi-channel-structure graphite by the use of KOH etching, the generating holes on the surface could enhance the Li-ion storage sites and shorten the Li-ion diffusion distance, resulting in better rate capability and cyclability.24 Lin et al. obtained the mildly O-doping expanded graphite by means of perchloric acid as oxidizing agent, which shows an excellent rate capacity with 397 mA h g−1 at 0.2 C and 250 mA h g−1 at 1.6 C on account of the increased defects and interlayer space resulted from O-doping.25 Ma et al. doped sulfur onto the graphite surface using MgSO4 as the sulfate source. S doping causes augment of the conductivity and defects of graphite, providing additional Li+ storage sites enhance the rate performance.26 The previous contributions powerfully demonstrate that the electrochemical performance of graphite could be increased by enhancing the defects and storage sites, extending interlayer space and shortening diffusion distance.
Up to now, researchers generally believe that the electrochemical performance of graphite is closely related to crystal structure, the electronic properties and the transportation of Li ions. In other words, the specific capacity of graphite is influenced by Li+ insertion/extraction and electronic conduction, which are relied on the surface and inner polarization of graphite. The surface polarization is caused by the surface structure and chemical composition, and inner polarization results from the difference of graphite's crystal structure. During the charge/discharge process, polarization can hinder the Li+ motion resulting in higher initial charge/discharge voltage. Thus, the initial charge/discharge voltage could be applied in evaluating qualitatively the conductivity of lithium ion (σLi). Furthermore, the main cause of inner polarization is the electric resistance of the graphite microcrystalline, which could be tested by electron conductivity (σe). Theoretically, the graphite samples vary from each other in terms of crystal structure, determining intrinsically the mode of lattice vibration and band structure. The electron-phonon collision could fundamentally change the vectors of electron conduction powered by the given electric field, causing the electric resistance. In 1947, Wallace calculated the graphite's band structure and quantitatively investigated the graphite's electron conductivity of two direction: parallel and perpendicular to the microcrystalline graphitic layer planes.27 Although the graphite has been detailedly studied by means of characterization techniques like XRD and Raman, it is rarely seen that theoretical investigation concerning the relationships among the graphite's crystal structure, electron conductivity, Li+ conductivity and specific capacity, especially initial discharge specific capacity during Li+ intercalation/deintercalation.
Herein, the graphite with different crystal structure was obtained and used as anode of LIBs. By analyzing the initial charge/discharge voltage at different current density, a concise method is designed to evaluate qualitatively the conductivity of lithium ion (σLi). Combined the solid-state theory, this work issued a detailed explanation concerning the graphite's crystal structure, electronic properties, the conductivity of lithium ion and electrochemical performance. These will provide an available guidance for the development of high-performance graphite anode of LIBs.
Experimental
Synthesis of materials
The artificial graphite was obtained from the graphitization process of petroleum coke, generally produced by the industrial delayed-coking process. Three kinds of petroleum cokes were fabricated in a laboratory scale with the thermal coking method in high-pressure autoclaves. The corresponding feeds of petroleum coke are vacuum residue and deashed oil slurry, acquired by the distillation of raw oil slurry, derived from catalytic cracking process. The properties of petroleum cokes can be tuned by changing the fraction of deashed oil slurry in feed combination of vacuum residue and deashed oil slurry in the range of 3–20% (weight percentage), constant thermal conversion temperature in the range of 440–470 °C, and thermal conversion pressure in the range of 0.10–0.30 MPa (G). The duration of the thermal conversion will not be altered. The petroleum cokes should still undergo the heat treatment (1300 °C) and graphitization (2800 °C), before being treated as artificial graphite.Characterization of materials
Field emission scanning electron microscopy (FE-SEM) images were obtained on a Hitachi SU-8010 scanning electron microscope (SEM), operated at 5 kV. The surface area and the diameter distribution were measured using the Malvern mastersizer 2000. X-ray Diffraction (XRD) patterns of two types of graphite were taken by Philips PW 1700 with Cu Ka radiation (Kα = 0.15405 nm), using a voltage of 40 kV and a current of 30 mA. X-ray photoelectron spectroscopy (XPS) measurements were carried out on a PHI Quantera SXM, to detect the signals on the surface elements of the given graphite samples, focusing on their chemical composition and bonding configuration of the composites. For XPS measurements, a micro-focused monochromated Al Kα X-ray source was used under a vacuum of 5 × 10⁻⁹ mbar, and the analyzed region was 0.4 mm × 0.4 mm. The high resolution transmission electron microscopy (HR-TEM) images were obtained on a JEOL JEM-2100 electron microscope, with an acceleration voltage of 200 kV. Raman spectra were acquired by a DilorXY800 Raman microprobe (Horiba, Edison, NJ) using 532 nm incident radiation with an Innova 308c Ar+ laser (Coherent, Inc., Santa Clara, CA) operating at 5145 Å with an output power of 1 mW. The powder resistivity was measured using PRCD-1100, fabricated by Yuanneng Technology (Xiamen) Co., Ltd. Powder samples (1–2 g) were loaded into the measuring mold, which was installed into the pre-compaction instrument. After the 15-second-long pre-compaction process, the mearing mold was going to be fixed into the powder resistivity instrument PRCD-1100. During the testing process, parameters such as pressure, resistance, resistivity, conductivity, sample thickness, compaction density, temperature, humidity, etc., were automatically collected by the instrument.Electrochemical measurements
The tested graphite anode sheet was fabricated by coating a slurry mix on a 10-μm-thick pure copper sheet with a 150 μm doctor blade, dried at 100 °C in vacuum environment for 8 hours. The dried graphite anode sheet was pressed with a roll, in order to control the compaction density of the measured graphite anode sheet in the range of 1.15–1.35 g cm−3. The slurry mix was prepared by mixing a dry mix with a ratio 92![[thin space (1/6-em)]](https://www.rsc.org/images/entities/char_2009.gif) :3:2:3, comprising 92 weight percentage of graphite powder sample, 3 weight percentage of conductive additive powder, 2 weight percentage of sodium carboxymethyl cellulose (CMC) and 3 weight percentage of styrene butadiene rubber (SBR). These two kinds of binder were before head dissolved in pure water to form the 1.5% CMC solution and 10% SBR solution, respectively. The assembly of cells were completed in an Ar-filled glove box (MBRAUN UNILAB, H2O < 0.1 ppm, O2 < 0.1 ppm), using 1 mol l−1 LiPF6 with the 1:1:1 mixture (volume%) of ethylene carbonate, dimethyl carbonate and diethyl carbonate as the electrolyte. The pure lithium sheet was used as the counter electrode of the half cell. Galvanostatic charge/discharge behavior of the half cell was tested by a Land CT2001A battery testing system (Wuhan Jinnuo Electronics Co. Ltd, China) within a voltage window of 0.005–1.5 V for graphite‖Li half-cell at room temperature (25 °C). The charge/discharge rate is 0.1 C, with the nominal specific capacity 350 mA h g−1.
:3:2:3, comprising 92 weight percentage of graphite powder sample, 3 weight percentage of conductive additive powder, 2 weight percentage of sodium carboxymethyl cellulose (CMC) and 3 weight percentage of styrene butadiene rubber (SBR). These two kinds of binder were before head dissolved in pure water to form the 1.5% CMC solution and 10% SBR solution, respectively. The assembly of cells were completed in an Ar-filled glove box (MBRAUN UNILAB, H2O < 0.1 ppm, O2 < 0.1 ppm), using 1 mol l−1 LiPF6 with the 1:1:1 mixture (volume%) of ethylene carbonate, dimethyl carbonate and diethyl carbonate as the electrolyte. The pure lithium sheet was used as the counter electrode of the half cell. Galvanostatic charge/discharge behavior of the half cell was tested by a Land CT2001A battery testing system (Wuhan Jinnuo Electronics Co. Ltd, China) within a voltage window of 0.005–1.5 V for graphite‖Li half-cell at room temperature (25 °C). The charge/discharge rate is 0.1 C, with the nominal specific capacity 350 mA h g−1.
Results
In order to study the differences of microcrystal structure among these graphite samples mentioned above, the XRD characterization was carried out with the corresponding patterns illustrated in Fig. 1. All the graphite samples exhibit diffraction peaks located near the typical diffraction angle 2θ = 26.44°, 42.25°, 44.52° and 54.52°, assigned to the graphite (002), (100), (101) and (004) crystal plane, respectively.28 As for three graphite sample, nominated as S, B and K, the d-spacings of (002) crystal plane, noted as d002, are calculated to be about 0.337 nm listed in Table 1. Using Bragg's equation and Scherrer's equation, the average microcrystalline height Lc(002), the average stacking number of graphitic layer (N) and the average microcrystalline length (La(100)) can be calculated. According to the results, graphite sample K has the maximum value of Lc(002) and N, while the graphite sample S has the minimum value. Interestingly, the graphite sample S has the maximum value of La(100), while the graphite sample K has the minimum value. This probably suggests that the microcrystalline of graphite sample K possesses larger stacking height and shorter length.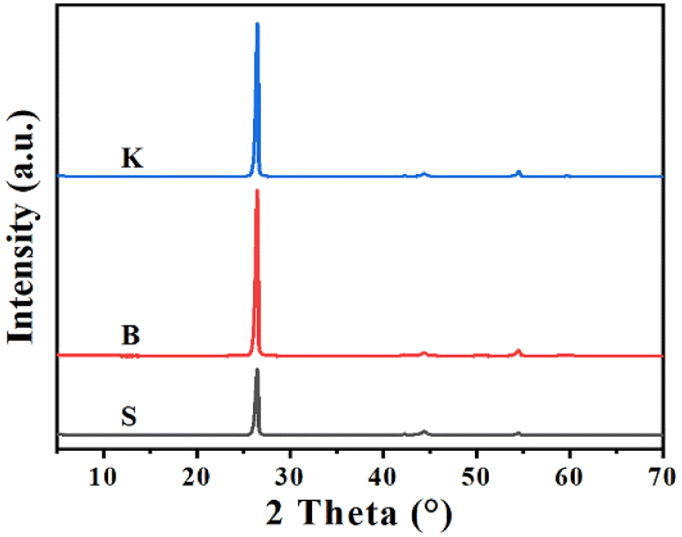 | ||
| Fig. 1 XRD characterization of graphite samples. | ||
| Sample | 2θ(002), ° | d(002), nm | Lc(002), nm | N | La(100), nm |
|---|---|---|---|---|---|
| S | 26.46 | 0.3368 | 24.31 | 73.16 | 58.88 |
| B | 26.44 | 0.3371 | 27.87 | 83.69 | 54.12 |
| K | 26.47 | 0.3367 | 28.66 | 86.12 | 53.46 |
Raman spectroscopy is frequently used to investigate graphene's microcrystalline structure, lattice vibration or physical properties, with the detection depth up to 10 nm from the sample's surface. Although graphite is far more complex than graphene, it is still meaningful to characterize graphite by Raman spectroscopy for a deeper understanding about graphite's disordered structure. The Raman spectra of three graphite samples are displayed in Fig. 2. The peak emerged at Raman shift 1580 cm−1 represents the degeneration of optical phonons LO and TO located at the center in graphite's hexagonal Brillouin zone with E2g symmetry. It is widely accepted that this peak is attributed to the sp2-carbon structure of graphite (G-band).12 The peak at Raman shift 1340 cm−1 is triggered by the double resonance Raman scattering involving defects scattering and TO optical phonons, located at the fringe of the hexagonal Brillouin zone. Therefore, the Raman shift 1340 cm−1 is assigned to the defective carbon structure, sp3-carbon as an example, of graphite or graphene (D-band). As the D-band reflects the defects of graphite or graphene, illustrated by the its peak intensity ID, the peak intensity ratio (ID/IG) could be used to evaluate the proportion of sp2-carbon or disordered carbon. As for the graphite samples given, it could be seen that all three samples exhibit measurable G peak respectively, indicating the existence of well-developed graphitized structure. Among these samples, the ratio of peak intensity ID/IG shows an increasing trend in the order of S < B < K, confirming a relatively high disorder status for graphite sample K.29 Combined with the XRD results, it could be concluded that the graphite with more “edge sites” is exactly the graphite with more defects, while the reverse seems to be true as well.
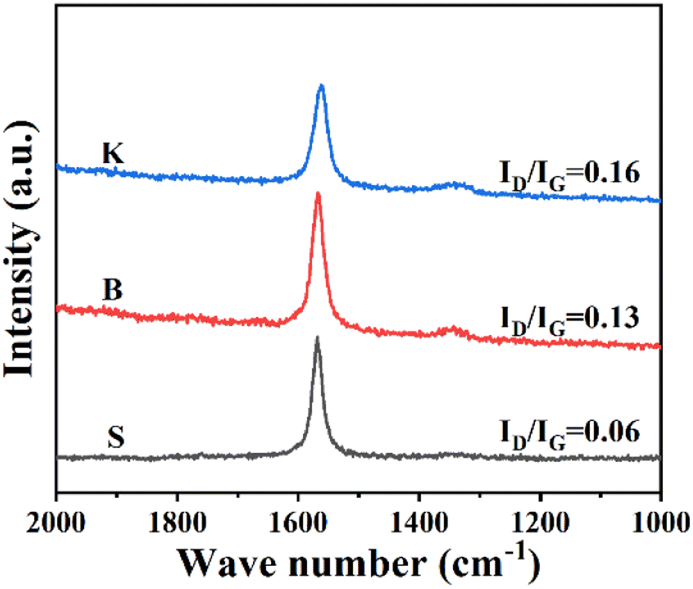 | ||
| Fig. 2 Raman spectra of graphite samples. | ||
The morphology and microstructure of the samples were investigated by SEM and TEM as shown in Fig. 3. As shown in SEM images, there are no obvious differences in the morphology of the given three samples. These graphite samples all consist of irregular micron-sized particles with relatively smooth surface and similar particle size distribution (Fig. 3a–c). The corresponding EDS analysis shows that only C peaks could be shown in the picture, indicating that carbon could be detected 100% while other elements be trace, as illustrated in the inset of Fig. 3a–c. In addition, the TEM and HRTEM images of these samples were shown in Fig. 3d–i, distinct layered structure and lattice fringe could be clearly seen, indicating that all these samples show high graphitization degree after undergoing high temperature treatment. Consequently, the SEM and TEM diagrams suggest that three samples show typical characteristics of graphite, laying the foundation for the following investigation.
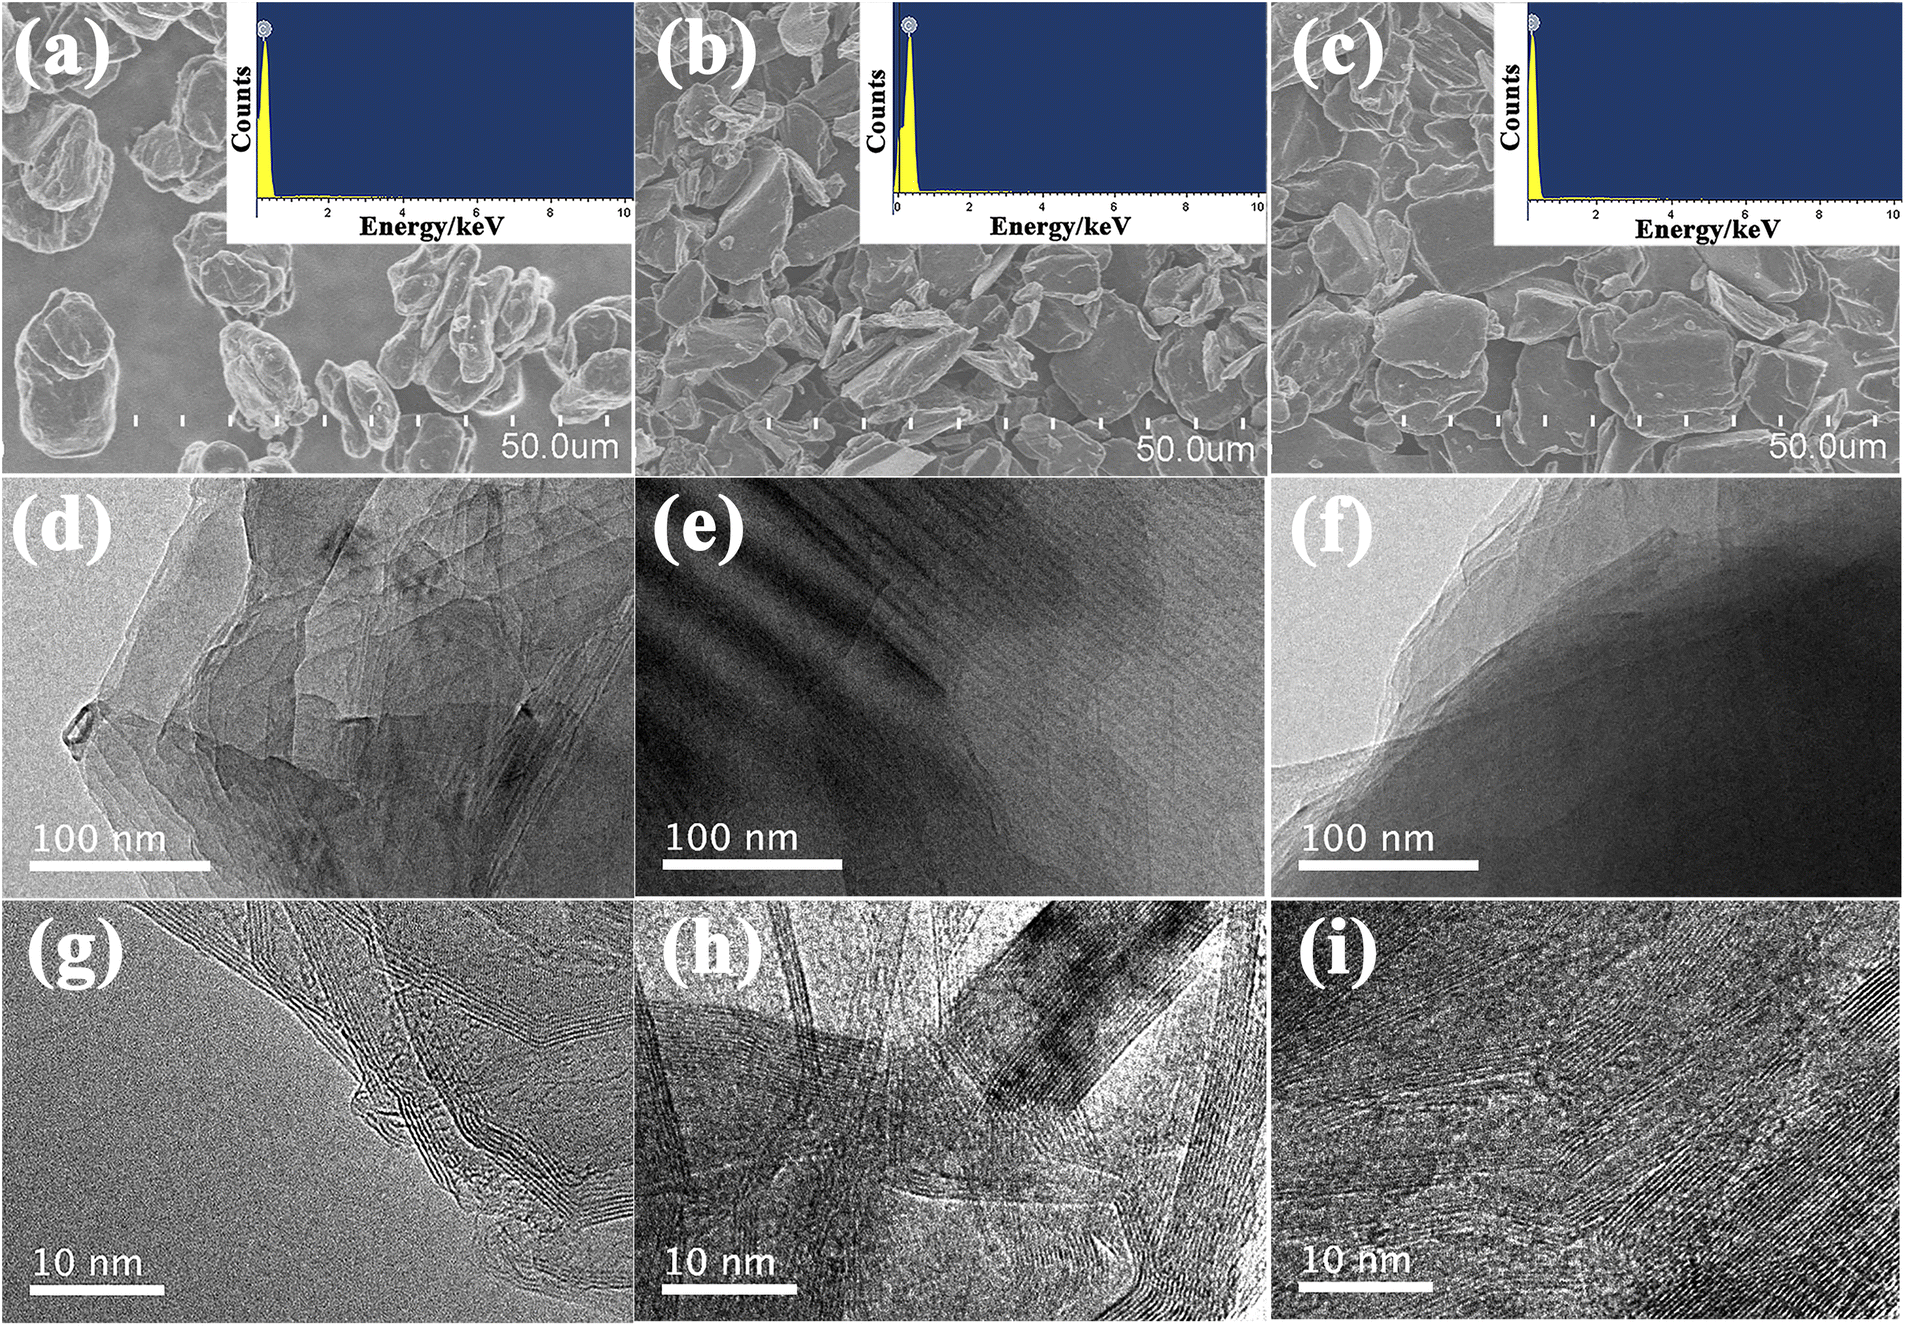 | ||
| Fig. 3 SEM images and EDS mapping (inset) of S (a), B (b) and K (c); TEM and HRTEM images of S (d and g), B (e and h) and K (f and i). | ||
In order to analyze the oxygen-containing functional groups on the surface of three graphite samples, FT-IR spectrum was put into use and the results were shown in Fig. 4. The peaks around 2850 cm−1 and 2920 cm−1 attributed to the –CH2 symmetric and asymmetric stretching, respectively. Peaks located near 1375 cm−1 and 1460 cm−1 ascribed to –CH3 symmetric and asymmetric stretching.30 Peak at about 1050 cm−1 is attributed to the C–O–C.31,32 The broad band at 3430 cm−1 is attributed to the stretching vibration of hydroxyl of the carboxylic acid group.33 Obviously, the peak intensity of graphite K at 3430 cm−1 is stronger than the other two samples, indicating that the edge sites could hold more –OH groups. The peak at 1636 cm−1 is attributed uniquely to C![[double bond, length as m-dash]](https://www.rsc.org/images/entities/char_e001.gif) C unsaturated structures of aromatic rings.34 Interestingly, the peak intensity of graphite K at 1636 cm−1 is also the highest among these graphite samples given, suggesting that the microcrystal structure of graphite K exposes much more disconnected hexagonal carbon rings. Combined with the results of XRD, Raman and FT-IR characterization, it can be probably concluded that the microcrystalline of graphite K is characterized with higher layer stacking and meanwhile shorter length in the direction parallel to the graphitic layer, is endowed with more edge sites or defects, which are rich in surface –OH or –COOH functional groups converted from adsorbed O2 or H2O.
C unsaturated structures of aromatic rings.34 Interestingly, the peak intensity of graphite K at 1636 cm−1 is also the highest among these graphite samples given, suggesting that the microcrystal structure of graphite K exposes much more disconnected hexagonal carbon rings. Combined with the results of XRD, Raman and FT-IR characterization, it can be probably concluded that the microcrystalline of graphite K is characterized with higher layer stacking and meanwhile shorter length in the direction parallel to the graphitic layer, is endowed with more edge sites or defects, which are rich in surface –OH or –COOH functional groups converted from adsorbed O2 or H2O.
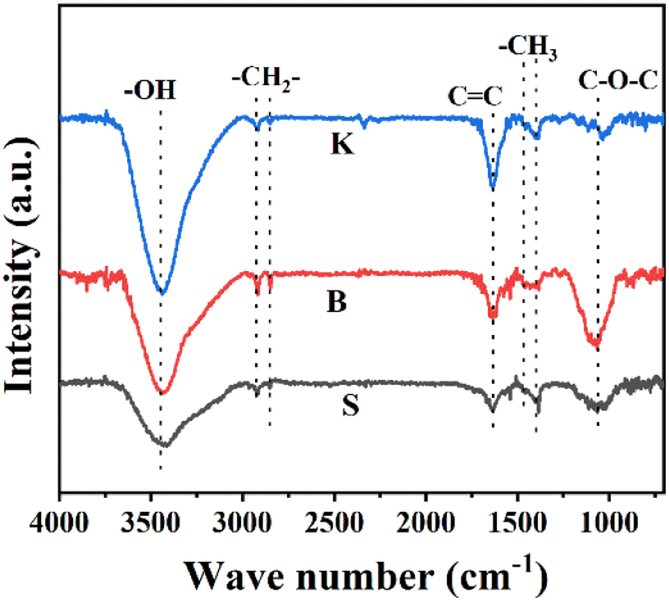 | ||
| Fig. 4 FT-IR spectra of three graphite materials. | ||
For the sake of further understanding about elemental states and corresponding bonds, surface information of three samples was obtained by XPS techniques, and the results are illustrated in Fig. 5. The XPS spectra display two peaks at 284 eV and 532 eV, attributed to C 1s and O 1s, respectively. Three graphite samples given all have distinct O 1s peak on their surface. It is worth noting that lots of oxygen could be found in the result of XPS, although no oxygen element could be detected by EDS. The reason is that the detection depth of XPS is less than 10 nm from the sample surface (several atomic layers), but the detection depth of EDS is around 1–3 μm. The differences between XPS and EDS results demonstrated that the reaction between graphite carbon and air only occurs within several atomic layers from the surface or edge sites (defects of microcrystalline). Meanwhile, these graphite samples still maintain highly ordered graphite structure inside them. In order to understand the chemical bond configuration of O atoms, high resolution XPS spectra of O 1s are further obtained, as illustrated in Fig. 5b–d and their deconvolution results are listed in Table 2. Generally, the peak at 532.1 eV is associated with C–O, and the band at 533.3 eV corresponds to –COOH.35 The quantitative results listed in Table 2 show the concentration of –COOH are increasing according to the sequence S < B < K, demonstrating that the graphite with more edge sites has higher reactivity with air, which is consistent with FT-IR characterization. It is obvious that the surface property of graphite plays a crucial role in graphite's electrochemical performance. Graphite with higher stacking number and shorter microcrystal length (larger Lc/La ratio) will expose more edge sites. The edge sites, caused by surface defects, could also promote the formation of –OH or –COOH because of the surface reaction with O2 and H2O in the air, which is harmful for the coulombic efficiency of graphite, when it comes to charging/discharging of Li+.
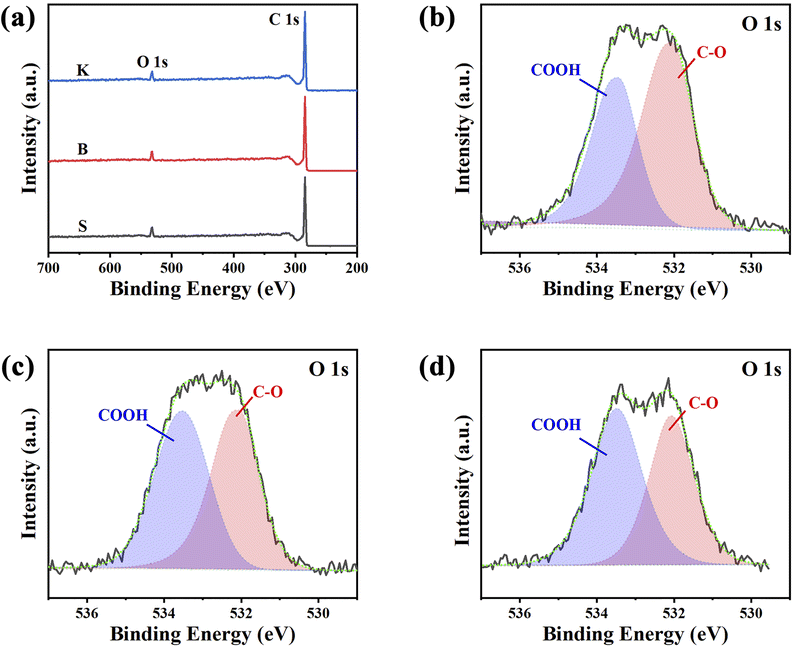 | ||
| Fig. 5 XPS surveys of three samples (a), high-resolution O 1s spectra of S (b), B (c) and K (d). | ||
| Samples | C, % | O, % | O 1s (%) | |
|---|---|---|---|---|
| C–O | COOH | |||
| S | 93.83 | 6.040 | 58.41 | 41.59 |
| B | 94.24 | 5.641 | 48.22 | 51.78 |
| K | 94.97 | 4.962 | 45.18 | 54.82 |
The electronic conductivity could reflect the impeding effect exerted on the moving electrons. The initial discharge specific capacity, a frequently used parameter for graphite qualification as LIB's anode material, means actually the total quantity of electron (1e = 1.6 × 10⁻¹⁹ C) that can be discharged from graphite under a condition of fixed voltage range within approximately fixed time duration of half-cell testing. Usually, the fixed voltage range is 0.005–1.5 V or 0.001–2 V, while the fixed time duration for discharge is approximately 10 h. Therefore, the initial discharge specific capacity equally means the instantaneous current intensity discharged from graphite, which is strongly affected by graphite's electronic conductivity under a fixed voltage range. The electronic conductivity measurement of graphite powder, on which different test pressure was exerted successively, was carried out to investigate the relationships between the graphite's microcrystal structure and its electronic property. As is shown in Fig. 6, the electronic conductivity of graphite sample increases as the exerted test pressure grows. Among the graphite samples given, the electronic conductivity shows an increasing trend in the following order: K < B < S, which is simultaneously the same sequence as that of the microcrystalline length La and the reverse sequence as that of ratio ID/IG.
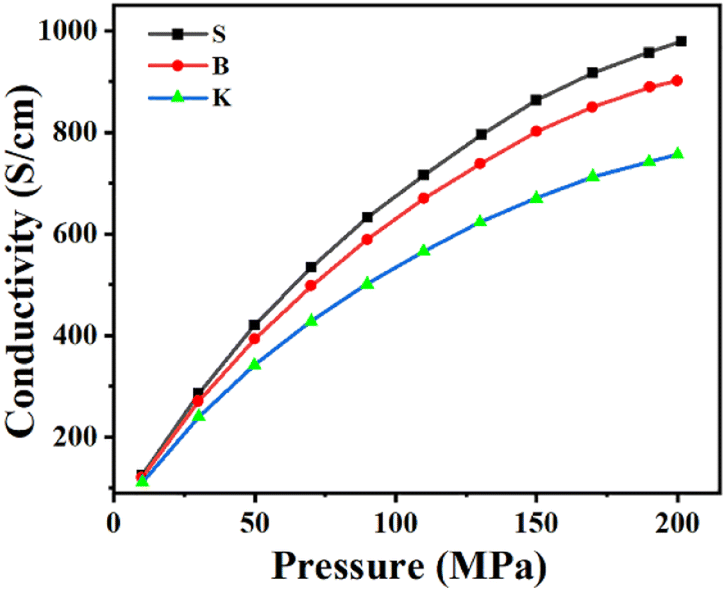 | ||
| Fig. 6 Conductivity measurements of three graphite samples. | ||
The charge/discharge curves of 3 samples were illustrated in Fig. 7a–c. In general, discharging represents Li+ insertion process mainly into the graphitic layers, while charging represents the Li+ extraction process out of the graphite. The first charge/discharge specific capacities are: 427.65 mA h g−1 and 351.7 mA h g−1 (sample S), 462.88 mA h g−1 and 345.35 mA h g−1 (sample B), 450.64 mA h g−1 and 337.99 mA h g−1 (sample K). The corresponding initial coulombic efficiencies (CE) are: 82.24% (S), 74.61% (B) and 75.00% (K), respectively. The concept reversible capacity is similar to the initial discharge specific capacity in value, describing the graphite's intrinsic ability for Li+ storage. What is noteworthy is that the reversible capacities of three samples show an increasing trend in the sequence of S > B > K, which is consistent with the trend of La value within the given graphite samples. Therefore, it can be implied that the longer microcrystal of graphite holds more intercalation sites for Li storage. The intercalation sites are able to anchor the Li ions, forming the graphite-Li compounds LixC (0 < x < 1).36 Moreover, the rate performance of three samples was evaluated and the capacity retention at different current densities are displayed in Fig. 7d. It could be seen that sample S exhibits higher capacities at 0.1, 0.2, 0.5 and 1 C, but shows a sharp decline when the current density is 2 C. On the contrary, sample K shows the largest reversible capacity in compare with the other two samples in 2 C. As for sample B and S, B shows more reversible capacity than S under 2 C condition. Due to the less edge sites, sample S holds slower electrode kinetics means difficult charge transfer at higher current density, resulting in the reversible capacity for sample S is lower as compare to sample B and sample K at high current density.37 According to this result and investigation about graphite's La and Lc parameters, it shows that graphite with bigger value in parameter Lc owns more reversible capacity in high-rate charging/discharging condition. An explanation is given: the microcrystal of graphite with high Lc value and low La value owns with large stacking number and short length. This microcrystal exposes a great numbers of edge sites, which are favorable for Li+ intercalation and deintercalation, leading to an improvement of graphite's rate performance. In addition, when current density shifting from 2 C to 0.1 C, it could be seen that S retains about 357 mA h g−1 (99% retention), B retains about 354 mA h g−1 (98% retention) and K retains about 345 mA h g−1 (98% retention) after 30 cycles in Fig. 7d, which demonstrates that three samples have the great cycling stability. Fig. 7e and f display the initial discharge voltage and initial charge voltage with different current densities for LIB half cells. As can be seen from Fig. 7e and f, the initial discharge voltage of three samples decreases with the increase of current density. On the contrary, the initial charge voltage of the given samples increases with the increase of current density. With detailed inspection and comparison of Fig. 7e and f, the initial discharge voltage and initial charge voltage of sample K are noticed to be the lowest among three samples, suggesting that Li+ insertion/extraction may be easier than others, because of less polarization. The microcrystal with higher stacking number and shorter length can not only provide more edge sites for Li+ adsorption/desorption, but also shorten the path for Li ions diffusion, which are both beneficial for rate performance. Besides, the electrochemical impedance spectroscopy (EIS) is also important method to explore the electrode and electrolyte interaction38 and thus, it is necessary to carry out EIS to further reveal the Li+ transmission in the future.
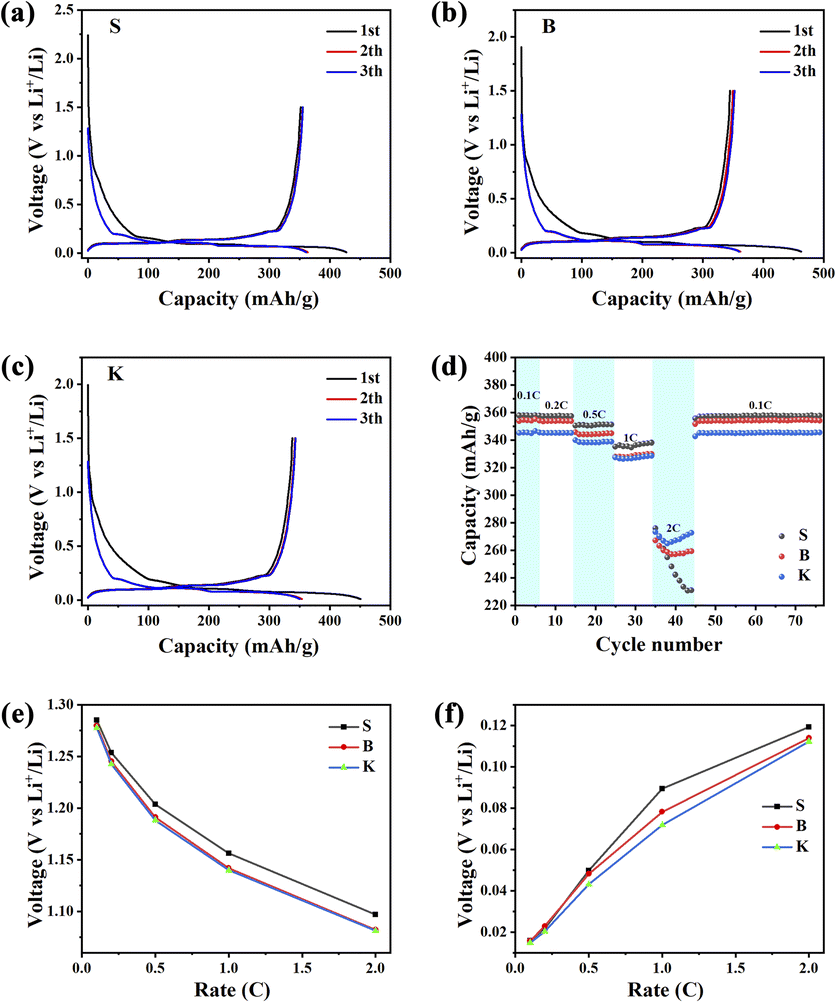 | ||
| Fig. 7 Charge and discharge profiles of S (a), B (b), K (c) at 0.1 A g−1; Rate performance of 3 samples at different current densities for LIBs (d); initial discharge voltage (e) and initial charge voltage (f) at different current densities for LIBs. | ||
Therefore, it could be reasonably concluded that low Lc value and high La value is beneficial for graphite's reversible capacity under low current density condition, while high Lc value and low La value is useful for graphite's reversible capacity under high current density condition (enhancement of rate performance). These results provide new important insights into the improvement the electrochemical performance of graphite, potentially used for the preparation of LIB anode material.
Discussion
Previous studies showed the capacity of artificial graphite is closely related to its electrical conductivity and the crystal structure, but researchers have not treated the relationship between electron or Li ions conductivity and the crystal structure in much detail. Therefore, this work tried to establish a bridge between conductivity and crystal structure to deeply explore their influence on lithium storage performance. Graphite is considered to be a semi-conductor with zero activation energy27 or semi-metal.39 The value of La represent the basal planes which are parallel to the graphene layer and the value of Lc represent the edge sites which expose the end face or defects of graphitic crystal. The edge sites exhibit higher Li+ insertion/extraction reactivity than basal planes, resulting in higher rate performance. However, the graphite with high La show higher capacity.In order to further clarify the relation between capacity and crystal structure of graphite, it is essential to understand the conduction of various carriers. After Li+ insert into graphite, the carriers of graphite could be considered to consist of electron and Li+. Therefore, the conduction of material can be simple treated as the conduction of two carriers. Due to the conductivity is additive, the conductivity of graphite inserted with Li could be calculated by formula: σ(Gr − Li) = σe(Gr) + σLi, where Gr is graphite, σ(Gr − Li) is the conductivity of graphite inserted with Li, σe(Gr) is conductivity of electron and σLi is conductivity of Li+. There are many studies focus on the conduction of Li+,40 however, to our best know, the report about the conduction of electron is limited.
Generally, the conductivity of electron σe(Gr) = ne2·τ(εF)/m*, where n is the number density of electron, m−3; e is the charge of electron, 1e = 1.6 × 10⁻¹⁹ C; τ(εF) is relaxation time of electrons on Fermi surface, s; m* is the effective mass of electron, J s2 m−2. Based on this theory and our results, the effects of graphitic crystal on electronic conduction could be revealed as following. In the transmission process, electron can be scattered by phonons, and large angle scattering will significantly change the direction of electron motion and generate resistance. With the increase of ID/IG and Lc, more defects and edge sites could boost the adverse effect derived from phonons, which can bring about the decline of relaxation time and impede the conductivity. Meanwhile, the graphite with high Lc and defects holds higher O content on the surface, doping carbon with heavier atoms could also shorten the relaxation time, resulting in lower conductivity. It is worth noting that the electron originates from the large delocalized π bond, which is decided by the length of basal planes. Higher La and lower ID/IG suggest the basal planes are enough long, leading to more the electronic number.
On the other hand, the graphitic crystal structure could also affect the conduction of Li+. The graphite with higher Lc and shorter length exposes more edge site, which could increase Li+ insertion/extraction reactivity as illustrated in Fig. 7e and f. Combined σ(Gr − Li) = σe(Gr) + σLi, this work obtains the following conclusion. In lower current densities, Li-ions have enough time to insert into the graphitic layer, thus, the capacity of anode is primarily determined by the electronic conductivity. However, with the increase of current densities, Li+ insertion/extraction will become more and more difficult, thus, the conductivity of Li+ becomes mainly factor to the capacity of anode. Finally, it could be reasonably concluded that the graphite with lower stacking layer and longer length could increase the reversible capacity of LIBs, and higher and shorter crystal are useful for enhancement of rate performance, especially at higher current density. This work reveals the effects of crystal structure and electronic conduction on the capacity of graphite, which provide new important insights into design and improvement the electrochemical performance of graphite anode.
Conclusions
In summary, the graphite with different crystal structure was prepared successfully and used as anode of LIBs. Through analyzing the change of initial charge/discharge voltage at different current density, a simple method was designed to assess the conductivity of lithium ion (σLi). Combined the crystal structure and the conductivity of electron (σe), this work further clarifies the mechanism about graphite's specific capacity under different charge/discharge rate in terms of solid state theory. The longer layer planes (higher La) can increase the conductivity of electron, and the higher stacking microcrystalline (higher Lc) expose more edge site, which can enhance the conductivity of lithium ion. The graphite capacity is determined by the summation of σe and σLi. In lower current densities, Li+ have enough time to insert into the graphitic layer, making the special capacity of graphite primarily determined by σe. However, with the increase of charge/discharge rate, Li+ insertion/extraction will become more difficult, making σLi become the mainly factor of the graphite special capacity. The graphite with lower stacking layer and longer length exhibit higher the reversible capacity of LIBs. Therefore, it could be reasonably concluded that the graphite with lower stacking layer (lower Lc) and longer length (higher La) of the microcrystalline could increase the specific capacity of graphite, while higher Lc and shorter microcrystal length (lower La) are useful for enhancement of rate performance, especially at rapid charge/discharge rate. These results provide important insights into the design and improvement of graphite's electrochemical performance.Conflicts of interest
There are no conflicts to declare.Acknowledgements
We gratefully acknowledge the support from the China Petrochemical Corporation (Sinopec Group, 119019-3) on this work.Notes and references
- S. Yang, W. Dong, D. Shen, S. Li, W. Sun, X. Hong, M. Wang and Y. Mao, Chem. Eng. J., 2017, 309, 674–681 CrossRef CAS.
- G. Song, J. Ryu, S. Ko, B. M. Bang, S. Choi, M. Shin, S.-Y. Lee and S. Park, Chem.–Asian J., 2016, 11, 1711–1717 CrossRef CAS PubMed.
- H. Aghamohammadi, N. Hassanzadeh and R. Eslami-Farsani, Ceram. Int., 2021, 47, 22269–22301 CrossRef CAS.
- H. D. Yoo, I. Shterenberg, Y. Gofer, G. Gershinsky, N. Pour and D. Aurbach, Energy Environ. Sci., 2013, 6, 2265–2279 RSC.
- R. Schmuch, R. Wagner, G. Hörpel, T. Placke and M. Winter, Nat. Energy, 2018, 3, 267–278 CrossRef CAS.
- Z. P. Cano, D. Banham, S. Ye, A. Hintennach, J. Lu, M. Fowler and Z. Chen, Nat. Energy, 2018, 3, 279–289 CrossRef.
- A. Gomez-Martin, J. Martinez-Fernandez, M. Ruttert, A. Heckmann, M. Winter, T. Placke and J. Ramirez-Rico, ChemSusChem, 2018, 11, 2776–2787 CrossRef CAS PubMed.
- W. Long, B. Fang, A. Ignaszak, Z. Wu, Y.-J. Wang and D. Wilkinson, Chem. Soc. Rev., 2017, 46, 7176–7190 RSC.
- B.-H. Kim, J.-H. Kim, J.-G. Kim, J. S. Im, C. W. Lee and S. Kim, J. Ind. Eng. Chem., 2017, 45, 99–104 CrossRef CAS.
- L. Xie, C. Tang, Z. Bi, M. Song, Y. Fan, C. Yan, X. Li, F. Su, Q. Zhang and C. Chen, Adv. Energy Mater., 2021, 11, 2101650 CrossRef CAS.
- M. Khosravi, N. Bashirpour and F. Nematpour, Adv. Mater. Res., 2014, 829, 922–926 Search PubMed.
- M. Xie, X. Zhu, D. Li, Z. Xu, Y. Huang, H. Zha, M. Ding and C. Jia, J. Power Sources, 2021, 514, 230593 CrossRef CAS.
- K. Evanoff, J. Khan, A. A. Balandin, A. Magasinski, W. J. Ready, T. F. Fuller and G. Yushin, Adv. Mater., 2012, 24, 533–537 CrossRef CAS PubMed.
- J. Zhang, R. Chu, Y. Chen, H. Jiang, Y. Zhang, N. M. Huang and H. Guo, Nanotechnology, 2018, 29, 125401 CrossRef PubMed.
- W. Li, M. Li, K. R. Adair, X. Sun and Y. Yu, J. Mater. Chem. A, 2017, 5, 13882–13906 RSC.
- M. Winter, B. Barnett and K. Xu, Chem. Rev., 2018, 118, 11433–11456 CrossRef CAS PubMed.
- X. Liu, E. Liu, D. Chao, L. Chen, S. Liu, J. Wang, Y. Li, J. Zhao, Y.-M. Kang and Z. Shen, RSC Adv., 2016, 6, 104010–104015 RSC.
- J. Xiao, F. Li, Q. Zhong, J. Huang, B. Wang and Y. Zhang, J. Anal. Appl. Pyrolysis, 2016, 117, 64–71 CrossRef CAS.
- V. Kapustin and V. Glagoleva, Pet. Chem., 2016, 56, 1–9 CrossRef CAS.
- R. T. Wincek, Hydrodesulfurization of Fluid Catalytic Cracking Decant Oils for the Production of Low-Sulfur Needle Coke Feedstocks, The Pennsylvania State University, 2013 Search PubMed.
- L. J. Fu, H. Liu, C. Li, Y. P. Wu, E. Rahm, R. Holze and H. Q. Wu, Solid State Sci., 2006, 8, 113–128 CrossRef CAS.
- C. Zhou, A. Li, B. Cao, X. Chen, M. Jia and H. Song, J. Electrochem. Soc., 2018, 165, A1447–A1454 CrossRef CAS.
- N. C. Gallego, C. I. Contescu, H. M. Meyer, J. Y. Howe, R. A. Meisner, E. A. Payzant, M. J. Lance, S. Y. Yoon, M. Denlinger and D. L. Wood, Carbon, 2014, 72, 393–401 CrossRef CAS.
- Q. Cheng, R. Yuge, K. Nakahara, N. Tamura and S. Miyamoto, J. Power Sources, 2015, 284, 258–263 CrossRef CAS.
- Y. Lin, Z.-H. Huang, X. Yu, W. Shen, Y. Zheng and F. Kang, Electrochim. Acta, 2014, 116, 170–174 CrossRef CAS.
- X. Ma, X. Song, Y. Tang, C. Qi, G. Ning, J. Gao and Y. Li, Energy Technol., 2017, 5, 2244–2252 CrossRef CAS.
- P. R. Wallace, Phys. Rev., 1947, 71, 622–634 CrossRef CAS.
- C. Wang, H. Zhao, J. Wang, J. Wang and P. Lv, Ionics, 2013, 19, 221–226 CrossRef CAS.
- Z. Li, Y. Cao, G. Li, L. Chen, W. Xu, M. Zhou, B. He, W. Wang and Z. Hou, Electrochim. Acta, 2021, 366, 137466 CrossRef CAS.
- Y. Lu, C. Zhao, X. Qi, Y. Qi, H. Li, X. Huang, L. Chen and Y. S. Hu, Adv. Energy Mater., 2018, 8, 1800108 CrossRef.
- M. Li, Z. Bi, L. Xie, G. Sun, Z. Liu, Q. Kong, X. Wei and C.-M. Chen, ACS Sustain. Chem. Eng., 2019, 7, 14796–14804 CrossRef CAS.
- L. Fan, Z. Shi, Q. Ren, L. Yan, F. Zhang and L. Fan, Green Energy Environ., 2021, 6, 220–228 CrossRef CAS.
- W.-C. Li, A.-H. Lu and S.-C. Guo, Carbon, 2001, 39, 1989–1994 CrossRef CAS.
- I. Zojaji, A. Esfandiarian and J. Taheri-Shakib, Adv. Colloid Interface Sci., 2021, 289, 102314 CrossRef CAS PubMed.
- Q. Sun, D. Li, J. Cheng, L. Dai, J. Guo, Z. Liang and L. Ci, Carbon, 2019, 155, 601–610 CrossRef CAS.
- S. Tian, Y. Zhang, C. Yang, S. Tie and J. Nan, Electrochim. Acta, 2021, 380, 138254 CrossRef CAS.
- N. Gupta and P. Bhattacharya, J. Mater. Chem. C, 2023 10.1039/D3TC02074F.
- N. Gupta, R. K. Sahu, T. Mishra and P. Bhattacharya, J. Mater. Chem. A, 2022, 10, 15794–15810 RSC.
- H. Zhang, Y. Yang, D. Ren, L. Wang and X. He, Energy Storage Mater., 2021, 36, 147–170 CrossRef.
- L. F. Zhao, Z. Hu, W. H. Lai, Y. Tao, J. Peng, Z. C. Miao, Y. X. Wang, S. L. Chou, H. K. Liu and S. X. Dou, Adv. Energy Mater., 2021, 11, 2002704 CrossRef CAS.
Footnote |
| † These authors contributed equally. |
| This journal is © The Royal Society of Chemistry 2023 |