 Open Access Article
Composite ligand shells on gold nanoprisms – an ensemble and single particle study†
Dániel Zámbó a,
Dávid Kovács
 ab,
Gergely Südiab,
Zsolt Zolnaia and
András Deák
 *a
*a
aCentre for Energy Research, Konkoly-ThegeM. Str. 29–33, Budapest, 1121, Hungary. E-mail: andras.deak@ek.hun-ren.hu
bBudapest University of Technology and Economics, Department of Physical Chemistry and Materials Science, Budafoki Str. 6–8, Budapest, 1117, Hungary
First published on 19th October 2023
Abstract
The attachment of thiolated molecules onto gold surfaces is one of the most extensively used and robust ligand exchange approaches to exploit the nanooptical features of nanoscale and nanostructured plasmonic materials. In this work, the impact of thiol adsorption on the optical properties of wet-chemically synthesized gold nanoprisms is studied both at the ensemble and single particle level to investigate the build-up of more complex ligand layers. Two prototypical ligands with different lengths have been investigated ((16-mercaptohexadecyl)trimethylammonium bromide – MTAB and thiolated polyethylene glycol – mPEG-SH). From ensemble experiments it is found that composite ligand layers are obtained by the sequential addition of the two thiols, and an island-like surface accumulation of the molecules can be anticipated. The single particle experiment derived chemical interface damping and resonance energy changes further support this and show additionally that when the two thiols are used simultaneously, a higher density, intermixed layer is formed. Hence, when working with more than a single type of ligand during surface modification, sequential adsorption is preferred for the combination of accessible essential surface functionalities, whereas for high overall loading the simultaneous use of the different ligand types is favourable.
Introduction
The surface functionalisation of wet-chemically synthesised plasmonic nanoparticles is of key importance for their application and usually relies on the thiol-group containing moieties as the strong gold–sulphur bond allows for straightforward surface modification.1 By attaching various functional molecules to the particle surface, like DNA, antibodies, macro- or small molecules a plethora of applications can benefit from the nanooptical features of plasmonic nanoparticles spanning the fields of sensorics, drug-delivery, photothermal therapy, catalysis, energy harvesting and directed assembly.2–7 The most elaborated synthesis methods for anisometric gold nanoparticles, like rods, plates, or prisms rely on the use of hexadecyltrimethylammonium salts (CTAB or CTAC) to achieve high quality particles. The CTA+ ions play an important role during particle synthesis as they can contribute to the anisometric growth, but also provide excellent colloidal and particle interface stability after synthesis.8,9 The exact structure of the CTA+ layer is still subject to debate, when CTAC is used for particle synthesis, the most likely configuration is a micellar structure of the CTA+ molecules at the particle surface.10,11 When such nanoparticles are to be functionalised, this inherent CTA+ layer has to be removed or partially exchanged. As even amines provide already a fairly stable anchoring of the molecules to the gold surface,12 the most convenient approach is the use of thiolated molecules, which – due to the formation of sulphur–gold bonds – will readily chemisorb at the particles.1 Nevertheless, it has been found that even using thiols, complete CTA+ removal or exchange is challenging in a simple, single step ligand exchange process.13–16 When not only a single type, but a combination of thiols is used, the surface modification gets even more complex, and can lead even to the formation of molecular patches.17–19 It was found earlier, that when a mixture of thiolated PEG and small thiols is applied to gold nanoparticles on the time scale of hours, the small thiols can dominate the adsorbed layer during competitive adsorption.20 This is consistent with results obtained when the thiolated PEG and the small thiol are applied consecutively, showing that small molecules can more effectively replace PEG on the hour time scale, but at the same time not only thiol exchange, but also backfilling process can take place, that is the second thiol occupies still available binding sites at the particle surface resulting in a composite ligand layer.21 This latter finding is consistent with the largely different time scales involved in monolayer formation, replacement and rearrangement of thiolates at the gold surface.22 On gold nanoparticles, surface modification with thiols can induce significant optical changes. Colloidal gold nanoparticles in general support localised plasmon resonances in the visible wavelength range, leading to a pronounced peak in their extinction spectra as a result of absorption and scattering of light. The dielectric properties of their surrounding medium impact the resonance wavelength, hence ensemble spectroscopy is often utilized as a convenient approach to study adsorption of molecules at the nanoparticle surface via recording the spectral shifts, as decreasing (increasing) the medium's effective refractive index leads to a blueshift (redshift) of the resonance peak.23 The gold nanoparticles on the other hand can also be considered as nanoscale lossy dipole antennae, and the damped harmonic oscillator model has been applied with great success to describe the scattering spectra of individual nanoparticles.24 The localised plasmon resonance energy and plasmon linewidth (damping) can be obtained by fitting a Lorentz-oscillator to the measured scattering spectra. These quantities are determined by the particle geometry (size, shape, aspect ratio) and the properties of the embedding medium or surface coatings and contain contribution from different factors like retardation, radiation, surface effects or interband transition, that will determine their actual values (see ESI† for details). For the present work, upon surface modification of the nanoprisms by thiolated molecules like MTAB or mPEG-SH, changes in the resonance energy are induced by modifying the effective dielectric properties of the surrounding medium, while a resonance peak broadening can be expected at the same time due to increased chemical interface damping.25–27 While measurements on individual nanoparticles are not affected by inhomogeneous broadening, there will be an inherent particle-to-particle variation of the resonance energy and damping and hence the optical changes have to be recorded at each nanoparticle separately.In the present work, we investigate the impact of two prototypical molecules (MTAB and mPEG-SH) on the optical properties of gold nanoprisms both at the ensemble and single nanoparticle level in order to see how the presence of an already adsorbed thiol affects the accumulation of a second one during composite layer formation. The molecules used differ largely in structure and size, with MTAB being a thiolated analogue of the inherent capping ligand of the nanorods (CTAC), hence its easier surface access is anticipated. mPEG-SH on the other hand has a molecular weight of 5000 Da and carries no charge. In ensemble, the time-dependent resonance shift and dynamic light scattering, during single particle experiment the damped harmonic oscillator derived resonance energy and chemical interface damping changes are used to characterise the thiol accumulation.
Experimental
The chemicals were obtained from Merck, 5000 Da mPEG-SH was purchased from Rapp Polymere GmbH. The chemicals were used as received. MTAB and mPEG-SH were stored in a glove-box refrigerator and handled under inert atmosphere before preparing their aqueous solutions. The gold nanoprisms have been prepared and purified according to already published protocols.28,29A Zeiss LEO 1540-XB operated at an accelerating voltage of 5 keV was used to obtain SEM, and a JEOL 3010 (operated at 300 keV) to record TEM images of the particles. The hydrodynamic diameters were characterized using a Malvern Zetasizer Nano ZS. For the measurement of the ensemble optical spectra and to adjust the particle concentration a Shimadzu UV-3600i Plus spectrometer was used, for the time-dependent extinction measurements a Thorlabs CCS200 with a custom software written in Labview has been employed, taking the average of 301 spectra at each measurement point (1 ms integration time each). The measured time-dependent extinction spectra have been bulk-processed in OriginLab to obtain the dipolar plasmon peak wavelength position.
For a typical single particle measurement standard microscope slides (Marienfeld) were cleaned by ultrasonication (1 hour; 2% Hellmanex III; 1 hour; ultrapure water) and air plasma. The particles (extinction @ 400 nm: 0.2; 50 mM CTAC concentration) were spin-coated on the substrates, rinsed with copious amount of 2-propanol, blown dry with nitrogen and plasma treated for 30 seconds to remove any surface bound organic molecules. The closed flow cell was constructed using a polycarbonate perfusion chamber (Grace Biolabs, 150 μm chamber height) and connected to an Ismatec Reglo Digital pump using Teflon tubing. The flow cell was mounted on an upright optical microscope (Olympus BX51) which has a modified sample stage to accommodate a PI P-545.xR8S XYZ piezo positioner. The microscope is equipped with a dedicated oil-immersion dark-field condenser (NA = 1.2–1.4) and an IR-enhanced light source (100 W – Olympus U-LH100IR). A 50× objective (Olympus 50× MPlanFLN, NA = 0.8) was used to collect the scattered light and the image was projected on the entrance slit of an imaging spectrometer (Princeton Instruments Isoplane SCT320 with a PIXIS:400BRX camera cooled at −70 °C). A custom measurement control and acquisition software written in Labview was used to obtain the scattering spectrum of 20+ nanoparticles. The 3D (X/Y and focus) position of each nanoparticle has been automatically optimised by the control software right before measurement. The spectra were obtained by averaging 5 exposures 2 seconds each. The measured spectra were corrected for the optical transfer function of the whole setup (including the flow cell), the dark current of the detector and the lamp spectrum. The scattering spectra were batch-processed in OriginLab, fitting the Lorentz-oscillator model to the scattering spectra. The contribution of the interband transitions to the resonance frequency and damping values was taken into account and corrected for based on earlier published works (see ESI† for details),30,31 so that solely the impact of the molecules on the damping and resonance energy could be obtained.
Regarding the flow-cell handling, first the cell was filled with water at 20 μL min−1 to ensure that no air bubbles are trapped inside the cell. After filling, it was flushed (500 μL min−1; 2500 μL) and pre-conditioned (100 μL min−1; 1 hour) with ultrapure water. Then the reference spectra of the individual particles was measured and the solution containing the thiols was used to flush the cell (500 μL min−1; 2500 μL). A steady flow of 100 μL min−1 was maintained for 30 minutes before each measurement point. For two-step modifications the second thiol was introduced in the same way (flushing followed by a steady flow).
Results
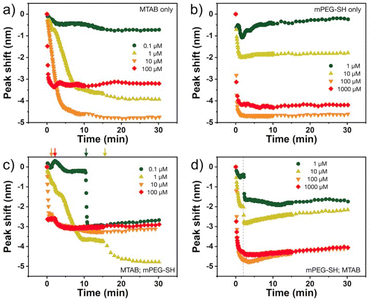
The nanoprisms have an edge length of 68.3 ± 8.6 nm (see Fig. S2† for the distribution). The ensemble optical spectrum (Fig. 1a) is dominated by the fairly sharp localised plasmon mode of the prisms at around 640 nm, which can be attributed to the tip-edge dipole resonance, with the high-intensity field localised around the particle tips.32,33 Due to geometric reasons, this mode is the superposition of the three equivalent dipole directions. In general, both MTAB and mPEG-SH induce a blueshift upon binding to the nanoparticles (see Fig. S3† for a typical extinction spectrum). It is important to note that the main plasmon peak shift can be associated primarily with the dielectric changes in the tip and to some extent in the edge region of the particles, as these parts of the prisms are involved in the dipolar resonance of the electrons.32 For MTAB (Fig. 2a), the rate of blueshift is proportional to the bulk concentration in the 0.1–10 μM concentration range and the final extent of blueshift is achieved after ca. 10 minutes of thiol addition. Interestingly, while the highest rate is clearly observed for 100 μM, the largest blueshift is obtained at 10 μM MTAB concentration. This might be caused by the very rapid binding of MTAB to the particles' surface, that leads to the formation of a more disordered molecular coating. Similar effects can be observed for mPEG-SH as well (Fig. 2b), whereas in this case an order of magnitude larger concentration is necessary to achieve similar blueshift values than for MTAB, which might be attributed to the larger size and hence lower grafting density of PEG. Again, raising the PEG concentration to 1000 μM resulted in a lower overall blueshift compared to the 100 μM case. For PEG the peak shift rates are fairly similar at different concentrations, which is in agreement with multiscale simulations predicting zero-order (with respect to the thiol concentration) exchange reaction between CTA+ layers and mPEG-SH.34 The blueshift associated with the ligand adsorption is generally attributed to the strongly binding ligand displacing the initial surfactant capping layer (CTA+ in the present case), resulting in a lower effective refractive index in the optical near-field around the particles. For MTAB this can be understood as the thiolated CTA+ analogue binding with its tail group to the particle surface, with the opposite orientation as the CTA+ generally expected to be oriented in the close vicinity of the gold surface.10 It should be noted though, that CTA+ most probably forms discrete globular micellar-like structure at the surface of the particles with channels between them.8,10,11 This also means that most likely ligand-island growth takes place, starting at the openings, as suggested by some recent results obtained with gold nanoprisms which show the preparation of tip-patched particles.29,35 For mPEG-SH the observed blueshift can originate from its size: the macromolecules tethered at particle surface are occupying a significant volume of the optical near field and can effectively displace the inherently present, associated CTA+ molecules. It is generally anticipated that curvature of the gold particles determines the density of the ligand layer and hence the edges and tips of the prisms are expected to be covered much easier.8 The bulk concentration-dependent blueshifts obtained at the end of the measurement window (30 minutes) on the other hand suggest that the coverage is different at each concentration level and that there might be still unoccupied adsorption sites present at the tips/edges. Nevertheless, it has to be emphasized, that the estimated ligand/particle ratio translates to about one monolayer coverage or more (except for the 0.1 μM MTAB concentration; for details see Fig. S4†). Still, to see if additional molecules can bind to the surface, the two types of thiols were also introduced in a consecutive way into the same systems (Fig. 2c and d). For the MTAB/PEG case the timing of PEG addition was chosen so that most of the MTAB associated blueshift already took place (see arrows in Fig. 2c), whereas for the PEG/MTAB system MTAB was introduced at the same time (dashed vertical line in Fig. 2d), since the rate of blueshift upon PEG addition was found to be fairly independent of the PEG bulk concentration. The concentrations for the second type of thiol were chosen based on the largest attainable blueshift with the individual thiols (Fig. 2a and b; 100 μM mPEG-SH and 10 μM MTAB). A general finding is that provided the binding of the first thiol was sufficiently low, the second type of thiol induces additional blueshift, the magnitude of which is inversely proportional to the amount of the first thiol. This indicates that indeed the coverage is not yet complete in the tip/edge region at the time the second thiol is introduced and a composite ligand layer can be formed. At the same time this behaviour also strengthens an island-growth mechanism, as for the second ligand induces simply an additional blueshift like it would have caused by itself, with the blueshift being inversely proportional to the available binding sites. If true intermixing of the two molecule types took place, one would expect a lower blueshift or even a redshift at some point due to the large differences in the molecular layer structures of the two ligands: MTAB with a densely packed shell at the surface and mPEG-SH flexible chains reaching farther into the solution21 – the homogeneous combination of these is expected to result in a ligand shell with higher optical density.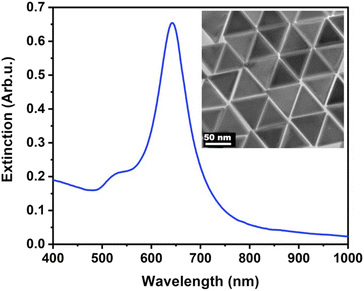 | ||
| Fig. 1 Extinction spectrum of the purified nanoprisms. The inset shows the transmission electron microscopic image of the particles. | ||
Dynamic light scattering experiments also support the simultaneous presence of the two ligands at the particle surface. In Fig. 3, the dashed lines refer to the reference diameter values measured on either purely mPEG-SH or MTAB covered particles, which were prepared by a 24 hour surface modification procedure using 1 mM thiol concentration both for mPEG-SH and MTAB. At this high ligand concentration and long treatment time compared to minutes time scale involved in the two-step ligand exchange, these reference particles can be regarded as fully surface modified under the given circumstances. The derived hydrodynamic diameter is defined by the lateral dimension of the prisms,36 and ligands loaded on the side/tip regions can alter the measured size, consequently, there is a significant difference between the purely MTAB and mPEG-SH loaded prisms due to the largely different size of the two ligands applied. When MTAB is used first in various concentrations and 100 μM PEG is injected in the second step, the hydrodynamic diameter of the particles asymptotically decreases starting at the purely mPEG-SH modified diameter value and approaches the limit of purely MTAB modified particles. This is in agreement with the results of the ensemble optical measurements and suggests that at lower MTAB concentration more mPEG-SH can be loaded on the particles, whereas at higher MTAB concentration an increasing proportion of the tips/edges is already occupied by the first molecule. When PEG is added first, no such clear trend is observed: the derived diameters are close to the reference value of mPEG-SH, indicating the attachment of the macromolecules around the perimeter of the prisms even at the lowest investigated concentration. This is in agreement with the spectroscopic results (Fig. 2d).
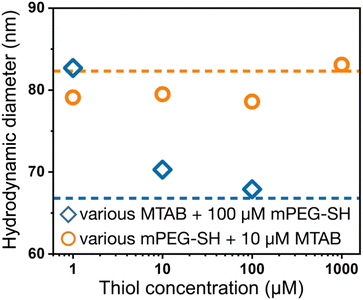 | ||
| Fig. 3 DLS derived hydrodynamic diameter of the nanoprisms after performing two-step surface modification, corresponding to the samples shown in Fig. 2c and d. The horizontal dashed lines indicate the hydrodynamic diameters obtained for the fully PEGylated or MTAB coated particles. | ||
The spectroscopic and DLS results imply that a composite ligand layer can be prepared with the two-step surface modification approach and controlling the concentration levels might enable compositional control of the final ligand layer through the kinetic control of molecular adsorption. Nevertheless, one may note that both the above spectroscopic and DLS measurements are sensitive only to the tip/edge region of the particles. In order to obtain additional data on the ligand binding, microspectroscopic experiments have also been performed in a liquid cell, measuring the light scattering spectra of individual nanoprisms and their changes upon thiol molecule binding. The main benefit of this approach is that the measured single particle scattering spectrum is not affected by inhomogeneous line broadening and hence a more rigorous comparison with theory becomes possible.
The thiol adsorption was characterized by fitting the individual particles' spectra using a damped harmonic oscillator model. In this case, the interband contribution to the full damping (ΔΓ) of the plasmon resonance has been taken into account and the peak position of the plasmon resonance has been corrected (see ESI† for details). In agreement with earlier results on silver or gold nanoprisms, the scattering spectra of the nanoparticles show the characteristics of a dipole antenna and the Lorentz-oscillator model provides an excellent fit to the measured values (Fig. S5†).37,38
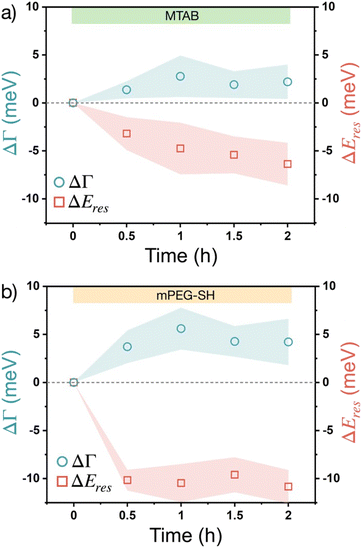
The changes of these corrected ΔΓ and ΔEres values over time upon introducing the thiols into the flow cell are plotted in Fig. 4. To simplify data representation, at each measurement point the ΔΓi and ΔEires values of the individual particles are evaluated statistically, so that the average values (symbols) show the trend, while the ‘error’ shown as a shaded region actually indicates the range in which the values are scattered in the measured particle populations. Some particle-to-particle variation in the determined values can be naturally expected due to the size variation of the particles and considering earlier studies indicating some degree of heterogeneity between individual particles' coverage and molecule binding rates.39 For the measurements the particles have been extensively cleaned by isopropanol and mild plasma treatment so that the adsorption on neat particle surfaces can be characterized effectively. As the native CTA+ layer is absent during these measurements, a redshift of the resonance (negative ΔEres) is observed upon thiol accumulation, which is consistent with an increasing effective refractive index as a result of organic molecule accumulation in the optical near field. The plasmon damping Γ, however, is increasing over time, which is in line with an increased chemical interface damping (CID) upon gold–thiol bond formation observed earlier for gold nanorods in contact with alkane thiols.25 Earlier studies involving gold nanoprisms and thiolated aromatic compounds have shown that thiol adsorption leads to ensemble plasmon peak broadening, which might be related to the interaction between the excited electrons in the metal and the molecular electronic levels of the adsorbate,40 although at the ensemble level a clear distinction between aggregation induced broadening and the CID effect might be difficult. In the present system, however, the induced chemical interface damping can be attributed to the formation of surface dipoles in the metal upon gold–thiol bond formation.27,41 When comparing the trends for MTAB and mPEG-SH (Fig. 4), it is interesting that MTAB shows a prolonged resonance energy change even on the time scale of hours, while mPEG-SH is fairly constant already after 30 minutes. This might be explained by the distinct dynamics of self-assembled monolayer formation at gold surfaces, after a fast initial accumulation showing a slower reorganization for molecules with a molecular structure promoting lateral packing as a result of intermolecular attraction.42 This can be especially pronounced for MTAB due to its linear hydrophobic segment, but less for PEG, for which water can be considered as a good solvent and has a lower grafting density.43 The larger shift observed for mPEG-SH on the other hand can be attributed to the larger effective refractive index change caused by the bigger mPEG-SH molecule as it occupies a larger fraction of the optical near-field. The shift and broadening are half of the value of earlier results obtained using rod shaped gold nanoparticles and mPEG-SH with the same molecular weight,26 but in the present case large part of the prisms' surface is blocked by the supporting substrate.
In the above single particle experiments thiol accumulation was investigated on neat gold surfaces, while during ensemble studies the particles are dispersed in a 10 mM CTAC solution. This simplification was intentional to allow easier interpretation of the single particle scattering spectra, but obviously the presence of CTAC at the particle surface might affect the kinetics of the thiol binding. To demonstrate the impact of surface-attached CTAC on the process, experiments were also carried out without completely removing the initial capping molecules from the prisms. For these measurements the particles have been subjected to gentle aqueous rinsing only, without the use of isopropanol or plasma treatment, so the presence attached CTA+ molecules at the prisms' surface can be anticipated. The single particle optical scattering experiments (Fig. S7†) indicate similar trend for the redshift, that is after 30 minutes most of the resonance energy change takes place, while the damping values show a prolonged increase even up to 2 hours. These can be an indication of the early occupation of the tip/edge sites of the prisms by the thiols, followed by the CTA+ replacement at the face region, that would be in line with various reports on the site-selective functionalisation of anisometric gold nanoparticles.35,44–47
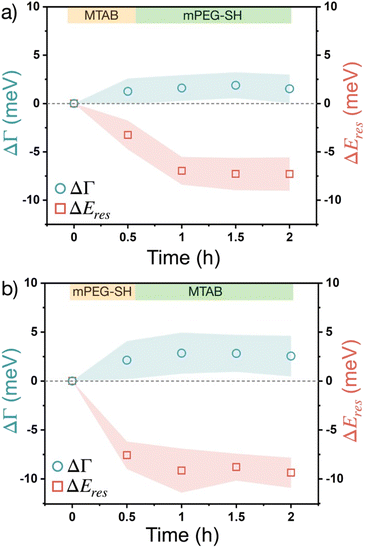
Fig. 5 shows the results obtained with the sequential addition of the two different thiol molecule types. The second type of thiol is introduced after the particles having been in contact with the first thiol for 30 minutes and their scattering spectra were measured. In general, for both cases the damping change is similar than for the pure thiols and follows similar trend. For the MTAB/PEG sequence (Fig. 5a), however, the resonance peak shift shows a clear difference to the pure MTAB case (Fig. 4a). Upon mPEG-SH addition, the peak shift increases more than only with MTAB and does not show any trend over time at later stages (after one hour). It indicates that PEG was able to attach to the prisms even when MTAB was already present. The process is fairly quick and no further considerable changes can be observed on the time scale of hours. When the opposite, PEG/MTAB sequence is applied (Fig. 5b) no such two-step change in the peak shift can be observed, which result resembles the purely mPEG-SH case. These results indicate, that it is more likely to obtain a composite ligand layer during sequential addition, when MTAB is added first, as already surface-bound PEG might prevent the further accumulation of MTAB more effectively. It also has to be noted based on earlier results that sequential addition of thiolated PEG and a short chain thiol can lead to the displacement of the surface grafted PEG, while removal of already attached short chain thiols by thiolated PEG is less likely.21 It has to be emphasized, however, that in the present case this is not likely to be the case since the thiol concentrations are several orders of magnitude lower, and such replacements would be reflected at least in the resonance energy, since based on Fig. 4 there is a significant difference in the induced ΔEres for pure MTAB and mPEG-SH.
The effect of the two different thiols has been also investigated when not sequential, but simultaneous addition was performed, introducing a mixed solution with 10 μM MTAB and 100 μM mPEG-SH concentration into the cell (Fig. 6). Interestingly, in this case a higher damping increase (∼10 meV) and a more pronounced peak shift value (∼15 meV) were found. These observations imply a competing ligand adsorption process, involving the simultaneous build-up of a more intermixed thiol layer, where none of the ligand types dominates the ligand shell, but with a higher molecular loading. This can be a result of the size difference between MTAB and PEG: the region closer to the particle surface is occupied by MTAB and the PEG chains extend more into the solution. Hence, if the accessibility to any potential function encoded by a small surface-bound moiety is needed but at the same time the simultaneous presence of a macromolecule is also desired, sequential addition starting with the small thiol might be the preferable strategy to create a composite ligand shell.
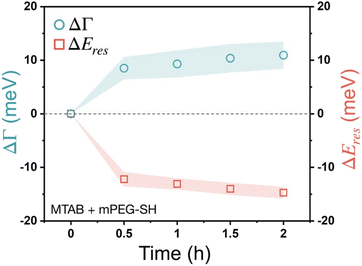 | ||
| Fig. 6 Localised surface plasmon resonance broadening (ΔΓ) and peak shift (ΔEres) of gold nanoprisms obtained applying the mixture of 10 μM MTAB and 100 μM mPEG-SH. | ||
Conclusion
The experiments indicate that the combination of MTAB and mPEG-SH molecules allows the preparation of composite ligand layers on gold nanoprisms, provided that the concentration of the molecules is appropriately controlled in the micromolar range. During ensemble optical spectroscopy measurements both molecule types induced a resonance blueshift of the gold nanoprisms' localised plasmon resonance peak, which was assigned to the removal of the intrinsic ligand layer (CTAC). From the experiments where the two thiolated molecule is introduced in a sequential manner, an island-growth type accumulation for both types of molecules and the side-by-side presence of domains with different ligand types can be anticipated. Based on the time-dependent plasmon resonance shift, there is the possibility to fine-tune the amount of the different ligands by controlling the concentration of the firstly added thiol. The simultaneous presence of the different thiol types, and the varying composition with ligand concentrations can also be inferred from dynamic light scattering measurements. The single-particle optical scattering experiments performed on neat gold nanoprisms confirmed the ligand binding based on the interband transition corrected increase of the (chemical interface) damping and redshift of the resonance peak position. It was found that mPEG-SH is able to bind to partially MTAB covered prisms, while the binding of MTAB on partially PEG modified prisms is less pronounced. Nevertheless it was found that a mixed ligand layer with higher molecular loading can be prepared on the neat prisms when the two ligand types are introduced at the same time. This work shed light on the importance of the design of the overall surface modification procedure and shows the effect of the thiols' chain length on the preparation of composite ligand shells on gold nanoprisms.Author contributions
The manuscript was written through contributions of all authors. All authors have given approval to the final version of the manuscript.Conflicts of interest
There are no conflicts to declare.Acknowledgements
D. K. acknowledges the support of Pro Progressio and József Varga Foundation. Project no. TKP2021-NKTA-05 has been implemented with the support provided by the Ministry of Innovation and Technology of Hungary from the National Research, Development and Innovation Fund (NRDI), financed under the TKP2021 funding scheme. The work was supported by the NRDI Fund of Hungary under the grants of FK 142148 and FK 128327.Notes and references
- H. Sellers, A. Ulman, Y. Shnidman and J. E. Eilers, J. Am. Chem. Soc., 1993, 115, 9389–9401 CrossRef CAS.
- J. N. Anker, W. P. Hall, O. Lyandres, N. C. Shah, J. Zhao and R. P. Van Duyne, Nat. Mater., 2008, 7, 442–453 CrossRef CAS PubMed.
- W. Wang, Md. M. Hassan and G. Mao, Langmuir, 2023, 39, 3235–3245 CrossRef CAS PubMed.
- X. Huang, P. K. Jain, I. H. El-Sayed and M. A. El-Sayed, Lasers Med. Sci., 2008, 23, 217–228 CrossRef PubMed.
- D. Zámbó, P. Rusch, F. Lübkemann and N. C. Bigall, ACS Appl. Mater. Interfaces, 2021, 13, 57774–57785 CrossRef PubMed.
- B. Ai, Z. Fan and Z. J. Wong, Microsyst. Nanoeng., 2022, 8, 5 CrossRef CAS PubMed.
- R. P. M. Höller, C. Kuttner, M. Mayer, R. Wang, M. Dulle, R. Contreras-Cáceres, A. Fery and L. M. Liz-Marzán, ACS Photonics, 2020, 7, 1839–1848 CrossRef.
- J. Mosquera, D. Wang, S. Bals and L. M. Liz-Marzán, Acc. Chem. Res., 2023, 56, 1204–1212 CrossRef CAS PubMed.
- W. Ye, K. Krüger, A. Sánchez-Iglesias, I. García, X. Jia, J. Sutter, S. Celiksoy, B. Foerster, L. M. Liz-Marzán, R. Ahijado-Guzmán and C. Sönnichsen, Chem. Mater., 2020, 32, 1650–1656 CrossRef CAS.
- S. K. Meena, S. Celiksoy, P. Schäfer, A. Henkel, C. Sönnichsen and M. Sulpizi, Phys. Chem. Chem. Phys., 2016, 18, 13246–13254 RSC.
- S. K. Meena and M. Sulpizi, Langmuir, 2013, 29, 14954–14961 CrossRef CAS PubMed.
- A. Kumar, S. Mandal, P. R. Selvakannan, R. Pasricha, A. B. Mandale and M. Sastry, Langmuir, 2003, 19, 6277–6282 CrossRef CAS PubMed.
- F. Schulz, W. Friedrich, K. Hoppe, T. Vossmeyer, H. Weller and H. Lange, Nanoscale, 2016, 8, 7296–7308 RSC.
- K. Nishida and H. Kawasaki, RSC Adv., 2017, 7, 18041–18045 RSC.
- I. García, M. Henriksen-Lacey, A. Sánchez-Iglesias, M. Grzelczak, S. Penadés and L. M. Liz-Marzán, J. Phys. Chem. Lett., 2015, 6, 2003–2008 CrossRef PubMed.
- A. S. D. S. Indrasekara, R. C. Wadams and L. Fabris, Part. Part. Syst. Charact., 2014, 31, 819–838 CrossRef CAS.
- M. Retout, E. Brunetti, H. Valkenier and G. Bruylants, J. Colloid Interface Sci., 2019, 557, 807–815 CrossRef CAS PubMed.
- F. Höeg, J. Schulz, S. Graf, D. Salah, S. Chandralingam, W. Maison, W. J. Parak and F. Schulz, J. Phys. Chem. C, 2022, 126, 20594–20604 CrossRef.
- S. K. Meena, C. Goldmann, D. Nassoko, M. Seydou, T. Marchandier, S. Moldovan, O. Ersen, F. Ribot, C. Chanéac, C. Sanchez, D. Portehault, F. Tielens and M. Sulpizi, ACS Nano, 2017, 11, 7371–7381 CrossRef CAS PubMed.
- D.-H. Tsai, F. W. DelRio, R. I. MacCuspie, T. J. Cho, M. R. Zachariah and V. A. Hackley, Langmuir, 2010, 26, 10325–10333 CrossRef CAS PubMed.
- A. M. Smith, L. E. Marbella, K. A. Johnston, M. J. Hartmann, S. E. Crawford, L. M. Kozycz, D. S. Seferos and J. E. Millstone, Anal. Chem., 2015, 87, 2771–2778 CrossRef CAS PubMed.
- M. J. Hostetler, A. C. Templeton and R. W. Murray, Langmuir, 1999, 15, 3782–3789 CrossRef CAS.
- H. Chen, X. Kou, Z. Yang, W. Ni and J. Wang, Langmuir, 2008, 24, 5233–5237 CrossRef CAS PubMed.
- C. Sönnichsen, T. Franzl, T. Wilk, G. von Plessen, J. Feldmann, O. Wilson and P. Mulvaney, Phys. Rev. Lett., 2002, 88, 077402 CrossRef PubMed.
- B. Foerster, A. Joplin, K. Kaefer, S. Celiksoy, S. Link and C. Sönnichsen, ACS Nano, 2017, 11, 2886–2893 CrossRef CAS PubMed.
- P. Zijlstra, P. M. R. Paulo, K. Yu, Q.-H. Xu and M. Orrit, Angew. Chem., Int. Ed., 2012, 51, 8352–8355 CrossRef CAS PubMed.
- S. A. Lee and S. Link, Acc. Chem. Res., 2021, 54, 1950–1960 CrossRef CAS PubMed.
- L. Scarabelli, M. Coronado-Puchau, J. J. Giner-Casares, J. Langer and L. M. Liz-Marzán, ACS Nano, 2014, 8, 5833–5842 CrossRef CAS PubMed.
- A. Kim, T. Vo, H. An, P. Banerjee, L. Yao, S. Zhou, C. Kim, D. J. Milliron, S. C. Glotzer and Q. Chen, Nat. Commun., 2022, 13, 6774 CrossRef CAS PubMed.
- M. Hu, C. Novo, A. Funston, H. Wang, H. Staleva, S. Zou, P. Mulvaney, Y. Xia and G. V. Hartland, J. Mater. Chem., 2008, 18, 1949 RSC.
- B. Foerster, J. Rutten, H. Pham, S. Link and C. Sönnichsen, J. Phys. Chem. C, 2018, 122, 19116–19123 CrossRef CAS.
- V. Myroshnychenko, N. Nishio, F. J. García de Abajo, J. Förstner and N. Yamamoto, ACS Nano, 2018, 12, 8436–8446 CrossRef CAS PubMed.
- Z. Li, Y. Yu, Z. Chen, T. Liu, Z.-K. Zhou, J.-B. Han, J. Li, C. Jin and X. Wang, J. Phys. Chem. C, 2013, 117, 20127–20132 CrossRef CAS.
- H.-M. Gao, H. Liu, H.-J. Qian, G.-S. Jiao and Z.-Y. Lu, Phys. Chem. Chem. Phys., 2018, 20, 1381–1394 RSC.
- A. Kim, S. Zhou, L. Yao, S. Ni, B. Luo, C. E. Sing and Q. Chen, J. Am. Chem. Soc., 2019, 141, 11796–11800 CrossRef CAS PubMed.
- X. Ma, Y. Cheng, Y. Huang, Y. Tian, S. Wang and Y. Chen, RSC Adv., 2015, 5, 81682–81688 RSC.
- L. J. Sherry, R. Jin, C. A. Mirkin, G. C. Schatz and R. P. Van Duyne, Nano Lett., 2006, 6, 2060–2065 CrossRef CAS PubMed.
- K. W. Smith, J. Yang, T. Hernandez, D. F. Swearer, L. Scarabelli, H. Zhang, H. Zhao, N. A. Moringo, W.-S. Chang, L. M. Liz-Marzán, E. Ringe, P. Nordlander and S. Link, J. Phys. Chem. C, 2018, 122, 13259–13266 CrossRef CAS.
- M. Horáček, R. E. Armstrong and P. Zijlstra, Langmuir, 2018, 34, 131–138 CrossRef PubMed.
- T. Liyanage, M. Nagaraju, M. Johnson, B. B. Muhoberac and R. Sardar, Nano Lett., 2020, 20, 192–200 CrossRef CAS PubMed.
- B. Foerster, V. A. Spata, E. A. Carter, C. Sönnichsen and S. Link, Sci. Adv., 2019, 5, eaav0704 CrossRef CAS PubMed.
- R. Colorado and T. R. Lee, in Encyclopedia of Materials: Science and Technology, Elsevier, 2001, pp. 9332–9344 Search PubMed.
- K. Rahme, L. Chen, R. G. Hobbs, M. A. Morris, C. O'Driscoll and J. D. Holmes, RSC Adv., 2013, 3, 6085 RSC.
- G. Chen, K. J. Gibson, D. Liu, H. C. Rees, J.-H. Lee, W. Xia, R. Lin, H. L. Xin, O. Gang and Y. Weizmann, Nat. Mater., 2019, 18, 169–174 CrossRef CAS PubMed.
- L. Zhong, X. Zhou, S. Bao, Y. Shi, Y. Wang, S. Hong, Y. Huang, X. Wang, Z. Xie and Q. Zhang, J. Mater. Chem., 2011, 21, 14448 RSC.
- B. E. Janicek, J. G. Hinman, J. J. Hinman, S. hyun Bae, M. Wu, J. Turner, H.-H. Chang, E. Park, R. Lawless, K. S. Suslick, C. J. Murphy and P. Y. Huang, Nano Lett., 2019, 19, 6308–6314 CrossRef CAS PubMed.
- H. Duan, Z. Jia, M. Liaqat, M. D. Mellor, H. Tan, M.-P. Nieh, Y. Lin, S. Link, C. F. Landes and J. He, ACS Nano, 2023, 17, 12788–12797 CrossRef CAS PubMed.
Footnote |
| † Electronic supplementary information (ESI) available. See DOI: https://doi.org/10.1039/d3ra05548e |
| This journal is © The Royal Society of Chemistry 2023 |

