 Open Access Article
Comprehensive analysis of NiFe2O4/MWCNTs nanocomposite to degrade a healthcare waste – tetracycline†
Davis Vargheseab,
M. Joe Raja Rubanab,
P. Joselene Suzan Jenniferab,
D. AnnieCanisiusab,
Seena Chakkoc,
S. Muthupandia,
J. Madhavana and
M. Victor Antony Raj *ab
*ab
aDepartment of Physics, Loyola College, Affiliated to the University of Madras, Chennai 600034, India. E-mail: vicvad2003@yahoo.co.in
bLoyola Institute of Frontier Energy, Loyola College, Chennai 600034, India
cPG and Research Department of Chemistry, Christ College, Irinjalakuda 680125, India
First published on 26th September 2023
Abstract
Tetracycline (TC), a commonly used antibiotic for studying bacterial illnesses in living organisms, poses a significant risk to the aquatic environment. Despite various conventional methods having been attempted to remove TC antibiotics from water solutions, they have not proven effective. Consequently, the focus of the research is on the photocatalytic degradation of TC. According to the research, MWCNTs were successfully incorporated into NiFe2O4 nanoparticles, which reduced the pace at which charge carriers recombined after joining with MWCNTs. Subsequently, the catalyst's efficacy was assessed in a batch reactor by analyzing the weight percentage change of the nanocomposite, the initial concentration of TC antibiotics, the effects of pH and contact time. The identical operational parameters were employed to investigate the degradation of TC using NiFe2O4 and MWCNTs as individual pure materials. The findings indicated that the photocatalytic process using NiFe2O4/MWCNTs achieved a degradation efficiency of 95.8% for TC at a pH value of 9. This result was obtained after a reaction time of 120 minutes, the concentration of TC solution was 10 mg L−1, with a nanocomposite dose of 0.6 g L−1 of TN 04 and 120 W m−2. The pseudo-first-order approach was used to estimate the rate at which TC degrades. After four consecutive uses, it was observed that the photocatalysts maintained their original properties, with only a slight decrease of approximately 2.4% in the removal efficiency. The study demonstrated that the NiFe2O4/MWCNTs nanocomposite exhibited considerable efficiency in degrading TC. Due to its simple manufacture and useful recovery, it has the potential to function well as a catalyst for the removal and degradation of pharmaceutical organic contaminants.
1. Introduction
Antibiotics are commonly used for the treatment of various diseases.1 However, their widespread use has led to the accumulation of antibiotic residues in the environment, which can harm human and animal health.2–5 Antibiotics and anti-inflammatory medications are made in large quantities and are used frequently to treat bacterial infections, fever and pain.1–3 Tetracycline (TC) is a broad-spectrum antibiotic commonly used in human and veterinary medicine.2–4 TC residues are found in various environmental matrices, including soil, water, and sediment, and their enduring presence in the environment can have detrimental effects on human and animal health.8 Therefore, it is necessary to create effective methods to eliminate TC from the surrounding atmosphere.Photocatalysis is a potential method for removing TC and other organic contaminants from the environment.9 Utilizing a photocatalyst to break down organic molecules while being exposed to light is known as photocatalysis.10 Based on the formation of electron–hole pairs in the photocatalyst under the action of light,6 the photocatalytic process can break down organic compounds by creating reactive species like hydroxyl radicals.7,8 Various photocatalysts have been studied for the degradation of organic compounds, including metal oxides, metal sulfides and carbon-based materials such as multi-walled carbon nanotubes (MWCNTs).9 These photocatalysts can degrade organic molecules when exposed to visible light, but they are constrained by their broad bandgap and low quantum efficiency.9,10 Therefore, creating materials with outstanding photocatalytic efficiency and a robust sensitivity to visible light is crucial for breaking down organic contaminants in water.11,12
In recent years, extensive research has been dedicated to harnessing the potential of MWCNTs and ferrite nanoparticles as efficient photocatalysts for advanced oxidation processes, particularly in the degradation of emerging contaminants. These materials have gained prominence due to their remarkable photocatalytic activity, cost-effectiveness, chemical stability and environmentally friendly characteristics.13–15 MWCNTs, with their unique tubular and sheet-like structures, play a pivotal role in preventing charge carrier recombination on the photocatalyst's surface, thus enhancing their overall efficacy.16 Their large specific surface area, layered hollow architecture and electron-rich surface make them effective adsorbents, while their excellent electrical conductivity and electron storage capacity make them proficient electron transfer agents, further augmenting their utility in photocatalysis.14,17 Additionally, MWCNTs facilitate efficient electron transfer from metal oxides or semiconductor nanoparticles to their surface, bolstering their role in advanced photocatalytic processes.13,14
Spinel ferrites, denoted by the chemical formula MFe2O4, possess a crystal structure featuring both tetrahedral (A) and octahedral (B) interstitial sites, allowing for the incorporation of various cations, including divalent metal ions (M), resulting in a wide range of ferrite properties.15 Substituting M with different divalent metal ions leads to the creation of diverse spinel ferrite types. Additionally, trivalent ions like Al3+, Cr3+, and Ga3+, as well as divalent and tetravalent ions, can replace Fe3+ ions within the structure.15,18 Spinel ferrites, such as Fe3O4, CoFe2O4, CuFe2O4, MnFe2O4, NiFe2O4, and ZnFe2O4 and their composites, have proven valuable in photocatalysis, serving as efficient charge carrier trappers when combined with MWCNTs.19,20 These materials offer advantages like reduced energy band gaps, higher surface area-to-volume ratios, ease of separation, reusability, cost-effectiveness and non-toxicity, making them promising components for advancing and improving the efficiency of photocatalytic processes.21
Nickel ferrite (NiFe2O4) is a p-type inverse spinel semiconductor in the group of metal ferrites and is known for its adaptability in a variety of electronic nanodevices, catalytic applications and sensors.22 Recent research on the photocatalytic degradation of various dyes and antibiotics utilizing NiFe2O4 nanoparticles and their composites under various light irradiation sources was published.23 According to the study's findings, the efficacy of photocatalytic degradation was affected by several variables, including the size of NiFe2O4 nanoparticles, the starting concentration of TC, pH, and light intensity. Another work, better sunlight-driven photocatalytic abatement of TC and photo electrocatalytic water oxidation by tin oxide quantum dots anchored on NiFe2O4 nanoplates was published.24 A narrow bandgap in the spinel ferrite NiFe2O4 makes it a potent photocatalyst for breaking organic molecules when exposed to visible light.20,25 Additionally, by supplying a sizable surface area for the deposition of NiFe2O4 nanoparticles and making the separation and transfer of electron–hole pairs easier, MWCNTs may be used as a support material to improve the photocatalytic activity of NiFe2O4.25,26
Therefore, this study examined the degradation of TC under visible light using a NiFe2O4/MWCNTs nanocomposite as a photocatalyst. We created the NiFe2O4/MWCNTs nanocomposite hydrothermally. For monitoring the breakdown of TC under visible light, we assessed the photocatalytic activity of the nanocomposite and investigated their impact of different factors such as catalyst ratios, initial TC concentration and pH on degradation efficiency. The findings of this study have significant effects on the creation of practical techniques for TC removal from the environment. The abundance of light-acting sites in this composite material has the advantage of enhancing antibiotics' photocatalytic activity. According to our research, photocatalytic activity can be significantly increased by the unique ability of ferrite and nanotube structures to absorb light and prevent the recombination of electron and hole pairs. This substance is, therefore, widely employed to remove contaminants from water.
2. Experimental section
2.1 Materials
MWCNTs with diameter 10–30 nm and >91% purity were used for this investigation. Sodium hydroxide (NaOH), iron(III) nitrate nonahydrate (Fe (NO3)3 9H2O, purity 98%), and nickel nitrate hexahydrate (Ni (NO3)2 6H2O, purity 98%) were used without further processing. TC hydrochloride with a purity level of over 95% was provided by the Indian firm Che-O-Chem Scientific Company and its chemical properties are shown in Table 1.| Molecule | Formula | Molecular weight (g mol−1) | Solubility (mol L−1) | pKa1 | pKa2 | pKa3 |
|---|---|---|---|---|---|---|
| TC | C22H24N2O8·HCl | 480.9 | 0.041 | 3.2 | 7.78 | 9.6 |
2.2 Synthesis of NiFe2O4 nanoparticles
A hydrothermal process was used to produce pure-phase NiFe2O4. All the experiment's chemicals were of the highest analytical grade. We began the process to produce the NiFe2O4 nanoparticles with 0.1 mol of Ni (NO3)2·6H2O and 0.2 mol of Fe (NO3)3·9H2O. During the synthetic process, we added these raw components to 100 mL of deionized water and stirred the mixture constantly for 30 minutes.15,27 The mixture was continuously stirred as a constant flow of 2 M NaOH solution was introduced until the pH level reached 12.28 The resultant suspension was put into an autoclave made of Teflon-coated stainless steel. For 12 hours, the autoclave was sealed and kept at 180 °C.18 The resultant product was carefully rinsed multiple times with distilled water and ethanol before being subjected to a 12 hours drying process at 80 °C.29 The nanocomposites of NiFe2O4 and MWCNTs were made using the NiFe2O4 nanoparticles obtained in this step.2.3 Synthesis of NiFe2O4 blended MWCNTs nanocomposites
First, NiFe2O4 nanoparticles (0.04 g) were dissolved in pure water (30 mL minimum). MWCNTs weighing 0.04 g were added to the solution and sonicated for one hour. The slurry was vigorously stirred for 4 hours16 before being placed into a 50 mL Teflon-lined stainless autoclave. The autoclave was sealed and maintained at 180 °C for 12 hours. Following filtration, the product was washed three times in distilled water and dried for 24 hours at 60 °C. We obtain a nanocomposite of NiFe2O4 and MWCNTs.NiFe2O4 nanoparticles were hydrothermally synthesized in situ in the alkaline medium, where Fe3+ and Ni2+ in the solution were self-absorbed on the MWCNTs surface, as follows:30,31
| Ni(NO3)2 + 2Fe(NO3)3 + 8NaOH → NiFe2O4 + 8NaNO3 + 4H2O |
2.4 Material characterization
An X-ray diffraction (XRD) analysis was conducted using a Rigaku Miniflex instrument, operated at 40 kV and 30 mA and employed CuKα radiation with a wavelength of 1.54 Å. This analysis covered a 2θ range of 10–90°, aimed at determining the sample's phase purity and crystalline characteristics. For the investigation of the synthesized photocatalyst, scanning electron microscopy (SEM) and transmission electron microscopy (TEM) analyses were performed using ZEISS 18–15 and 30 kV JOEL JEM 2100 instruments, respectively. These techniques were employed to examine the material's surface morphology and internal structure. To explore the sample's optical properties, a PerkinElmer Lambda 950 UV-visible absorption spectrophotometer was utilized, operating within the wavelength range of 200–800 nm. For the identification of functional groups present in the catalytic materials, Fourier-transform infrared (FTIR) spectra were collected over the 4000–400 cm−1 region using a PerkinElmer Paragon 1000 PC analyzer. Raman bands were recorded using a Renishaw Raman microscope with a 532 nm excitation laser. Lastly, to assess N2 adsorption at a temperature of liquid nitrogen (77 K), a surface analyzer (ASAP 2020 PLUSE HD 88, USA) was employed.2.5 Evaluation of photocatalytic activity
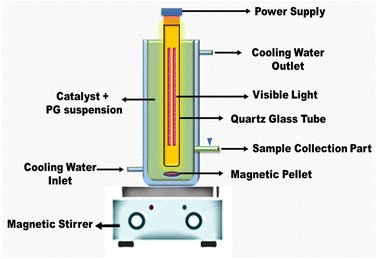
To ascertain how the sphere-like NiFe2O4 nanorod-MWCNTs of the synthesized catalysts degraded under visible light irradiation at room temperature and atmospheric pressure, TC in an aqueous solution (50 mg L−1) was photodegraded. The adsorption procedure was carried out in batches and stored in a dark area. Typically, 50 mL of the aqueous solution was mixed after 30 mg of the photocatalyst was introduced to remove any remaining catalyst. The experimental setup was put in a dark area and stirred magnetically for 30 min before radiation exposure to achieve adsorption–desorption equilibrium. The photocatalytic reaction was aided by a visible light source of 120 W m−2 in 120 min. The source and photoreaction sample were separated by 20 cm, and 5 mL (or about 5 mL) of the sample was taken every 15 minutes using a syringe. Following centrifugation of the combined solutions, a UV-vis spectrophotometer (PerkinElmer, Lambda 35) was used to examine the supernatant of the TC antibiotic solution. After the samples were collected at regular intervals, the residual TC content was calculated at a maximum adsorption wavelength of 354 nm.TC elimination was calculated using eqn (1)![[thin space (1/6-em)]](https://www.rsc.org/images/entities/char_2009.gif) 25
25
| Removal (%) = (C0/Ct)/C0 × 100 | (1) |
3. Results and discussions
3.1 XRD analysis
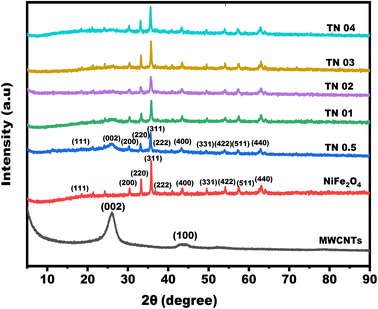
X-ray diffraction analysis is extremely important for determining the phases and structure of a substance.33 In Fig. 2, the crystal structures of NiFe2O4, MWCNTs and a mixture made of NiFe2O4 and MWCNTs in various ratios—TN 0.5 (1![[thin space (1/6-em)]](https://www.rsc.org/images/entities/char_2009.gif) :
:![[thin space (1/6-em)]](https://www.rsc.org/images/entities/char_2009.gif) 0.5), TN 01 (1
0.5), TN 01 (1![[thin space (1/6-em)]](https://www.rsc.org/images/entities/char_2009.gif) :
:![[thin space (1/6-em)]](https://www.rsc.org/images/entities/char_2009.gif) 1), TN 02 (1
1), TN 02 (1![[thin space (1/6-em)]](https://www.rsc.org/images/entities/char_2009.gif) :
:![[thin space (1/6-em)]](https://www.rsc.org/images/entities/char_2009.gif) 2), TN 03 (1
2), TN 03 (1![[thin space (1/6-em)]](https://www.rsc.org/images/entities/char_2009.gif) :
:![[thin space (1/6-em)]](https://www.rsc.org/images/entities/char_2009.gif) 3), and TN 04 (1
3), and TN 04 (1![[thin space (1/6-em)]](https://www.rsc.org/images/entities/char_2009.gif) :
:![[thin space (1/6-em)]](https://www.rsc.org/images/entities/char_2009.gif) 4)—are depicted. Diffraction peaks corresponding to crystal planes may be seen in the X-ray diffraction patterns of NiFe2O4 combined with MWCNTs. These peaks are found at 2θ values of 18.42°, 25.93°, 30.30°, 33.15°, 35.69°, 37.34°, 43.38°, 43.46°, 47.51°, 53.83°, 57.39° and 63.03°, which correspond to planes (111), (002), (200), (220), (311), (222), (400), (100), (331), (422), (511) and (440) respectively.34 The diffraction peaks of NiFe2O4/MWCNTs (JCPDS Card No 01-088-0380) are consistent with those of pure spinel-type NiFe2O4, indicating a cubic crystal structure in the samples. The XRD data also shows a characteristic MWCNTs diffraction peak (002) in the NiFe2O4/MWCNTs XRD pattern. Based on the largest peak (311) and the Scherrer formula, the average crystallite size of the particles was calculated to be 32 nm.33 The XRD patterns of NiFe2O4-related diffraction peaks and MWCNTs-related peaks in the composite of NiFe2O4 and MWCNTs are similar, indicating a nanocomposite material is formed. A tiny diffraction peak between the (200) and (311) planes can also be seen. This peak is thought to be associated with the Fe2O3 phase, indicating that the NiFe2O4/MWCNTs nanocomposites contain a tiny amount of Fe2O3 impurities.35 The phase purity of the material is good, as no discernible diffraction peaks of individual or combined Ni- and Fe-containing compounds are observed. The (002) peak intensity decreases with increasing nickel ferrite weight ratio, indicating that atoms in nickel ferrites move to the MWCNTs sites and cover their surface. These findings suggest that the composite of MWCNTs and NiFe2O4 can be used in photocatalysis in different ratios.
4)—are depicted. Diffraction peaks corresponding to crystal planes may be seen in the X-ray diffraction patterns of NiFe2O4 combined with MWCNTs. These peaks are found at 2θ values of 18.42°, 25.93°, 30.30°, 33.15°, 35.69°, 37.34°, 43.38°, 43.46°, 47.51°, 53.83°, 57.39° and 63.03°, which correspond to planes (111), (002), (200), (220), (311), (222), (400), (100), (331), (422), (511) and (440) respectively.34 The diffraction peaks of NiFe2O4/MWCNTs (JCPDS Card No 01-088-0380) are consistent with those of pure spinel-type NiFe2O4, indicating a cubic crystal structure in the samples. The XRD data also shows a characteristic MWCNTs diffraction peak (002) in the NiFe2O4/MWCNTs XRD pattern. Based on the largest peak (311) and the Scherrer formula, the average crystallite size of the particles was calculated to be 32 nm.33 The XRD patterns of NiFe2O4-related diffraction peaks and MWCNTs-related peaks in the composite of NiFe2O4 and MWCNTs are similar, indicating a nanocomposite material is formed. A tiny diffraction peak between the (200) and (311) planes can also be seen. This peak is thought to be associated with the Fe2O3 phase, indicating that the NiFe2O4/MWCNTs nanocomposites contain a tiny amount of Fe2O3 impurities.35 The phase purity of the material is good, as no discernible diffraction peaks of individual or combined Ni- and Fe-containing compounds are observed. The (002) peak intensity decreases with increasing nickel ferrite weight ratio, indicating that atoms in nickel ferrites move to the MWCNTs sites and cover their surface. These findings suggest that the composite of MWCNTs and NiFe2O4 can be used in photocatalysis in different ratios.
Scherrer equation can be written as
 | (2) |
3.2 SEM, TEM & EDX analysis
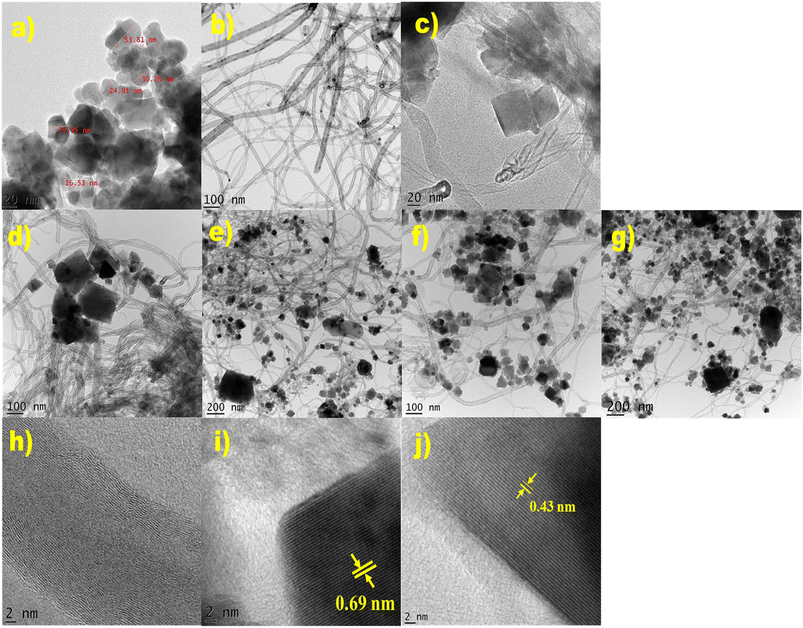
SEM images of MWCNTs, NiFe2O4, and a NiFe2O/MWCNTs nanocomposite are shown in Fig. 3. SEM images of NiFe2O4 and MWCNTs nanoparticles alone are shown in Fig. 3a and b, whereas images of NiFe2O4/MWCNTs at different NiFe2O4 nanoparticle weight ratios are shown in Fig. 3c through Fig. 3g. On the surface of the MWCNTs, NiFe2O4 nanoparticles are distributed in a manner that is visible in the images. Nickel ferrite nanoparticles migrate, creating a nanocomposite in the regions where MWCNTs are present. The process includes electrostatically attaching NiFe2O4 to the surface of MWCNTs, which results in the formation of spherical nanoparticles. The surface oxygen-containing groups on MWCNTs may also be reduced due to this reaction, enhancing the chemical interaction between NiFe2O4 and MWCNTs. The photographs show that the NiFe2O4 particles have an irregular size distribution ranging from 30 to 500 nm and a spherical shape. Furthermore, Fig. 3 demonstrates the NiFe2O4 microspheres' intertwining with the MWCNTs, which can serve as bridges to join nearby MWCNTs. This demonstrates the success of our synthesis strategy by demonstrating that the MWCNTs are entirely coated with nanocrystals.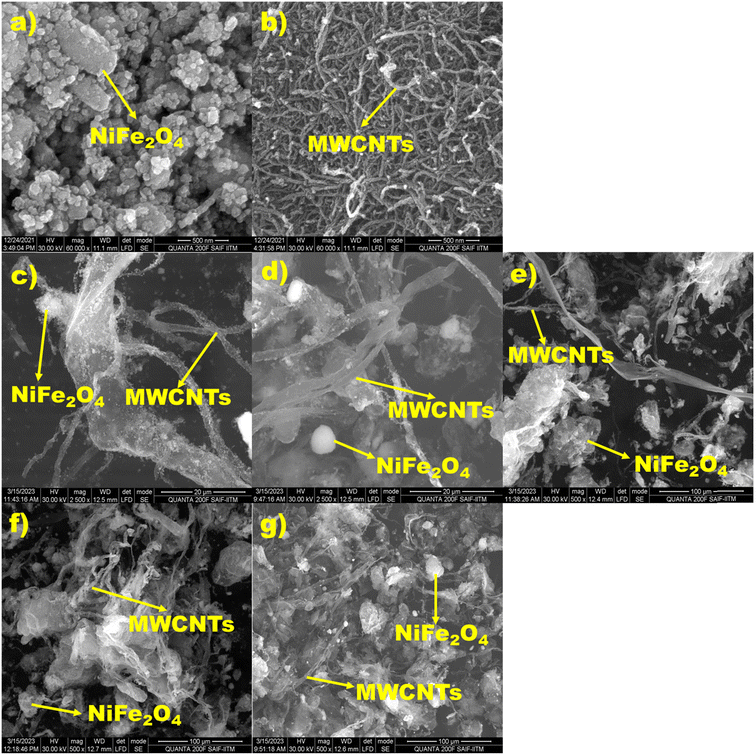 | ||
| Fig. 3 (a) and (b) are SEM images of NiFe2O4 and MWCNTs, and (c)–(g) show SEM images of TN 0.5, TN 01, TN 02, TN 03, and TN 04 nanocomposites. | ||
Fig. 4 illustrates the EDX technique used to determine the elemental composition of MWCNTs and NiFe2O4 in NiFe2O4/MWCNTs. The EDX results establish the coexistence of Fe, Ni, O, and C in the sample, with their amounts matching the molar ratio of the composite. Fig. 2 shows that the distribution of MWCNTs is uniform and the corresponding results for different areas exist in Fig. 4. Both NiFe2O4 and MWCNTs can be observed in the synthesized composite nanostructure in the EDX spectrum. The atomic % of Ni, Fe, O and C in NiFe2O4 nanoparticles and NiFe2O4/MWCNTs (TN 04) are presented in the EDX spectrum, with values of 14.62, 37.59 and 47.79 for Ni, Fe and O, respectively, in NiFe2O4 nanoparticles and 3.85, 7.36, 22.68 and 61.11 for Ni, Fe, O and C, in NiFe2O4/MWCNTs (TN 04). Inside tables displaying the quantitative elemental data for each composition are also provided. The HR-TEM of NiFe2O4 and NiFe2O4/MWCNTs revealed a rough microsphere-like morphology. Most of the ferrite nanoparticles were adhered to the MWCNTs' surface and agglomerated with a uniform distribution. HR-TEM images of NiFe2O4 show a crystalline structure with distinct lattice fringes and an average particle size of 26 nm with a diameter of 37 nm. According to TEM pictures, the nickel ferrite nanoparticles were uniformly distributed all around the multi-walled carbon nanotube, the majority of the NiFe2O4 nanoparticles were seen to be drawn to the surface of the MWCNTs (Fig. 5).
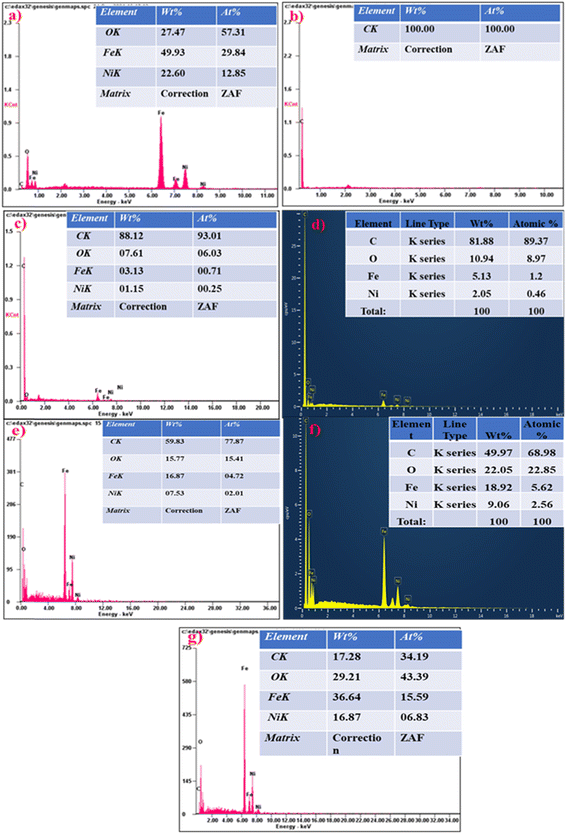 | ||
| Fig. 4 (a)–(g) depict EDX micrographs of pure NiFe2O4, MWCNTs and associated TN 0.5, TN 01, TN 02, TN 03 and TN 04 nanocomposites. | ||
3.3 UV-visible analysis
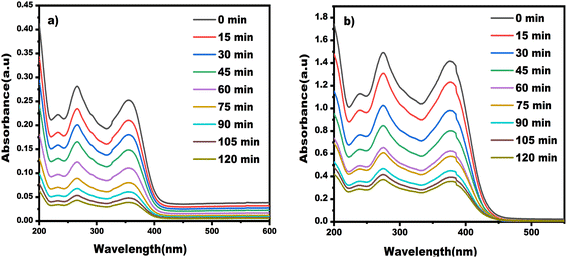
The investigation centered on synthesizing and characterizing NiFe2O4 and NiFe2O4/MWCNTs nanoparticles using a UV-vis spectrophotometer to analyze their optical properties. As shown in Fig. 6a, the UV-vis spectra for the nanoparticles prepared at 180 °C showed a peak with maximum absorption between 200 and 300 nm. Spinel ferrite's capacity to excite electrons from the valence band (O-2p level) to the conduction band (Fe-3d level) is thought to be the reason for its ability to absorb visible light.36 The Tauc-plot equation αhν = A(hν − Eg)n, where h stands for Planck's constant, α stands for the absorption coefficient, ν stands for the photon frequency, A is a constant value that depends on the transition probability, Eg stands for the optical energy band gap and n is set to 2, indicating a direct bandgap semiconductor material, was used to determine the optical band gap energy.37 A linear regression line was projected onto the plot's X-axis to determine the bandgap value. According to Fig. 6a and b, the computed optical energy band gaps for NiFe2O4 and NiFe2O4/MWCNTs nanoparticles were 2.72 eV and 2.32 eV respectively. These findings point to the small bandgap of these nanoparticles, highlighting their potential as effective catalysts for light-related applications.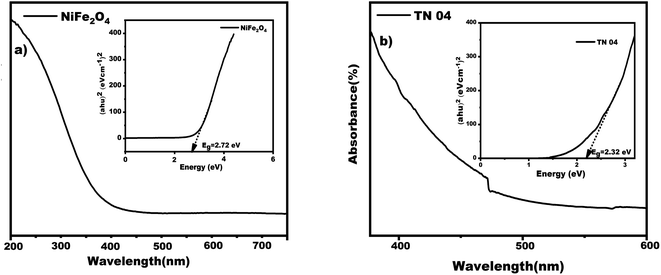 | ||
| Fig. 6 Depicts the UV-visible spectrum along with an inset showing the Tauc plot of (a) NiFe2O4 and (b) NiFe2O4/MWCNTs nanoparticles. | ||
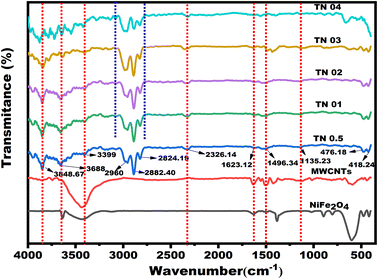
3.4 FTIR analysis
The FT-IR spectra of each sample were collected to analyze the structural development of the ferrite multi-component system.38 The FT-IR spectra of NiFe2O4-decorated MWCNTs are presented in Fig. 7, confirming a spinel structure with cationic distribution. The distinctive absorption bands in the spectra appear at 3848.67 cm−1, 3688 cm−1 and 3399 cm−1, respectively, and they are caused by the stretching vibration of the hydroxyl functional group (O–H) on the surface of the MWCNTs. Peaks of 2882 cm−1, 2824 cm−1 and 2326 cm−1 in the composite material were found to have C–H stretching vibrations. The carbonyl group's (C![[double bond, length as m-dash]](https://www.rsc.org/images/entities/char_e001.gif) O) stretching vibration was seen at 1623 cm−1, while the carboxylate group's (C
O) stretching vibration was seen at 1623 cm−1, while the carboxylate group's (C![[double bond, length as m-dash]](https://www.rsc.org/images/entities/char_e001.gif) O) stretching vibration was observed at 1496 cm−1. The stretching vibration of the C
O) stretching vibration was observed at 1496 cm−1. The stretching vibration of the C![[double bond, length as m-dash]](https://www.rsc.org/images/entities/char_e001.gif) C group was at 1622 cm−1, while the characteristic stretching vibration of the C–C–C group was at 1135 cm−1.24 Two lattice vibration bands involving oxygen and metal ion complexes were also discovered in the FT-IR spectra and were present in all samples. The band represented the octahedral (B) site metal complex's vibrational mode at 418 cm−1 and the tetrahedral site (A) metal complexes at 476 cm−1. All ferrite samples have these peaks caused by the metal–oxygen (Fe3+–O2−) bond's stretching vibrations.39 These lattice arrangements supported the development of a spinel structure and agreed with the findings provided by Waldron et al.32 The variations in peak intensities at various doses of nanocomposite are shown in Fig. 7, demonstrating the existence of mixed NiFe2O4 materials in various proportions at the MWCNTs sites.
C group was at 1622 cm−1, while the characteristic stretching vibration of the C–C–C group was at 1135 cm−1.24 Two lattice vibration bands involving oxygen and metal ion complexes were also discovered in the FT-IR spectra and were present in all samples. The band represented the octahedral (B) site metal complex's vibrational mode at 418 cm−1 and the tetrahedral site (A) metal complexes at 476 cm−1. All ferrite samples have these peaks caused by the metal–oxygen (Fe3+–O2−) bond's stretching vibrations.39 These lattice arrangements supported the development of a spinel structure and agreed with the findings provided by Waldron et al.32 The variations in peak intensities at various doses of nanocomposite are shown in Fig. 7, demonstrating the existence of mixed NiFe2O4 materials in various proportions at the MWCNTs sites.
3.5 Raman analysis
In carbon-based materials, the degree of graphitization can be determined using Raman spectroscopy.34 Fig. 8 displays the Raman spectroscopy results for the NiFe2O4/MWCNTs nanocomposites, as well as for MWCNTs and pure NiFe2O4. Five Raman active modes in a spinel structure with the Fd![[3 with combining macron]](https://www.rsc.org/images/entities/char_0033_0304.gif) m space group have been found in ferrites: A1g + Eg + 3T2g.40 The A1g mode is produced by the symmetric stretching of oxygen atoms along Fe–O (and Ni–O) bonds at the tetrahedral sites. The Eg mode is created by the symmetric bending of the oxygen atom in relation to the metal ion. The T2g(2) and T2g(3) modes, respectively, describe the vibrations of the octahedral group.40 While the asymmetric stretching of Fe/Ni–O causes the T2g(2) mode, the asymmetric bending of oxygen and Fe/Ni–O causes the T2g(3) mode. The T2g(1) mode is connected to the translational movement of the tetrahedron, which consists of a metal ion and four oxygen atoms at the tetrahedral site.
m space group have been found in ferrites: A1g + Eg + 3T2g.40 The A1g mode is produced by the symmetric stretching of oxygen atoms along Fe–O (and Ni–O) bonds at the tetrahedral sites. The Eg mode is created by the symmetric bending of the oxygen atom in relation to the metal ion. The T2g(2) and T2g(3) modes, respectively, describe the vibrations of the octahedral group.40 While the asymmetric stretching of Fe/Ni–O causes the T2g(2) mode, the asymmetric bending of oxygen and Fe/Ni–O causes the T2g(3) mode. The T2g(1) mode is connected to the translational movement of the tetrahedron, which consists of a metal ion and four oxygen atoms at the tetrahedral site.
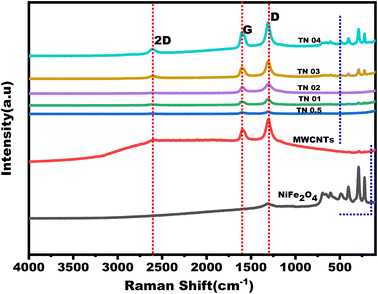 | ||
| Fig. 8 Shows Raman spectra for NiFe2O4, MWCNTs and NiFe2O4/MWCNTs nano-composites with various weight ratios of NiFe2O4 nanoparticles. | ||
Tetrahedral sites in ferrites are represented by Raman modes in the range of 660 to 720 cm−1, whereas octahedral sites are represented by modes in the 460 to 640 cm−1 range. Due to non-equivalent atoms at octahedral B-sites, materials like NiFe2O4, which have inverse or partially inverse spinel structures, contain extra Raman modes.41 Fe or Ni ions have differing ionic radii and can occupy the octahedral positions in NiFe2O4. Due to this difference in ionic radii, two peaks appear, one representing the unit cell where Ni ions occupy the octahedral site and the other representing the unit cell when Ni ions occupy the octahedral and tetrahedral sites. Therefore, the mixed spinel structure may be the reason for the doublet-like behavior for all Raman modes in the lower wavenumber range. This study used Raman spectroscopy to examine the interaction between dispersed nanoparticles and MWCNTs in a NiFe2O4/MWCNTs nanocomposite. Recent studies have shown that Raman spectroscopy is a highly effective method for examining such interactions.
The peak at 1204 cm−1 is due to the activation of the D band in MWCNTs, which happens during the first-order sp2 carbon scattering process. The G band of carbon nanotubes is visible in Fig. 8 at 1592 cm−1, and the G or D* bands, which are the second-order overtone of the D band, are reflected in peaks at 2604 cm−1 and 2342 cm−1. Although the D and D* bands of nanotubes and other sp2 carbons have certain similarities, nanotubes' D and D* bands stand out for various reasons.
Fig. 8 shows how the D, G, and 2D bands, which correspond to the first-order vibration of the sp3 bond, in-plane vibration of the sp2 bond and the second-order vibration of the sp3 bond, respectively, correlate to the Raman scattering peaks situated at roughly 1304, 1594, and 2610 cm−1.42 ID/IG is a commonly used metric for measuring the level of disorder and is defined as the ratio of the intensity (D and G bands). The results demonstrate that ID/IG increases from 1.01 (TN 0.5) to 1.06 (TN 04) and that ID/IG values for TN 0.5 to TN 04 are less than those for MWCNTs (1.09). This implies that ID/IG increases with the addition of NiFe2O4. Additionally, the low wavenumber region (100 to 800 cm−1) is where the Raman scattering peaks appear, consistent with earlier research on NiFe2O4 particles.15 As the additional levels of NiFe2O4 in the hybrid composites increase, the intensity of the NiFe2O4 Raman peaks becomes stronger.43 The lower ID/IG value of the NiFe2O4/MWCNTs composite compared to pure MWCNTs indicated that the level of crystallization in the composite was higher than in the bare MWCNTs. The NiFe2O4 nanoparticles' adhesion to the MWCNTs' surface flaws may have caused this discrepancy.
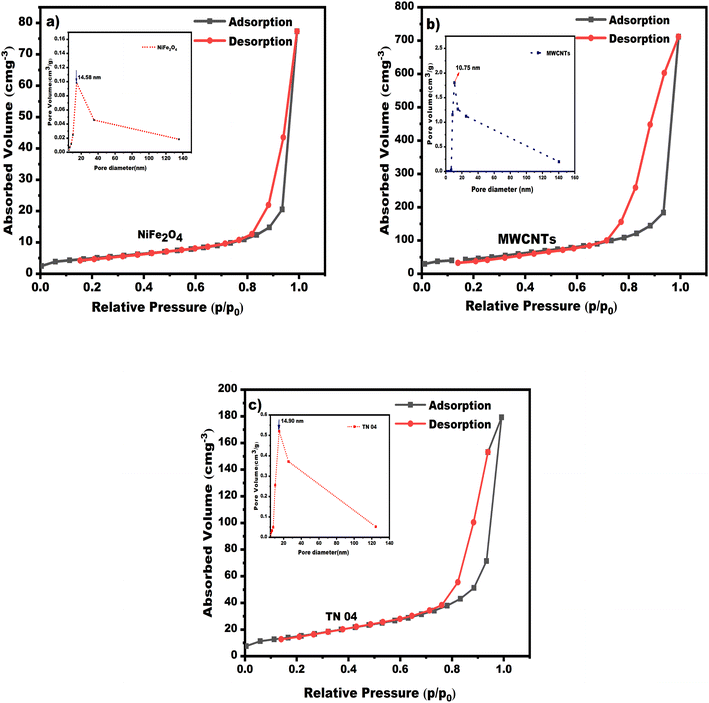
3.6 BET analysis
BET analysis is the prevalent method used for determining the accurate surface area and distribution of pores.44 In the case of composite materials, the specific surface area and pore size distribution are determined based on N2 adsorption–desorption. With the aid of the BET technique, the exact surface area can be evaluated, while the BJH approach is utilized to determine the pore size distribution curve. The maximum value of the pore size distribution curve corresponds to the pore size.Fig. 9a–c depict the NiFe2O4 nanoparticles, MWCNTs and NiFe2O4/MWCNTs nanocomposite, respectively, with their specific surface area and pore size distribution. The isotherms for NiFe2O4 and NiFe2O4/MWCNTs composite exhibit type IV and are accompanied by type H1 hysteresis loops, which suggest that the resulting samples are mesoporous materials.43 The BET equation was employed to calculate the specific surface area of pure NiFe2O4, MWCNTs and NiFe2O4/MWCNTs, which were found to be 45.54 m2 g−1, 289.63 m2 g−1 and 68.52 m2 g−1, respectively. This indicates that the synthesized NiFe2O4/MWCNTs had a higher surface area. According to the BJH model, the pore volume measurements for NiFe2O4 were 0.12 cc g−1 and 0.29 cc g−1 for bare NiFe2O4 and NiFe2O4/MWCNTs, respectively, with NiFe2O4/MWCNTs having a greater pore volume. A composite material with a large surface area and pore volume can offer more active sites and active regions, making it an ideal material for photocatalytic degradation application.
3.7 Photocatalytic degradation of TC
The degradation of TC antibiotics using MWCNTs involves several steps. First, the MWCNTs are activated by exposure to light. This excites electrons in the MWCNTs, creating electron–hole pairs. Then, these electrons and holes may take part in chemical processes at random. The antibiotic TC molecules are then adsorbed onto the MWCNTs' surface. Reactive oxygen species (ROS), including hydroxyl radicals and superoxide ions, develop when the electron–hole pairs in the MWCNTs interact with the TC antibiotic molecules. These ROS are highly reactive and can attack the TC antibiotic molecules, breaking them into smaller, less harmful compounds. The degradation products of TC, such as carbon dioxide, water and other organic compounds, are generally harmless to the environment.
According to the degradation graph in Fig. 10, using MWCNTs resulted in an increase in TC elimination of 86% at the optimal conditions of concentration (TC) of 0.05 g L−1, nanocomposite of 0.6 g L−1 (dosage), pH value of 4 over 120 min, and visible light irradiation of 120 W m−2. One of the most important factors is that MWCNTs have more active sites and a greater specific surface area. Consequently, there was a sizable TC molecule adsorption on the surfaces of MWCNTs. MWCNTs, which prohibit charge separation and thereby restrict electron–hole recombination, are another important factor in significant degradation. It also has a large capacity for holding electrons, a high metallic conductivity and a band gap energy of about 1.1 eV, enabling a high rate of degradation.
NiFe2O4 nanoparticles are a type of magnetic nanoparticle that has been studied for various applications, including catalysis.52 These nanoparticles' unique optical and magnetic properties make them attractive for photocatalytic applications. The magnetic properties of NiFe2O4 nanoparticles can ease the separation of the nanoparticles from the reaction, which is important for the practical application of the catalyst.53 The optical properties of NiFe2O4 nanoparticles, including their ability to absorb light in the visible and near-infrared regions, make them effective photocatalysts.54 Several studies have investigated the photocatalytic degradation of TC using NiFe2O4 nanoparticles.
For example, a study by Hassanzadeh et al. (2021) investigated the degradation of TC using NiFe2O4 nanoparticles under visible light irradiation. The study found that the photocatalytic degradation of TC was efficient using NiFe2O4 nanoparticles.55 The study also found that the initial concentration of TC influenced the degradation efficiency, the amount of catalyst used, and the pH of the solution. Another study by Hezam et al. (2020) investigated the degradation of TC using NiFe2O4 nanoparticles under sunlight irradiation. The study found that the photocatalytic degradation of Methylene blue (M.B) was efficient using NiFe2O4 nanoparticles and the degradation efficiency was influenced by the initial concentration of TC and the amount of catalyst used.56 The study also found that the NiFe2O4 nanoparticles remained stable after multiple use cycles. With the use of bare NiFe2O4 nanomaterial, the TC degradation rate was 75.5% under the following conditions: TC concentration of 0.05 g L−1, nanocomposite dosage of 0.6 g L−1, pH value of 4 over 120 min and same visible light radiation of 120 W m−2.
The mechanism of photocatalytic degradation involves several steps. First, the photocatalyst absorbs light and generates electron–hole pairs. The electron–hole pairs can then react with water or other species in the solution to generate ROS, such as OH˙. The ROS can then react with the organic compounds, such as TC, to degrade them into smaller, less harmful compounds.53
The following reactions can represent the process:
| OH˙ + TC → smaller, less harmful compounds |
Rate law expressions of different orders can be expressed as follows from eqn (3) to (5)
| Rate = k[A]0 → zeroth order | (3) |
| Rate = k[A]1 → first order | (4) |
| Rate = k[A]2 → second order | (5) |
Integrated rate law expressions should be a relationship between concentration and time for a given reactant and it can be expressed as follows from eqn (6) to (8)
| [A] = −kt + [A0] → zerothorder | (6) |
| ln[A] = −kt + ln[A0] → first order | (7) |
| 1/[A] = kt + 1/[A0] → second order | (8) |
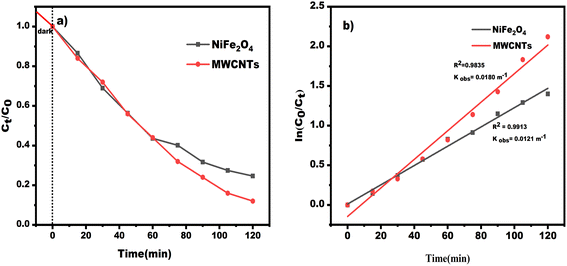
The integrated rate law formulas indicate that the reaction is of zeroth order if the concentration vs.-time plot is linear. If the natural log of the concentration vs. time is linear, the reaction is first order; if the natural log of the concentration vs. time is not linear, it is second order for that specific reactant. As seen here, the natural log of concentration vs. time data for MWCNTs and NiFe2O4 has an R2 value that is very near to one. From there, we can infer that this reaction is of first order with regard to the specific reactant. In other words, a pseudo-first-order kinetic model can be deduced from actual data on TC degradation by photocatalysis by looking at correlation coefficient (R2) values. This graph's slope is equal to the value of the −ve rate constant, or K = −slope. Fig. 11a shows the impacts on photocatalytic TC degradation of NiFe2O4 and MWCNTs. We can determine the slope and rate constant of the reaction from these straight-line plots in Fig. 11b. From the figure, the reaction's constant degradation rate for MWCNTs and NiFe2O4 is 0.0180 min−1 and 0.0121 min−1, respectively.
| Photocatalyst(hϑ) → h+ + e− |
These excited e− and positive h+ can then travel to the surface of the photocatalyst, where they can participate in remediation reactions with other species. Positive h+ are strong oxidants that can directly or indirectly oxidize adsorbent pollutants. In the case of direct oxidation, the h+ species directly oxidize the contaminants.59
When h+ in the valence band is trapped by water and ultimately produces OH˙. Similarly, e− is trapped by oxygen, producing superoxide anions (O˙−), which further reacts and produces OH˙.60 Then, these OH˙ react with TC antibiotics and produce a non-toxic and environment-friendly product.
| h+ + H2O → OH˙ + H+ |
| e− + O2 → O2˙− |
These hydrogen ions (H+) and O2˙− further react, producing unstable specious HO2. HO2 again reacts with O2 and produces hydrogen peroxide (H2O2). This H2O2 is further reacted with e− and h+ produces OH˙. These OH˙ are vital in degrading TC antibiotics and are given by less harmful products.61
The corresponding reactions are given below.
| O2˙− + H+ → HO2 |
| HO2 + O2 → H2O2 → OH˙ |
These are the radicals that can easily degrade the TC antibiotics in a water solution.
| TC + (OH˙, HO2˙, O2˙− or (h+)) → intermediates → final products |
From there, we know that e− and h+ play an important role in photocatalytic reactions.
![[thin space (1/6-em)]](https://www.rsc.org/images/entities/char_2009.gif) :
:![[thin space (1/6-em)]](https://www.rsc.org/images/entities/char_2009.gif) 0.5, 1
0.5, 1![[thin space (1/6-em)]](https://www.rsc.org/images/entities/char_2009.gif) :
:![[thin space (1/6-em)]](https://www.rsc.org/images/entities/char_2009.gif) 1, 1
1, 1![[thin space (1/6-em)]](https://www.rsc.org/images/entities/char_2009.gif) :
:![[thin space (1/6-em)]](https://www.rsc.org/images/entities/char_2009.gif) 2, 1
2, 1![[thin space (1/6-em)]](https://www.rsc.org/images/entities/char_2009.gif) :
:![[thin space (1/6-em)]](https://www.rsc.org/images/entities/char_2009.gif) 3, 1
3, 1![[thin space (1/6-em)]](https://www.rsc.org/images/entities/char_2009.gif) :
:![[thin space (1/6-em)]](https://www.rsc.org/images/entities/char_2009.gif) 4 W% (TN 0.5, TN 01, TN 02, TN 03, TN 04), a nano-composite dosage of 0.6 g L−1, pH value of 4, TC concentration of 0.05 g L−1, an illumination time of 120 min and a continuously visible intensity of 120 W m−2. More NiFe2O4 nanoparticles were added to MWCNTs, increasing the percentage of TC removed from 75% to 88%, illustrating a steady rise in the removal rate. More NiFe2O4 nanoparticles on the surface of MWCNTs result in a rise in the degrading efficiency for several causes. To increase the percentage of photocatalytic degradation, ferrite nanoparticle production increases the amount of electron and hole pairs. NiFe2O4 nanoparticles are an additional important element that will raise the surface-to-volume ratio value. MWCNTs also facilitate efficacy degradation and provide suitable sites for the sorption of contaminants in solution. The exceptional electron-storage capacity of MWCNTs also enables them to accept photon-excited electrons in nanocomposite with ferrite nanoparticles, which reduces the recombination rate. The NiFe2O4/MWCNTs ratio of 1
4 W% (TN 0.5, TN 01, TN 02, TN 03, TN 04), a nano-composite dosage of 0.6 g L−1, pH value of 4, TC concentration of 0.05 g L−1, an illumination time of 120 min and a continuously visible intensity of 120 W m−2. More NiFe2O4 nanoparticles were added to MWCNTs, increasing the percentage of TC removed from 75% to 88%, illustrating a steady rise in the removal rate. More NiFe2O4 nanoparticles on the surface of MWCNTs result in a rise in the degrading efficiency for several causes. To increase the percentage of photocatalytic degradation, ferrite nanoparticle production increases the amount of electron and hole pairs. NiFe2O4 nanoparticles are an additional important element that will raise the surface-to-volume ratio value. MWCNTs also facilitate efficacy degradation and provide suitable sites for the sorption of contaminants in solution. The exceptional electron-storage capacity of MWCNTs also enables them to accept photon-excited electrons in nanocomposite with ferrite nanoparticles, which reduces the recombination rate. The NiFe2O4/MWCNTs ratio of 1![[thin space (1/6-em)]](https://www.rsc.org/images/entities/char_2009.gif) :
:![[thin space (1/6-em)]](https://www.rsc.org/images/entities/char_2009.gif) 4 (TN 04) was determined to be the ideal amount in order to reduce the effects of adsorption and increase the photocatalytic contribution in the produced nano-composite.
4 (TN 04) was determined to be the ideal amount in order to reduce the effects of adsorption and increase the photocatalytic contribution in the produced nano-composite.Following the steps below, TC is photo-catalytically degraded using the NiFe2O4/MWCNTs hybrid.
Step 1: NiFe2O4/MWCNTs nanocomposite has a large surface area and can absorb TC molecules through various interactions, including hydrogen bonding, electrostatic interactions, and stacking. The NiFe2O4 nanoparticles are a photocatalyst for the degradation reaction when TC molecules are brought near them during adsorption.
Step 2: role of ROS – the NiFe2O4 nanoparticles produce e− and h+ pairs when exposed to visible light. NiFe2O4's energized electrons' conduction band can produce O2˙ when interacting with adsorbed oxygen molecules. Meanwhile, OH˙ can be produced by the valance band's gaps when they interact with absorbed water molecules.
Step 3: photocatalytic degradation of TC – the generated ROS can combine with adsorbed TC molecules and degrade the structure of the TC into smaller molecules like 4-epitetracycline (4-epi-TC) and anhydrotetracycline (ATC). TC is broken down through several processes, including hydroxylation, demethylation, and deamination. When TC has fully mineralized, the degradation products are further broken down into smaller molecules.
| TC + O2˙− → TC˙− + O2 TC˙− + O2˙− → TC + O2 + OH TC˙ + OH˙ → degradation products |
Step 4: desorption of degradation products: after desorbing from the NiFe2O4/MWCNTs nanocomposite surface, the degradation products are discharged into the solution. Multiple processes, including microbial degradation, adsorption onto soil particles and volatilization, are used to further eliminate the degraded products from the solution.
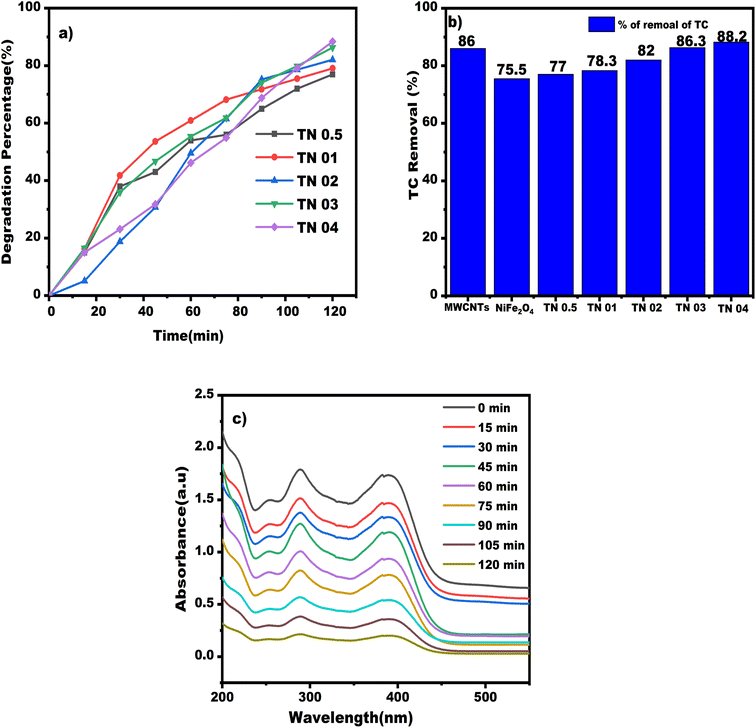
Fig. 12a, S1 and S2† illustrates the degradation percentages for various nanocomposites, with TN 04 exhibiting the highest degradation rate. Fig. 12b presents a bar graph comparing the degradation rates, with TN 04 achieving an impressive degradation rate of 88.20% and Fig. 12c displays the absorption spectra of TC antibiotics when subjected to visible light irradiation in the context of the TN 04 nanocomposite, which demonstrates the highest degradation efficiency.
The TC interaction with free OH˙ was therefore more potent at lower concentrations.62 Free radicals speed up the process of degradation of TC antibiotics. This resulted in a decrease in the process' effectiveness and partial completion of TC breakdown at high concentrations. Consequently, TC will be eliminated more quickly at lower concentrations.
Another reason is that the active sites on the nanocomposite surface are covered by pollutant molecules at high TC concentrations, which prevents the oxidative radicals from being produced and greatly slows the breakdown rate.63 Additionally, when TC concentration increases, the drug's molecules absorb more of the radiation's beam, protecting the catalyst particles from the radiation's journey to their surfaces.64
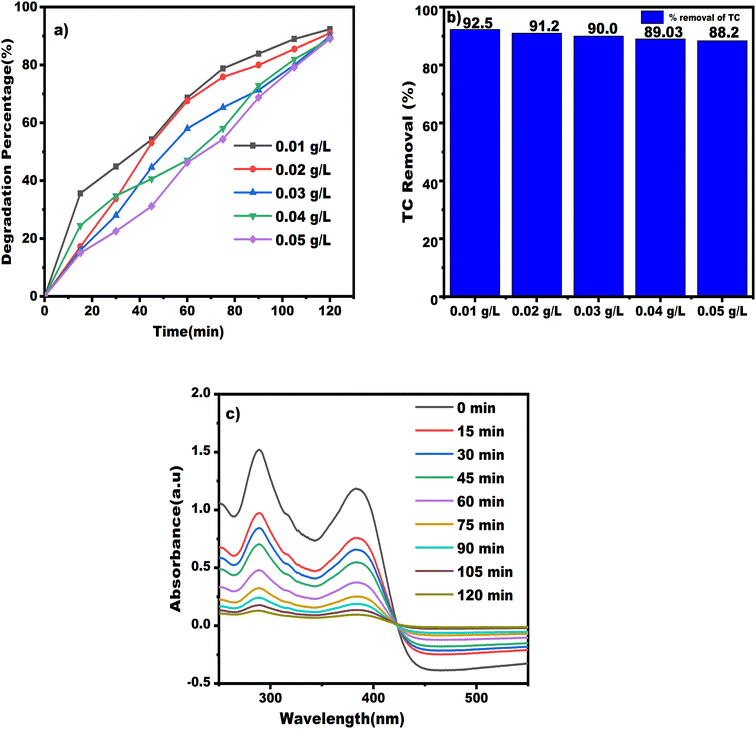
To be clear, the rate-limiting factor at high pollutant concentrations is the quantity of reactive oxidizing species. Because some catalyst particles were not triggered, the degradation rate decreased considerably. The efficacy of the ciprofloxacin (CIP) removal using magnetic nanoparticles made of Fe3O4/MWCNTs improved when the antibiotic concentration rose to >30 mg L−1, according to the results of the experiment.65 Fig. 13a displays the percentage of TC antibiotic degradation, revealing that the highest proportion occurs at a concentration of 0.01 g L−1. In Fig. 13b, a degradation rate of 92.5% is observed at the same concentration, as illustrated in the associated bar graph featuring different concentrations. Fig. 13c showcases the UV-visible spectra of TC antibiotics of TN 04 nanocomposite at a concentration of 0.01 g L−1.
Pharmaceutical compounds exhibit different forms depending on the pH of the solution and having different pK values at different pH as shown in Table 1. As a result, the interaction between NiFe2O4/MWCNTs surface, oxidative species, and TC molecules varies with the pH of the solutions. Additionally, the reaction kinetics are affected by pH, making it crucial to consider its impact on the TC decomposition process.32 The solution's pH in this study affected the TC degradation efficiency, with the best efficiency observed in basic conditions. This is explained by the greater TC quantum efficiency at alkaline pH levels.67 The amphoteric molecular structure of TC contains a variety of ionizing functional groups, and variations in pH cause TC to exist in three distinct forms that each have different effects on the functional groups. At pH 2.0, the presence of TC in the form of H4TC+ resulted in lower degradation efficiency, while at pH 9.0, the degradation efficiency increased significantly due to the presence of TC in the form of H2TC−.
Another reason is that the pH of the solution can also influence the solubility and stability of the antibiotic molecules. Antibiotics are organic molecules that can undergo hydrolysis, oxidation and other chemical reactions under certain pH conditions.68 Therefore, the pH of the solution can affect the stability and solubility of the antibiotics, which, in turn, affects their photocatalytic degradation rates. Third, the solution's pH can influence ROS formation during the photocatalytic degradation process. The formation of ROS is a complex process that involves the transfer of electrons from the photocatalyst to the antibiotic molecule. The formation of ROS is pH-dependent and the pH of the solution can influence the formation of different types of ROS.69 For example, at low pH values, the formation of OH˙ is favored, while at high pH values, the formation of O2˙− is favored. The formation of different types of ROS can affect the efficiency of the photocatalytic degradation process.
The optimal pH value for subsequent tests was chosen to be 9.0, as this was found to result in higher degradation efficiency. This improvement in efficiency can be explained by the larger electron density in the cyclic system of H2TC− in the TC molecular structure compared to H4TC+.66 This increased electron density enhances the efficiency of the radical attack on TC molecules at neutral and alkaline pHs. OH˙ radicals, which are created by the reaction between the hydroxyl ion (OH−) and the h+, are the most active oxidative species in semi-conductive photocatalytic reactions. However, in acidic conditions, nanoparticle aggregation and accumulation greatly shrink the catalyst's surface area accessible for TC adsorption, which lowers the effectiveness of TC degradation.
The OH˙ and h+ production reactions are listed as follows:
| Photocatalyst(hϑ) → h+ + e− | (9) |
| H2O + h+ → OH˙ + H+ | (10) |
| OH− + h+ → OH˙ | (11) |
| O2 + e− → O2˙− | (12) |
| O2˙− + H+ → HO2˙ (pKa = 4.88) | (13) |
| HO2˙ + HO2˙ → H2O2 + O2 | (14) |
| O2˙− + H2˙ → HO2− + O2 | (15) |
| HO2− + H+ → H2O2 | (16) |
Based on the initial chemical equations from (9) to (15), it has been determined that HO˙ generation during visible light exposure occurs due to the interaction of H2O, OH− and h+. When the environment is acidic, the concentration of H+ ions is much higher than that of OH− ions, decreasing hydroxyl radical production and reversing the second chemical reaction.70 This causes a reduction in the main chemical reactions and a significant decrease in the decontamination rate. Therefore, photocatalytic TC degradation is more effective in basic solutions than in acidic ones, consistent with previous studies.71
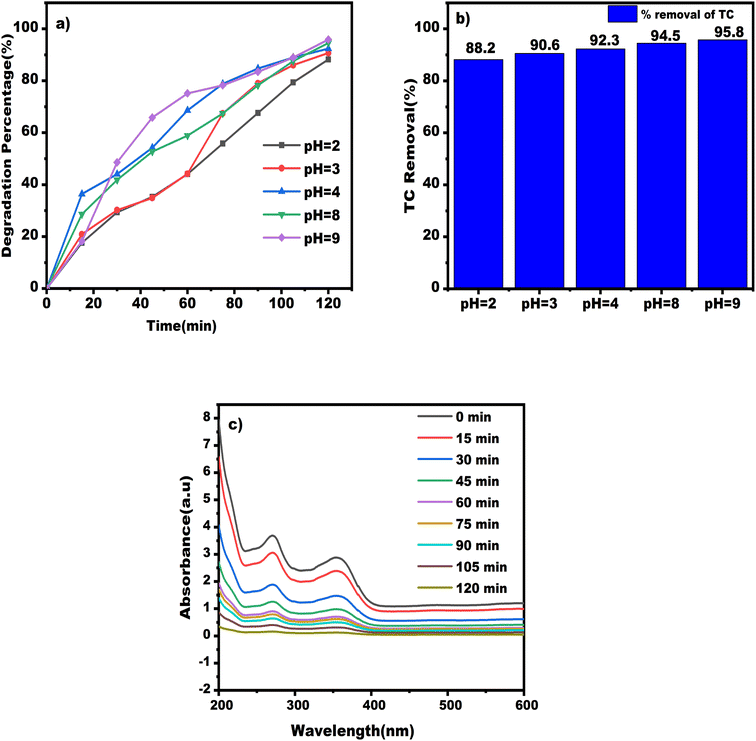
The study evaluated the efficacy of NiFe2O4/MWCNTs composite in degrading TC solutions at different pH levels (shown in Fig. S5 and S6†). The highest degradation percentage was observed for composite 0.6 g L−1 of TN 04 at a solution concentration of 0.01 g L−1, with a maximum degradation percentage achieved after 120 minutes of processing time and visible light irradiation of 120 W m−2. The pH of the TC solutions varied from 2 to 9, and elimination efficiencies of 88.20%, 90.6%, 92.3%, 94.5%, and 95.8% were observed for pH levels 2, 3, 4, 8, and 9 respectively, after 120 minutes as shown in Fig. 14a. The study concluded that alkaline conditions (pH 9) were most effective for the photo-catalyst degradation of tetracycline, with a removal percentage of 95.8% after 120 minutes, while acidic conditions (pH 2) were the least effective, with a removal percentage of 88.2%. Fig. 14b shows the impact on degradation rate for TC antibiotics with different values of pH solutions and its corresponding bar diagram. The absorbance results from wavelength spectrum analysis for various pH levels are presented in Fig. 14c.
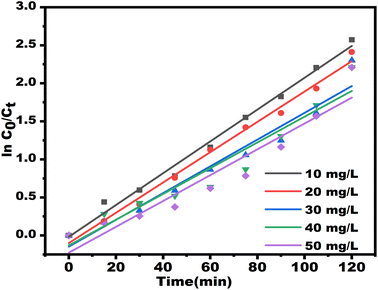 | ||
| Fig. 15 Kinetics curve of the pseudo-first-order equation for TC degradation at different initial concentrations. | ||
| Concentration (mg L−1) | Kobs (min−1) | R2 | t1/2 (min) |
|---|---|---|---|
| a t1/2 = 0.693/Kobs. | |||
| 10 | 0.0209 | 0.9915 | 34.65 |
| 20 | 0.0199 | 0.9905 | 36.47 |
| 30 | 0.0175 | 0.9537 | 40.76 |
| 40 | 0.0169 | 0.9283 | 43.31 |
| 50 | 0.0153 | 0.9126 | 42.00 |
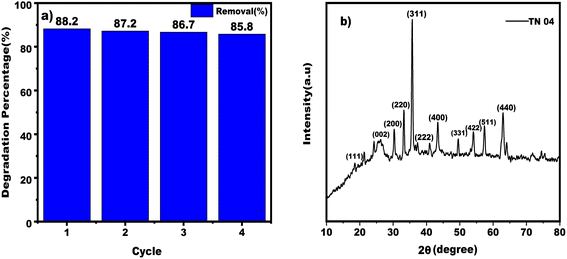 | ||
| Fig. 16 (a) bar diagram representing the photocatalytic degradation efficiency of TC in each cycle (b) shows the XRD pattern of the nanocomposite material after four cycles of degradation. | ||
| Catalyst | Light source (power) | Catalyst dosage (g L−1) | pH | Degradation time (min) | TC concentration (mg L−1) | Degradation efficiency (%) | Kapp (min−1) | Ref. |
|---|---|---|---|---|---|---|---|---|
| MWCNT/TiO2 | UV-light | 0.2 | 5 | 300 | 30 | 83 | 0.0064 | 72 |
| CoFe2O4/rGO | Visible light | 1 | 2 | 120 | 10 | 84.7 | 0.0410 | 73 |
| Perovskite oxide/g-C3N4 | Visible light | 1 | N. A | 90 | 35 | 81 | 0.0137 | 74 |
| Calcite/TiO2 | UV-light | 1.5 | 7 | 300 | 50 | 88.58 | 0.0224 | 75 |
| WO3/CNT | Visible light | 0.7 | 9 | 60 | 60 | 90 | 0.0472 | 76 |
| BiFeO3 | Visible light | 0.2 | 12 | 120 | 20 | 87.5 | 0.0561 | 77 |
| C–N–S tripoded TiO2 | Visible light | 0.7 | 7 | 180 | 5 | 92 | 0.0202 | 78 |
| Cl–TiO2 | Visible light | 1 | N. A | 60 | 15 | 72.32 | 0.0204 | 79 |
| Zeolite PbS–CdS | UV-light | 1.5 | 3 | 500 | 20 | 88 | 0.00653 | 80 |
| NiFe2O4/MWCNTs | Visible light | 0.6 | 9 | 120 | 10 | 95.8 | 0.0201 | Present work |
The correlation between the direction of migration for charge carriers generated by light and the position of a semiconductor's band edges is commonly acknowledged. To calculate the positions of these band edges, the following formulas can be employed: ECB = χ − EC − 0.5 Eg represents the potential of the CB edge and EVB = ECB + Eg represents the potential of the VB edge, χ is the absolute electronegativity of the semiconductor, while EC corresponds to the energy of free electrons on the hydrogen scale, specifically 4.50 eV82 that is the kinetic energy of electrons 1/2mv2 or p2/2 m and Eg is the bandgap of the semiconductor. The value of χ is determined by calculating the geometric mean of the absolute electronegativity of the constituent atoms. This absolute electronegativity is obtained by averaging the atomic electron affinity and the first ionization energy using the arithmetic mean. Additionally, Robert Mullikan, the Nobel Prize winner in Chemistry in 1966, introduced an alternative approach for calculating electronegativity. This method considers the first ionization energies as a factor in the calculation. The electronegativity of an atom can be calculated using the eqn (17) and (18);
 | (17) |
| χ = [χ(A)a × χ(B)b × χ(C)c]1/(a+b+c) | (18) |
By examining the photocatalytic reactions presented in eqn (19) through eqn (25), we can acquire preliminary insights into the degradation mechanism of TC when utilizing NiFe2O4/MWCNTs as a photocatalyst. In this context, the electrons residing in the CB of the photocatalyst are denoted as eCB−, while the VB of the photocatalyst is linked to the existence of valence band holes hVB+.
| NiFe2O4 + hν → NiFe2O4(eCB− + hVB+) | (19) |
| O2 + MWCNTs(eCB−) → O2˙− | (20) |
| O2˙− + MWCNTs(eCB−) + 2H+ → OH− + OH˙ | (21) |
| O2 + 3eCB− + 2H+ → 2OH− | (22) |
| H2O + hVB+ → OH˙ + H+ | (23) |
| OH− + hVB+ → OH˙ | (24) |
| OH˙/hVB+ + TC → products | (25) |
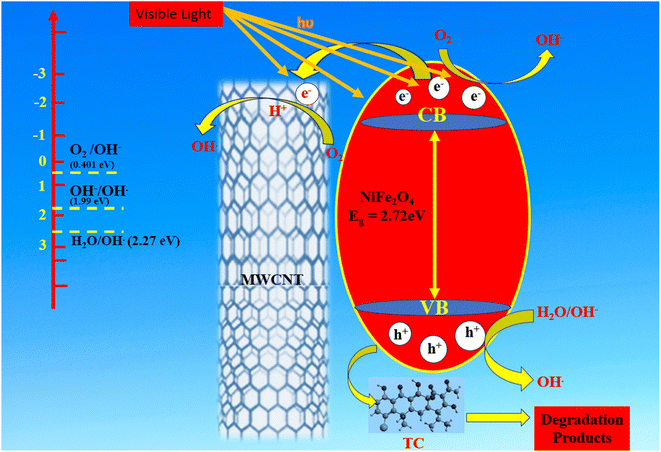
The ultimate products produced by the breakdown of pure TC molecules into smaller molecules are carbon dioxide (CO2) and water (H2O).83 A plausible mechanism has been proposed to explain how the NiFe2O4/MWCNTs composite improved visible-light-driven photocatalytic redox reactions in Fig. 18. When exposed to simulated visible light, the NiFe2O4 photocatalysts generate e− in the CB and h+ in the VB according to eqn (19).84 After the light-induced process, the generated electrons undergo rapid transfer to MWCNTs. These MWCNTs serve a dual function as electron acceptors and carriers within the photocatalytic system, effectively preventing the recombination of e− – h+ pairs.85 The photocatalytic reactions occur not only on the surface of the photocatalyst but also on the MWCNTs, leading to an increase in the specific surface area and a greater number of active reaction sites. Once the electrons are transferred to the surface of MWCNTs, they interact with surface-adsorbed oxygen, resulting in the creation of O2˙− as shown in eqn (20).86 These superoxide radicals then undergo reactions with H+ to produce OH˙ according to eqn (21). NiFe2O4 has a CB potential that is more negative (0.08 eV) than the typical redox potential of O2/OH− (0.40 eV).66 So that the high energy electrons generated during the photocatalytic process can combine with H+ ions in the solution and take part in a reaction with O2 that produces OH−, as shown in eqn (22). Additionally, due to the higher VB potential of NiFe2O4 (2.72 eV) compared to the potentials of OH−/OH˙ (1.99 eV) and H2O/OH˙ (2.27 eV), the positive h+ can react with OH− and H2O. This reaction results in the formation of OH˙ as described by eqn (23) and (24). Both photoreduction and photooxidation processes generate OH˙, which plays a crucial role in the degradation of TC.87 Moreover, the h+ in the VB of NiFe2O4 can directly oxidize TC molecules. Consequently, these highly reactive species interact simultaneously with TC molecules, leading to an efficient photocatalytic reaction, as shown in eqn (25).
4. Conclusion
In short, using a hydrothermal process, we produced a readily separable nanocomposite made of MWCNTs and NiFe2O4. This combination was created to break down TC antibiotics by photocatalysis. The photocatalytic degradation rate of the nanocomposite was significantly higher than that of the NiFe2O4 catalyst alone. According to our research, adding more NiFe2O4 nanoparticles significantly improves the photocatalytic activity of NiFe2O4/MWCNTs in degrading TC antibiotics. The dose of the nanocomposite, the concentration of the TC solution, and the pH level all impacted how quickly the material degraded. The following were determined to be the ideal conditions for effective degradation: pH 9, TN 04 (1![[thin space (1/6-em)]](https://www.rsc.org/images/entities/char_2009.gif) :
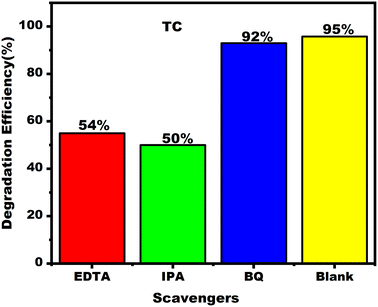
:![[thin space (1/6-em)]](https://www.rsc.org/images/entities/char_2009.gif) 4) composition, 0.6 g L−1 nanocatalyst, 10 mg per L TC solution, 120 minutes reaction time and 120 W m−2 radiation intensity. Following analysis of the kinetics driving the degradation process, a high regression coefficient value (R2) of 0.9 and a rate constant (Kobs) of 0.020 m−1 were obtained. Furthermore, studies on stability and recycling showed that the NiFe2O4/MWCNTs nanocomposite retained its efficiency through several cycles, highlighting its potential as a long-lasting catalyst. Trapping tests provided further information, showing that the NiFe2O4/MWCNTs photocatalyst may produce a significant amount of OH˙. The effective migration of photoexcited electrons, which are subsequently trapped on the surface of MWCNTs, is a key component of the photocatalytic process. The literature has thoroughly explained and characterized these fundamental processes. Thus, thorough inquiry into photocatalysis has convincingly shown a fundamental foundation and creative strategy for creating a NiFe2O4/MWCNTs nanocomposite toward superior visible active photocatalysis.
4) composition, 0.6 g L−1 nanocatalyst, 10 mg per L TC solution, 120 minutes reaction time and 120 W m−2 radiation intensity. Following analysis of the kinetics driving the degradation process, a high regression coefficient value (R2) of 0.9 and a rate constant (Kobs) of 0.020 m−1 were obtained. Furthermore, studies on stability and recycling showed that the NiFe2O4/MWCNTs nanocomposite retained its efficiency through several cycles, highlighting its potential as a long-lasting catalyst. Trapping tests provided further information, showing that the NiFe2O4/MWCNTs photocatalyst may produce a significant amount of OH˙. The effective migration of photoexcited electrons, which are subsequently trapped on the surface of MWCNTs, is a key component of the photocatalytic process. The literature has thoroughly explained and characterized these fundamental processes. Thus, thorough inquiry into photocatalysis has convincingly shown a fundamental foundation and creative strategy for creating a NiFe2O4/MWCNTs nanocomposite toward superior visible active photocatalysis.
Conflicts of interest
The authors declare that they have no known competing financial interests or personal relationships that could have appeared to influence the work reported in this paper.References
- H. M. Lwin, W. Zhan, S. Song, F. Jia and J. Zhou, Visible-light photocatalytic degradation pathway of tetracycline hydrochloride with cubic structured ZnO/SnO2 heterojunction nanocatalyst, Chem. Phys. Lett., 2019, 736, 136806, DOI:10.1016/j.cplett.2019.136806
.
- Y. Shi, Z. Yan, Y. Xu, T. Tian, J. Zhang, J. Pang, X. Peng, Q. Zhang, M. Shao, W. Tan, H. Li and Q. Xiong, Visible-light-driven AgBr–TiO2-palygorskite photocatalyst with excellent photocatalytic activity for tetracycline hydrochloride, J. Clean. Prod., 2020, 277, 124021, DOI:10.1016/j.jclepro.2020.124021
.
- B. Czech and W. Buda, Photocatalytic treatment of pharmaceutical wastewater using new multiwall-carbon nanotubes/TiO2/SiO2 nanocomposites, Environ. Res., 2015, 137, 176–184, DOI:10.1016/j.envres.2014.12.006
.
- S. Muthupandi, P. Jennifer, M. Ruban, S. Prathap, J. Madhavan, M. Raj and P. Sagayaraj, Photocatalytic application of zinc oxide synthesized via sol gel route, AIP Conf. Proc., 2023, 2770, 080003, DOI:10.1063/5.0140755
.
- K. Qi, C. Zhuang, M. Zhang, P. Gholami and A. Khataee, Sonochemical synthesis of photocatalysts and their applications, J. Mater. Sci. Technol., 2022, 123, 243 CrossRef CAS
.
- S. Shanavas, A. Priyadharsan, E. I. Gkanas, R. Acevedo and P. M. Anbarasan, High efficient catalytic degradation of tetracycline and ibuprofen using visible light driven novel Cu/Bi2Ti2O7/rGO nanocomposite: kinetics, intermediates and mechanism, J. Ind. Eng. Chem., 2019, 72, 512–528, DOI:10.1016/j.jiec.2019.01.008
.
- S. Wu, H. Hu, Y. Lin, J. Zhang and Y. H. Hu, Visible light photocatalytic degradation of tetracycline over TiO2, Chem. Eng. J., 2020, 382, 10–18, DOI:10.1016/j.cej.2019.122842
.
- T. Liu, G. Yuan, G. Lv, Y. Li, L. Liao, S. Qiu and C. Sun, Synthesis of a novel catalyst MnO/CNTs for microwave-induced degradation of tetracycline, Catalysts, 2019, 9(11), 911, DOI:10.3390/catal9110911
.
- J. Song, J. Zhang, K. Qi, C. Imparato and S. Liu, Exploration of the g-C3N4 Heterostructure with Ag–In sulfide quantum dots for enhanced photocatalytic activity, ACS Appl. Electron. Mater., 2023, 5, 4134–4144, DOI:10.1021/acsaelm.3c00404
.
- M. H. Abdurahman, A. Z. Abdullah and N. F. Shoparwe, A comprehensive review on sonocatalytic, photocatalytic, and sonophotocatalytic processes for the degradation of antibiotics in water: synergistic mechanism and degradation pathway, Chem. Eng. J., 2021, 413, 127412, DOI:10.1016/j.cej.2020.127412
.
- M. A. Rauf and S. S. Ashraf, Fundamental principles, and application of heterogeneous photocatalytic degradation of dyes in solution, Chem. Eng. J., 2009, 151, 10–18, DOI:10.1016/j.cej.2009.02.026
.
- J. Zhang, Y. Zhao, K. Qi and S. Liu, CuInS2 quantum-dot-modified g-C3N4 S-scheme heterojunction photocatalyst for hydrogen production and tetracycline degradation, J. Mater. Sci. Technol., 2024, 172, 145–155, DOI:10.1016/j.jmst.2023.06.042
.
- T. W. Odom, J. L. Huang, P. Kim and C. M. Lieber, Structure and electronic properties of carbon nanotubes, J. Phys. Chem. B, 2000, 104, 2794–2809, DOI:10.1021/jp993592k
.
- I. Raza, M. Hussain, A. N. Khan, T. Katzwinkel and J. Feldhusen, Properties of lightweight multi-walled carbon nanotubes (MWCNTs) nanocomposites, Int. J. Lightweight Mater. Manuf., 2021, 4, 195–202, DOI:10.1016/j.ijlmm.2020.09.003
.
- K. K. Kefeni and B. B. Mamba, Photocatalytic application of spinel ferrite nanoparticles and nanocomposites in wastewater treatment: review, Sustainable Mater. Technol., 2020, 23, e00140, DOI:10.1016/j.susmat.2019.e00140
.
- S. Xie, W. Li, Z. Pan, B. Chang and S. Lianfeng, Mechanical and physical properties on carbon nanotube, J. Phys. Chem. Solids, 2000, 61, 1153–1158, DOI:10.1016/S0022-3697(99)00376-5
.
- A. Awadallah-F and S. Al-Muhtaseb, Carbon nanoparticles-decorated carbon nanotubes, Sci. Rep., 2020, 10, 1–7, DOI:10.1038/s41598-020-61726-4
.
- K. K. Kefeni, B. B. Mamba and T. A. M. Msagati, Application of spinel ferrite nanoparticles in water and wastewater treatment: a review, Sep. Purif. Technol., 2017, 188, 399–422, DOI:10.1016/j.seppur.2017.07.015
.
- V. Anto Feradrick Samson, K. Mohamed Racik, S. Prathap, J. Madhavan and M. Victor Anotny Raj, Investigations of structural, optical and dielectric studies of copper oxide nanoparticles, Sustainable Mater. Technol., 2019, 8, 386, DOI:10.1016/j.matpr.2019.02.127
.
- S. Ezhil Arasi, M. Victor Antony Raj and J. Madhavan, Impact of dysprosium (Dy3+) doping on size, optical and dielectric properties of titanium dioxide nanoparticles grown by low temperature hydrothermal method, J. Mater. Sci.: Mater. Electron., 2018, 29, 3170–3422, DOI:10.1007/s10854-017-8250-2
.
- D. H. K. Reddy and Y. S. Yun, Spinel ferrite magnetic adsorbents: alternative future materials for water purification?, Coord. Chem. Rev., 2016, 315, 90–111, DOI:10.1016/j.ccr.2016.01.012
.
- J. Song, J. Zhang, A. Zada, Y. Ma and K. Qi, CoFe2O4/NiFe2O4 S-scheme composite for photocatalytic decomposition of antibiotic contaminants, Ceram. Int., 2023, 49, 12327–12333, DOI:10.1016/j.ceramint.2022.12.088
.
- N. Arumugham, A. Mariappan, J. Eswaran, S. Daniel, R. Kanthapazham and P. Kathirvel, Nickel ferrite-based composites and its photocatalytic application – A review, J. Hazard. Mater. Adv., 2022, 8, 100156, DOI:10.1016/j.hazadv.2022.100156
.
- B. Babu, R. Koutavarapu, J. Shim, J. Kim and K. Yoo, Improved sunlight-driven photocatalytic abatement of tetracycline and photo electrocatalytic water oxidation by tin oxide quantum dots anchored on nickel ferrite nanoplates, J. Electroanal. Chem., 2021, 900, 115699, DOI:10.1016/J.JELECHEM.2021.115699
.
- S. B. Narang and K. Pubby, Nickel spinel ferrites: a review, J. Magn. Magn. Mater., 2021, 519, 167163, DOI:10.1016/j.jmmm.2020.167163
.
- E. Casbeer, V. K. Sharma and X. Z. Li, Synthesis, and photocatalytic activity of ferrites under visible light: a review, Sep. Purif. Technol., 2012, 87, 1–14, DOI:10.1016/j.seppur.2011.11.034
.
- Z. Ž. Lazarević, Č. Jovalekić, A. Milutinović, D. Sekulić, V. N. Ivanovski, A. Rečnik, B. Cekić and N. Ž. Romčević, Nanodimensional spinel NiFe2O4 and ZnFe2O4 ferrites prepared by soft mechanochemical synthesis, J. Appl. Phys., 2013, 113, 187221, DOI:10.1063/1.4801962
.
- J. Huo and M. Wei, Characterization, and magnetic properties of nanocrystalline nickel ferrite synthesized by hydrothermal method, Mater. Lett., 2009, 63, 1183–1184, DOI:10.1016/j.matlet.2009.02.024
.
- S. Joshi, M. Kumar, S. Chhoker, G. Srivastava, M. Jewariya and V. N. Singh, Structural, magnetic, dielectric, and optical properties of nickel ferrite nanoparticles synthesized by co-precipitation method, J. Mol. Struct., 2014, 1076, 55–62, DOI:10.1016/j.molstruc.2014.07.048
.
- J. Zhang, R. Shu, C. Guo, R. Sun, Y. Chen and J. Yuan, Fabrication of nickel ferrite microspheres decorated multi-walled carbon nanotubes hybrid composites with enhanced electromagnetic wave absorption properties, J. Alloys Compd., 2019, 784, 422–430, DOI:10.1016/j.jallcom.2019.01.073
.
- S. M. Margaret, A. J. P. Paul Winston, S. Muthupandi, P. Shobha and P. Sagayaraj, Enhanced photocatalytic degradation of phenol using urchin-like ZnO microrod-reduced graphene oxide composite under visible-light irradiation, J. Nanomater., 2021, 2021, 1–11, DOI:10.1155/2021/5551148
.
- A. A. Isari, M. Mehregan, S. Mehregan, F. Hayati, R. Rezaei Kalantary and B. Kakavandi, Sono-photocatalytic degradation of tetracycline and pharmaceutical wastewater using WO3/CNT heterojunction nanocomposite under US and visible light irradiations: a novel hybrid system, J. Hazard. Mater., 2020, 390, 122050, DOI:10.1016/j.jhazmat.2020.122050
.
- M. Abdel Salam, M. A. Gabal and A. Y. Obaid, Preparation and characterization of magnetic multi-walled carbon nanotubes/ferrite nanocomposite and its application for the removal of aniline from aqueous solution, Synth. Met., 2012, 2651–2658, DOI:10.1016/j.synthmet.2011.09.038
.
- J. Zhang, R. Shu, C. Guo, R. Sun, Y. Chen and J. Yuan, Fabrication of nickel ferrite microspheres decorated multi-walled carbon nanotubes hybrid composites with enhanced electromagnetic wave absorption properties, J. Alloys Compd., 2019, 784, 422–430, DOI:10.1016/j.jallcom.2019.01.073
.
- M. Nawaz, A. Shahzad, K. Tahir, J. Kim, M. Moztahida, J. Jang, M. B. Alam, S. H. Lee, H. Y. Jung and D. S. Lee, Photo-fenton reaction for the degradation of sulfamethoxazole using a multi-walled carbon nanotube-NiFe2O4 composite, Chem. Eng. J., 2020, 382, 123053, DOI:10.1016/j.cej.2019.123053
.
- A. Makofane, D. E. Motaung and N. C. Hintsho-Mbita, Photocatalytic degradation of methylene blue and sulfisoxazole from water using biosynthesized zinc ferrite nanoparticles, Ceram. Int., 2021, 47, 22615–22626, DOI:10.1016/j.ceramint.2021.04.274
.
- F. A. Hezam, O. Nur and M. A. Mustafa, Synthesis, Structural, Optical, and Magnetic Properties of NiFe2O4/MWCNTs/ZnO Hybrid Nanocomposite for Solar Radiation Driven Photocatalytic Degradation and Magnetic Separation, 2020 Search PubMed
.
- S. A. Soomro, I. H. Gul, M. Z. Khan, H. Naseer and A. N. Khan, Dielectric properties evaluation of NiFe2O4/MWCNTs nanohybrid for microwave applications prepared via novel one-step synthesis, Ceram. Int., 2017, 43, 4090–4095, DOI:10.1016/j.ceramint.2016.12.002
.
- K. L. Routray, S. Saha and D. Behera, Effect of CNTs blending on the structural, dielectric, and magnetic properties of nanosized cobalt ferrite, Mater. Sci. Eng., B, 2017, 226, 199–205, DOI:10.1016/j.mseb.2017.09.021
.
- S. Joshi, M. Kumar, S. Chhoker, G. Srivastava, M. Jewariya and V. N. Singh, Structural, magnetic, dielectric, and optical properties of nickel ferrite nanoparticles synthesized by co-precipitation method, J. Mol. Struct., 2014, 1076, 55–62, DOI:10.1016/j.molstruc.2014.07.048
.
- P. Joselene Suzan Jennifer, S. Muthupandi, S. R. Niranjana, M. Joe Raja Ruban, S. Prathap, J. Madhavan and M. Victor Antony Raj, Investigation of MnO2/CuO/rGO ternary nanocomposite as electrode material for high-performance supercapacitor, Inorg. Chem. Commun., 2022, 146, 110218, DOI:10.1016/j.inoche.2022.110218
.
- R. Shu, G. Zhang, X. Wang, X. Gao, M. Wang, Y. Gan, J. Shi and J. He, Fabrication of 3D net-like MWCNTs/ZnFe2O4 hybrid composites as high-performance electromagnetic wave absorbers, Chem. Eng. J., 2018, 337, 242–255, DOI:10.1016/j.cej.2017.12.106
.
- P. Xiong, Y. Fu, L. Wang and X. Wang, Multi-walled carbon nanotubes supported nickel ferrite: a magnetically recyclable photocatalyst with high photocatalytic activity on degradation of phenols, Chem. Eng. J., 2012, 195–196, 149–157, DOI:10.1016/j.cej.2012.05.007
.
- K. Qi, R. Selvaraj, T. Al Fahdi, S. Al-Kindy, Y. Kim, G.-C. Wang, C.-W. Tai and M. Sillanpää, Enhanced photocatalytic activity of anatase-TiO2 nanoparticles by fullerene modification: a theoretical and experimental study, Appl. Surf. Sci., 2016, 387, 750–758, DOI:10.1016/j.apsusc.2016.06.134
.
- M. H. Abdurahman, A. Z. Abdullah and N. F. Shoparwe, A comprehensive review on sonocatalytic, photocatalytic, and sonophotocatalytic processes for the degradation of antibiotics in water: synergistic mechanism and degradation pathway, Chem. Eng. J., 2021, 413, 127412, DOI:10.1016/J.CEJ.2020.127412
.
- Y. Gogotsi, J. A. Libera and M. Yoshimura, Hydrothermal Synthesis of Multiwall Carbon Nanotubes, 2014 Search PubMed
.
- T. W. Odom, J. L. Huang, P. Kim and C. M. Lieber, Structure and electronic properties of carbon nanotubes, J. Phys. Chem. B, 2000, 104, 2794–2809, DOI:10.1021/jp993592k
.
- E. B. Barros, A. Jorio, G. G. Samsonidze, R. B. Capaz, A. G. Souza Filho, J. Mendes Filho, G. Dresselhaus and M. S. Dresselhaus, Review on the symmetry-related properties of carbon nanotubes, Phys. Rep., 2006, 431, 261–302, DOI:10.1016/j.physrep.2006.05.007
.
- V. Datsyuk, M. Kalyva, K. Papagelis, J. Parthenios, D. Tasis, A. Siokou, I. Kallitsis and C. Galiotis, Chemical oxidation of multiwalled carbon nanotubes, Carbon, 2008, 46, 833–840, DOI:10.1016/j.carbon.2008.02.012
.
- S. Xie, W. Li, Z. Pan, B. Chang and S. Lianfeng, Mechanical and physical properties on carbon nanotube, J. Phys. Chem. Solids, 2000, 61, 1153–1158, DOI:10.1016/S0022-3697(99)00376-5
.
- C. G. Silva and J. L. Faria, Photocatalytic oxidation of benzene derivatives in aqueous suspensions: synergic effect induced by the introduction of carbon nanotubes in a TiO2 matrix, Appl. Catal., B, 2010, 101, 81–89, DOI:10.1016/j.apcatb.2010.09.010
.
- S. Xu, W. Shangguan, J. Yuan, M. Chen and J. Shi, Preparations, and photocatalytic properties of magnetically separable nitrogen-doped TiO2 supported on nickel ferrite, Appl. Catal., B, 2007, 71, 177–184, DOI:10.1016/j.apcatb.2006.09.004
.
- N. Arumugham, A. Mariappan, J. Eswaran, S. Daniel, R. Kanthapazham and P. Kathirvel, Nickel ferrite-based composites and its photocatalytic application – A review, J. Hazard. Mater. Adv., 2022, 8, 100156, DOI:10.1016/j.hazadv.2022.100156
.
- K. N. Harish, H. S. Bhojya Naik, P. N. Prashanth Kumar and R. Viswanath, Optical and photocatalytic properties of solar light active Nd-substituted Ni ferrite catalysts: for environmental protection, ACS Sustainable Chem. Eng., 2013, 1, 1143–1153, DOI:10.1021/sc400060z
.
- S. A. Hassanzadeh-Tabrizi, Synthesis of NiFe2O4/Ag nanoparticles immobilized on mesoporous g-C3N4 sheets and application for degradation of antibiotics, J. Photochem. Photobiol., A, 2021, 418, 113398, DOI:10.1016/j.jphotochem.2021.113398
.
- F. A. Hezam, O. Nur and M. A. Mustafa, Synthesis, structural, optical, and magnetic properties of NiFe2O4/MWCNTs/ZnO hybrid nanocomposite for solar radiation driven photocatalytic degradation and magnetic separation, Colloids Surf., A, 2020, 592, 124586, DOI:10.1016/j.colsurfa.2020.124586
.
- X. He, T. Kai and P. Ding, Heterojunction photocatalysts for degradation of the tetracycline antibiotic: a review, Environ. Chem. Lett., 2021, 19, 4563–4601, DOI:10.1007/s10311-021-01295-8
.
- T. A. Saleh, The role of carbon nanotubes in enhancement of photocatalysis, in Syntheses and Applications of Carbon Nanotubes and their Composites, Intech, 2013, DOI:10.5772/51050
.
- S. Muthupandi, P. Jennifer, M. Ruban, S. Prathap, J. Madhavan and M. Raj, Synthesis and characterization and photocatalytic application of nickel oxide with pine-cone morphology, AIP Conf. Proc., 2023, 2770 DOI:10.1063/5.0140416
.
- R. Ameta and S. C. Ameta, Chapter 3 binary semiconductors, in Photocatalysis, CRC Press, 2016, pp. 17–34, DOI:10.1201/9781315372396-4
.
- C. S. Turchi and D. F. Ollis, Photocatalytic degradation of organic water contaminants: mechanisms involving hydroxyl radical attack, J. Catal., 1990, 122, 178–192, DOI:10.1016/0021-9517(90)90269-P
.
- F. Saadati, N. Keramati and M. M. Ghazi, Influence of parameters on the photocatalytic degradation of tetracycline in wastewater: a review, Crit. Rev. Environ. Sci. Technol., 2016, 46, 757–782, DOI:10.1080/10643389.2016.1159093
.
- S. Li and J. Hu, Photolytic and photocatalytic degradation of tetracycline: effect of humic acid on degradation kinetics
and mechanisms, J. Hazard. Mater., 2016, 318, 134–144, DOI:10.1016/j.jhazmat.2016.05.100
.
- J. Jeong, W. Song, W. J. Cooper, J. Jung and J. Greaves, Degradation of tetracycline antibiotics: mechanisms and kinetic studies for advanced oxidation/reduction processes, Chemosphere, 2010, 78, 533–540, DOI:10.1016/j.chemosphere.2009.11.024
.
- M. T. Samadi, R. Shokoohi, A. Poormohammadi, B. Salmani and R. Harati, Ciprofloxacin oxidation by magnetic Fe3O4/multi-walled carbon nanotubes composite as an effective heterogeneous fenton catalyst, Pharm. Lett., 2015, 7, 253–259 Search PubMed
.
- M. Khodadadi, M. H. Ehrampoush, M. T. Ghaneian, A. Allahresani and A. H. Mahvi, Synthesis, and characterizations of FeNi3@SiO2@TiO2 nanocomposite and its application in photocatalytic degradation of tetracycline in simulated wastewater, J. Mol. Liq., 2018, 255, 224–232, DOI:10.1016/j.molliq.2017.11.137
.
- M. Ahmadi, H. Ramezani Motlagh, N. Jaafarzadeh, A. Mostoufi, R. Saeedi, G. Barzegar and S. Jorfi, Enhanced photocatalytic degradation of tetracycline and real pharmaceutical wastewater using MWCNT/TiO2 nano-composite, J. Environ. Manage., 2017, 186, 55–63, DOI:10.1016/j.jenvman.2016.09.088
.
- Y. M. Hunge, A. A. Yadav, S. W. Kang and H. Kim, Photocatalytic degradation of tetracycline antibiotics using hydrothermally synthesized two-dimensional molybdenum disulfide/titanium dioxide composites, J. Colloid Interface Sci., 2022, 606, 454–463, DOI:10.1016/j.jcis.2021.07.151
.
- D. Qiao, Z. Li, J. Duan and X. He, Adsorption, and photocatalytic degradation mechanism of magnetic graphene oxide/ZnO nanocomposites for tetracycline contaminants, Chem. Eng. J., 2020, 400, 125952, DOI:10.1016/j.cej.2020.125952
.
- S. S. Shinde, C. H. Bhosale and K. Y. Rajpure, Kinetic analysis of heterogeneous photocatalysis: role of hydroxyl radicals, Catal. Rev.: Sci. Eng., 2013, 55, 79–133, DOI:10.1080/01614940.2012.734202
.
- N. Nasseh, L. Taghavi, B. Barikbin and M. A. Nasseri, Synthesis, and characterizations of a novel FeNi3/SiO2/CuS magnetic nanocomposite for photocatalytic degradation of tetracycline in simulated wastewater, J. Clean. Prod., 2018, 179, 42–54, DOI:10.1016/j.jclepro.2018.01.052
.
- M. Ahmadi, H. Ramezani Motlagh, N. Jaafarzadeh, A. Mostoufi, R. Saeedi, G. Barzegar and S. Jorfi, Enhanced photocatalytic degradation of tetracycline and real pharmaceutical wastewater using MWCNT/TiO2 nano-composite, J. Environ. Manage., 2017, 186, 55–63, DOI:10.1016/j.jenvman.2016.09.088
.
- V. Mahdikhah, S. Saadatkia, S. Sheibani and A. Ataie, Outstanding photocatalytic activity of CoFe2O4/rGO nanocomposite in degradation of organic dyes, Opt. Mater., 2020, 108, 110193, DOI:10.1016/j.optmat.2020.110193
.
- A. Kumar, A. Kumar and V. Krishnan, Perovskite Oxide Based Materials for Energy and Environment-Oriented Photocatalysis, 2020. DOI:10.1021/acscatal.0c02947
.
- N. Belhouchet, B. Hamdi, H. Chenchouni and Y. Bessekhouad, Photocatalytic Degradation of Tetracycline Antibiotic Using New Calcite/Titania Nanocomposites, Elsevier B.V., 2019, DOI:10.1016/j.jphotochem.2018.12.016
.
- A. A. Isari, M. Mehregan, S. Mehregan, F. Hayati, R. Rezaei Kalantary and B. Kakavandi, Sono-photocatalytic degradation of tetracycline and pharmaceutical wastewater using WO3/CNT heterojunction nanocomposite under US and visible light irradiations: a novel hybrid system, J. Hazard. Mater., 2020, 390, 122050, DOI:10.1016/j.jhazmat.2020.122050
.
- Z. Xue, T. Wang, B. Chen, T. Malkoske, S. Yu and Y. Tang, Degradation of tetracycline with BiFeO3 prepared by a simple hydrothermal method, Materials, 2015, 8, 6360–6378, DOI:10.3390/ma8095310
.
- C. Sushma and S. G. Kumar, C-N-S tridoping into TiO2 matrix for photocatalytic applications: observations, speculations, and contradictions in the codoping process, Inorg. Chem. Front., 2017, 4, 1250–1267, 10.1039/c7qi00189d
.
- X. Liu, P. Lv, G. Yao, C. Ma, P. Huo and Y. Yan, Microwave-assisted synthesis of selective degradation photocatalyst by surface molecular imprinting method for the degradation of tetracycline onto Cl A TiO2, Chem. Eng. J., 2013, 217, 398–406, DOI:10.1016/j.cej.2012.12.007
.
- S. Azimi and A. Nezamzadeh-Ejhieh, Enhanced activity of clinoptilolite-supported hybridized PbS-CdS semiconductors for the photocatalytic degradation of a mixture of tetracycline and cephalexin aqueous solution, J. Mol. Catal. A: Chem., 2015, 408, 152–160, DOI:10.1016/j.molcata.2015.07.017
.
- R. Kumar, M. A. Barakat, B. A. Al-Mur, F. A. Alseroury and J. O. Eniola, Photocatalytic degradation of cefoxitin sodium antibiotic using novel BN/CdAl2O4 composite, J. Clean. Prod., 2020, 246, 119076, DOI:10.1016/j.jclepro.2019.119076
.
- V. Lakshmi Ranganatha, S. Pramila, G. Nagaraju, B. Udayabhanu, B. S. Surendra and C. Mallikarjunaswamy, Cost-effective and green approach for the synthesis of zinc ferrite nanoparticles using Aegle Marmelos extract as a fuel: catalytic, electrochemical, and microbial applications, J. Mater. Sci.: Mater. Electron., 2020, 31, 17386–17403, DOI:10.1007/s10854-020-04295-6
.
- J. Song, J. Zhang, K. Zheng, Z. Xu and K. Qi, Development process of graphene field for photocatalytic and antibacterial applications, Desalin. Water Treat., 2023, 297, 117–130, DOI:10.5004/dwt.2023.29592
.
- V. Etacheri, C. Di Valentin, J. Schneider, D. Bahnemann and S. C. Pillai, Visible-light activation of TiO2 photocatalysts: advances in theory and experiments, J. Photochem. Photobiol., C, 2015, 25, 1–29, DOI:10.1016/j.jphotochemrev.2015.08.003
.
- I. Raza, M. Hussain, A. N. Khan, T. Katzwinkel and J. Feldhusen, Properties of lightweight multi-walled carbon nanotubes (MWCNTs) nanocomposites, Int. J. Lightweight Mater. Manuf., 2021, 4, 195–202, DOI:10.1016/j.ijlmm.2020.09.003
.
- M. Ahmadi, H. Ramezani Motlagh, N. Jaafarzadeh, A. Mostoufi, R. Saeedi, G. Barzegar and S. Jorfi, Enhanced photocatalytic degradation of tetracycline and real pharmaceutical wastewater using MWCNT/TiO2 nano-composite, J. Environ. Manage., 2017, 186, 55–63, DOI:10.1016/j.jenvman.2016.09.088
.
- X. Zheng, J. Yuan, J. Shen, J. Liang, J. Che, B. Tang, G. He and H. Chen, A carnation-like rGO/Bi2O2CO3/BiOCl composite: efficient photocatalyst for the degradation of ciprofloxacin, J. Mater. Sci.: Mater. Electron., 2019, 30, 5986–5994, DOI:10.1007/s10854-019-00898-w
.
Footnote |
| † Electronic supplementary information (ESI) available. See DOI: https://doi.org/10.1039/d3ra05398a |
| This journal is © The Royal Society of Chemistry 2023 |

