 Open Access Article
Exploration of the structural, vibrational, electronic, mechanical and thermal properties of Ru4Al3B2 and Ru9Al3B8: a DFT study
Arpon Chakraborty a,
M. N. H. Liton
 ab,
M. S. I. Sarker
 *a,
M. M. Rahmana and
M. K. R. Khan*a
aDepartment of Physics, University of Rajshahi, Rajshahi-6205, Bangladesh. E-mail: mfkrkhan@yahoo.com; samiul-phy@ru.ac.bd
bDepartment of Physics, Begum Rokeya University, Rangpur-5400, Bangladesh
First published on 2nd October 2023
Abstract
The structural, dynamical, electro-optical, mechanical, and thermal characteristics of the newly synthesized intermetallic compounds Ru4Al3B2 and Ru9Al3B8 have been studied under ambient and elevated pressure through density functional theory (DFT). The obtained lattice parameters of the compounds are consistent with the experimental values. The metallic character of these compounds is established by the band structure and density of states (DOS). The electronic charge density distribution and bond analysis imply that Ru4Al3B2 and Ru9Al3B8 have mainly both ionic and covalent bonding. The non-negative phonon dispersion frequency of the compounds reaffirms their dynamical stability. Both compounds are tough as well as have high melting points, and hence, can be applied in harsh conditions. Mechanical properties are significantly improved under pressure. Thermal barrier coating (TBC) is a possible field of application for both compounds. The different thermal properties such as the Debye temperature (ΘD), Grüneisen parameter (γ), melting temperature (Tm), minimum thermal conductivity (Kmin) and lattice thermal conductivity (κph) of these compounds have been studied to figure out the suitable application areas in thermally demanding situations. The pressure and temperature dependent bulk modulus (B) and other thermodynamic properties have also been analyzed, which suggested that the present compounds are strong candidates for device applications at high temperature and pressure. Owing to their high optical absorptivity and reflectivity in the UV region, they are also candidates for UV-based applications. Furthermore, they also have applicability in the fields of electronics, aviation, energy storage, and supercapacitor devices for their superior electronic, thermal and mechanical properties.
1. Introduction
The development of novel materials with extraordinary properties is an important field of study in condensed matter physics. The exploration of new phases of intermetallic compounds in recent years has resulted in the discovery of several fascinating materials such as Rh3X (X = Ti, Zr, Hf, V, Nb, Ta), YbAl3, and TiFeH2.1–5 Several intermetallic compounds have an appealing combination of physical and mechanical qualities, such as a high melting point, low density, low porosity, and resistance to oxidation or corrosion. They are widely used in the aerospace sector, aircraft and automobile engines, biomedical instruments, microprocessors, electronics, batteries, hydrogen storage systems, and chemical industries.6 At the interface of a solder joint in an electronic circuit, a layer comprising one or more intermetallic compounds inevitably forms between the solder and the relevant system.7–9Ru is a rare transition metal belonging to group VIII in the periodic table. It is one of the rarest elements in the earth's crust, having an abundance of only 0.001 ppm. Unlike the lighter congener Fe, Ru is paramagnetic at room temperature. Ruthenium is highly resistant to corrosion and oxidation. While ruthenium is not one of the most heavily studied materials, it has been the subject of significant research in recent years. The unique properties of ruthenium-based compounds make them attractive for a wide range of applications such as catalysis, electronics, energy storage and conversion, turbines of jet engines, supercapacitors, biomedical sectors like biomedicines, etc.10–16 Ru and its complexes are mostly utilized in the measurement of ferritin, calcitonin, cyclosporine, and folate levels in the human body for medical diagnosis.17 Ru-based compounds have also been used in cancer treatment, as they have been found to be effective at killing cancer cells while leaving healthy cells intact.18–21 So, there are a lot of possibilities to explore the compounds in these types of applications.
Recently, Hirt et al.22 synthesized two new Ru-based ternary borides, Ru4Al3B2 and Ru9Al3B8. They prepared single crystals of Ru4Al3B2 and Ru9Al3B8 by using the arc melting method. X-ray Diffraction (XRD) showed that Ru9Al3B8 has a hexagonal structure whereas Ru4Al3B2 has a tetragonal shape. Since both Ru4Al3B2 and Ru9Al3B8 are fairly new compounds, there is much room to investigate their different physical properties to find the possible area of technological applications.
In this study, we have emphasized on exploring the ground state structural, vibrational, electronic, mechanical, optical, and thermal properties of the newly synthesized Ru4Al3B2 and Ru9Al3B8, under ambient and elevated pressure in the framework of DFT for the first time. Overall, this study is an essential step toward a better understanding of the characteristics of the compounds, highlighting their potential for future technological applications. The findings given here are a useful resource for the scientific community, opening up new options for future research on this intriguing topic.
2. Computational method
Ab initio technique was used for the exploration of the ground state properties of the metallic Ru4Al3B2 and Ru9Al3B8 compounds by employing the Kohn–Sham density functional theory.23 CAmbridge Serial Total Energy Package (CASTEP) code was used for the detailed calculations.24 For the purpose of structural optimization of the compounds, we selected the generalized gradient approximation within the Perdew–Burke–Ernzerhof (GGA-PBE) functional.25 To model the electron–ion interactions, Vanderbilt-type ultra-soft pseudopotential was used.25 The BFGS26 technique, which stands for Broyden–Fletcher–Goldfarb–Shanno, has been used to optimize the atomic configuration. To perform the pseudo atomic computations, the valence electron configurations of Ru, Al, and B atoms have been considered as [5s14p64d7], [3s23p1], and [2s22p1], respectively. For the compounds involved in the plane wave expansion process, a kinetic energy cut-off of 550 eV was used. During the optimization process, the following additional parameters were used: k-point for Brillouin zone (BZ) sampling of 4 × 4 × 12 and 4 × 4 × 11 special points in Monkhorst–Pack grid scheme for Ru4Al3B2 and Ru9Al3B8, respectively; energy convergence thresholds of 5 × 10⁻⁶ eV per atom; maximum force of 0.01 eV Å−1; maximum stress of 0.02 GPa and maximum displacement of 5 × 10⁻⁴ Å. The phonon dispersion (PDC) and phonon density of states (PHDOS) were calculated following the finite displacement supercell method.27 A supercell with a volume two and three times that of the unit cell of Ru4Al3B2 and Ru9Al3B8, respectively, comes from a supercell with a fixed supercell dimension and a cutoff radius of 3.0. For phonon calculation, cut-off energy of 300 eV was used for both compounds.The direct explanation of many solid-state phenomena depends critically on the thermal characteristics of crystalline materials. At various temperatures and pressures, the bulk moduli, Debye temperatures, specific heats, volume thermal expansion coefficients, entropies, and internal energies of the compounds have been assessed. Baroni developed a formula to identify the temperature dependence of the energy as:27
F is the vibrational contribution to the free energy and it is:
S is defined as the vibrational contribution to the entropy and it can be written as:
The actual heat capacity which can be compared to that predicted by the Debye model is a popular portrayal of experimental data on heat capacity. This gives rise to the temperature-dependent Debye temperature, ΘD(T). In the Debye model, heat capacity is given by:28
Specific heat at constant pressure (CP) can be calculated by calculating the linear thermal expansion coefficient (TEC) first, by the following equations:
| CP = CV[1 + (TCE)γT] |
We used the quasi-harmonic Debye model to evaluate the thermodynamic properties where the temperature range was selected from 0 to 1000 K. The quasi-harmonic Debye model was described by Otero-de-La Roza et al.29,30 Utilizing the complex dielectric function, ε(ω) = ε1(ω) + iε2(ω), the optical properties of Ru4Al3B2 and Ru9Al3B8 were studied in the ground state. Kramers–Kronig relationships, which use the response function, can be used to derive the real part ε1(ω) of the dielectric function from the imaginary part ε2(ω). The electrical band structure is used to determine the imaginary portion, ε2(ω), using the following formula:32
3. Results and discussion
3.1 Structural properties
The two bi-metallic borides have different structures. Ru4Al3B2 has a tetragonal structure with space group P4/mmm while Ru9Al3B8 has a hexagonal form belonging to the space group P![[6 with combining macron]](https://www.rsc.org/images/entities/char_0036_0304.gif) 2m,22 which are depicted in Fig. 1. The Wyckoff positions of the atoms are reported in ref. 22. Table 1 provides a list of the available experimental data as well as the optimized lattice parameters at zero pressure. In terms of volume V0, the obtained findings using the functional GGA-PBE diverge from the experimental values by less than 0.95% for Ru4Al3B2 and 2.37% for Ru9Al3B8. Therefore, the obtained results possess excellent agreement with the experimental data. As the pressure increases, the lattice parameters become smaller, and as a result, the volume shrinks. One interesting fact is that the ratio a/c decreases with increasing pressure for both compounds. It indicates that the effect of pressure is superior in the a- (and b-) axis compared to the c-axis. After applying a pressure of 30 GPa, the decrease in volume is 9.98% for Ru4Al3B2 as compared to 8.78% for Ru9Al3B8, which means Ru4Al3B2 is more prone to pressure compared to Ru9Al3B8.
2m,22 which are depicted in Fig. 1. The Wyckoff positions of the atoms are reported in ref. 22. Table 1 provides a list of the available experimental data as well as the optimized lattice parameters at zero pressure. In terms of volume V0, the obtained findings using the functional GGA-PBE diverge from the experimental values by less than 0.95% for Ru4Al3B2 and 2.37% for Ru9Al3B8. Therefore, the obtained results possess excellent agreement with the experimental data. As the pressure increases, the lattice parameters become smaller, and as a result, the volume shrinks. One interesting fact is that the ratio a/c decreases with increasing pressure for both compounds. It indicates that the effect of pressure is superior in the a- (and b-) axis compared to the c-axis. After applying a pressure of 30 GPa, the decrease in volume is 9.98% for Ru4Al3B2 as compared to 8.78% for Ru9Al3B8, which means Ru4Al3B2 is more prone to pressure compared to Ru9Al3B8.
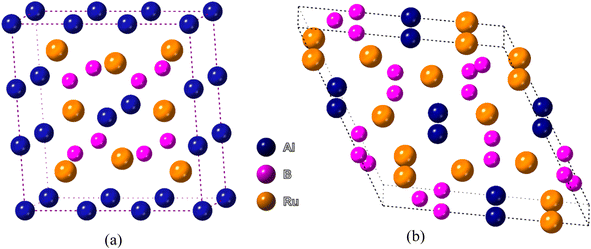 | ||
| Fig. 1 Schematic 3D crystal structure of (a) Ru4Al3B2, and (b) Ru9Al3B8 compounds. The crystallographic directions are also shown. | ||
| Compound | This work | Ref. 22 | |||||
|---|---|---|---|---|---|---|---|
| a | c | a/c | V | a | c | V | |
| Ru4Al3B2 | 8.540 | 2.935 | 2.910 | 214.04 | 8.515 | 2.924 | 212.01 |
| Ru9Al3B8 | 9.155 | 2.932 | 3.122 | 212.84 | 9.078 | ![[thin space (1/6-em)]](https://www.rsc.org/images/entities/char_2009.gif) 2.913 2.913 |
207.91 |
The structural stability of the two compounds can be confirmed by calculating the formation enthalpy of the respective compounds using the available relations.31 The formation enthalpies of the compounds under study were calculated by subtracting the energies of individual elements from the total energy using the following equation:
| ΔHf(RumAl3Bn) = Etotal(RumAl3Bn) − m × E(Ru) − 3 × E(Al) − n × E(B) |
At P = 0, 10, 20 and 30 GPa, the calculated formation enthalpies were found to be −7.525, −7.510, −7.474 and −7.423 eV per atom for Ru4Al3B2, and −7.934, −7.922, −7.894 and −7.853 eV per atom for Ru9Al3B8, respectively, which indicates that they are energetically stable. However, the formation enthalpies decreases very slowly with increasing pressure, which may be a sign of opposing effect towards the stability of both compounds.
The normalized values of the lattice parameters (a/a0 and c/c0) are given in Fig. 2, together with the normalized and volumetric value of V/V0 (inset). The optimized lattice parameters (a0, c0, and V0) and the volume at atmospheric pressure are given accordingly. As can be observed from Fig. 2, for both Ru4Al3B2 and Ru9Al3B8, each of the normalized values decreases with increasing hydrostatic pressure. Additionally, for both compounds, the value of a/a0 is lowered under applied pressure more quickly than that of c/c0, indicating that the a-axis is more contractible than the c-axis. One intriguing finding is that Ru4Al3B2 has a greater reduction in lattice parameters than Ru9Al3B8, indicating that the latter is more durable. Bond lengths and the material's internal degrees of freedom alter as a result of this decline in lattice parameters with higher pressure. The decline in lattice parameters from the zero pressure value may also be caused by density variations along crystallographic orientations.32
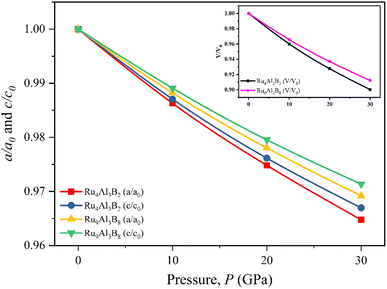 | ||
| Fig. 2 Pressure dependent normalized lattice parameters, and volume (inset) of Ru4Al3B2, and Ru9Al3B8. | ||
3.2 Vibrational properties
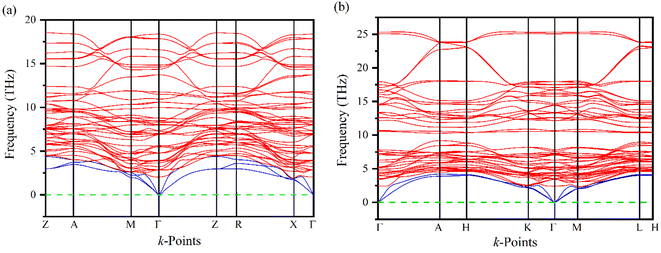
Phonons play a crucial role in understanding the physical properties of materials such as thermal conductivity, thermal expansion, elastic properties, electrical conductivity, phase transitions, etc.33–35 It is necessary to test the dynamic stability of materials because they are often exposed to time-varying mechanical stresses. The dynamics of Ru4Al3B2 and Ru9Al3B8 based on their phonon dispersion curves (PDC) at zero temperature and pressure have been analyzed by finite displacement supercell method.36,37 There are no negative frequencies found in the PDC (Fig. 3) of Ru4Al3B2 and Ru9Al3B8 in the whole BZ, indicating their dynamical stability. For Ru4Al3B2, PDC consists of 54 phonon branches including 3 acoustic modes and 51 optical modes whereas, for Ru9Al3B8, there are 60 phonon branches consisting of 3 acoustic modes and 57 optical modes. Acoustic modes (indicated by blue color) resulting from coherent vibrations of atoms outside their equilibrium positions are represented by the lower part of the phonon spectrum and the upper parts correspond to optical modes (indicated by red color). At Γ-point, the acoustic modes have zero frequency for both of the compounds, which is also an indication of their dynamical stability. Furthermore, acoustic and optical modes cross each other and no gap between these two. The overlapping between these two modes enhances their frequent interactions which provide more phonon scattering. This will in turn associated with the increasing anharmonicity which suppresses the thermal conductivity and hence increases the figure of merit (ZT).38 Therefore, the thermoelectric performance (TE) is enhanced due to the overlap of the acoustic and optical modes.3.3 Electronic properties
Electronic band structures for the optimized crystal structure of Ru4Al3B2 and Ru9Al3B8 are evaluated along the directions of high symmetry (Z-A-M-Γ-Z-R-X-Γ) and (Γ-A-H-K-Γ-M-L-H), respectively in the first Brillouin zone (BZ) at different pressures. The horizontal broken line indicates the Fermi level, EF. The band structures of the compounds are shown in Fig. 4 and 5. As we can see, a number of bands (green color) cross the EF for both compounds which indicates their metallic character. The effect of pressure on band structure is minimal on both compounds. Moreover, the dispersion of bands over all the regions in the Brillouin zone is quite similar. So, the effective mass and mobility of electrons do not vary largely.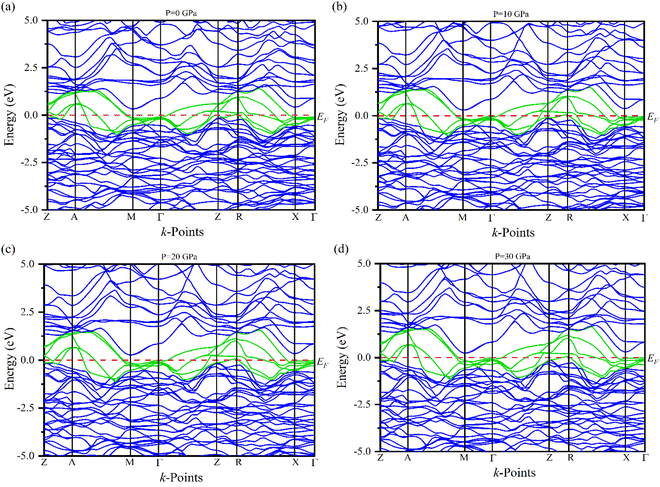 | ||
| Fig. 4 The electronic band structures of Ru4Al3B2 at (a) 0 GPa, (b) 10 GPa, (c) 20 GPa and (d) 30 GPa along the high symmetry directions. | ||
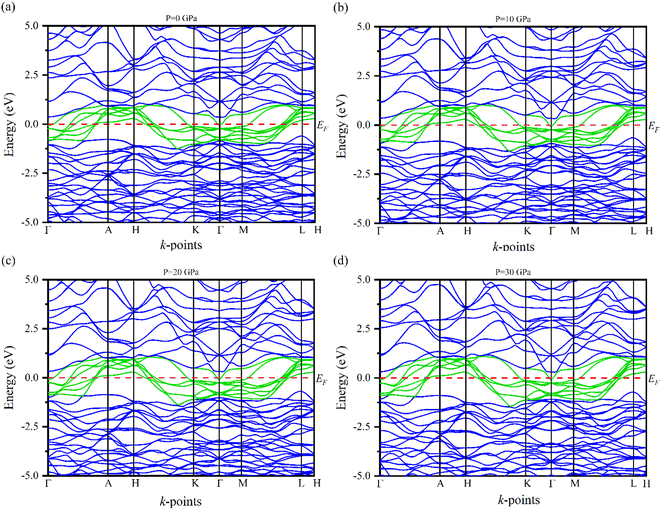 | ||
| Fig. 5 The electronic band structures of Ru9Al3B8 at (a) 0 GPa, (b) 10 GPa, (c) 20 GPa and (d) 30 GPa along the high symmetry directions. | ||
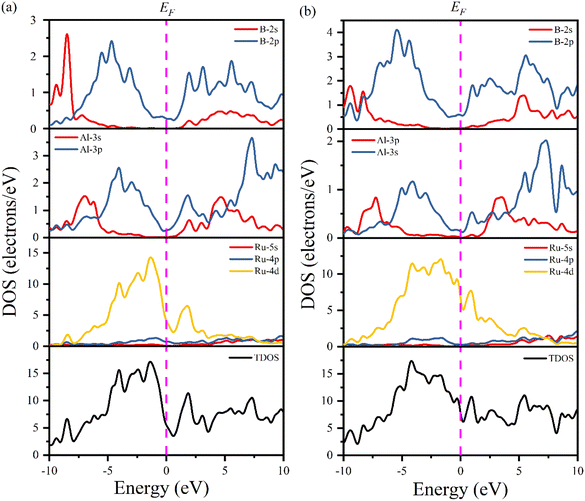
Fig. 6 shows the computed total and partial density of states (TDOS and PDOS, respectively) of Ru4Al3B2 and Ru9Al3B8 as a function of energy. The EF is indicated by the vertical dashed line. The properties of bonding and hybridization between different states can also be described by PDOS. The finite value of total DOS at the EF supports the metallic character of both Ru4Al3B2 and Ru9Al3B8 compounds. From Fig. 6(a) and (b), the calculated value of TDOS (N(EF)) at the Fermi level at zero pressure are 5.51 and 7.76 per eV per unit cell for Ru4Al3B2 and Ru9Al3B8, respectively, indicating that Ru9Al3B8 show higher electrical conductivity than that of Ru4Al3B2. The value of (N(EF)) at EF also determines the electronic stability of the compound.32 According to this, Ru4Al3B2 is highly stable than Ru9Al3B8. Near the EF, the contribution on TDOSs comes from Ru-4d mainly, with nominal contribution from Al-3p and B-2p orbitals for both compounds. Thus, these orbitals have a dominating effect on the electrical conductivity of the compounds. The lowest valence bands in Ru4Al3B2 are found to be created by the 2s orbital of B atom combined modestly with the Ru atom's 4d orbital in the energy range from −10.0 to −7.5 eV. Due to the significant hybridization between the Ru-4d, Al-3p, and B-2p orbitals, the TDOS of both Ru4Al3B2 and Ru9Al3B8 emerges from −5 eV to Fermi level. The hybridization between Al-3p and B-2p orbitals is mainly responsible for TDOS in the upper conduction band. According to the crystal field theory, the d-orbital is split into t2g (dxy, dyz, dzx) and eg (dz2, dx2−y2) states. The Ru has 7 valence electrons, where dxy, dyz states are fully occupied while dzx, dz2, dx2−y2 are half filled. More precisely, these half-filled states are hybridized with Al-px, and B-px, which are mainly responsible for the formation of the CB and VB, respectively.
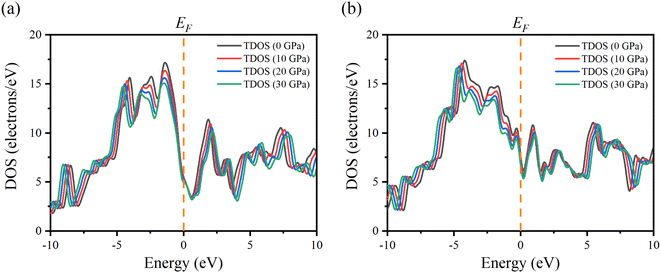
In order to better understand the electrical properties of Ru4Al3B2 and Ru9Al3B8, we also examined the TDOS of these materials under various pressures. The effect of pressure on TDOS for both compounds is shown in Fig. 7. The position of the peaks shifts towards lower energy in the valence band and higher energy in the conduction band. The symmetry of the most prominent peak remains intact despite applying pressure for Ru4Al3B2. The prominent peak appears at −4.2 eV for Ru9Al3B8 and shifts towards lower energy with pressure. By applying pressure, the value of TDOS becomes smaller which indicates that the stability of the compounds increases with pressure.
In a normal metal or semiconductor, the DOS is typically a smooth, continuous function of energy. However, in some materials, the DOS exhibits a so-called “pseudogap”, which is a region of reduced DOS at a certain energy range. The EF for both Ru4Al3B2 and Ru9Al3B is located at the left of the pseudogap, or in the bonding region. Furthermore, the covalent bonding is present in the crystals since the position of pseudogap is very close to the EF and this also notifies that the materials are highly stable and the mechanical strength of the compounds is very high.
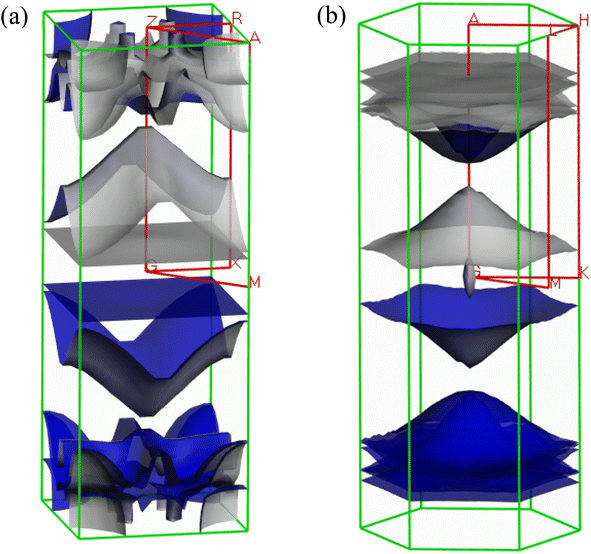
The Fermi surface configuration determines the electrical and thermal properties of a material. In this context, we have constructed the Fermi surfaces of Ru4Al3B2 and Ru9Al3B8 compounds from the respective electronic band structures, as shown in Fig. 8. The Fermi surface structure of the Ru4Al3B2 is quite different from that of the Ru9Al3B8. For Ru4Al3B2, there is a rectangular sheet and then a curvy sheet along the Γ-Z direction. At the corners of the BZ, the open surfaces are considered as electron pockets. At the top of the BZ, there are some curvy sheets with funnel like features. In the case of Ru9Al3B8, there is an arrowhead shaped surface at the Γ point. Along Γ-A direction, there is concave shaped sheet. Then, there are three convex shaped curvy sheets. And finally, there are three flat rectangular sheets. Therefore, according to the Fermi surface, both compounds contain only electron like sheets.
3.4 Bond population analysis and electronic charge density
The Mulliken population analysis (MPA) is a commonly used technique to study the bonding characteristics of Ru4Al3B2 and Ru9Al3B8 (Table 2). From Table 2, it can be seen that there is no negative value of papulation in Ru4Al3B2. So, only bonding-type interaction is present there. But it is different for Ru9Al3B8 as two Ru–B bonds have a negative population. As a result, bond overlap population values for Ru9Al3B8 indicate the presence of interactions of both the bonding-type and anti-bonding-type. The Mulliken charge analysis (Table 2) confirmed that electron is transferred from Al to Ru and B atoms in Ru4Al3B2, while in Ru9Al3B8 structure, the electron is transferred from Ru and Al to B atoms, respectively. The degree of electron transfer is different from their actual valence such as +3 for Ru, +3 for Al and −3 for B. This result revealed the existence of covalency between constituent atoms in both compounds. From bond population analysis, it is observed that Ru–B, Ru–Al and Al–B bonds possess mixed (both ionic and covalent) bonding nature. Therefore, both ionic and covalent bonds are contributed to form the crystal structures. These results are consistent with the Poisson analysis (previous section) and charge density profile (next section) of the compounds. Bond length of different bonds are also shown in Table 2. Ru–Al has the largest bond length for both compounds. All the bonds have smaller bond length than 3 Å, which is normal for a metal since metallic bonds are shorter in size.39| Compound | Bond | nµ | Pµ | dµ | Species | Mulliken atomic populations | Mulliken charge | |||
|---|---|---|---|---|---|---|---|---|---|---|
| s | p | d | Total | |||||||
| Ru4Al3B2 | Ru–B | 4 | 0.82 | 2.14837 | Ru | 2.26 | 6.57 | 7.21 | 16.04 | −0.04 |
| Ru–B | 8 | 0.58 | 2.27323 | Ru | 2.31 | 6.79 | 7.35 | 16.45 | −0.45 | |
| Al–B | 4 | 0.20 | 2.33657 | Al | 0.74 | 1.71 | — | 2.46 | 0.54 | |
| Ru–Al | 8 | 0.37 | 2.55838 | Al | 0.71 | 1.70 | — | 2.41 | 0.59 | |
| Ru–Al | 4 | 0.33 | 2.58894 | Al | 0.66 | 1.69 | — | 2.35 | 0.65 | |
| Ru–Al | 4 | 0.12 | 2.63260 | B | 1.01 | 2.35 | — | 3.36 | −0.36 | |
| Al–B | 8 | 0.04 | 2.64052 | |||||||
| Ru–Al | 8 | 0.18 | 2.86438 | |||||||
| Ru9Al3B8 | Ru–B | 6 | 0.44 | 2.19800 | Ru | 2.22 | 6.56 | 7.16 | 15.94 | 0.06 |
| Ru–B | 6 | 0.74 | 2.19897 | Ru | 2.16 | 6.46 | 7.12 | 15.74 | 0.26 | |
| Ru–B | 6 | 0.44 | 2.25404 | Al | 0.72 | 1.60 | — | 2.32 | 0.68 | |
| Ru–B | 6 | −0.12 | 2.27027 | B | 1.02 | 2.31 | — | 3.33 | −0.33 | |
| Ru–B | 6 | −0.13 | 2.35506 | B | 0.94 | 2.45 | — | 3.40 | −0.40 | |
| Al–B | 3 | 0.14 | 2.43169 | B | 0.95 | 2.49 | — | 3.44 | −0.44 | |
| Ru–Al | 3 | 0.33 | 2.45700 | |||||||
| Ru–Al | 6 | 0.27 | 2.65051 | |||||||
| Al–B | 6 | 0.03 | 2.67850 | |||||||
| Ru–Al | 6 | 0.11 | 2.87117 | |||||||
We projected the electronic charge density distribution around the atoms within the unit cell to show the bonding characteristic and charge transfer among the atoms of Ru4Al3B2 and Ru9Al3B8. Fig. 9 depicts the charge density (e/Å3) distribution for the compounds in (111) and (110) crystallographic planes, and the scale bar (0.0 to 7.5). Both of the under-investigation compounds have shown an asymmetric charge distribution for various atomic species. In the mapping photos, the blue hue indicates the degree of charge accumulation, while the red color denotes charge depletion. The electron density surrounding Ru atoms is extremely high in comparison to B and Al atoms, according to the charge density distribution in the (111) plane of both compounds. In fact, the charge density around Al atoms is absent in this plane. Only B atoms in the compound Ru9Al3B8 show a little charge. The charge distribution map in the (110) plane is very much different. For Ru4Al3B2, B atoms show very little charge density with the Al atom showing the slightest amount of density at the center. For Ru9Al3B8, the charge density around Ru atoms is very high. Very little charge around B atoms is also found with a trace amount of charge around the Al atom found near the center. The charge distribution in different planes of the compounds varies, which means that it is expected for both Ru4Al3B2 and Ru9Al3B8 to have anisotropy in their charge distribution. From Fig. 9, it can be seen that covalent bond dominates in both compounds.
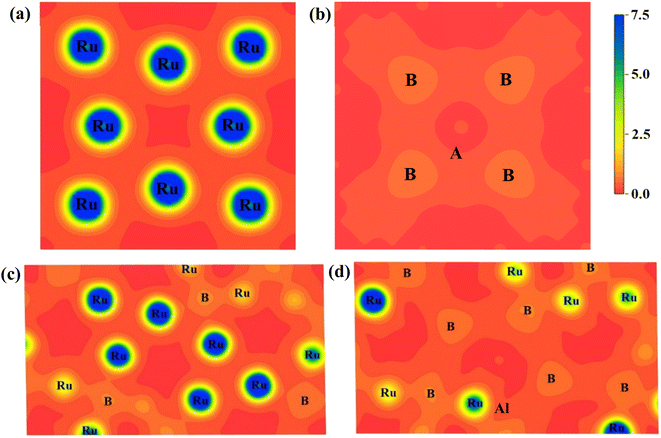 | ||
| Fig. 9 Charge density distribution in (111) plane for (a) Ru4Al3B2, (b) Ru9Al3B8 and in (110) plane for (c) Ru4Al3B2, (d) Ru9Al3B8. The charge density scale is shown on the upper-right. | ||
3.5 Elastic properties
The elastic constants are crucial in determining mechanical stability, or a material's response to macroscopic stress. There are six independent elastic constants for the tetragonal phase and five for the hexagonal phase have been calculated and listed in Table 3. The calculated elastic constants of Ru4Al3B2 and Ru9Al3B8 for the tetragonal and hexagonal phases satisfy the Born stability criteria40 at zero and elevated pressure (P = 0–30 GPa) as C11 > |C12|; 2C132 < C33(C11 + C12); C44 > 0; C66 > 0, where C66 = (C11 − C12)/2 for the tetragonal phase.| Compound | P | C11 | C12 | C13 | C33 | C44 | C66 | C″ |
|---|---|---|---|---|---|---|---|---|
| Ru4Al3B2 | 0 | 405.75 | 147.25 | 111.64 | 464.74 | 96.65 | 93.92 | 50.60 |
| 10 | 473.07 | 179.49 | 143.68 | 535.00 | 116.44 | 110.47 | 63.05 | |
| 20 | 544.13 | 214.41 | 179.99 | 600.28 | 133.57 | 123.94 | 80.84 | |
| 30 | 595.76 | 242.97 | 205.67 | 660.87 | 149.53 | 133.08 | 93.44 | |
| Ru9Al3B8 | 0 | 425.89 | 217.25 | 155.95 | 500.54 | 138.50 | — | 78.75 |
| 10 | 488.40 | 254.64 | 186.54 | 556.30 | 157.68 | — | 96.96 | |
| 20 | 539.35 | 289.50 | 232.71 | 638.64 | 172.86 | — | 116.64 | |
| 30 | 600.48 | 325.24 | 260.62 | 691.11 | 191.02 | — | 134.22 |
In addition, some notable characteristics can be evaluated using the elastic stiffness constant, Cij. For both compounds, the value of C33 > C11 (Table 3) indicates stronger atomic bonding along the c-axis than the a-axis. Furthermore, in comparison to C44, C11 and C33 levels are much greater which tells the stiffness of the crystal is much higher in the [100] and [001] directions. This means that more energy is required to cause a change in shape or size along these directions compared to the shear deformation. The Cauchy pressure (C″ = C12–C44) in Table 3 is related to the concept of stress in materials and it is a measure of ductility/brittleness.41 A compound is likely to be ductile and has an ionic bond if Cauchy pressure is positive, and vice versa.42 Since C″ is positive at 0–30 GPa pressures, Ru4Al3B2 and Ru9Al3B8 both are ductile and have the dominance of ionic bonding.
The moduli of elasticity are numerical constants that describe the mechanical properties of a material when it is subjected to applied stress. The bulk modulus, B and shear modulus, G can be calculated from the elastic constants utilizing the Voigt–Reuss–Hill (VRH) approximations.43–46 Furthermore, the associated formulas and theories to calculate elastic moduli B, G, E (Young modulus) and ν (Poisson ratio) can be found in previous literature.47–49 The calculated moduli of elasticity of Ru4Al3B2 and Ru9Al3B8 are tabulated in Table 4. A relatively large value of B and G implies that both compounds are hard materials. In this study, B increased by 56.70% and 48.71% for Ru4Al3B2 and Ru9Al3B8 respectively, while G increased by 48.79% and 32.58% for Ru4Al3B2 and Ru9Al3B8 when applied pressure rises from 0 to 30 GPa. It indicates that for both compounds, it will take more volume stress to change their shape than shear stress. The calculated large values of E of the compounds disclose higher stiffness of the compounds. Under external pressure (0–30 GPa), E is increased by 44.66% and 34.60% for Ru4Al3B2 and Ru9Al3B8, respectively. Between them, Ru9Al3B8 possesses the higher stiffness. Since the acoustic mode is responsible for thermal transport due to its large group velocity but the group velocity is also dependent on Young's modulus and the mass density by the following relation:50
| Compound | P | BV | BR | BH | GV | GR | GH | EV | ER | EH |
|---|---|---|---|---|---|---|---|---|---|---|
| Ru4Al3B2 | 0 | 224.15 | 224.03 | 224.09 | 117.83 | 111.43 | 114.63 | 300.77 | 286.74 | 293.79 |
| 10 | 268.32 | 268.18 | 268.25 | 136.29 | 130.65 | 133.47 | 349.66 | 337.19 | 343.44 | |
| 20 | 315.26 | 315.18 | 315.22 | 152.49 | 147.27 | 149.88 | 393.96 | 382.27 | 388.13 | |
| 30 | 351.22 | 351.09 | 351.16 | 166.30 | 161.06 | 163.68 | 430.89 | 419.09 | 425.00 | |
| Ru9Al3B8 | 0 | 267.85 | 267.81 | 267.83 | 131.14 | 126.60 | 128.87 | 338.22 | 328.11 | 333.18 |
| 10 | 309.84 | 309.84 | 309.84 | 146.81 | 142.03 | 144.42 | 380.35 | 369.62 | 375.00 | |
| 20 | 358.57 | 358.23 | 358.40 | 158.29 | 152.95 | 155.62 | 413.96 | 401.69 | 407.83 | |
| 30 | 398.34 | 398.22 | 398.28 | 173.64 | 168.09 | 170.86 | 454.83 | 442.07 | 448.46 |
From this relation, it is confirmed that the compound with higher mass density has lower group velocity and hence lower the lattice thermal conductivity. According to this identity, the thermal conductivity of Ru4Al3B2 and Ru9Al3B8 should expected to be low and the transport properties would be high. This result is consistent with phonon analysis.
When a material is stretched or compressed, Poisson's ratio, ν represents the ratio of lateral strain to axial strain. It can be used to determine the brittle/malleable nature, compressibility, and bonding force characteristics51,52 of a compound. Furthermore, Pugh's ratio (B/G) is also used to determine whether a compound is malleable or not. Interestingly, there is a threshold value of both Poisson's (0.26) and Pugh's ratios (1.75) to determine the malleability/brittleness of a compound. A compound having a value of Poisson's ratio and Pugh's ratio higher than that threshold value should be malleable and vice versa. In this study, it can be seen that both Poisson's ratio and Pugh's ratio of both Ru4Al3B2 and Ru9Al3B8 are above their threshold value. So, both compounds are malleable, i.e., ductile. Ru9Al3B8 is more malleable compared to Ru4Al3B2 and their malleability increases with pressure. Besides this, Poisson's ratio can also reflect the nature of the bonding of a compound. If ν < 0.25, then covalent bond dominates the compound whereas ν ≥ 0.25 indicates ionic characteristics.53 Moreover, if ν is found to be in the range of 0.25 ≤ ν ≤ 0.50, then central force dominates in the solid and non-central force dominates if ν is outside of this range.54 From our findings, ionic contribution and central force interaction play a key role in both compounds.
The machinability index, µM determines the cutting force, tool wear, and many other aspects of a material. The machinability index, µM of a material can be stated as:55
The hardness of the materials was calculated using an empirical approach:56,57
Both compounds are found to be quite hard and micro hardness is greater than the macro hardness (Table 5) due to the difference in parameters used to calculate them. As expected, the hardness increases with increasing pressure. One interesting thing is that Ru4Al3B2 has more macro hardness than that of Ru9Al3B8, but it is the opposite in the case of micro hardness.
| Compound | P | ν | B/G | µM | Hmacro | Hmicro | KIC |
|---|---|---|---|---|---|---|---|
| Ru4Al3B2 | 0 | 0.281 | 1.95 | 2.318 | 11.63 | 16.70 | 2.42 |
| 10 | 0.287 | 2.01 | 2.304 | 12.48 | 18.99 | 2.84 | |
| 20 | 0.295 | 2.10 | 2.360 | 12.71 | 20.51 | 3.24 | |
| 30 | 0.298 | 2.15 | 2.348 | 13.16 | 22.01 | 3.56 | |
| Ru9Al3B8 | 0 | 0.293 | 2.08 | 1.934 | 11.58 | 17.81 | 2.76 |
| 10 | 0.298 | 2.15 | 1.965 | 12.02 | 19.42 | 3.12 | |
| 20 | 0.310 | 2.30 | 2.073 | 11.44 | 19.68 | 3.47 | |
| 30 | 0.312 | 2.33 | 2.085 | 12.04 | 21.38 | 3.81 |
The ability of a material to resist the propagation of cracks and fractures when subjected to external forces is referred to as fracture toughness, KIC can be determined by using the formula proposed by Niu et al.:58
| KIC = V01/6G(B/G)0.5 |
The obtained values of KIC for the compounds are listed in Table 5. Ru4Al3B2 is more prone to cracks than Ru9Al3B8 and the trend suggests that KIC increases with pressure.
The anisotropy factors A1, A2 and A3 also known as shear anisotropy factors, associated with the {100}, {010} and {001} shear planes between 〈011〉 and 〈010〉, 〈101〉 and 〈001〉, and 〈110〉 and 〈100〉 directions, respectively. The variation of the values of Ai (i = 1,2,3) different from unity implies the anisotropic nature of the compounds under consideration:59–61
Shear anisotropic factors for Ru4Al3B2 and Ru9Al3B8 are calculated and provided in Table 6 and the results reveal that Ru4Al3B2 is more anisotropic whereas Ru9Al3B8 has less anisotropy.
| Compound | Pressure (GPa) | A1 | A2 | A3 |
|---|---|---|---|---|
| Ru4Al3B2 | 0 | 0.597 | 0.597 | 0.727 |
| 10 | 0.646 | 0.646 | 0.753 | |
| 20 | 0.681 | 0.681 | 0.752 | |
| 30 | 0.708 | 0.708 | 0.754 | |
| Ru9Al3B8 | 0 | 0.902 | 0.902 | 1.000 |
| 10 | 0.939 | 0.939 | 1.000 | |
| 20 | 0.970 | 0.970 | 1.000 | |
| 30 | 0.992 | 0.992 | 1.000 |
3.6 Thermophysical properties
Different thermo-physical properties of a compound are firmly accompanied by the sound velocity through the material as well as Debye temperature. The construction of musical instruments, transducer design, acoustic application underwater and noise attenuation in a jet engine, etc. depend greatly on a material's acoustic characteristics. Thermal conductivity is another crucial physical characteristic for spintronic and electronic device applications at high temperatures.where ρ is the density of the material.
The mean sound velocity, vm can be obtained in terms of the transverse, vt and longitudinal, vl sound velocities:62
The calculated pressure dependent longitudinal velocity of the compounds is ∼1.5 to ∼2 times higher than that of the transverse velocity, as can be seen in Table 7. From our study, it is found that Ru9Al3B8 is harder than Ru4Al3B2 as the sound velocities are higher in it. As expected, the velocities become higher when pressure is applied, and the average sound velocity increases by 13.61% and 10.25% for Ru4Al3B2 and Ru9Al3B8, respectively when the pressure is increased to 30 GPa. It indicates that the effect of pressure on Ru4Al3B2 is more than that of Ru9Al3B8.
 (m4 kg−1 s−1), and density ρ (g cm−3) of Ru4Al3B2 and Ru9Al3B8 at different pressure (GPa)
| Compound | P | vl | vt | vm | Z | ρ | |
|---|---|---|---|---|---|---|---|
| Ru4Al3B2 | 0 | 6922.90 | 3817.72 | 4254.46 | 30.025 | 0.485 | 7.865 |
| 10 | 7380.61 | 4036.57 | 4501.20 | 33.065 | 0.493 | 8.191 | |
| 20 | 7794.16 | 4204.50 | 4693.24 | 35.648 | 0.496 | 8.479 | |
| 30 | 8073.07 | 4328.40 | 4833.68 | 37.815 | 0.495 | 8.737 | |
| Ru9Al3B8 | 0 | 7233.31 | 3916.16 | 4370.22 | 32.908 | 0.466 | 8.403 |
| 10 | 7599.14 | 4074.31 | 4549.93 | 35.447 | 0.468 | 8.700 | |
| 20 | 7943.85 | 4165.77 | 4659.22 | 37.357 | 0.465 | 8.968 | |
| 30 | 8244.11 | 4306.74 | 4818.12 | 39.674 | 0.468 | 9.212 |
The acoustic impedance, Z, of a material is found in:63
According to the above equation, a material with higher density and shear modulus has a higher acoustic impedance. In our present study, acoustic impedance Ru9Al3B8 is higher than Ru4Al3B2 and it increases with increasing pressure.
The intensity of sound radiation is an important parameter in the design of acoustic insulation and soundproofing materials, which aim to reduce the amount of sound energy that is transmitted from one space to another. For a particular driving source, the radiation intensity, I depends on the surface velocity. This is related to the modulus of rigidity and density as:63
 is called the radiation factor.
The values of Z and I are tabulated in Table 7. Both compounds have a similar intensity of sound radiation.
where h stands for Planck constant, kB is Boltzmann's constant, NA is Avogadro's number, ρ indicates mass density, M is the molecular weight, and n is the number of atoms within the unit cell. The estimated large value of the Debye temperature (Table 8) for both Ru4Al3B2 and Ru9Al3B8 suggests that high melting point, high thermal conductivity, and high stiffness are expected. Since ΘD has an inverse relation with specific heat capacity, these compounds will have fairly low values of specific heat capacity.
Understanding the melting behavior of solids is important in materials science and engineering, as it affects the processing and performance of materials in various applications. The following equation65 can be used to determine the melting temperature Tm of solids using the elastic constants:
The values of Tm for Ru4Al3B2 and Ru9Al3B8 are listed in Table 8. As we can see, both compounds have very high melting temperatures, and hence their possible applicability lies in thermally harsh conditions. The effect of pressure on the melting temperature is enormous as the value of Tm rises sharply with temperature with 38% for Ru4Al3B2 and 34% for Ru9Al3B8 when the pressure increases from 0 to 30 GPa.
 (W m−1 K−1) of Ru4Al3B2 and Ru9Al3B8 at various pressures (GPa)
| Compound | P | ΘD | Tm | α (×10−5) | ρCP (×106) | λdom (×10−12) | γ | kmin | |
|---|---|---|---|---|---|---|---|---|---|
| Ru4Al3B2 | 0 | 555.20 | 2268.37 | 1.396 | 3.48 | 178.20 | 1.664 | 1.128 | 24.224 |
| 10 | 595.42 | 2575.72 | 1.199 | 3.63 | 188.54 | 1.693 | 1.226 | 28.379 | |
| 20 | 628.00 | 2886.82 | 1.068 | 3.75 | 196.58 | 1.741 | 1.308 | 30.958 | |
| 30 | 653.29 | 3132.59 | 0.976 | 3.87 | 202.47 | 1.762 | 1.374 | 33.598 | |
| Ru9Al3B8 | 0 | 591.80 | 2382.47 | 1.242 | 3.89 | 183.05 | 1.728 | 1.247 | 18.403 |
| 10 | 623.31 | 2653.66 | 1.108 | 4.03 | 190.58 | 1.762 | 1.329 | 20.370 | |
| 20 | 644.76 | 2929.99 | 1.028 | 4.15 | 195.16 | 1.839 | 1.389 | 20.338 | |
| 30 | 672.75 | 3192.10 | 0.936 | 4.26 | 201.82 | 1.852 | 1.462 | 22.545 |
The dominant phonon wavelength, λdom can have important effects on the thermal and mechanical properties of the solid, such as its thermal conductivity, specific heat capacity, and phonon scattering. The dominant phonon wavelength for Ru4Al3B2 and Ru9Al3B8 at 300 K has been calculated by using the following relationship:66
where ν is the Poisson's ratio which can also be calculated from longitudinal (vl) and transverse (vt) sound waves using the relation:67,68
The calculated values γ of the compounds with varying pressure are tabulated in Table 8 and γ rises with pressure. The value of γ is high for both compounds indicating strong anharmonicity, hence thermal conductivity will be low for both compounds. Additionally, a large value of γ implies that the compound's thermal properties, such as thermal expansion, specific heat, and thermal conductivity, are highly sensitive to changes in temperature and pressure. Therefore, both Ru4Al3B2, and Ru9Al3B8 can be useful for applications in thermoelectric devices, temperature sensors, and other areas where precise control of thermal properties is necessary.
the Boltzmann constant, kB, Avogadro's number NA, the mass densityρ, the number of atoms in a molecule n, the average sound velocity vm, and the molecular weight M, are all included in this expression. The values of kmin of both compounds are listed in Table 8 and they have fairly low values. It is worth noting that materials with extremely low thermal conductivity can have useful applications in insulation or thermoelectric devices. For thermal barrier coating (TBC) applications, kmin should be equal to or smaller than the limiting value of 1.25 W m−1 K−1,69 and according to our study, both Ru4Al3B2 and Ru9Al3B8 can be used as TBC material at ambient pressure.
Lattice thermal conductivity, kph, on the other hand, refers to the contribution of phonons to the overall thermal conductivity of a material. Using Slack's model, the lattice thermal conductivity can be calculated by using the empirical formula:70
The factor A(γ) is determined by Julian's formula,71
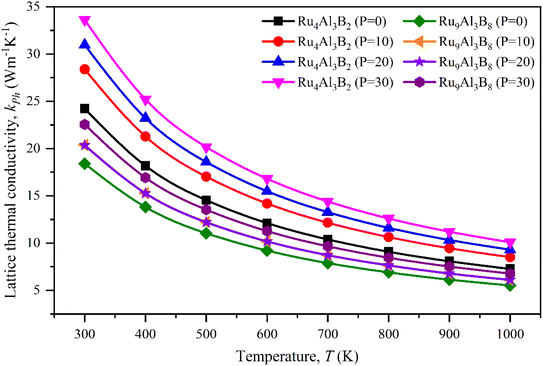
The lattice thermal conductivity calculated for Ru4Al3B2 and Ru9Al3B8 at room temperature (300 K) is listed in Table 8 and the temperature dependence on kph is shown in Fig. 10. With increasing pressure, kph rises for Ru4Al3B2. However, there is an exception in the case of Ru9Al3B8. When 20 GPa of pressure is applied, kph decreases instead of increasing. It increases again when 30 GPa of pressure is applied. From Fig. 10, it can be said that Ru4Al3B2 has higher lattice thermal conductivity than Ru9Al3B8 for all pressure ranges. The exponential decrease of the lattice thermal conductivity with the increase in temperature is perceived for both compounds.
3.7 Optical properties
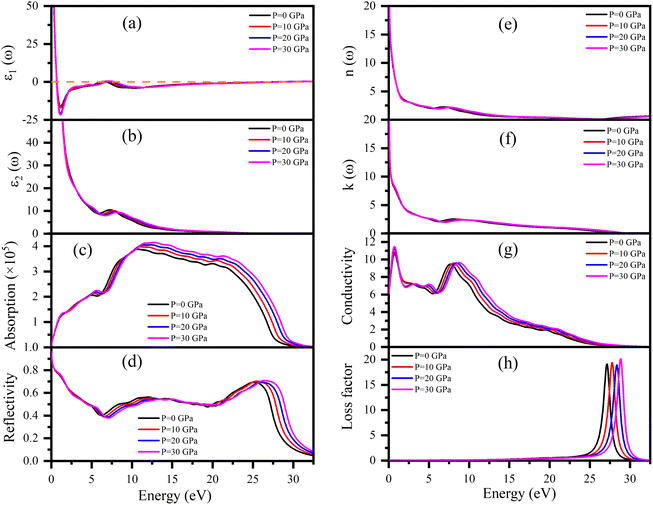
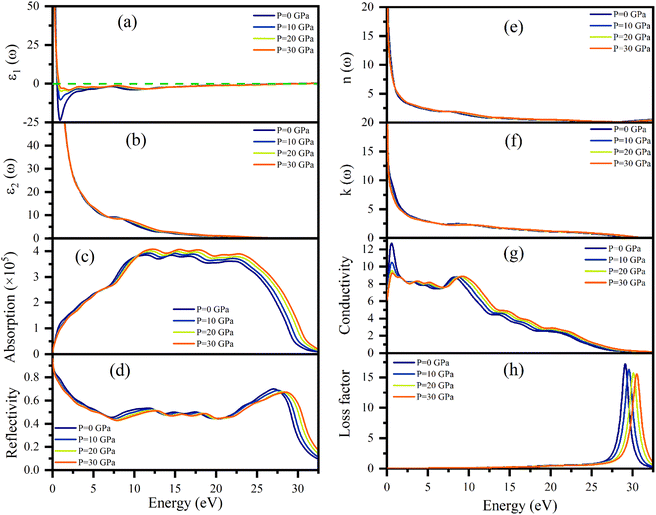
Dielectric function ε(ω), refractive index n(ω), absorption coefficient α(ω), optical conductivity σ(ω), reflectivity R(ω), and energy loss function L(ω) of Ru4Al3B2 and Ru9Al3B8 were calculated since they are useful to determine the optical properties of a compound. The pressure induced optical parameters of the compounds are depicted in Fig. 11 and 12 for incident energies up to 32.5 eV along the [100] direction. The dielectric function, ε(ω) = ε1(ω) + ε2(ω) is a complex-valued quantity that describes the response of a material to an external electric field, where ε1(ω) and ε2(ω) are real and imaginary parts of ε(ω). The real part, ε1(ω) in Fig. 11(a) has a prominent peak in the range 0–0.5 eV and falls below zero at ∼0.5 eV for both compounds and remains below that mark until ∼28.3 eV and ∼30.1 eV is reached for Ru4Al3B2 and Ru9Al3B8, respectively, and shows metallic characteristic with a strong Drude peak at low energy. The greatest value of ε2(ω) occurs at zero energy and falls with increasing photon energy, as seen in Fig. 11(b) and 12(b). This is a very common incidence in metallic systems. It can be seen from the figures that the value of ε2(ω) become zero at ∼24.8 eV and ∼28.2 eV for Ru4Al3B2 and Ru9Al3B8, respectively, predicting that the compounds will show transparency above that energy value. Fig. 11(c) and 12(c) depict the absorption of the compounds Ru4Al3B2 and Ru9Al3B8, respectively. In both cases, the absorption starts at 0 eV, which is another indication of their metallic characteristic. For Ru4Al3B2, the peak absorption is at ∼10.7 eV and the peak value shifts towards slightly higher energy with pressure. Absorption decreases to some extent with energy till ∼21 eV and after that, it falls drastically. For Ru9Al3B8, absorption reaches its peak at ∼11 eV and remains nearly the same up to ∼23.7 eV. It falls rapidly after that value. It is noteworthy that the absorption coefficient is of the order of ∼105 cm−1 which concluded that both compounds should be excellent solar absorbers and would be suitable for absorber in photovoltaic device applications. The reflectivity spectra start at 95%, and 96% for Ru4Al3B2 and Ru9Al3B8, respectively, are shown in Fig. 11(d) and 12(d).The maximum value of the reflectivity is found in the IR and visible range of photon energy. Furthermore, the reflectance spectra for Ru4Al3B2 and Ru9Al3B8 in the 0 to 30 eV photon energy range never drop below 38% and 42%, respectively. The value of reflectivity spectra of these two compounds is higher than that of other metallic borides of Cr4AlB4 (ref. 72) and Zr3CdB4.73 Based on our calculations, Ru9Al3B8 can be used as coatings on space crafts as it can avoid solar heating. In Fig. 11(e, f) and 12(e, f), respectively, the real, n(ω), and imaginary, k(ω), components of the refractive indices of Ru4Al3B2 and Ru9Al3B8 are depicted. At zero photon energy/frequency, the values of n are 51.28 and 52.92, respectively.
A high refractive index is a necessary condition for photonics and optoelectronic applications, such as LEDs, OLEDs, mini-LEDs, micro-LEDs, and QDLEDs screens. These two compounds have very high values of n(0) and can be used in micro LED screens that will be used in virtual reality/augmented reality headsets which need very high pixel per inch (PPI) screens. The spectrum of k(ω) shows that the studied compounds will have low-energy light (IR) absorption since its peak is in the 0–1 eV range. The effect of pressure on both n and k is negligible. Optical conductivity starts at 0 eV of photon energy (Fig. 11(f) and 12(f)), which further confirms the metallic character. For both Ru4Al3B2 and Ru9Al3B8, photoconductivity rises in the IR region at first and sharply decreases until the visible range is reached. Photoconductivity reaches its next peak at 7.7–8.7 eV for Ru4Al3B2 depending on the pressure and at 8.2–9.3 eV for Ru9Al3B8. After that, it gradually decreases to zero. One interesting fact is the effect of pressure is evident on Ru9Al3B8 in the IR region. Photoconductivity decreases with increasing pressure in this region. The conductivity of a material depends on the number of free charge carriers available to conduct electricity. In the IR region, the energy of the radiation is lower than the energy required to excite electrons from the valence band to the conduction band. Therefore, there are fewer free electrons available for conduction, which leads to a decrease in conductivity.
Optical loss is a property of materials that describes the amount of electromagnetic energy, such as light or infrared radiation, that is lost as it passes through the material. Because of the relatively high value of ε2(ω), it is evident from Fig. 11(h) and 12(h) that neither compound experiences any energy loss up to about 15 eV. Maximum energy loss is observed due to plasma resonance. The peak of the loss function is found to be at 27.0–28.8 eV for Ru4Al3B2 and at 29.0–30.5 eV for Ru9Al3B8. The reflection and absorption spectra drop dramatically at these energies, and the compounds under study are expected to have high transmittance. The effect of pressure is non-selective for Ru4Al3B2, but for Ru9Al3B8, there is a clear pattern. The peak value of the loss function of Ru9Al3B8 shifts towards higher photon energy while the height of the peak decreases with pressure. In the case of Ru4Al3B2, only the position of the peak shifts.
3.8 Thermodynamic properties
Different temperatures and pressures are frequently applied to materials. Therefore, the study of pressure and temperature dependent bulk modulus and thermodynamic properties has an enormous effect on how they are used at high-temperature and pressure in industrial applications. Gibbs2 (ref. 30) program was used to investigate the temperature and pressure dependent thermodynamic properties of Ru4Al3B2 and Ru9Al3B8, shown in Fig. 13 (a–r). The pressure range was set to 0–100 GPa, and the temperature range was set to 0–1000 K. It was found that no phase transition occurred for both compounds while the specified pressure and temperature were applied. Fig. 13(a and b) shows the temperature and pressure dependence of adiabatic bulk modulus, B of the two compounds at P = 0 GPa and T = 300 K, respectively. From Fig. 13(a), it is observed that the difference of B between the two compounds is almost double, but both follow the same pattern. Bulk modulus decreases slowly at a low (∼100 K) temperature range, which is associated with the 3rd law of thermodynamics and after that point, the decrement is much more. The decrease of B with pressure indicates that the compounds become harder at high pressure. At a given T, the bulk modulus, B increases with increasing P, which is a usual characteristic because external stress makes the compound mechanically stronger. Between the two compounds, Ru9Al3B8 is stronger due to the higher value of bulk modulus. From Fig. 13(b), it is evident that the bulk modulus, B increases linearly with increasing pressure, P at room temperature (300 K) for both compounds. Fig. 13(c and d) presents the Debye temperature, ΘD as a function of temperature and pressure and the value of ΘD decreases with increasing temperature. These curves are similar to that of the bulk modulus. B and ΘD decrease with temperature since material stiffness also decreases with temperature.74 On the other hand, pressure increases the stiffness of the compound and as a result, B and ΘD also increase. ΘD increases in a non-linear fashion, between linear and exponential. Specific heat capacity at constant volume, CV, and at constant pressure, CP of Ru4Al3B2 and Ru9Al3B8, as a function of temperature and pressure, are also shown in Fig. 13(e–h). Heat capacities rise due to phonon thermal softening as temperature increases. The discrepancy between CP and CV is related to thermal expansion by anharmonicity effects. CV follows the Debye equation, which states that in the low temperature region (T ∼ 300 K), CV is proportional to T3, and at high temperatures (T > 300 K), the anharmonic influence on heat capacity is muted and CV approaches the traditional asymptotic Dulong–Petit limit CV = 3nNAkB (224.49 J mol−1 K−1 for Ru4Al3B2 and 498.87 J mol−1 K−1 for Ru9Al3B8). At low T, CP behaves likewise to CV while CP is slightly greater than CV at higher temperatures. From Fig. 13(g and h), it is observed that both CV and CP decreases with increasing pressure and their decrement is identical.Fig. 13(i and j) show the predicted volume thermal expansion coefficient, αV, as a function of the temperature and pressure of Ru4Al3B2 and Ru9Al3B8. Since Ru4Al3B2 is less dense than Ru9Al3B8, αV is found to be higher in Ru4Al3B2. αV increases rapidly, especially up to T < 300 K, and then, it increases at a low pace in higher temperature regions. For both compounds, αV follows the same pattern albeit with a discrepancy in their values. As pressure is increased, αV falls exponentially. The higher value of αV for Ru4Al3B2 indicates that it is more ductile.
In a solid, the internal energy is the result of the random movement of molecules. Fig. 13(k and l) display the internal energy of the compounds as a function of temperature and pressure, respectively. U grows slowly in the low-temperature region, but after T > 200 K, it increases more rapidly. Both the value and increase of the internal energy are greater for Ru9Al3B8. Furthermore, from Fig. 13(l), it is observed that U increases in a linear pattern with increasing pressure at room temperature.
Entropy, S is a unit of measurement for how much a process causes the energy of atoms and molecules to disperse. The entropy variations of Ru4Al3B2 and Ru9Al3B8 as a function of temperature and pressure are depicted in Fig. 13(m and n). For low temperatures (T < 100 K), the value of entropy is almost the same for both compounds. In high temperature region (T > 100 K), the increase of entropy is very high for Ru9Al3B8, and when 1000 K is reached, entropy in Ru9Al3B8 is almost double compared to that in Ru4Al3B2. It is also found that the entropy, S decreases with increasing pressure. This is due to the fact that the volume decreases with increasing pressure. The rate of decrease of entropy, S with pressure is similar for the two compounds.
The Grüneisen parameter, γ, describes how the specific heat of a material changes in response to changes in volume or pressure, and is related to the anharmonicity of the interatomic potentials in the material. Fig. 13(o and p) depicts the temperature and pressure dependence on the Grüneisen parameter. From Fig. 13(o), it can be seen that γ increases with temperature with Ru4Al3B2 having a much higher value. On the other hand, γ decreases exponentially with pressure for both compounds as can be seen from Fig. 13(p).
Temperature and pressure dependent Gibb's free energy of Ru4Al3B2 and Ru9Al3B8 are depicted in Fig. 13(q and r). Two separate scales had to be used for the compounds because of the vast difference between the values of Gibb's energy of the two compounds follows the same pattern when the temperature is increased. It increases linearly. But, when the pressure is increased beyond 20 GPa, G decreases exponentially for both compounds.
4. Conclusion
A detailed investigation of the structural, vibrational, electronic, mechanical, and thermal properties of the Ru-based compounds, Ru4Al3B2 and Ru9Al3B8, was conducted using DFT method. The study found that both compounds are stable against decomposition into binary elements, as suggested by enthalpy calculations on phase stability. The phonon dispersion and density of states indicate that both compounds are dynamically stable, with no imaginary frequency observed in the phonon dispersion curves. The metallic character is confirmed by their electronic band structures. Both electron and hole like sheets are present in the Fermi surface. Both ionic and covalent bond characters are observed from Mulliken bond analysis and charge density profile. The stiffness constants, B, G, Y, Hmacro, and Hmicro of Ru9Al3B8 were found to be higher than those of Ru4Al3B2 implying that Ru9Al3B8 is harder than the latter one. Ru4Al3B2 possesses more elastic anisotropy than Ru9Al3B8. For both compounds, various thermal properties, such as sound velocities, the Grüneisen parameter (γ), Debye and melting temperature (ΘD, Tmin), heat capacities (CP, CV), volume thermal expansion coefficient (VTEC), and minimum and lattice thermal conductivity (kmin, kph) were also calculated for different pressures. All the mechanical and thermodynamic properties are strongly depend on pressure and temperature. Therefore, the compounds are quite likely to come up with applied under high pressure and temperature environments. The optical absorption and photoconductivity spectra showed that both compounds exhibit metallic characteristics, and Ru9Al3B8 was found to be better suited for potential applications as a thermal barrier coating (TBC) and solar absorber material for UV-based optical devices. We hope this work will inspire other research groups to investigate these exciting compounds in the near future.Data availability
Data will be made available on request.Conflicts of interest
The authors declare that they have no known competing financial interests or personal relationships that could have appeared to influence the work reported in this paper.Acknowledgements
We acknowledge the Department of Physics, University of Rajshahi, Bangladesh for providing high configuration computing facilities.References
- M. Rajagopalan and M. Sundareswari, Ab initio study of the electronic structure of rhodium based intermetallic compounds under pressure, J. Alloys Compd., 2004, 379, 8–15, DOI:10.1016/j.jallcom.2004.02.011.
- J. Liang, D. Fan, P. Jiang, H. Liu and W. Zhao, First-principles study of the thermoelectric properties of intermetallic compound YbAl3, Intermetallics, 2017, 87, 27–30 CrossRef CAS.
- T. An and F. Qin, Relationship between the intermetallic compounds growth and the microcracking behavior of lead-free solder joints, J. Electron. Packag., 2016, 138, 011002 CrossRef.
- Y. Terada, K. Ohkubo, S. Miura, J. M. Sanchez and T. Mohri, Thermal conductivity and thermal expansion of L12 intermetallic compounds based on rhodium, J. Alloys Compd., 2003, 354, 202–207 CrossRef CAS.
- L. Mohammedi, B. Daoudi and A. Boukraa, Ab-initio structural and electronic properties of the intermetallic compound TiFeH2, Comput. Condens. Matter, 2015, 2, 11–15 CrossRef.
- S. Murarka, Metallization: Theory and Practice for VLSI and ULSI, Butterworth-Heinemann, Boston, 1992 Search PubMed.
- J. Magnien, G. Khatibi, M. Lederer and H. Ipser, Investigation of interfacial behavior in miniaturized solder interconnects, Mater. Sci. Eng., A, 2016, 673, 541–550 CrossRef CAS.
- K. S. Kim, S. H. Huh and K. Suganuma, Effects of intermetallic compounds on properties of Sn–Ag–Cu lead-free soldered joints, J. Alloys Compd., 2003, 352, 226–236 CrossRef CAS.
- M. I. Naher, F. Parvin, A. K. M. A. Islam and S. H. Naqib, Physical properties of niobium-based intermetallics (Nb3B; B = Os, Pt, Au): a DFT-based ab initio study, Eur. Phys. J. B, 2018, 91, 289, DOI:10.1140/epjb/e2018-90388-9.
- Y. Koo, S. Oh, K. Im and J. Kim, Ultrasonic spray pyrolysis synthesis of nano-cluster ruthenium on molybdenum dioxide for hydrogen evolution reaction, Appl. Surf. Sci., 2023, 611, 155774, DOI:10.1016/j.apsusc.2022.155774.
- W. Donphai, N. Thepphankulngarm, T. Chaisuwan, D. Tanangteerapong, S. C. Rood and P. Kongkachuichay, Catalytic performance of copper and ruthenium loaded on N-doped modified PBZ-derived carbons for CO2 hydrogenation, Chem. Eng. Sci., 2023, 274, 118693, DOI:10.1016/j.ces.2023.118693.
- D. Majumdar, T. Maiyalagan and Z. Jiang, Recent Progress in Ruthenium Oxide-Based Composites for Supercapacitor Applications, ChemElectroChem, 2019, 6, 4343–4372, DOI:10.1002/celc.201900668.
- E. Villemin, Y. C. Ong, C. M. Thomas and G. Gasser, Polymer encapsulation of ruthenium complexes for biological and medicinal applications, Nat. Rev. Chem, 2019, 3, 261–282, DOI:10.1038/s41570-019-0088-0.
- R. Kumar and R. Thangappan, Electrode material based on reduced graphene oxide (rGO)/transition metal oxide composites for supercapacitor applications: a review, Emergent Mater., 2022, 5, 1881–1897, DOI:10.1007/s42247-021-00339-7.
- M. N. Hossain, S. Chen and A. Chen, Fabrication and electrochemical study of ruthenium-ruthenium oxide/activated carbon nanocomposites for enhanced energy storage, J. Alloys Compd., 2018, 751, 138–147, DOI:10.1016/j.jallcom.2018.04.104.
- S. K. Singh and D. S. Pandey, Multifaceted half-sandwich arene–ruthenium complexes: interactions with biomolecules, photoactivation, and multinuclearity approach, RSC Adv., 2013, 4, 1819–1840, 10.1039/C3RA44131H.
- A. K. Sahu, D. K. Dash, K. Mishra, S. P. Mishra, R. Yadav, P. Kashyap, A. K. Sahu, D. K. Dash, K. Mishra, S. P. Mishra, R. Yadav, and P. Kashyap, Properties and Applications of Ruthenium, IntechOpen, 2018. DOI:10.5772/intechopen.76393.
- J. Liu, H. Lai, Z. Xiong, B. Chen and T. Chen, Functionalization and cancer-targeting design of ruthenium complexes for precise cancer therapy, Chem. Commun., 2019, 55, 9904–9914, 10.1039/C9CC04098F.
- I. Zuba, M. Zuba, M. Piotrowski and A. Pawlukojć, Ruthenium as an important element in nuclear energy and cancer treatment, Appl. Radiat. Isot., 2020, 162, 109176, DOI:10.1016/j.apradiso.2020.109176.
- K. Lin, Z.-Z. Zhao, H.-B. Bo, X.-J. Hao and J.-Q. Wang, Applications of Ruthenium Complex in Tumor Diagnosis and Therapy, Front. Pharmacol., 2018, 9, 1323, DOI:10.3389/fphar.2018.01323.
- G. Sava and A. Bergamo, Ruthenium Drugs for Cancer Chemotherapy: An Ongoing Challenge to Treat Solid Tumours, in Platin. Heavy Met. Compd. Cancer Chemother. Mol. Mech. Clin. Appl., ed. A. Bonetti, R. Leone, F. M. Muggia, and S. B. Howell, Humana Press, Totowa, NJ, 2009, pp. 57–66, DOI:10.1007/978-1-60327-459-3_8.
- S. Hirt, F. Hilfinger and H. Hillebrecht, Synthesis and crystal structures of the new ternary borides Fe3Al2B2 and Ru9Al3B8 and the confirmation of Ru4Al3B2 and Ru9Al5B8-x (x ≈ 2), Z. Kristallogr. – Cryst. Mater., 2018, 233, 295–307, DOI:10.1515/zkri-2017-2095.
- R. G. Parr, Density Functional Theory, Annu. Rev. Phys. Chem., 1983, 34, 631–656, DOI:10.1146/annurev.pc.34.100183.003215.
- M. D. Segall, P. J. D. Lindan, M. J. Probert, C. J. Pickard, P. J. Hasnip, S. J. Clark and M. C. Payne, First-principles simulation: ideas, illustrations and the CASTEP code, J. Phys.: Condens.Matter, 2002, 14, 2717–2744, DOI:10.1088/0953-8984/14/11/301.
- D. Vanderbilt, Soft self-consistent pseudopotentials in a generalized eigenvalue formalism, Phys. Rev. B: Condens. Matter Mater. Phys., 1990, 41, 7892–7895, DOI:10.1103/PhysRevB.41.7892.
- T. H. Fischer and J. Almlof, General methods for geometry and wave function optimization, J. Phys. Chem., 1992, 96, 9768–9774, DOI:10.1021/j100203a036.
- S. Baroni, S. de Gironcoli, A. Dal Corso and P. Giannozzi, Phonons and related crystal properties from density-functional perturbation theory, Rev. Mod. Phys., 2001, 73, 515–562, DOI:10.1103/RevModPhys.73.515.
- N. W. Ashcroft and N. D. Mermin, Solid State Physics, Holt-Saunders, 1976 Search PubMed.
- A. Otero-de-la-Roza and V. Luaña, Gibbs2: A new version of the quasi-harmonic model code. I. Robust treatment of the static data, Comput. Phys. Commun., 2011, 182, 1708–1720, DOI:10.1016/j.cpc.2011.04.016.
- A. Otero-de-la-Roza, D. Abbasi-Pérez and V. Luaña, Gibbs2: A new version of the quasiharmonic model code. II. Models for solid-state thermodynamics, features and implementation, Comput. Phys. Commun., 2011, 182, 2232–2248, DOI:10.1016/j.cpc.2011.05.009.
- A. Chakraborty, M. N. H. Liton, M. S. I. Sarker, M. M. Rahman and M. K. R. Khan, A comprehensive DFT evaluation of catalytic and optoelectronic properties of BaTiO3 polymorphs, Phys. B, 2023, 648, 414418, DOI:10.1016/j.physb.2022.414418.
- M. N. H. Liton, M. A. Helal, M. K. R. Khan, M. Kamruzzaman and A. K. M. Farid Ul Islam, Mechanical and opto-electronic properties of α-MoSi2: a DFT scheme with hydrostatic pressure, Indian J. Phys., 2022, 96, 4155–4172, DOI:10.1007/s12648-022-02355-7.
- P. Li, G. Gao, Y. Wang and Y. Ma, Crystal Structures and Exotic Behavior of Magnesium under Pressure, J. Phys. Chem. C, 2010, 114, 21745–21749, DOI:10.1021/jp108136r.
- M. A. Omar, Elementary solid state physics: principles and applications, Am. J. Phys., 1975, 43, 929–933, DOI:10.1119/1.9980.
- K. Refson, P. R. Tulip and S. J. Clark, Variational density-functional perturbation theory for dielectrics and lattice dynamics, Phys. Rev. B: Condens. Matter Mater. Phys., 2006, 73, 155114, DOI:10.1103/PhysRevB.73.155114.
- G. Kresse, J. Furthmüller and J. Hafner, Ab initio force constant approach to phonon dispersion relations of diamond and graphite, Europhys. Lett., 1995, 32, 729 CrossRef CAS.
- K. Parlinski, Z. Q. Li and Y. Kawazoe, First-principles determination of the soft mode in cubic ZrO2, Phys. Rev. Lett., 1997, 78, 4063 CrossRef CAS.
- L. Lindsay, D. A. Broido and T. L. Reinecke, Thermal Conductivity and Large Isotope Effect in GaN from First Principles, Phys. Rev. Lett., 2012, 109, 095901, DOI:10.1103/PhysRevLett.109.095901.
- J. F. Berry and C. C. Lu, Metal–Metal Bonds: From Fundamentals to Applications, Inorg. Chem., 2017, 56, 7577–7581, DOI:10.1021/acs.inorgchem.7b01330.
- F. Mouhat and F.-X. Coudert, Necessary and sufficient elastic stability conditions in various crystal systems, Phys. Rev. B: Condens. Matter Mater. Phys., 2014, 90, 224104, DOI:10.1103/PhysRevB.90.224104.
- M. E. Eberhart and T. E. Jones, Cauchy pressure and the generalized bonding model for nonmagnetic bcc transition metals, Phys. Rev. B: Condens. Matter Mater. Phys., 2012, 86, 134106, DOI:10.1103/PhysRevB.86.134106.
- W. Feng and S. Cui, Mechanical and electronic properties of Ti2AlN and Ti4AlN3: a first-principles study, Can. J. Phys., 2014, 92, 1652–1657, DOI:10.1139/cjp-2013-0746.
- W. Voigt, Lehrbuch der Kristallphysik (mit Ausschluss der Kristalloptik), Vieweg+Teubner Verlag, 1966, DOI:10.1007/978-3-663-15884-4.
- A. Reuss, Berechnung der Fließgrenze von Mischkristallen auf Grund der Plastizitätsbedingung für Einkristalle, Z. Angew. Math. Mech., 1929, 9, 49–58, DOI:10.1002/zamm.19290090104.
- R. Hill, The Elastic Behaviour of a Crystalline Aggregate, Proc. Phys. Soc., London, Sect. A, 1952, 65, 349–354, DOI:10.1088/0370-1298/65/5/307.
- R. Hill, Elastic properties of reinforced solids: Some theoretical principles, J. Mech. Phys. Solids., 1963, 11, 357–372, DOI:10.1016/0022-5096(63)90036-X.
- M. Jamal, S. Jalali Asadabadi, I. Ahmad and H. A. Rahnamaye Aliabad, Elastic constants of cubic crystals, Comput. Mater. Sci., 2014, 95, 592–599, DOI:10.1016/j.commatsci.2014.08.027.
- M. N. H. Liton, M. Roknuzzaman, M. A. Helal, M. Kamruzzaman, A. K. M. F. U. Islam, K. Ostrikov and M. K. R. Khan, Electronic, mechanical, optical and photocatalytic properties of perovskite RbSr2Nb3O10 compound, J. Alloys Compd., 2021, 867, 159077, DOI:10.1016/j.jallcom.2021.159077.
- M. N. H. Liton, M. A. Helal, A. K. M. Farid Ul Islam, M. Kamruzzaman, M. S. I. Sarker and M. K. R. Khan, Anisotropic elastic, opto-electronic and photocatalytic properties of BaTi2O5: first-principles calculations, Mater. Sci. Eng., B, 2023, 296, 116658, DOI:10.1016/j.mseb.2023.116658.
- W. Kim, Strategies for engineering phonon transport in thermoelectrics, J. Mater. Chem. C, 2015, 3, 10336–10348, 10.1039/C5TC01670C.
- I. N. Frantsevich, F. F. Voronov and S. A. Bakuta, Handbook on Elastic Constants and Moduli of Elasticity for Metals and Nonmetals, Naukova Dumka, Kiev, 1982 Search PubMed.
- Y. Cao, J. Zhu, Y. Liu, Z. Nong and Z. Lai, First-principles studies of the structural, elastic, electronic and thermal properties of Ni3Si, Comput. Mater. Sci., 2013, 69, 40–45, DOI:10.1016/j.commatsci.2012.11.037.
- B. G. Pfrommer, M. Côté, S. G. Louie and M. L. Cohen, Relaxation of Crystals with the Quasi-Newton Method, J. Comput. Phys., 1997, 131, 233–240, DOI:10.1006/jcph.1996.5612.
- O. L. Anderson and H. H. Demarest Jr, Elastic constants of the central force model for cubic structures: Polycrystalline aggregates and instabilities, J. Geophys. Res., 1971, 76, 1349–1369, DOI:10.1029/JB076i005p01349.
- Z. Sun, D. Music, R. Ahuja and J. M. Schneider, Theoretical investigation of the bonding and elastic properties of nanolayered ternary nitrides, Phys. Rev. B: Condens. Matter Mater. Phys., 2005, 71, 193402, DOI:10.1103/PhysRevB.71.193402.
- X.-Q. Chen, H. Niu, D. Li and Y. Li, Modeling hardness of polycrystalline materials and bulk metallic glasses, Intermetallics, 2011, 19, 1275–1281, DOI:10.1016/j.intermet.2011.03.026.
- A. Bouhemadou, First-principles study of structural, electronic and elastic properties of Nb4AlC3, Braz. J. Phys., 2010, 40, 52–57, DOI:10.1590/S0103-97332010000100009.
- H. Niu, S. Niu and A. R. Oganov, Simple and accurate model of fracture toughness of solids, J. Appl. Phys., 2019, 125, 065105, DOI:10.1063/1.5066311.
- P. Ravindran, L. Fast, P. A. Korzhavyi, B. Johansson, J. Wills and O. Eriksson, Density functional theory for calculation of elastic properties of orthorhombic crystals: Application to TiSi2, J. Appl. Phys., 1998, 84, 4891–4904, DOI:10.1063/1.368733.
- H.-Y. Yan, M.-G. Zhang, D.-H. Huang and Q. Wei, First-principles study of elastic and thermodynamic properties of orthorhombic OsB4 under high pressure, Solid State Sci., 2013, 18, 17–23, DOI:10.1016/j.solidstatesciences.2012.12.015.
- A. K. M. F. U. Islam, M. N. H. Liton, H. M. T. Islam, M. A. Helal and M. Kamruzzaman, Mechanical and thermodynamical stability of BiVO4 polymorphs using first-principles study, Chin. Phys. B, 2017, 26, 36301–036301, DOI:10.1088/1674-1056/26/3/036301.
- E. Schreiber, Elastic Constants and Their Measurement, McGraw-Hill Book Company, New York, 1973, http://181.176.223.4/opac_css/index.php?lvl=notice_display%26id=6480 Search PubMed.
- D. L. Schodek, P. Ferreira and M. F. Ashby, Nanomaterials, Nanotechnologies and Design: An Introduction for Engineers and Architects, Butterworth-Heinemann, 2009 Search PubMed.
- O. L. Anderson, A simplified method for calculating the debye temperature from elastic constants, J. Phys. Chem. Solids, 1963, 24, 909–917, DOI:10.1016/0022-3697(63)90067-2.
- M. E. Fine, L. D. Brown and H. L. Marcus, Elastic constants versus melting temperature in metals, Scr. Metall., 1984, 18, 951–956, DOI:10.1016/0036-9748(84)90267-9.
- D. R. Clarke, Materials selection guidelines for low thermal conductivity thermal barrier coatings, Surf. Coat. Technol., 2003, 163–164, 67–74, DOI:10.1016/S0257-8972(02)00593-5.
- D. S. Sanditov and V. N. Belomestnykh, Relation between the parameters of the elasticity theory and averaged bulk modulus of solids, Tech. Phys., 2011, 56, 1619–1623, DOI:10.1134/S106378421111020X.
- C. L. Wan, W. Pan, Q. Xu, Y. X. Qin, J. D. Wang, Z. X. Qu and M. H. Fang, Effect of point defects on the thermal transport properties of (LaxGd1-x)2Zr2O7 : Experiment and theoretical model, Phys. Rev. B: Condens. Matter Mater. Phys., 2006, 74, 144109, DOI:10.1103/PhysRevB.74.144109.
- Y. Liu, X. Zhao, Z. Yang, Z. Wang, X. Chen, S. Yang and M. Wei, New insights into element migration on La0.6Sr0.4Co0.2Fe0.8O3−δ cathodes of intermediate temperature solid oxide fuel cells, Solid State Ionics, 2019, 334, 145–151, DOI:10.1016/j.ssi.2019.02.011.
- D. T. Morelli and G. A. Slack, High Lattice Thermal Conductivity Solids, in High Therm. Conduct. Mater., ed. S. L. Shindé and J. S. Goela, Springer, New York, NY, 2006, pp. 37–68, DOI:10.1007/0-387-25100-6_2.
- C. L. Julian, Theory of Heat Conduction in Rare-Gas Crystals, Phys. Rev., 1965, 137, A128–A137, DOI:10.1103/PhysRev.137.A128.
- M. M. Ali, M. A. Hadi, M. L. Rahman, F. H. Haque, A. F. M. Y. Haider and M. Aftabuzzaman, DFT investigations into the physical properties of a MAB phase Cr4AlB4, J. Alloys Compd., 2020, 821, 153547, DOI:10.1016/j.jallcom.2019.153547.
- M. W. Qureshi, M. A. Ali and X. Ma, Screen the thermomechanical and optical properties of the new ductile 314 MAX phase boride Zr3CdB4: A DFT insight, J. Alloys Compd., 2021, 877, 160248, DOI:10.1016/j.jallcom.2021.160248.
- F. Parvin and S. H. Naqib, Pressure dependence of structural, elastic, electronic, thermodynamic, and optical properties of van der Waals-type NaSn2P2 pnictide superconductor: Insights from DFT study, Results Phys., 2021, 21, 103848, DOI:10.1016/j.rinp.2021.103848.
| This journal is © The Royal Society of Chemistry 2023 |


