 Open Access Article
Bluish-green afterglow and blue photoluminescence of undoped BaAl2O4
Bao-Gai Zhai and
Yuan Ming Huang *
*
School of Microelectronics and Control Engineering, Changzhou University, Changzhou 213164, China. E-mail: dongshanisland@126.com
First published on 24th October 2023
Abstract
Undoped BaAl2O4 was derived via sol–gel combustion technique. The afterglow and photoluminescence (PL) properties of undoped BaAl2O4 were explored with the combination of experiments and density functional theory (DFT) calculations. Undoped BaAl2O4 is found to display bluish-green afterglow that is discernible to naked eye in dark for about 20 s. The broad afterglow spectrum of undoped BaAl2O4 is peaked at around 495 nm. As a contrast, the broad PL spectrum of undoped BaAl2O4 can be decomposed into a bluish-green PL band peaking at about 2.53 eV (490 nm) and a blue PL band centered at about 3.08 eV (402.6 nm). DFT calculations indicate that the defect energy levels generated by oxygen and barium vacancies are critical to the afterglow and PL of undoped BaAl2O4. This work demonstrates that the oxygen and barium vacancies in undoped BaAl2O4 are liable for the bluish-green afterglow and blue PL of undoped BaAl2O4. The recorded bluish-green afterglow of BaAl2O4 is particularly important to understand the afterglow mechanisms of rare-earth doped BaAl2O4.
1. Introduction
Upon the stimulation of the green afterglow of Eu2+ and Dy3+ codoped SrAl2O4,1 both the afterglow and the photoluminescence (PL) of rare-earth doped BaAl2O4 have been intensively investigated.2–6 It is documented that Eu2+ and Re3+ codoped BaAl2O4 (BaAl2O4:Eu2+,Re3+) phosphors display bluish-green afterglows with their emission maxima located at around 490–500 nm where Re represents an auxiliary rare-earth dopant.2,5,6 Additionally, Dy3+ singly doped BaAl2O4 exhibits quite similar bluish-green afterglow.7 Besides their afterglows, BaAl2O4:Eu2+,Re3+ phosphors also give off bluish-green PL peaking at about 500 nm as Re = Dy,2–5,8–10 Nd, Gd, Sm, Ce, Er, Pr, Tb.4 Irrespective of the difference in Re, the PL spectra of BaAl2O4:Eu2+,Re3+ are similar to that of Eu2+ doped BaAl2O4 (BaAl2O4:Eu2+).11–14 Consequently, Eu2+ is generally assumed to be the luminescent center of afterglow and the luminescent center of PL for BaAl2O4:Eu2+ and BaAl2O4:Eu2+,Re3+.1–18This belief is, however, challenged by a number of theoretical and experimental results: (i) both undoped SrAl2O4 and Eu2+ doped SrAl2O4 exhibit quite similar green afterglow;19 (ii) both undoped CaAl2O4 and Eu2+ doped CaAl2O4 exhibit quite similar blue afterglow;20,21 (iii) the peak of the afterglow spectrum of Eu2+ doped CaAl2O4 does not shift regardless the variation in doping concentration;22 (iv) the green afterglow of Dy3+ doped SrAl2O4 and Tb3+ doped SrAl2O4 is quite similar to the afterglow of Eu2+ doped SrAl2O4;23–26 (v) Dy3+ doped BaAl2O4 exhibits bluish-green afterglow which is quite similar to that of BaAl2O4:Eu2+;7 (vi) density functional theory (DFT) calculations demonstrate that the afterglows of undoped SrAl2O4, undoped CaAl2O4 and Eu2+ doped SrAl2O4 originate from oxygen vacancy and cation vacancy in the hosts;19–21,27 (vii) oxygen vacancies are held responsible for the afterglows of a number of undoped inorganic materials such as HfO2,28 SrAl2O4,19 CaAl2O4,20,21 SrSO4,29 boric oxide,30 and ZrO2.31 These challenging facts suggest that the afterglow and PL properties of undoped BaAl2O4 are critically important for us to comprehensively unveil the afterglow mechanisms of BaAl2O4:Eu2+,Re3+. In other words, undoped BaAl2O4 would exhibit bluish-green afterglow if intrinsic defects in BaAl2O4 were liable for the afterglows of BaAl2O4:Eu2+ and BaAl2O4:Eu2+,Re3+. In this paper, bluish-green afterglow and blue PL of undoped BaAl2O4 are reported. Bluish-green afterglow of undoped BaAl2O4 is discernible to naked eye in dark for about 20 s. The broad afterglow spectrum of undoped BaAl2O4 is peaked at about 495 nm. DFT calculations show that oxygen and barium vacancies in BaAl2O4 introduce midgap states. The thermoluminescence (TL) glow curve is given. The oxygen and barium vacancies in BaAl2O4 are demonstrated to be the luminescence center of afterglow for undoped BaAl2O4.
2. Materials and methods
2.1. Preparation of undoped BaAl2O4
We employed the sol–gel combustion technique to prepare undoped BaAl2O4 phosphors.7,32,33 Analytical grade reagents Al(NO3)3·9H2O), Ba(NO3)2, H3BO3 and urea were purchased from local chemical suppliers, i.e., the Sinopharm Chemical Reagents Co., Ltd. The purity of each analytical reagent was 99.5% or higher. Theoretically speaking, absolutely pure reagents with the purity of 100% are ideal starting materials to synthesize truly undoped BaAl2O4, but they are not practically available on the market. To minimize the possibility of unintentional doping, new alumina crucibles were used as the reaction vessels. Details on the solution preparation and sol–gel combustion can be found elsewhere.20–22 After the sol–gel combustion, white powders were obtained. Subsequent annealing was performed at 700 °C for 3 h to assure the complete reactions of the raw materials. An attempt was made to analyze the resultant powders for trace contaminants. The resultant powders were tested for impurities using inductively coupled plasma mass spectrometry, but ultra-trace impurities of Eu2+, Tb3+ and Dy3+ were not detected at ppm levels in the resultant powders. For brevity, the resultant products were denoted as undoped BaAl2O4.2.2. Phase, morphology and PL spectra of BaAl2O4
The X-ray diffractometer (D/max 2500 PC, Rigaku Corporation) was employed to measure the X-ray diffraction (XRD) curve of undoped BaAl2O4. The energy dispersive X-ray (EDX) spectrum and the morphology of undoped BaAl2O4 were analyzed on the Hitachi scanning electron microscope (SEM). Micrographs of BaAl2O4 nanocrystals and their selected area electron diffraction pattern were analyzed with a transmission electron microscope (TEM) (JEOL JEM-2100, Japan Electronics Corp). To evaluate the binding energies of elements in undoped BaAl2O4, the X-ray photoelectron spectroscopy (XPS) spectra were measured on the Escalab 250Xi spectrophotometer (Thermo Scientific). Details on each instrument are available elsewhere.22Upon the 325 nm radiation of a He–Cd laser, steady-state PL spectra of undoped BaAl2O4 were recorded with a spectrophotometer (Tianjin Gangdong Ltd., China). The PL decay curves of undoped BaAl2O4 were analyzed on a PL lifetime spectrometer (LifeSpec II, Edinburgh Instruments). The excitation wavelength, typical pulse width, and pulse repetition rate of the light source were 320 nm, 860 ps, and 10 MHz, respectively. Details on the characterization are available elsewhere.34,35
2.3. Afterglow spectrum, afterglow decay and TL glow curve of undoped BaAl2O4
With the spectrophotometer made by Tianjin Gangdong Ltd., the afterglow spectrum of undoped BaAl2O4 was analyzed after the ultraviolet excitation of a high-pressure Hg lamp (175 W) was terminated. The afterglow decay curve of undoped BaAl2O4 was taken by focusing the afterglows into the entrance slit of the spectrometer. The duration of the ultraviolet excitation from the high-pressure Hg lamp was 3 min. The TL glow curve of undoped BaAl2O4 was measured on a TL meter constructed according to the scheme given by Yamashita et al.36 In order to create carriers to fill the traps in undoped BaAl2O4, the phosphors were irradiated under a low-pressure Hg lamp (254 nm, 32 W) for 5 min before TL data acquisition. The temperature rising rate was 2 K s−1. Details on the TL glow curve measurement could be found elsewhere.19,22,32,33,372.4. Electronic structures of defective BaAl2O4
The band structures and the density of states (DOS) of oxygen-deficient BaAl2O4 and barium-deficient BaAl2O4 were calculated using the DFT module of Quantumwise Atomistix ToolKit 11.8 package. The exchange–correlation functional was described by the meta generalized gradient approximation, i.e., the TB09LDA potential.38–40 Instead of a supercell, one single unit cell was used for the DFT calculations. Consisting of 32 oxygen sites, 8 barium sites and 16 aluminum sites, the total number of ions in the unit cell of BaAl2O4 is 56. The lattice parameters of hexagonal BaAl2O4 were taken from Inorganic Crystal Structure Database with a = 1.0447 nm, c = 0.8794 nm (#75426). Oxygen-deficient BaAl2O4 was resulted when one oxygen site was vacant. The resultant BaAl2O4 was denoted as BaAl2O4−δ where δ = 0.125. Similarly, barium-deficient BaAl2O4 was obtained when one barium site was vacant. The resultant BaAl2O4 was denoted as Ba1−δAl2O4 where δ = 0.125. The cut-off energy for the plane waves was 75 Hartree. The convergence criterion was 4 × 10⁻⁵ eV of total energy. The Monkhorst–Pack scheme k-points grid sampling was 5 × 5 × 5 for the Brillouin zone. Details on the DFT calculations were available elsewhere.41–433. Results and discussions
3.1. Phase and morphology of BaAl2O4
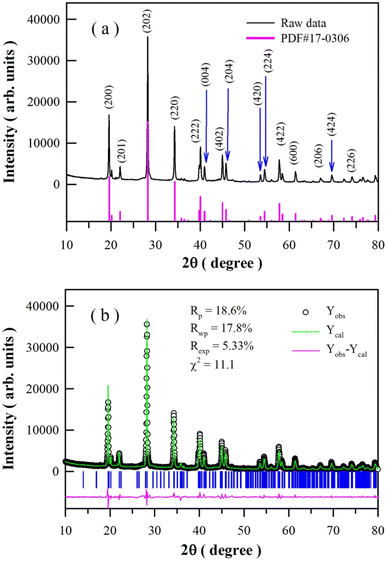
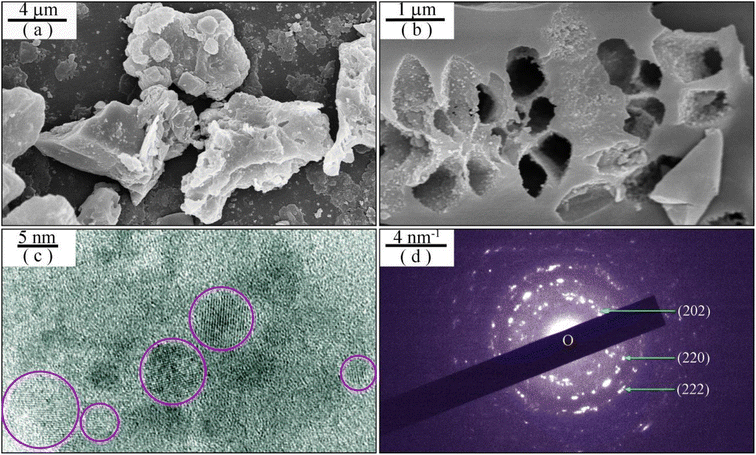
Fig. 1(a) represents the XRD profile of undoped BaAl2O4. The diffraction peaks are located at 19.60, 21.84, 28.28, 34.32, 40.10, 41.13, 45.10, 45.84, 53.63, 54.55, 57.79, 61.59, 67.23, 69.74, and 74.36°. The standard diffractograms of hexagonal BaAl2O4, which are registered in the Joint Committee on Powder Diffraction Standards (JCPDS) as card no. 17-0306, are shown at the bottom of Fig. 1(a) for the purpose of comparison. A comparison of the data in Fig. 1(a) reveals that the XRD profile matches well with those of the standard hexagonal BaAl2O4 (a = 1.0447 nm, c = 0.8794 nm). The above listed diffraction peaks are assigned to the Bragg reflections from crystallographic planes (200), (201), (202), (220), (222), (004), (402), (204), (420), (224), (422), (600), (206), (424), and (226) of hexagonal BaAl2O4, respectively. Apparently, the XRD profile in Fig. 1(a) is consistent to those of BaAl2O4:Eu2+,Re3+.2,3,6–10 Consequently, the XRD pattern in Fig. 1(a) demonstrates that crystalline BaAl2O4 is resulted via the sol–gel combustion technique. Fig. 1(b) represents the Rietveld refinement of the XRD profile. The pseudo-Voigt function was used as peak shape function. The agreement factors of the Rietveld refinement are Rp = 18.6%, Rwp = 17.8%, Rexp = 5.33% and χ2 = 11.1. The Rietveld refinement reveals that the lattice constants of the unit cell of undoped BaAl2O4 are a = 1.0440 nm and c = 0.8789 nm, which are very close to those of the reference hexagonal BaAl2O4. The hexagonal BaAl2O4 has channels along its c-direction.41Fig. 2 illustrates the morphology and microstructures of undoped BaAl2O4. As shown by the SEM micrograph in Fig. 2(a), undoped BaAl2O4 phosphors are prone to forming aggregates with irregular shapes.4,7,12,14 The typical dimension of the aggregates is around 10 μm. Obviously, each aggregate is featured of a large number of pores which are distributed non-uniformly across the aggregate. The cross section of an aggregate of undoped BaAl2O4, as evidenced in Fig. 2(b), verifies the pore distribution in the aggregate. The typical dimension of the pores is around 0.5 μm. As documented in the literature, the formation of irregular aggregates with a large number of pores in them is the characteristics of sol–gel combustion derived SrAl2O4,19,23–26 CaAl2O4,20–22,32,33 and BaAl2O4.7 Additionally, channels across the aggregates are identified in Dy3+ doped CaAl2O4 derived via sol–gel combustion.37 As shown by the TEM micrograph of an aggregate in Fig. 2(c), the aggregate consists of a large number of randomly distributed nanocrystals, indicating the polycrystalline nature of the undoped BaAl2O4. Actually, nanocrystals are present in aggregates of sol–gel combustion derived SrAl2O4,19,24,26 CaAl2O4,20–22,32,33,37 and BaAl2O4.7 The selected area electron diffraction pattern of undoped BaAl2O4 is displayed in Fig. 2(d). Indeed, the electron diffraction pattern verifies the polycrystalline nature of undoped BaAl2O4.
3.2. EDX spectrum and elemental mapping of undoped BaAl2O4
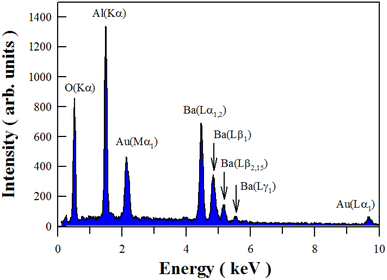
Fig. 3 illustrates the EDX spectrum of undoped BaAl2O4. It is clear that the characteristic X-ray emissions of O(Kα), Al(Kα), Au(Mα1), Ba(Lα1,2), Ba(Lβ1), Ba(Lβ2,15), Ba(Lγ1) and Au(Lα1) are located at 0.525, 1.486, 2.122, 4.466, 4.828, 5.157, 5.531 and 9.713 keV, respectively. Au sputtering for SEM analysis is responsible for the presence of Au in the sample.19,22,37 Therefore, Fig. 3 verifies the presence of Al, Ba and O in the synthesized product.Fig. 4 depicts the EDX elemental mappings of Ba, Al and O in undoped BaAl2O4. The electronic image of the selected area for elemental analysis is shown in Fig. 4(a). Fig. 4(b–d) represents the O map, Al map, and Ba map. The images in Fig. 4 reveal the uniform distribution across the sample of each element in undoped BaAl2O4.
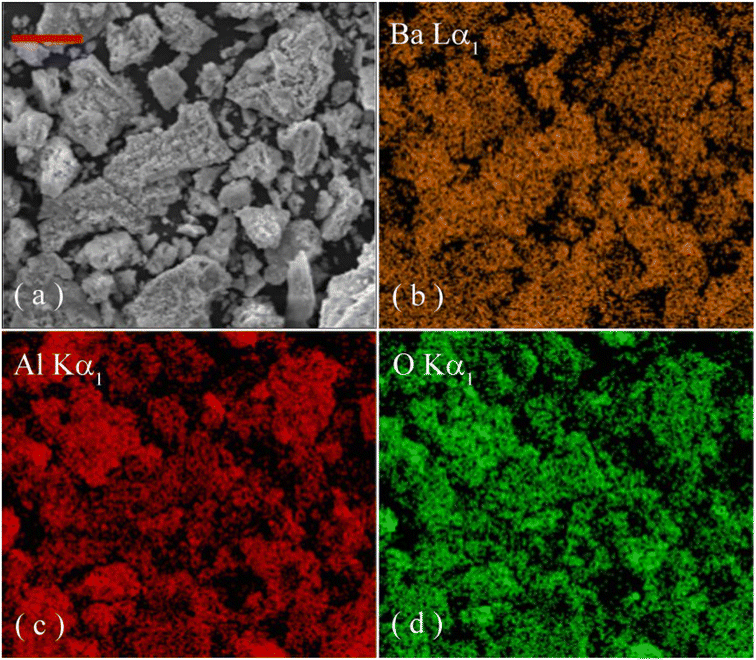 | ||
| Fig. 4 Electronic image of a selected area (a) and elemental maps of Al (b), Ba (c) and O (d) in undoped BaAl2O4. The scale bar represents 30 μm. | ||
3.3. XPS spectrum of undoped BaAl2O4
Fig. 5 depicts the survey scan (a) and high-resolution XPS spectra of Ba 3d (b), Al 2p (c) and O 1s (d) in undoped BaAl2O4. Fig. 5(a) shows that the peaks of Ba, Al, and O are present in the survey scan. Fig. 5(b) shows that the binding energies of Ba 3d5/2 and Ba 3d3/2 are 779.78 and 795.08 eV for undoped BaAl2O4, respectively. It is clear in Fig. 5(c) and (d) that the binding energies of Al 2p3/2 and O 1s are 73.88 and 531.55 eV for undoped BaAl2O4. For Ce3+ doped BaAl2O4 at the concentration of 3%, Chatterjee et al. reported that the binding energies of Ba 3d5/2, Ba 3d3/2, O 1s and Al 2p3/2 are 779.60, 795.60, 530.60 and 73.10 eV, respectively.44 Our previous studies show that the peaks of the binding energies of Ba 3d5/2, Ba 3d3/2, and O 1s are approximately 780.0, 795.2 and 531.8 eV, respectively, for Dy3+ doped BaAl2O4 (4 mol%).7 Obviously, the binding energies of O 1s, Al 2p3/2, Ba 3d5/2 and Ba 3d3/2 in undoped BaAl2O4 are close to those in Ce3+ doped BaAl2O4 and Dy3+ doped BaAl2O4.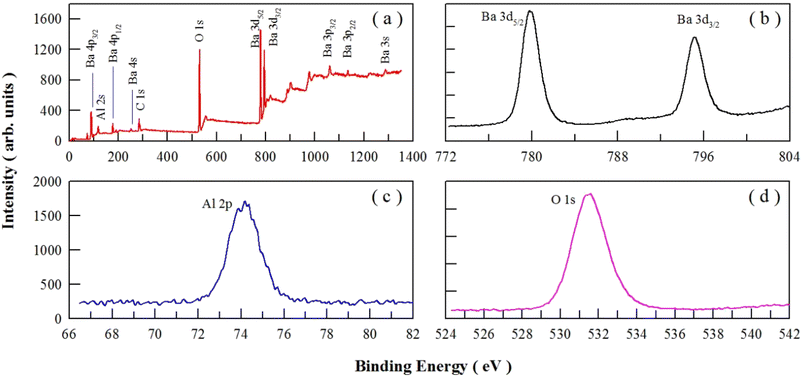 | ||
| Fig. 5 Survey scan (a) and high-resolution XPS spectra of Ba 3d (b), Al 2p (c) and O 1s (d) in undoped BaAl2O4. | ||
3.4. Steady-state PL spectrum of undoped BaAl2O4
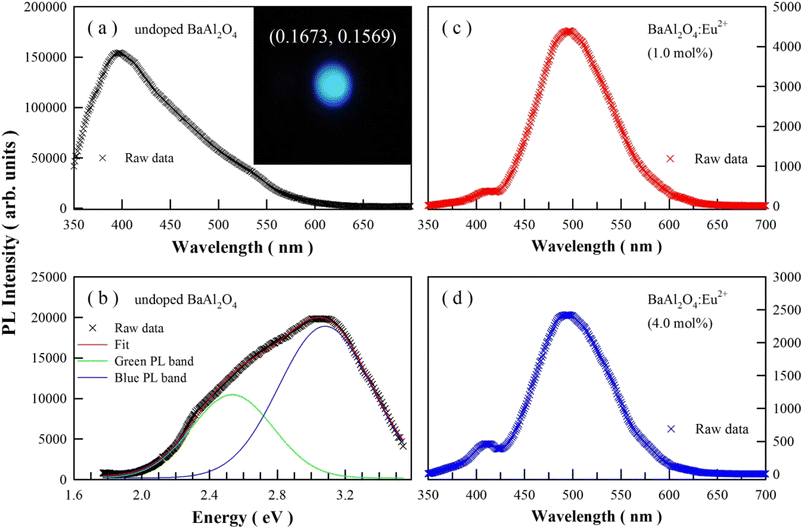
Fig. 6(a) represents the steady-state PL spectrum of undoped BaAl2O4 in wavelength scale. The inset in Fig. 6(a) represents the emission photo of undoped BaAl2O4 upon the 325 nm excitation. Apparently, this PL spectrum consists of more than one PL band due to its broad and asymmetric profile. To provide better physical insight, the PL spectrum in Fig. 6(a) is converted into a PL spectrum in energy scale by employing the Jacobian transformation.45,46 Fig. 6(b) depicts the resultant PL spectrum in energy scale, which can be deconvoluted into one green PL band peaking at 2.53 eV (490.1 nm) and one blue PL band centering at 3.08 eV (402.6 nm). Obviously, the perception color of the emissions of undoped BaAl2O4 is blue. On the basis of the PL spectrum, the chromaticity coordinates of the PL are derived to be (0.1673, 0.1569) for undoped BaAl2O4.47–49 The bandgap of BaAl2O4 is reported to be 6.47 eV.50 Band-edge emission of BaAl2O4 can be ruled out because the photon energy of the 325 nm excitation of the laser beam (3.82 eV) is insufficient. Thus, the broadband PL spectra in Fig. 6 should originate from defect related emissions of BaAl2O4. Oxygen and barium vacancies are well known to be the most common defects in BaAl2O4. After considering the oxygen vacancy and cation vacancy related emissions in SrAl2O4,19,24–26 CaAl2O4,20–22,46 BaAl2O4,7 SrSO4,29,51 HfO2,52 ZnWO4,53 and ZnMoO4,54,55 we tend to hold the oxygen and barium vacancies in BaAl2O4 liable for the two PL bands in Fig. 6(b). It is worthy of being noted that the PL intensities of Fig. 6(a) and (b) differ. To properly convert data recorded in units of wavelength, the signal values must be scaled by the Jacobian transformation. That is to say, the photon flux per constant interval of energy E in Fig. 6(b) is equal to the photon flux per constant interval of wavelength λ in Fig. 6(a) after scaled by a factor of hc/E2.45,46 The scale factor is responsible for the difference in the PL intensities of Fig. 6(a) and (b).BaAl2O4:Eu2+ and BaAl2O4:Eu2+,Dy3+ are known to exhibit bluish-green PL with its dominant peak at about 490 nm (2.53 eV).3–6,10 For instance, the room temperature PL spectrum of BaAl2O4:Eu2+,Dy3+ is peaked at 490 nm,6 the broadband PL spectrum of BaAl2O4:Eu2+,Re3+ (Re = Dy, Nd, Gd, Sm, Ce, Er, Pr, Tb) is peaked at 500 nm.4 Beside the dominant PL band varying in the range of 490–500 nm, a weak PL band often peaks at around 435 nm. For example, Rodrigues et al. and Stefani et al. reported that the PL spectrum for BaAl2O4:Eu2+,Dy3+ contains two PL bands, in which the dominant PL band is peaked at about 500 nm while the weak PL band is peaked at around 435 nm.2,8 In our case, the steady-state PL spectra of BaAl2O4:Eu2+ with the doping concentrations of 1 and 4 mol% demonstrate that, for each doping concentration, the dominant PL band is located at about 495 nm whilst the minor PL band is peaked at around 410 nm, as shown in Fig. 6(c) and (d). A comparison of the data reveals that the peak energies of the two PL bands of BaAl2O4:Eu2+ coincide with those of undoped BaAl2O4.
3.5. Afterglow spectrum and decay profile of undoped BaAl2O4
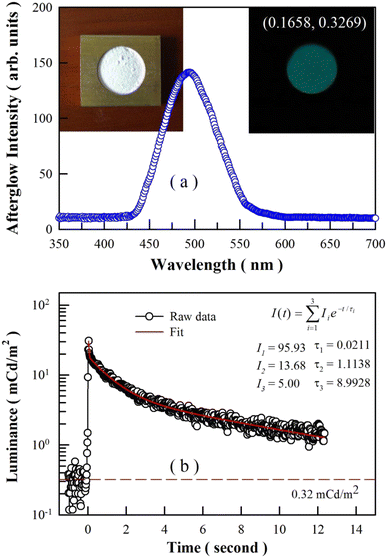
Undoped BaAl2O4 exhibits bluish-green afterglow after the ultraviolet excitation is ceased. The 3 min-long ultraviolet excitation is provided by a high-pressure mercury lamp. The afterglow last for about 20 s to naked eye in dark. The afterglow spectrum of BaAl2O4 is illustrated in Fig. 7(a). Clearly, this broadband afterglow spectrum is peaked at about 495 nm. Both the profile and the peak position of this afterglow spectrum are quite similar to those of BaAl2O4:Eu2+,Dy3+.2,5,6 The insets in Fig. 7(a) show the photograph of undoped BaAl2O4 under lab illumination (left) and the afterglow photograph of the undoped BaAl2O4 (right). With the chromaticity coordinates of (0.1658, 0.3269), the bluish-green afterglow of undoped BaAl2O4 confirms the fact that intrinsic defects in BaAl2O4 are the origin of the afterglow.The duration of afterglow is the time for which an afterglow material continues to glow after the cessation of excitation until its luminance drops to the threshold of 0.32 mcd m−2. Fig. 7(b) represents the afterglow decay of undoped BaAl2O4. As shown by the red solid line, the raw data in Fig. 7(b) are fitted to a tri-exponential function. Clearly, undoped BaAl2O4 has three different decay components with constants of τ1 = 0.0211 s, τ2 = 1.1138 s and τ3 = 8.9928 s, which suggests a set of traps are present in the phosphor. According to the tri-exponential function, it takes about 24.7 s for the afterglow of undoped BaAl2O4 to drop to 0.32 mcd m−2. Therefore, the afterglow duration of undoped BaAl2O4 is 24.7 s, which is very close to that estimated with naked eye in dark.
We compared the afterglow intensity of the undoped BaAl2O4 with those of Eu2+ doped BaAl2O4 (1 and 4 mol%) to see whether the afterglow intensity is independent on the doping level. For undoped BaAl2O4 without subsequent treatments, its afterglow intensity is about one tenth of those of Eu2+ doped BaAl2O4 (1 and 4 mol%). After annealing in oxygen poor environment, however, the afterglow intensity of undoped BaAl2O4 can be stronger than the afterglow intensity of Eu2+ doped BaAl2O4 (1 and 4 mol%). These data indicate that the afterglow intensities of both the undoped BaAl2O4 and Eu2+ doped BaAl2O4 (1 and 4 mol%) are independent on the doping level.
3.6. TL glow curve of undoped BaAl2O4
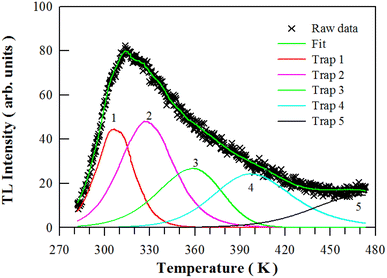
The TL glow curve of undoped BaAl2O4 is depicted in Fig. 8. Peaking at around 313.8 K (40.7 °C), this broad TL glow curve means that multiple trap levels are present in BaAl2O4.56 Rodrigues et al. and Lephoto et al. recorded the TL glow curves of BaAl2O4:Eu2+,Re3+ (Re = La, Ce, Pr, Nd, Sm, Dy, Gd, Tb, Er, Tm);2,4,50 Aizawa et al. recorded the TL glow curve of BaAl2O4:Eu2+,Dy3+ films,10 Pandey and Chithambo displayed the TL glow curve of electron irradiated BaAl2O4.57 Obviously, both the profile and peak temperature of undoped BaAl2O4 are different from those of BaAl2O4:Eu2+,Re3+ because traps are sensitive to a number of factors such as sample preparation details, doping and irradiation.Using a computer program given by Chung et al.,58 we can deconvolute this TL glow curve with general order kinetics. As shown in Fig. 8, this TL glow curve is deconvoluted by assuming 5 traps in BaAl2O4. The kinetic parameters, figure-of-merit (FOM), and the electron lifetime at room temperature are listed in Table 1. The trap depths of the five traps in BaAl2O4 are determined to be 0.8589, 0.6738, 0.5450, 0.7097 and 0.7419 eV, respectively.
| Tm (K) | E (eV) | s (s−1) | b | n0 (cm−3) | τ300 (h) | FOM (%) | |
|---|---|---|---|---|---|---|---|
| Trap 1 | 306.35 | 0.8589 | 4.051 × 10¹¹ | 1.694 | 4.175 × 10⁴ | 1.87 × 100 | 3.283 |
| Trap 2 | 326.25 | 0.6738 | 5.136 × 10⁷ | 1.747 | 6.659 × 10⁴ | 1.08 × 101 | |
| Trap 3 | 358.75 | 0.5450 | 7.399 × 10⁴ | 1.191 | 4.362 × 10⁴ | 1.36 × 101 | |
| Trap 4 | 396.75 | 0.7097 | 1.624 × 10⁶ | 2.000 | 5.137 × 10⁴ | 3.65 × 10⁴ | |
| Trap 5 | 472.05 | 0.7419 | 9.745 × 10⁴ | 2.000 | 4.163 × 10⁴ | 2.20 × 10⁶ |
3.7. Electronic structures of defective BaAl2O4
The bluish-green afterglow and the blue PL of undoped BaAl2O4 seem to originate from the oxygen and barium vacancies in BaAl2O4. Our recent work demonstrates that the meta generalized gradient approximation can be utilized as an efficient exchange–correlation functional to calculate the band structures and DOS of BaAl2O4.41 Fig. 9 represents the DFT calculated band structures and DOS of oxygen-deficient BaAl2O4: (a) the oxygen vacancy is the F2+ center; (b) the oxygen vacancy is the F+ center; and (c) the oxygen vacancy is the F0 center. The F2+, F+, and F0 centers are doubly, singly, and neutrally charged oxygen vacancies, respectively. Before scissor operations, the calculated bandgap values of the F2+ bearing BaAl2O4, F+ bearing BaAl2O4, and F0 bearing BaAl2O4 are 6.064, 5.8675, and 6.0662 eV, respectively. These values are about 6.0, 9.3, and 6.2% less than the experimental value of BaAl2O4 (6.47 eV). After scissor operations, the bandgap of each oxygen-deficient BaAl2O4 is adjusted to be 6.47 eV. Correspondingly, the defect energy level of F2+ is located at 3.13 eV above the valence band maximum (VBM), the defect energy level of F+ is located at 2.09 eV above VBM, and the defect energy levels of F0 are located at 0.30, 4.69, 5.48, 5.63, and 6.26 eV above VBM. These defect energy levels provide abundant paths for optical absorption and emissions of undoped BaAl2O4. For instance, Zhang et al. recorded strong optical absorption in the spectral range 200–2500 nm in oxygen-deficient BaAl2O4.59 Furthermore, both F+ and F2+ centers are able to trap electrons from surrounding environment because they are positively charged. Therefore, oxygen vacancies might work as electron traps for afterglow.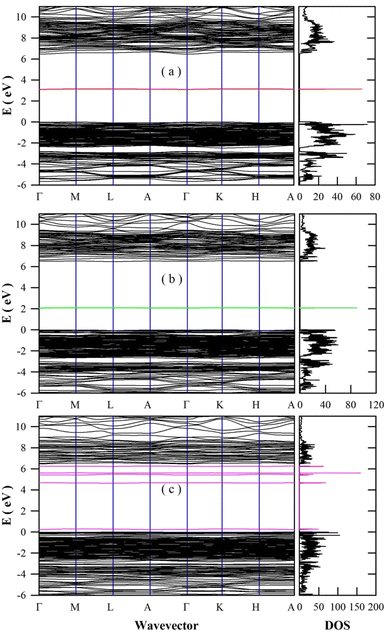 | ||
| Fig. 9 DFT calculated band structures and DOS of oxygen-deficient BaAl2O4: (a) the oxygen vacancy is F2+ center; (b) the oxygen vacancy is F+ center; and (c) the oxygen vacancy is F0 center. | ||
The band structures and DOS of barium-deficient BaAl2O4 are also calculated. The defect energy levels of barium vacancy are found to locate at about 0.50 eV above VBM. This barium vacancy carries two negative charges. Being negatively charged, these barium vacancies might work as hole traps. Such traps capture holes easily in the valence band because they are very close to VBM. In an analogous DFT study of SrAl2O4, the defect energy levels of Sr vacancies are within 1 eV above VBM or even lie below VBM.27 In another DFT study, McKenna et al. reported that the charge transition levels of hafnium vacancy in HfO2 are 0.76–1.67 eV above VBM.60
3.8. Afterglow origins of undoped BaAl2O4
Among the three kinds of F centers, the defect energy levels of F2+ center are suitable for the blue emissions of undoped BaAl2O4. In light of the defect energy levels of the F2+ center and the barium vacancy, the processes of photo-excitation (process ①), carrier relaxation (process ②), carrier trapping (process ③), carrier detrapping (process ⑥), and carrier recombination (process ④ and ⑤) are sketched in Fig. 10 for undoped BaAl2O4. Detailed interpretations on the processes are available elsewhere.19,20,22 Under the assumptions of the defect energy levels at EV + 3.11 eV (for F2+ center) and EV + 0.5 eV (for the barium vacancy), both the PL and the afterglow of undoped BaAl2O4 can be interpreted. If the mechanism in Fig. 10 sounds, we can expect that: (i) the PL spectrum of undoped BaAl2O4 would have one PL band peaking at about 3.13 eV (396 nm) and another PL band peaking at about 2.63 eV (472 nm); and (ii) the afterglow spectrum of undoped BaAl2O4 would be peaked at 2.63 eV (472 nm). Indeed, Fig. 6 verifies that the PL spectrum of undoped BaAl2O4 can be deconvoluted into a blue PL band centered at about 3.08 eV (402.6 nm) and a bluish-green PL band centered at 2.53 eV (490.1 nm). Furthermore, Fig. 7 confirms that the afterglow spectrum of undoped BaAl2O4 is peaked at about 2.51 eV (495 nm). The errors between the experimental and the expected data are related to the limited accuracy of the DFT calculations.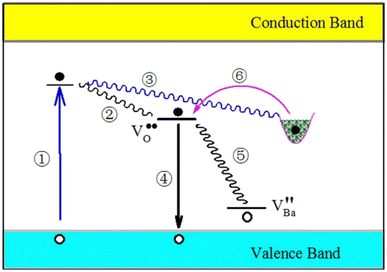 | ||
| Fig. 10 Schematic illustration of the PL and afterglow mechanisms of undoped BaAl2O4. Details on the processes are available elsewhere.19,20,22 | ||
As illustrated in Fig. 10, there are two radiative relaxation paths, which are represented by processes ④ and ⑤, respectively. The radiative relaxation process ⑤ is evidenced by the broadband bluish green afterglow of undoped BaAl2O4 peaking at about 495 nm (2.51 eV). Conversely, the radiative relaxation process ④ is not evident in the afterglow spectrum of undoped BaAl2O4 because of the absence of a blue emission band peaking at about 3.08 eV (402.6 nm). Theoretically speaking, a blue emission band peaking at about 400 nm should coexist with the bluish-green emission band in the afterglow spectrum of undoped BaAl2O4 if the afterglow mechanism illustrated in Fig. 10 is correct. As discussed in our previous work, a hole at the energy level of barium vacancy has a lower energy than a hole in the valence band, thus holes tend to fill the energy level of barium vacancy at a much higher probability than holes occupy the valence band, which renders the contribution of process ④ negligible when compared to the process ⑤. This should be the reason why the afterglow spectrum of BaAl2O4 exhibits the bluish-green emission band only, leaving the blue emission band absent. This work focuses mainly on the PL and afterglow features of undoped BaAl2O4. It suggests that the presented mechanism of afterglow caused by vacancies may be regarded as just one of the afterglow sources in BaAl2O4:Eu2+ and BaAl2O4:Eu2+,Re3+. In order to demonstrate without the doubt that Eu2+ is not an afterglow center in BaAl2O4:Eu2+ and BaAl2O4:Eu2+,Re3+, comprehensive studies are highly necessary. Further work on the afterglow mechanisms of BaAl2O4:Eu2+ and BaAl2O4:Eu2+,Re3+ is on the way.
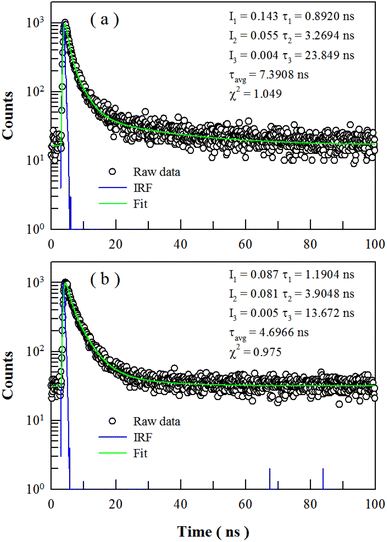
The 4f65d → 4f7 electric dipole transition of Eu2+ is parity-allowed, and the PL decay time of the transition in a large number of hosts is usually in the range from 0.2 to 2 μs. For example, the PL lifetime of BaAl2O4:Eu2+ was reported to be 0.9 μs at room temperature.61 Therefore, the PL lifetime of undoped BaAl2O4 can provide complementary evidence on the intrinsic defects related emissions for undoped BaAl2O4. Fig. 11 illustrates the PL decays of undoped BaAl2O4 (black open circles) and their exponential reconvolutions (green solid curve) when the detection wavelengths are fixed at 400 nm (a) and 495 nm (b), respectively. The excitation wavelength is 320 nm. The instrument response function (blue solid curve) is given for each decay curve. Both decay curves can be deconvoluted by a tri-exponential decay function. As listed in Fig. 11, the averaged lifetimes are 7.39 and 4.70 ns for the emissions at 400 and 495 nm, respectively. These PL lifetimes are far shorter than that of BaAl2O4:Eu2+, but are in line with those of the defect-related emissions in undoped SrAl2O4,19 undoped CaAl2O4,20 Eu2+ doped CaAl2O4,22 and a large number of other inorganic materials.29,42,53 The PL lifetimes in the order of a few nanoseconds reveal the nature of defect emissions of the two PL subbands of undoped BaAl2O4. In order to check whether undoped BaAl2O4 has longer PL lifetime, we have measured a series of PL decay curves of undoped BaAl2O4 by extending the pulsed period from 200 ns to 50 microsecond. PL lifetime longer than 10 ns, however, is not detected for undoped BaAl2O4. Alternatively, we measured a series of PL decay curves of Eu2+ doped BaAl2O4 (1.0 and 4.0 mol%) by extending the pulsed period from 50 ns to 50 microsecond. Analysis of the PL decay curves shows that PL lifetimes of Eu2+ doped BaAl2O4 (1.0 and 4.0 mol%) are less than 10 ns. It confirms that the PL lifetime of undoped BaAl2O4 is much shorter than 0.9 microsecond.
4. Conclusion
The afterglow and PL properties of sol–gel derived BaAl2O4 have been investigated. After excited by a high-pressure Hg lamp for 3 min, bluish-green afterglow of undoped BaAl2O4 is discernible to naked eye for about 20 s. The afterglow spectrum of the sol–gel derived BaAl2O4 has a broad profile with its peak at around 495 nm. The steady-state PL spectrum of the sol–gel derived BaAl2O4 can be deconvoluted into a bluish-green PL band centered at about 490.1 nm (2.53 eV) and a blue PL band centered at about 402.6 nm (3.08 eV). The TL glow curve reveals that a set of traps are present in undoped BaAl2O4. With their trap depths in the range of 0.5450–0.8589 eV. Defect energy levels of oxygen vacancies (i.e., F0, F+ and F2+) and doubly negatively charged calcium vacancy are derived via the DFT calculations. It is found that: (i) the defect energy level of F2+ center is located at 3.13 eV above VBM; (ii) the defect energy level introduced by the doubly negatively charged barium vacancy is about 0.5 eV above VBM; and (iii) the oxygen and calcium vacancies in undoped BaAl2O4 are the origin of the bluish-green afterglow and the blue PL of undoped BaAl2O4. Both the bluish-green afterglow and the blue PL of undoped BaAl2O4 can be interpreted in terms of defect energy levels introduced by the oxygen vacancy F2+ center and calcium vacancy. The recorded bluish-green afterglow of undoped BaAl2O4 is important to understand the afterglow mechanisms of rare-earth doped BaAl2O4.Author contributions
B.-G. Z. synthesized the materials and wrote the initial drafts. Y. M. H. designed the experiments and supervised this work. All authors have read and agreed to the published version of the manuscript.Conflicts of interest
There are no conflicts of interest to declare.Acknowledgements
Financial support from National Natural Science Foundation of China (no. 11574036) was acknowledged.References
- T. Matsuzawa, Y. Aoki, N. Takeuchi and Y. Murayama, A new long phosphorescent phosphor with high brightness, SrAl2O4:Eu2+,Dy3+, J. Electrochem. Soc., 1996, 143, 2670–2673 CrossRef CAS.
- L. C. V. Rodrigues, J. Hölsä, J. M. Carvalho, C. C. S. Pedroso, M. Lastusaari, M. C. F. C. Felinto, S. Watanabe and H. F. Brito, Co-dopant influence on the persistent luminescence of BaAl2O4:Eu2+,R3+, Phys. B, 2014, 439, 67–71 CrossRef CAS.
- D. B. Bem, F. B. Dejene, A. S. Luyt and H. C. Swart, Luminescence studies of a combustion-synthesized blue–green BaAlxOy:Eu2+,Dy3+ nanoparticles, Phys. B, 2012, 407, 1561–1565 CrossRef CAS.
- M. A. Lephoto, O. M. Ntwaeaborwa, S. S. Pitale, H. C. Swart, J. R. Botha and B. M. Mothudi, Synthesis and characterization of BaAl2O4:Eu2+ co-doped with different rare earth ions, Phys. B, 2012, 407, 1603–1606 CrossRef CAS.
- R. Sakai, T. Katsumata, S. Komuro and T. Morikawa, Effect of composition on the phosphorescence from BaAl2O4: Eu2+, Dy3+ crystals, J. Lumin., 1999, 85, 149–154 CrossRef CAS.
- M. Malkamaki, A. J. J. Bos, P. Dorenbos, M. Lastusaari, L. C. V. Rodrigues, H. C. Swart and J. Holsa, Persistent luminescence excitation spectroscopy of BaAl2O4:Eu2+,Dy3+, Phys. B, 2020, 593, 411947 CrossRef CAS.
- B. G. Zhai, Q. L. Ma, R. Xiong, X. Li and Y. M. Huang, Blue–green afterglow of BaAl2O4:Dy3+ phosphors, Mater. Res. Bull., 2016, 75, 1–6 CrossRef CAS.
- R. Stefani, L. C. V. Rodrigues, C. A. A. Carvalho, M. C. F. C. Felinto, H. F. Brito, M. Lastusaari and J. Hölsä, Persistent luminescence of Eu2+ and Dy3+ doped barium aluminate (BaAl2O4:Eu2+,Dy3+) materials, Opt. Mater., 2009, 31, 1815–1818 CrossRef CAS.
- H.-S. Roh, I.-S. Cho, J.-S. An, C. M. Cho, T. H. Noh, D. K. Yim, D.-W. Kim and K. S. Hong, Enhanced photoluminescence property of Dy3+ co-doped BaAl2O4:Eu2+ green phosphors, Ceram. Int., 2012, 38, 443–447 CrossRef CAS.
- H. Aizawa, S. Komuro, T. Katsumata, S. Sato and T. Morikawa, Long afterglow phosphorescent characteristics of BaAl2O4:Eu,Dy films, Thin Solid Films, 2006, 496, 179–182 CrossRef CAS.
- D. den Engelsen, G. R. Fern, T. G. Ireland, F. Yang and J. Silver, Photoluminescence and cathodoluminescence of BaAl2O4:Eu2+ and undoped BaAl2O4: evidence for F-centres, Opt. Mater. Express, 2020, 10, 1962–1980 CrossRef.
- M. Ziyauddin, N. Brahme and A. K. Shrivastava, Luminescence properties of BaAl2O4:Eu2+ phosphors, Int. Res. J. Eng. Technol., 2018, 5, 3656–3660 Search PubMed.
- F. B. Dejene and M. A. Kebede, Synthesis and characterization of structural and luminescence properties of blue-green BaAlxOy:Eu2+ phosphor by solution – combustion method, Cent. Eur. J. Phys., 2012, 10, 977–982 CAS.
- V. Ponnusamy, A. Azhagiri, R. Satheesh Kumar and M. T. Jose, Synthesis and role of co-dopants (alkaline earth divalents and halides) on the photoluminescence of Eu2+ doped BaAl2O4 phosphor, Adv. Mater. Lett., 2019, 10, 341–345 CrossRef CAS.
- Y. Li, M. Gecevicius and J. Qiu, Long persistent phosphors-from fundamentals to applications, Chem. Soc. Rev., 2016, 45, 2090 RSC.
- T. Aitasalo, P. Dereń, J. Hölsä, H. Jungner, J. C. Krupa, M. Lastusaari, J. Legendziewicz, J. Niittykoski and W. J. Stręk, Persistent luminescence phenomena in materials doped with rare earth ions, J. Solid State Chem., 2003, 171, 114–122 CrossRef CAS.
- P. Dorenbos, Mechanism of persistent luminescence in Eu2+ and Dy3+ codoped aluminate and silicate compounds, J. Electrochem. Soc., 2005, 152, H107–H110 CrossRef CAS.
- F. Clabau, X. Rocquefelte, S. Jobic, P. Deniard, M. H. Whangbo, A. Garcia and T. Le Mercier, Mechanism of phosphorescence appropriate for the long-lasting phosphors Eu2+-doped SrAl2O4 with codopants Dy3+ and B3+, Chem. Mater., 2005, 17, 3904–3912 CrossRef CAS.
- B. G. Zhai and Y. M. Huang, Green afterglow of undoped SrAl2O4, Nanomater., 2021, 11, 2331 CrossRef CAS.
- B. G. Zhai and Y. M. Huang, Blue afterglow of undoped CaAl2O4 nanocrystals, Europhys. Lett., 2019, 127, 17001 CrossRef CAS.
- B. G. Zhai, H. Xu, F. Zhuo and Y. M. Huang, Annealing temperature dependent photoluminescence and afterglow of undoped CaAl2O4, J. Alloys Compd., 2020, 821, 153563 CrossRef CAS.
- B. G. Zhai and Y. M. Huang, Doping concentration dependent photoluminescence and afterglow of Eu2+ doped CaAl2O4 for insight into the afterglow mechanisms, Phys. B, 2022, 646, 414284 CrossRef CAS.
- Y. M. Huang and Q. L. Ma, Long afterglow of trivalent dysprosium doped strontium aluminate, J. Lumin., 2015, 160, 271–275 CrossRef CAS.
- B. G. Zhai, L. Yang, Q. L. Ma, X. Liu and Y. M. Huang, Mechanism of the prolongation of the green afterglow of SrAl2O4:Dy3+ caused by the use of H3BO3 flux, J. Lumin., 2017, 181, 78–87 CrossRef CAS.
- Q. L. Ma, B. G. Zhai and Y. M. Huang, Effect of sol-gel combustion temperature on the luminescent properties of trivalent Dy doped SrAl2O4, Ceram. Int., 2015, 41, 5830–5835 CrossRef CAS.
- B. G. Zhai and Y. M. Huang, Green photoluminescence and afterglow of Tb doped SrAl2O4, J. Mater. Sci., 2017, 52, 1813–1822 CrossRef CAS.
- E. Finley, A. M. Tehrani and J. Brgoch, Intrinsic defects drive persistent luminescence in monoclinic SrAl2O4:Eu2+, J. Phys. Chem. C, 2018, 122, 16309–16314 CrossRef CAS.
- D. A. Pejakovic, Studies of the phosphorescence of polycrystalline hafnia, J. Lumin., 2010, 130, 1048–1054 CrossRef CAS.
- B. G. Zhai, H. Xu, Q. Zhang and Y. M. Huang, Blue photoluminescence and cyan-colored afterglow of undoped SrSO4 nanoplates, ACS Omega, 2021, 6, 10129–10140 CrossRef CAS PubMed.
- Z. Zhou, K. Jiang, N. Chen, Z. Xie, B. Lei, J. Zhuang, X. Zhang, Y. Liu and C. Hu, Room temperature long afterglow from boron oxide: A boric acid calcined product, Mater. Lett., 2020, 276, 128226 CrossRef CAS.
- K. Iwasaki, Y. Takahashi, N. Terakado, N. Onoue, T. Shinozaki and T. Fujiwa, Prominent long-lasting photoluminescence in defect-activated zirconia: A rare-earth free and accessible phosphor, Ceram. Int., 2018, 44, 12929–12933 CrossRef CAS.
- B. G. Zhai, H. Xu and Y. M. Huang, Annealing temperature dependent afterglow of Tb3+ doped CaAl2O4, Opt. Mater., 2021, 112, 110739 CrossRef CAS.
- B. G. Zhai and Y. M. Huang, Extending the afterglow of Tb3+ doped CaAl2O4 to 8 hours via the control of doping concentration, J. Lumin., 2022, 244, 118725 CrossRef CAS.
- B. G. Zhai, L. Yang, F. F. Zhou, J. S. Shi and Y. M. Huang, Strong photo-oxidative capability of ZnWO4 nanoplates with highly exposed {0-11} facets, Catalysts, 2019, 9, 178 CrossRef.
- Y. M. Huang, M. Y. Li, L. Yang and B. G. Zhai, Eu2+ and Eu3+ doubly doped ZnWO4 nanoplates with superior photocatalytic performance for dye degradation, Nanomater., 2018, 8, 765 CrossRef PubMed.
- N. Yamashita, T. Hamada, M. Takada, M. Katsuki and M. Nakagawa, Photoluminescence and thermoluminescence of MgSO4, CaSO4, SrSO4 and BaSO4 powder phosphors activated with Tb3+, Jpn. J. Appl. Phys., 2001, 40, 6732–6736 CrossRef CAS.
- B. G. Zhai, M. M. Chen and Y. M. Huang, Photoluminescence and afterglow of Dy3+ doped CaAl2O4 derived via sol–gel combustion, RSC Adv., 2022, 12, 31757 RSC.
- A. D. Becke and E. R. Johnson, A simple effective potential for exchange, J. Chem. Phys., 2006, 124, 221101–221104 CrossRef PubMed.
- F. Tran and P. Blaha, Accurate band gaps of semiconductors and insulators with a semilocal exchange-correlation potential, Phys. Rev. Lett., 2009, 102, 226401 CrossRef PubMed.
- D. Koller, F. Tran and P. Blaha, Merits and limits of the modified Becke-Johnson exchange potential, Phys. Rev. B: Condens. Matter Mater. Phys., 2011, 83, 195134 CrossRef.
- B. G. Zhai and Y. M. Huang, First-principles calculations of hexagonal BaAl2O4, Solid State Commun., 2023, 362, 115101 CrossRef CAS.
- B. G. Zhai, L. Yang, Q. L. Ma and Y. M. Huang, Visible light driven photocatalytic activity of Fe-doped ZnO nanocrystals, Funct. Mater. Lett., 2017, 10, 1750002 CrossRef CAS.
- L. L. Chen, B. G. Zhai and Y. M. Huang, Rendering visible-light photocatalytic activity to undoped ZnO via intrinsic defects engineering, Catalysts, 2020, 10, 1163 CrossRef CAS.
- R. Chatterjee, S. Saha, K. Panigrahi, U. K. Ghorai, G. C. Das and K. K. Chattopadhyay, Blue emitting BaAl2O4:Ce3+ nanophosphors with high color purity and brightness for white LEDs, Microsc. Microanal., 2019, 25, 1466–1470 CrossRef CAS PubMed.
- J. Mooney and P. Kambhampati, Get the basics right: Jacobian conversion of wavelength and energy scales for quantitative analysis of emission spectra, J. Phys. Chem. Lett., 2013, 4, 3316–3318 CrossRef CAS.
- V. Chernov, T. M. Piters, R. Ruiz-Torres, P. Salas-Castillo, N. J. Zuñiga-Rivera, R. Meléndrez and M. Barboza-Flores, Effect of reducing and oxidizing atmosphere on photoluminescence of undoped and Eu doped nanostructured CaAl2O4, J. Lumin., 2022, 251, 119196 CrossRef CAS.
- Q. L. Ma, R. Xiong and Y. M. Huang, Tunable photoluminescence of porous silicon by liquid crystal infiltration, J. Lumin., 2011, 131, 2053–2057 CrossRef CAS.
- Q. L. Ma, B. G. Zhai and Y. M. Huang, Sol–gel derived ZnO/porous silicon composites for tunable photoluminescence, J. Sol-Gel Sci. Technol., 2012, 64, 110–116 CrossRef CAS.
- B. G. Zhai, Q. L. Ma, L. Yang and Y. M. Huang, Synthesis and optical properties of Tb-doped pentazinc dimolybdate pentahydrate, Results Phys., 2017, 7, 3991–4000 CrossRef.
- L. C. V. Rodrigues, R. Stefani, H. F. Brito, M. C. F. C. Felinto, J. Holsa, M. Lastusaari, T. Laamanen and M. Malkamaki, Thermoluminescence and synchrotron radiation studies on the persistent luminescence of BaAl2O4:Eu2+,Dy3+, J. Solid State Chem., 2010, 183, 2365–2371 CrossRef CAS.
- B. G. Zhai, D. Liu, Y. He, L. Yang and Y. M. Huang, Tuning the photoluminescence of Eu2+ and Eu3+ co-doped SrSO4 through post annealing technique, J. Lumin., 2018, 194, 485–493 CrossRef CAS.
- V. A. Gritsenko, D. R. Islamov, T. V. Perevalov, V. Sh. Aliev, A. P. Yelisseyev, E. E. Lomonova, V. A. Pustovarov and A. Chin, Oxygen vacancy in hafnia as a blue luminescence center and a trap of charge carriers, J. Phys. Chem. C, 2016, 120, 19980–19986 CrossRef CAS.
- B. G. Zhai, L. Yang and Y. M. Huang, Intrinsic defect engineering in Eu3+ doped ZnWO4 for annealing temperature tunable photoluminescence, Nanomater., 2019, 9, 99 CrossRef PubMed.
- B. G. Zhai, L. Yang, Q. L. Ma and Y. M. Huang, Growth of ZnMoO4 nanowires via vapor deposition in air, Mater. Lett., 2017, 188, 119–122 CrossRef CAS.
- B. G. Zhai, Q. L. Ma, L. Yang and Y. M. Huang, Effects of sintering temperature on the morphology and photoluminescence of Eu3+ doped zinc molybdenum oxide hydrate, J. Nanomater., 2018, 2018, 7418508 Search PubMed.
- R. K. Gartia and M. N. Singh, Deconvolution of thermoluminescence curves and its implications: The case of CaAl2O4:Sm3+, Optik, 2021, 248, 168048 CrossRef CAS.
- A. Pandey and M. L. Chithambo, Thermoluminescence of the persistent-luminescence phosphor, BaAl2O4; A stuffed tridymite, Radiat. Meas., 2018, 120, 73–77 CrossRef CAS.
- K. S. Chung, J. I. Lee and J. L. Kim, A computer program for the deconvolution of the thermoluminescence glow curves by employing the interactive trap model, Radiat. Meas., 2012, 47, 766–769 CrossRef CAS.
- L.-W. Zhang, L. Wang and Y.-F. Zhu, Synthesis and performance of BaAl2O4 with a wide spectral range of optical absorption, Adv. Funct. Mater., 2007, 17, 3781–3790 CrossRef CAS.
- K. P. McKenna and D. M. Ramo, Electronic and magnetic properties of the cation vacancy defect in m-HfO2, Phys. Rev. B: Condens. Matter Mater. Phys., 2015, 92, 205124 CrossRef.
- S. H. M. Poort, A. Meyerink and G. Blasse, Lifetime measurements in Eu2+-doped host lattices, J. Phys. Chem. Solids, 1997, 58, 1451–1456 CrossRef CAS.
| This journal is © The Royal Society of Chemistry 2023 |

