
 Open Access Article
 This Open Access Article is licensed under a
 Creative Commons Attribution 3.0 Unported Licence
ZnGa2−xAlxO4 (x = 0 ≤ 2) spinel for persistent light emission and HER/OER bi-functional catalysis†
Reshmi Thekke Parayilab,
Santosh K. Gupta *ab,
Manodip Palc,
Arnab Dutta*cd,
Deepak Tyagie,
Kathi Sudarshanab and
Manoj Mohapatraab
*ab,
Manodip Palc,
Arnab Dutta*cd,
Deepak Tyagie,
Kathi Sudarshanab and
Manoj Mohapatraab
aRadiochemistry Division, Bhabha Atomic Research Centre, Trombay, Mumbai 400085, India. E-mail: santoshg@barc.gov.in
bHomi Bhabha National Institute, Anushaktinagar, Mumbai 400094, India
cChemistry Department, Indian Institute of Technology Bombay, Powai, Mumbai, 400076, India. E-mail: arnab.dutta@iitb.ac.in
dInterdisciplinary Program in Climate Studies, Indian Institute of Technology Bombay, Powai, Mumbai, 400076, India
eChemistry Division, Bhabha Atomic Research Centre, Trombay, Mumbai 400085, India
First published on 24th October 2023
Abstract
Spinel materials have demonstrated diverse applications in various fields, especially in the energy sector. Since the pure spinel structure has the limitations of poor inherent activity and low conductivity, defect engineering through octahedral B-site modulation is expected to enhance various properties. Here in this work, we have synthesized ZnGa2−xAlxO4 (x = 0 ≤ 2) spinel and moved from one terminal (ZnGa2O4) to the other (ZnAl2O4) by varying the Ga/Al ratio using solvent-free solid-state reaction. Dopant and rare earth element-free (RE) ZnGa2O4 spinel showed excellent blue luminescence with photoluminescent quantum yields (PLQY) of 13% while exhibiting persistent light emission close to 60 min. The Al3+ incorporation at Ga3+ site doesn't yield any improvement in persistent luminescence lifetime owing to quenching of shallow traps as suggested by thermoluminescence (TL) studies. Moreover our materials have demonstrated bifunctional electrocatalytic activity towards both oxygen evolution (OER) and hydrogen evolution reaction (HER) which has never been reported for ZnGa2−xAlxO4. X-ray photoelectron spectroscopy (XPS) and positron annihilation lifetime spectroscopy (PALS) suggested that mixed Al/Ga-containing spinels possessed enhanced oxygen vacancies/defects. This makes them better electrocatalyst towards OER and HER compare to ZnGa2O4 and ZnAl2O4. The ZnGa1.75Al0.25O4 composition by virtue of enhanced oxygen vacancies and less charge transfer resistance (47.3 ohms) demonstrated best electrocatalytic activity for OER compared to the other synthesized catalysts at the same applied potential (1.6 V). On the other hand, the ZnGa1Al1O4 composition demonstrated excellent faradaic efficiency of ∼ 90% towards HER. From this work we can achieve multifunctional applications towards optoelectronics and electrocatalysis just by modulating Al/Ga ratio in ZnGa2−xAlxO4.
1. Introduction
A multifunctional material can be a boon towards a sustainable and developing economy, particularly in the area of energy, health, and environment.1,2 The two most important priorities in the area of the energy sector are designing an (a) inexpensive and efficient persistent luminescent materials and (b) efficient electrocatalysts for green hydrogen generation.3,4 Moreover, such a development will be pragmatic if it can be achieved without any involvement of rare earth elements and noble metals (e.g., Pt, Ir or Ru).For the development of a carbon-neutral society, the use of hydrogen as a fuel is inevitable since it produces benign water vapor and heat as byproducts. Currently, majority of the hydrogen production is executed by following steam methane reformation and coal gasification. However, these processes produce a copious amount of undesirable CO2.5,6 In this context, green hydrogen production via electrolysis emerges as a reliable carbon footprint-free technology.7 The electrochemical process typically has a high activation energy barrier for the reaction, where the presence of an electrocatalyst becomes essential to enhance the overall electrocatalytic energy efficiency.
The water-splitting process involves two reactions: hydrogen evolution reaction (HER) at the cathode and oxygen evolution reaction (OER) at the anode. The relative energies of chemical adsorption of H-atoms on the electrode surface and their subsequent electrochemical or chemical desorption regulates the electrocatalytic HER.8 The OER reaction is kinetically a sluggish reaction that proceeds via 4-electron transfer.9 Pt/C and Ru/IrO2 are considered as the benchmark electrocatalytic material for HER and OER, respectively.10 As large-scale productions of these materials are not suitable owing to their expensive and rare nature, the scientific community is actively exploring other abundant and low-cost electrocatalysts. Spinel oxides have been a popular choice in this regard due to their stable structure, adjustable valency, environmental safety and low cost.11 Spinel is an important class of compounds having the formula AB2O4 where A and B are divalent and trivalent cations, respectively. The spinel can be either normal or inverse depending upon the arrangement of A or B cations in the tetrahedral or octahedral site. For a normal spinel structure, A2+ occupies the tetrahedral whereas B3+ occupies the octahedral site. In the inverse spinel structure half of the B3+ ions occupy the tetrahedral and half of them occupy octahedral site, and A2+ ions cover the octahedral site.12 But pure spinel is not a good candidate for catalysis owing to their many limitations, such as poor inherent activity and low conductivity.13 So the defect engineering plays a crucial role in modulating the catalytic activity of spinels.
Defect engineering is one of the booming areas and a promising field for material chemists to synthesize various materials with enhanced catalytic, electrical, thermal, magnetic, and optical properties.14–17 This area is acquiring more importance recently due to its many applications in the various technological fields in the area of phosphors,18 scintillator,19 batteries,20 energy storage,21 electrocatalysis,16,17,22 thermoelectricity,23 and photocatalysis.24 The defects may be cationic vacancy, anionic vacancy (oxygen vacancy), and vacancy associates.25 There are many strategies employed for defect creation, which include aliovalent doping, annealing in a reduced atmosphere, electrochemical reduction, plasma irradiation, and amorphization.26,27
Persistent luminescence is a phenomenon in which the luminescence persists for a longer time, even after the stoppage of excitation. This phenomenon has many applications in fields like bioimaging, cancer therapy, night vision materials, and anti-counterfeiting.28 Traps play a vital role in persistent luminescence since these are the centers for storing the excitation energy, which is then transferred to emission center to initiate emission.29 The persistent intensity, as well as the emission time, depends on the trap structure and trap depth that is directly linked to lattice defects.30,31 This unique feature of the spinels was utilized in designing bright and long duration persistent light emitting materials (PLEMs).19,28,32 The tactical addition of dopant ions is primarily applied to invoke significant lattice distortion and strain, which affects the light emitting properties of the phosphor. Furthermore, there are lots of studies on the afterglow materials which employ rare earth (RE) ions that are not only expensive but also associated with health hazards. Proper processing of original RE ions is also very laborious and expensive, which are available only in limited geographical locations.33,34 In this context, RE-free materials delivering photo and persistent luminescence could be a great addition to a cost-effective phosphor library.
Here, we have explored the possibility of deploying the spinel template for invoking multifunctionality, lighting, and catalysis. We have probed pure spinels along with doped derivatives where Al3+ ions are incorporated at Ga3+ sites of the ZnGa2O4 spinel. The present work comprises synthesizing a series of samples starting from ZnGa2O4 to ZnAl2O4 by modulating Ga/Al ratio, and probing their luminescence and electrocatalytic properties. Since the octahedral B site is susceptible to easy modulation and leads to intriguing properties, it is expected to see similar changes in both luminescence and electrocatalytic studies. The synthesized materials were characterized by using powder X-ray diffraction (XRD), Fourier transform infrared spectroscopy (FTIR), and Raman spectroscopy. For determining the Ga/Al ratio, EDAX has been performed. In order to explore the emission as well as persistent luminescence characteristics with different Ga/Al ratios, photoluminescence (PL) was also carried out. The defect-related studies have been correlated using X-ray photoelectron spectroscopy (XPS), thermoluminescence (TL) and positron annihilation lifetime spectroscopy (PALS). Electrocatalytic activity, which includes both HER and OER of all materials, has also been performed.
2. Experimental
2.1. Synthesis
The spinel ZnGa2−xAlxO4 (x = 0 ≤ 2) were synthesized by conventional solid state reaction route. The precursors used are ZnO of SPEX Pure (99.999%), Al2O3 from Alfa Aesar (99.95%) and Ga2O3 of SPEX Pure (99.999%). Then in order to prepare the series of samples with different Ga/Al ratio the required amount of the precursors were weighed and grinded in a mortar and pestle for the complete mixing of precursors. Then it is calcined at 900 °C for 15 h with ramp temperature of 10 °C per minute in a tubular furnace. It was allowed to cool to room temperature followed by re-grinding. The second stage heating included sintering at 1200 °C for 15 h. The final grinding was carried out for 30 minutes to obtain the phase pure spinel compound. The schematic of the same has been shown in Fig. S1.†2.2. Instrumentation
To evaluate the phase purity of the synthesized material XRD has been carried out by using a benchtop proto X-ray diffractometer equipped with the monochromatic X-ray source as Cu Kα (1.5405 Å). The XRD pattern recorded with a 2θ range from 15 to 80° with a scan rate of 2° min−1. All the measurements were done at an accelerating voltage of 30 kV and tube current at 20 mA. FTIR spectra were recorded on a Bruker Alpha FTIR spectrometer in pellet mode by making the pellet with KBr crystals. Raman spectral studies are carried out using a micro-Raman spectrometer (STR-300, SEKI Technotron, Japan). A 532 nm CW diode pumped solid state laser (DPSS, gem 532, laser quantum) is used as an excitation source. The spectrograph is calibrated using the 520.5 cm−1 line from silicon wafer. SEM-EDX analysis has done on a Tescan VEGA MV 2300 T SEM-EDS instrument. Photo physical studies have been carried out using Edinburg make fluorescence instrument of series FLS 1000 in which xenon lamp is the source. All thermoluminescence measurements are done using a commercial Risø TL/OSL-DA-20 reader. The XPS measurements were carried out on a SPECS instrument with a PHOBIOS 100/150 delay line detector (DLD). PALS measurements were carried out under ambient conditions where Na-22 encapsulated in 8 micron polyimide films was immersed in the powder sample. The resolution of the positron lifetime spectrometer was 185 ps. The spectra were analyzed using PALSFit software35 taking into account the resolution of the spectrometer and fraction of positrons annihilating in the polyimide films. Scanning Electron Microscopy (SEM) has been carried out on a SNE4500 Mini SEM instrument. All the ICP-AES analyses were carried out using a Spectro-Arcos SOP Unit, Ametek, Germany. The spectrometer is augmented with a detector set consisting of thermally stabilized linear arrays of CCD detectors (3648 pixels per array). High purity argon was used as the plasma gas, carrier gas and auxiliary gas as well. The non-LTE plasma was sustained with a constant RF supply of 40 MHz and 1.3 kW of forward power. To establish the standardization, four point calibration curves were established using 1, 10, 100 and 500 ppm of multi elemental standards which were prepared from the stock of Merck-IV ICP solution standard. All measurements were done in triplicate. High pure Ar gas (total flow rate of 15 liters per minute) was also used for flushing of the detector before all the measurements to minimize the background. All the electrochemical characterizations were performed using Metrohm Auto Lab PGSTAT 201 potentiostat with three electrode systems at room temperature (298 K). The pH of the electrolyte used was adjusted using ORION STAR A111 pH Meter (Thermo Scientific) or LMPH-9 (Labman Scientific). A spiral platinum electrode (Pt) and silver chloride electrode (Ag/AgCl in 3 M KCl) were taken as the counter and reference electrodes, respectively.3. Results and discussions
3.1. Phase, vibrational spectroscopy and elemental analysis
Fig. 1a shows the XRD pattern of the synthesized samples. The pattern matches with the standard pattern of both ZnGa2O4 and ZnAl2O4 with JCPDS no. 00-038-1240 and 01-070-8182, respectively which implies the formation of phase pure material. There are no peaks of the starting precursors used. The major diffraction peaks of ZnGa2O4 are present at 2θ values of 18.7, 30.6, 36.0, 37.6, 43.7, 54.1, 57.7, 63.3, 71.8, 74.9 and 75.9 corresponding to (311), (220), (111), (222), (400), (422), (511), (440), (620), (533) and (622) crystal planes respectively. Likewise, for ZnAl2O4 the 2θ values are at 31.3, 36.9, 44.8, 49.1, 55.7, 59.4, 65.3, 74.1 and 77.3 corresponding to (220), (311), (400), (331), (422), (511), (440), (620) and (533) planes respectively. On increasing the Al ratio in the spinel, a shift in the diffraction peaks to higher angle is observed suggesting that there is a decrease in the d-spacing.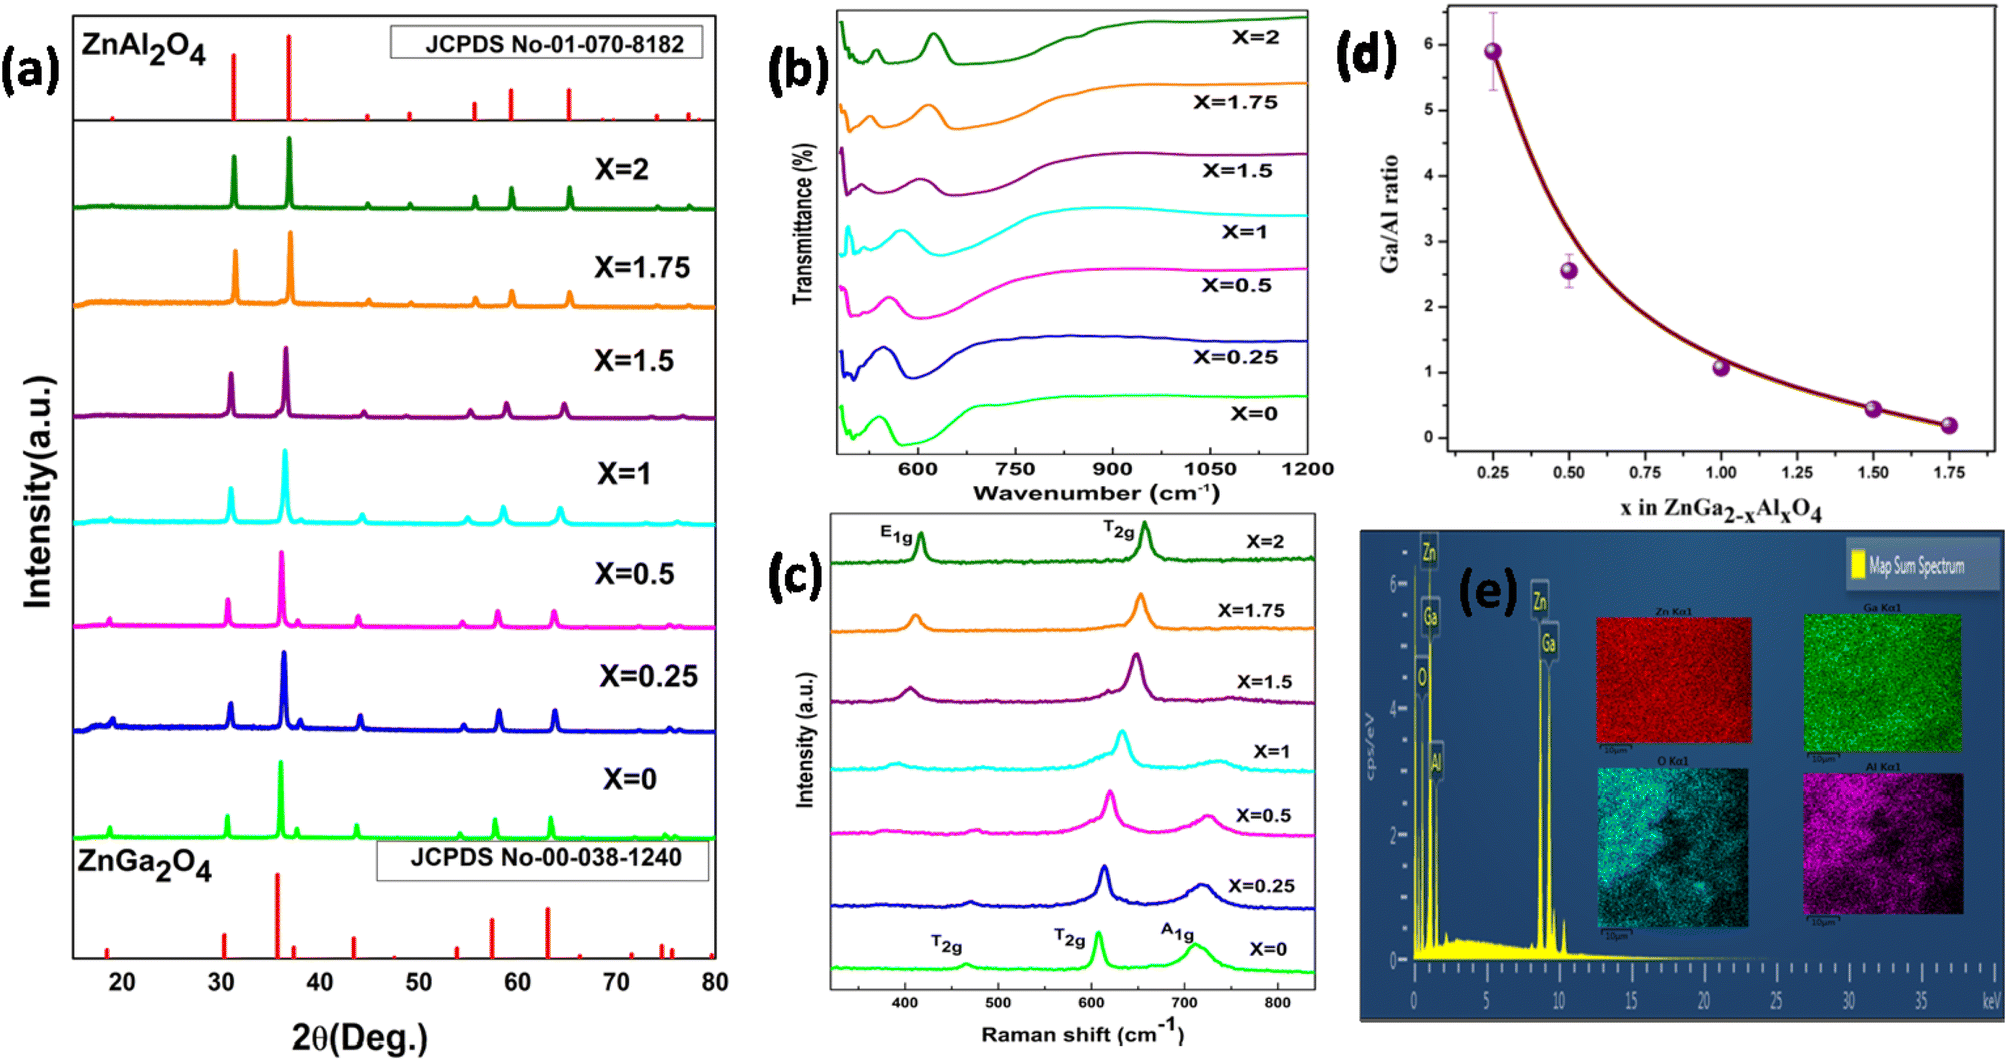 | ||
| Fig. 1 (a) Powder XRD pattern (b) FTIR spectra (c) Raman spectra of ZnGa2−xAlxO4 (x = 0, 0.25, 0.5, 1, 1.5, 1.75, 2) (d) Plot of Ga/Al ratio of ZnGa2−xAlxO4 (x = 0, 0.25, 0.5, 1, 1.5, 1.75, 2) and (e) element mapping results of O, Al, Ga, and Zn elements in the ZnGa1Al1O4. | ||
The FTIR spectrum is shown in Fig. 1b. In the spinel system the Al might coordinate to oxygen in two different ways, either it coordinates to 4 oxygen atoms (AlO4) forming a tetrahedral network or it can coordinate to 6 oxygen atoms (AlO6) forming an octahedron network. There are mainly 3 absorption peaks in the FTIR spectrum of ZnAl2O4; they are at 663, 554 and 515 cm−1 which represents the symmetric stretching vibration of Al–O bond, symmetric bending vibration of Al–O bond and asymmetric stretching vibration of Al–O bond respectively. Along with these peaks there is also a shoulder peak at 849 cm−1 which is due to the stretching vibration of Al–O bond in the AlO4 unit. This implies that some of the Al is occupying as AlO4 unit also,36,37 whereas in the FTIR spectrum of ZnGa2O4, there are mainly 2 peaks at 580 and 498 which represents the vibration of Ga–O–Zn and Zn–O bond.38 On moving from zinc gallate to zinc aluminate, evolution of new vibrational peak above 600 cm−1 is observed which represents the symmetric stretching of Al–O bond.
Fig. 1c represents the Raman spectra of synthesized samples [ZnGa2−xAlxO4 (x = 0 ≤ 2)]. According to group theory, ZnGa2O4 and ZnAl2O4 are expected to possess 5 Raman active modes (A1g + Eg + 3T2g). These 5 modes are known as first order Raman active modes which are basically due to the motion of the Zn2+ in the tetrahedral site and not due to the motion of Ga3+ in the octahedral site. The Raman spectra of ZnGa2O4 show mainly three peaks at 466, 608 and 711 cm−1 which are two T2g and A1g modes respectively.38 The Raman spectra of ZnAl2O4 contains mainly 2 Raman peaks at 418 and 657 cm−1 which represents the E1g and T2g modes which correspond to asymmetric bending motion of oxygen in tetrahedral and octahedral site respectively. Due to the high intensity of E1g and T2g modes, other modes are not visible here.39 The intermittent compositions wherein x < 1 display the feature typical of ZnGa2O4 where as the one wherein x ≥ 1 are on line with spectra of ZnAl2O4.
The Ga/Al ratio has been calculated from the counts obtained in the EDAX spectra which have been given in Table 1 and the pictorial representation of the same can be seen in the Fig. 1d. In the elemental mapping results of one of the representative spinels ZnGa1Al1O4 (Fig. 1e), homogeneous distribution of all the elements could be clearly seen. Fig. S2† represents the EDAX mapping of all the other samples, which gives the information on elemental compositions. It shows the uniform distribution of elements throughout the sample. The elemental compositional analysis of the representative samples ZnGa2O4, ZnGa1Al1O4 and ZnAl2O4 has done by using ICP-AES. The procedure and the results are shown in ESI (Table S1).†
| Sample | Atomic% | Ga/Al ratio |
|---|---|---|
| ZnGa1.75Al0.25O4 | Ga – 20.92 | 5.9 |
| Al – 3.55 | ||
| ZnGa1.5Al0.5O4 | Ga – 16.96 | 2.55 |
| Al – 6.66 | ||
| ZnGa1Al1O4 | Ga – 13.63 | 1.07 |
| Al – 12.74 | ||
| ZnGa0.5Al1.5O4 | Ga – 8.41 | 0.438 |
| Al – 19.22 | ||
| ZnGa0.25Al1.75O4 | Ga – 4.21 | 0.19 |
| Al – 22.02 |
3.2. Defect characterization: XPS and PALS
The survey scans of the representative samples (ZnGa2O4, ZnGa1Al1O4 and ZnAl2O4) are shown in Fig. S3† which confirms the surface composition of the materials. Fig. 2a represents the XPS core level spectra of oxygen which is deconvoluted into 2 peaks. The one with lower binding energy (∼529–530 eV, red curve) corresponds to the lattice oxygen and the other with higher binding energy (∼531 eV, green curve) corresponds to the oxygen vacancy.40 The atomic percentage of oxygen vacancies in different spinel phases are listed in Table 2. It can be seen that the highest concentration of oxygen vacancy is present in ZnGa1.75Al0.25O4. The core level XPS spectra of Zn, Al, Ga of the representative samples ZnGa2O4, ZnGa1Al1O4 and ZnAl2O4 are also shown in Fig. S4.† The two characteristic peaks of Zn 2p are located at 1021.8 and 1044.8 eV which corresponds to a peak spacing of 23 eV that is characteristic for divalent Zn ion (Zn2+). In Ga 2p XPS spectra the two characteristic peaks are located at 1115.8 and 1142.7 eV with peak spacing of 26.9 eV which corresponds to trivalent gallium ion (Ga3+).41 For Al 2p there is only one XPS peak at ∼74 eV which represents the Al3+ in AlO6 octahedra.42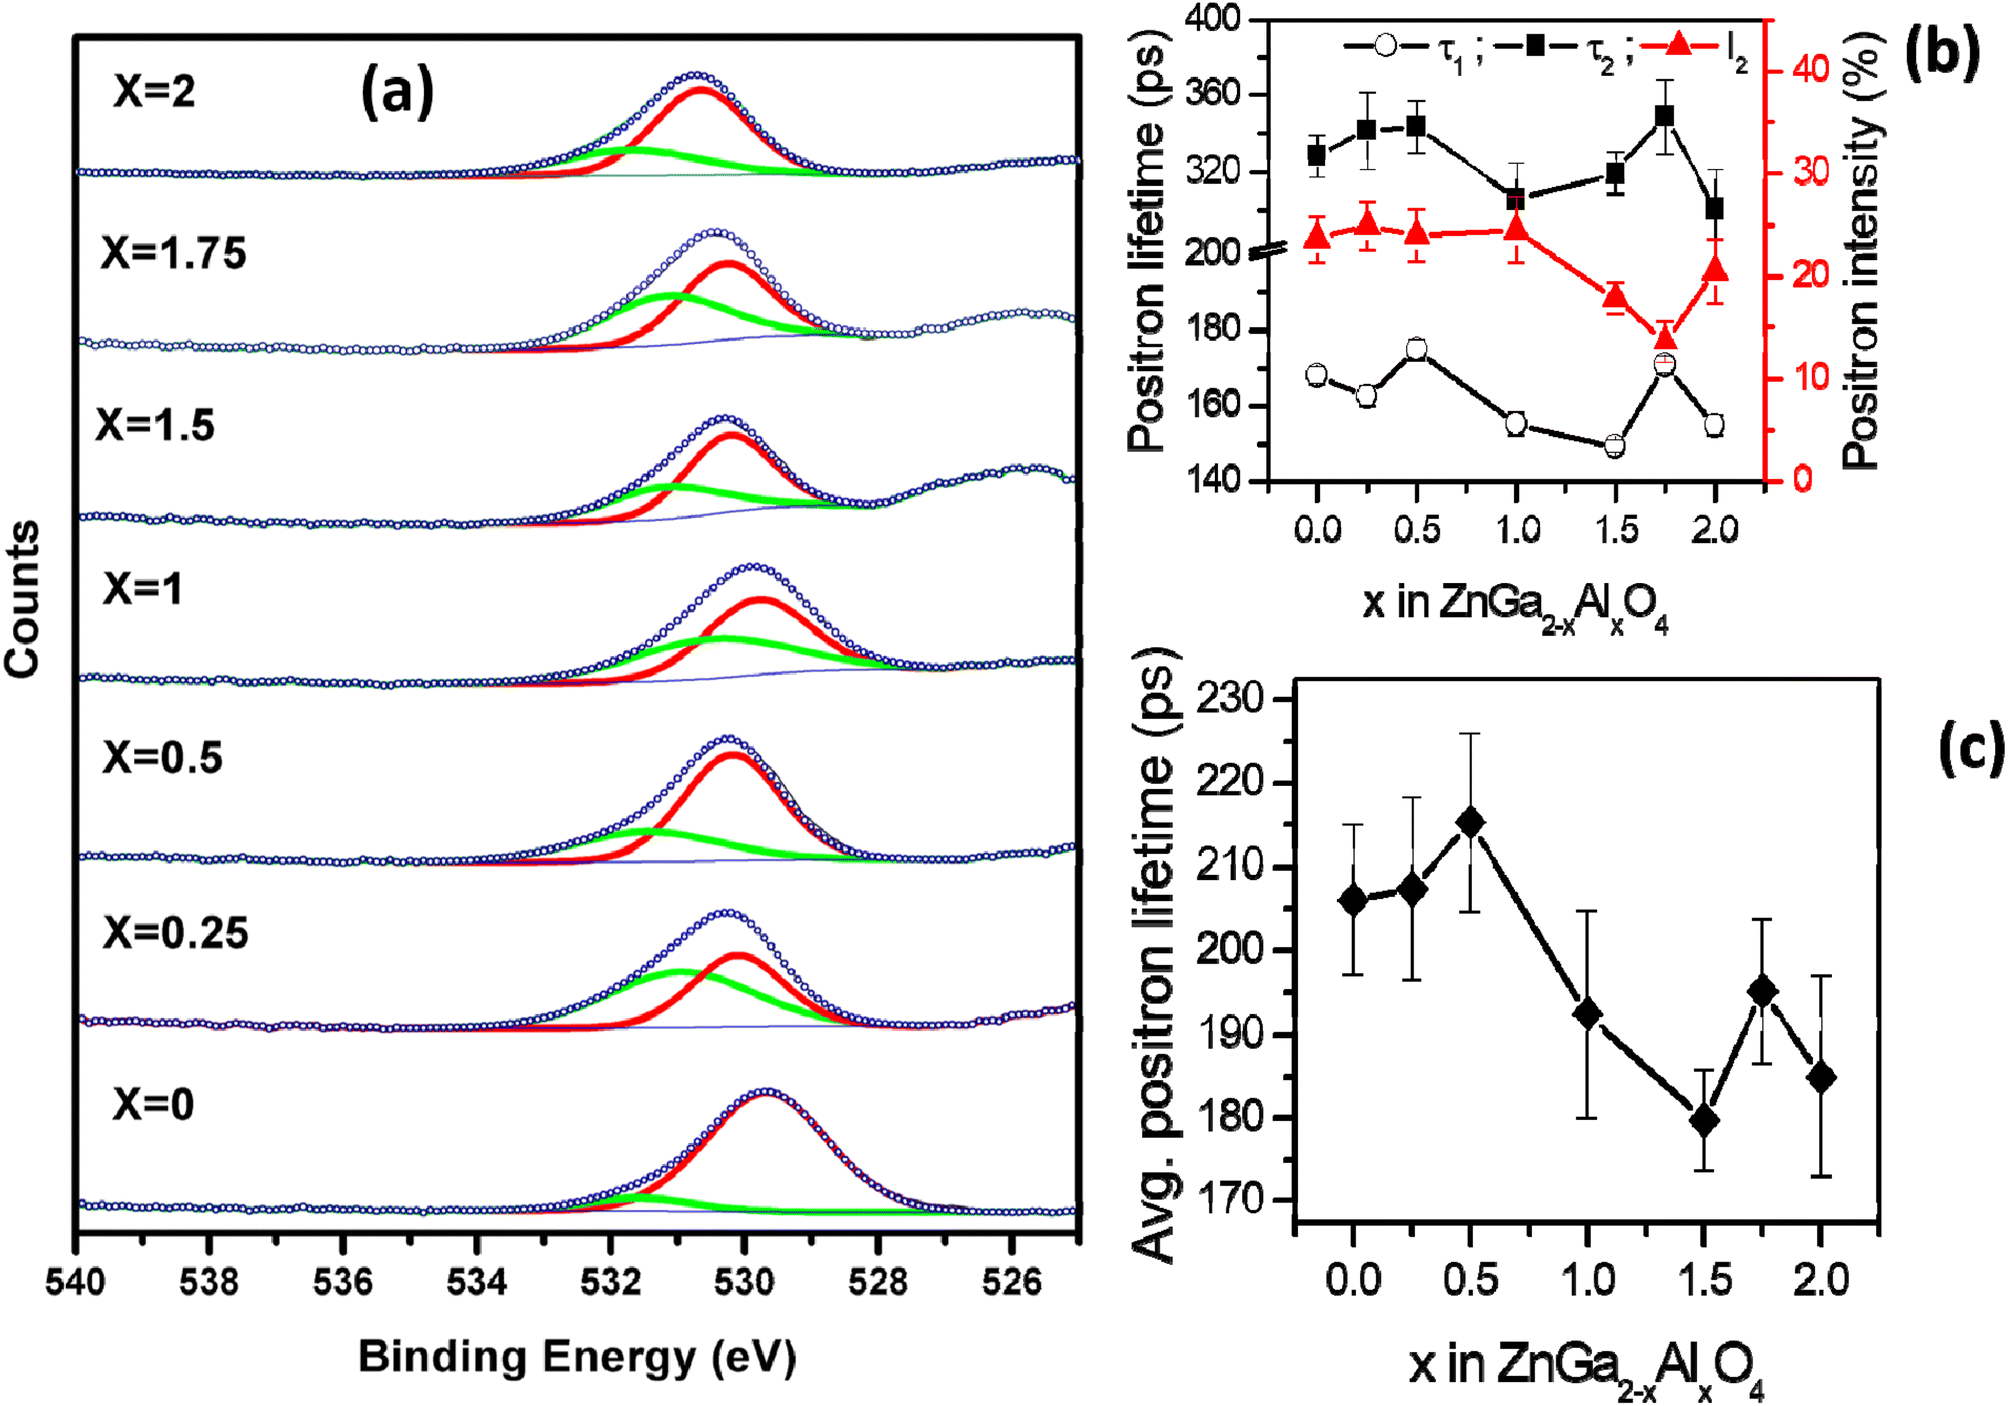 | ||
| Fig. 2 (a) O 1s core level XPS spectra of ZnGa2−xAlxO4. (x = 0, 0.25, 0.5, 1, 1.5, 1.75, 2) (b) positron lifetime data (c) average positron lifetime. | ||
| Sample | Peak 2 | Atomic% of oxygen vacancy |
|---|---|---|
| ZnGa2O4 | 531.6 | 8 |
| ZnGa1.75Al0.25O4 | 531.0 | 55 |
| ZnGa1.5Al0.5O4 | 531.4 | 30 |
| ZnGa1Al1O4 | 531.1 | 45 |
| ZnGa0.5Al1.5O4 | 531.1 | 36 |
| ZnGa0.25Al1.75O4 | 531.2 | 47 |
| ZnAl2O4 | 531.6 | 30 |
All the positron annihilation lifetime spectra could be fitted to sum of three exponentials. The three lifetimes obtained are numbered in the increasing order of the magnitude and the intensities corresponding to these lifetimes are referred to as I1, I2 and I3, as is the convention. The longest-lived component of lifetime ∼ 1 ns and intensity (I3) ∼ 0.6% was from positronium formation on the surface of the powder particles. Though this component was too small, inclusion of it in the fitting was necessary to obtain the best fit to the experimental spectra. The other two lifetimes (τ1 and τ2), their corresponding intensities (I1, I2 with I1 + I2 ∼ constant) and the intensity weighted average positron lifetime in these samples is given in the Fig. 2b and c. The uncertainities on the values of the individual lifetimes and intensities is from the fitting of the spectra while uncertainity on the average lifetime is calculated from the uncertainities of individual lifetimes and intensities used in calculating the average.
The first positron lifetime is in the range of 150–170 ps and the second positron lifetime is in the range of 300–350 ps. The first positron lifetime is from the positron annihilations in the bulk with contribution from shallow positron traps while the second component is from the vacancy clusters. It is also noticed that in the solid solutions, the variation in the positron lifetimes is not monotonous. The positron lifetimes are higher in ZnGa2O4 than ZnAl2O4. The intensity of the second lifetime is lower in Al rich samples when compared to Ga rich sample. The same is true of average positron lifetimes. The sample with x = 1 shows nearly weighted average positron lifetime of in ZnGa2O4 than ZnAl2O4 where as others show deviations from this weighted average.
3.3. Optical measurements
Fig. 3a represents the excitation spectra of ZnGa2−xAlxO4 with a constant emission wavelength of 375 nm. It consists of a band near 254 nm which is due to the O2− → Ga3+/Al3+/Zn2+ charge transfer. Fig. 3b is the emission spectra which is excited at 254 nm. There are mainly two bands observed in the emission spectra which are in the blue and green region located at 400 and 500 nm respectively. Normally ZnGa2O4 reported only have intrinsic blue emission due to the self activation of octahedral GaO6 unit.43,44 Appearance of bright blue PL around 400–460 nm in ZnGa2O4 has been reported earlier as well and it is indeed ascribed to the self-activation of GaO6.45–47 ZnGa2O4 nanocrystals PL peak with respect to its bulk counterpart is fairly narrower and blue-shifted by 35 nm.48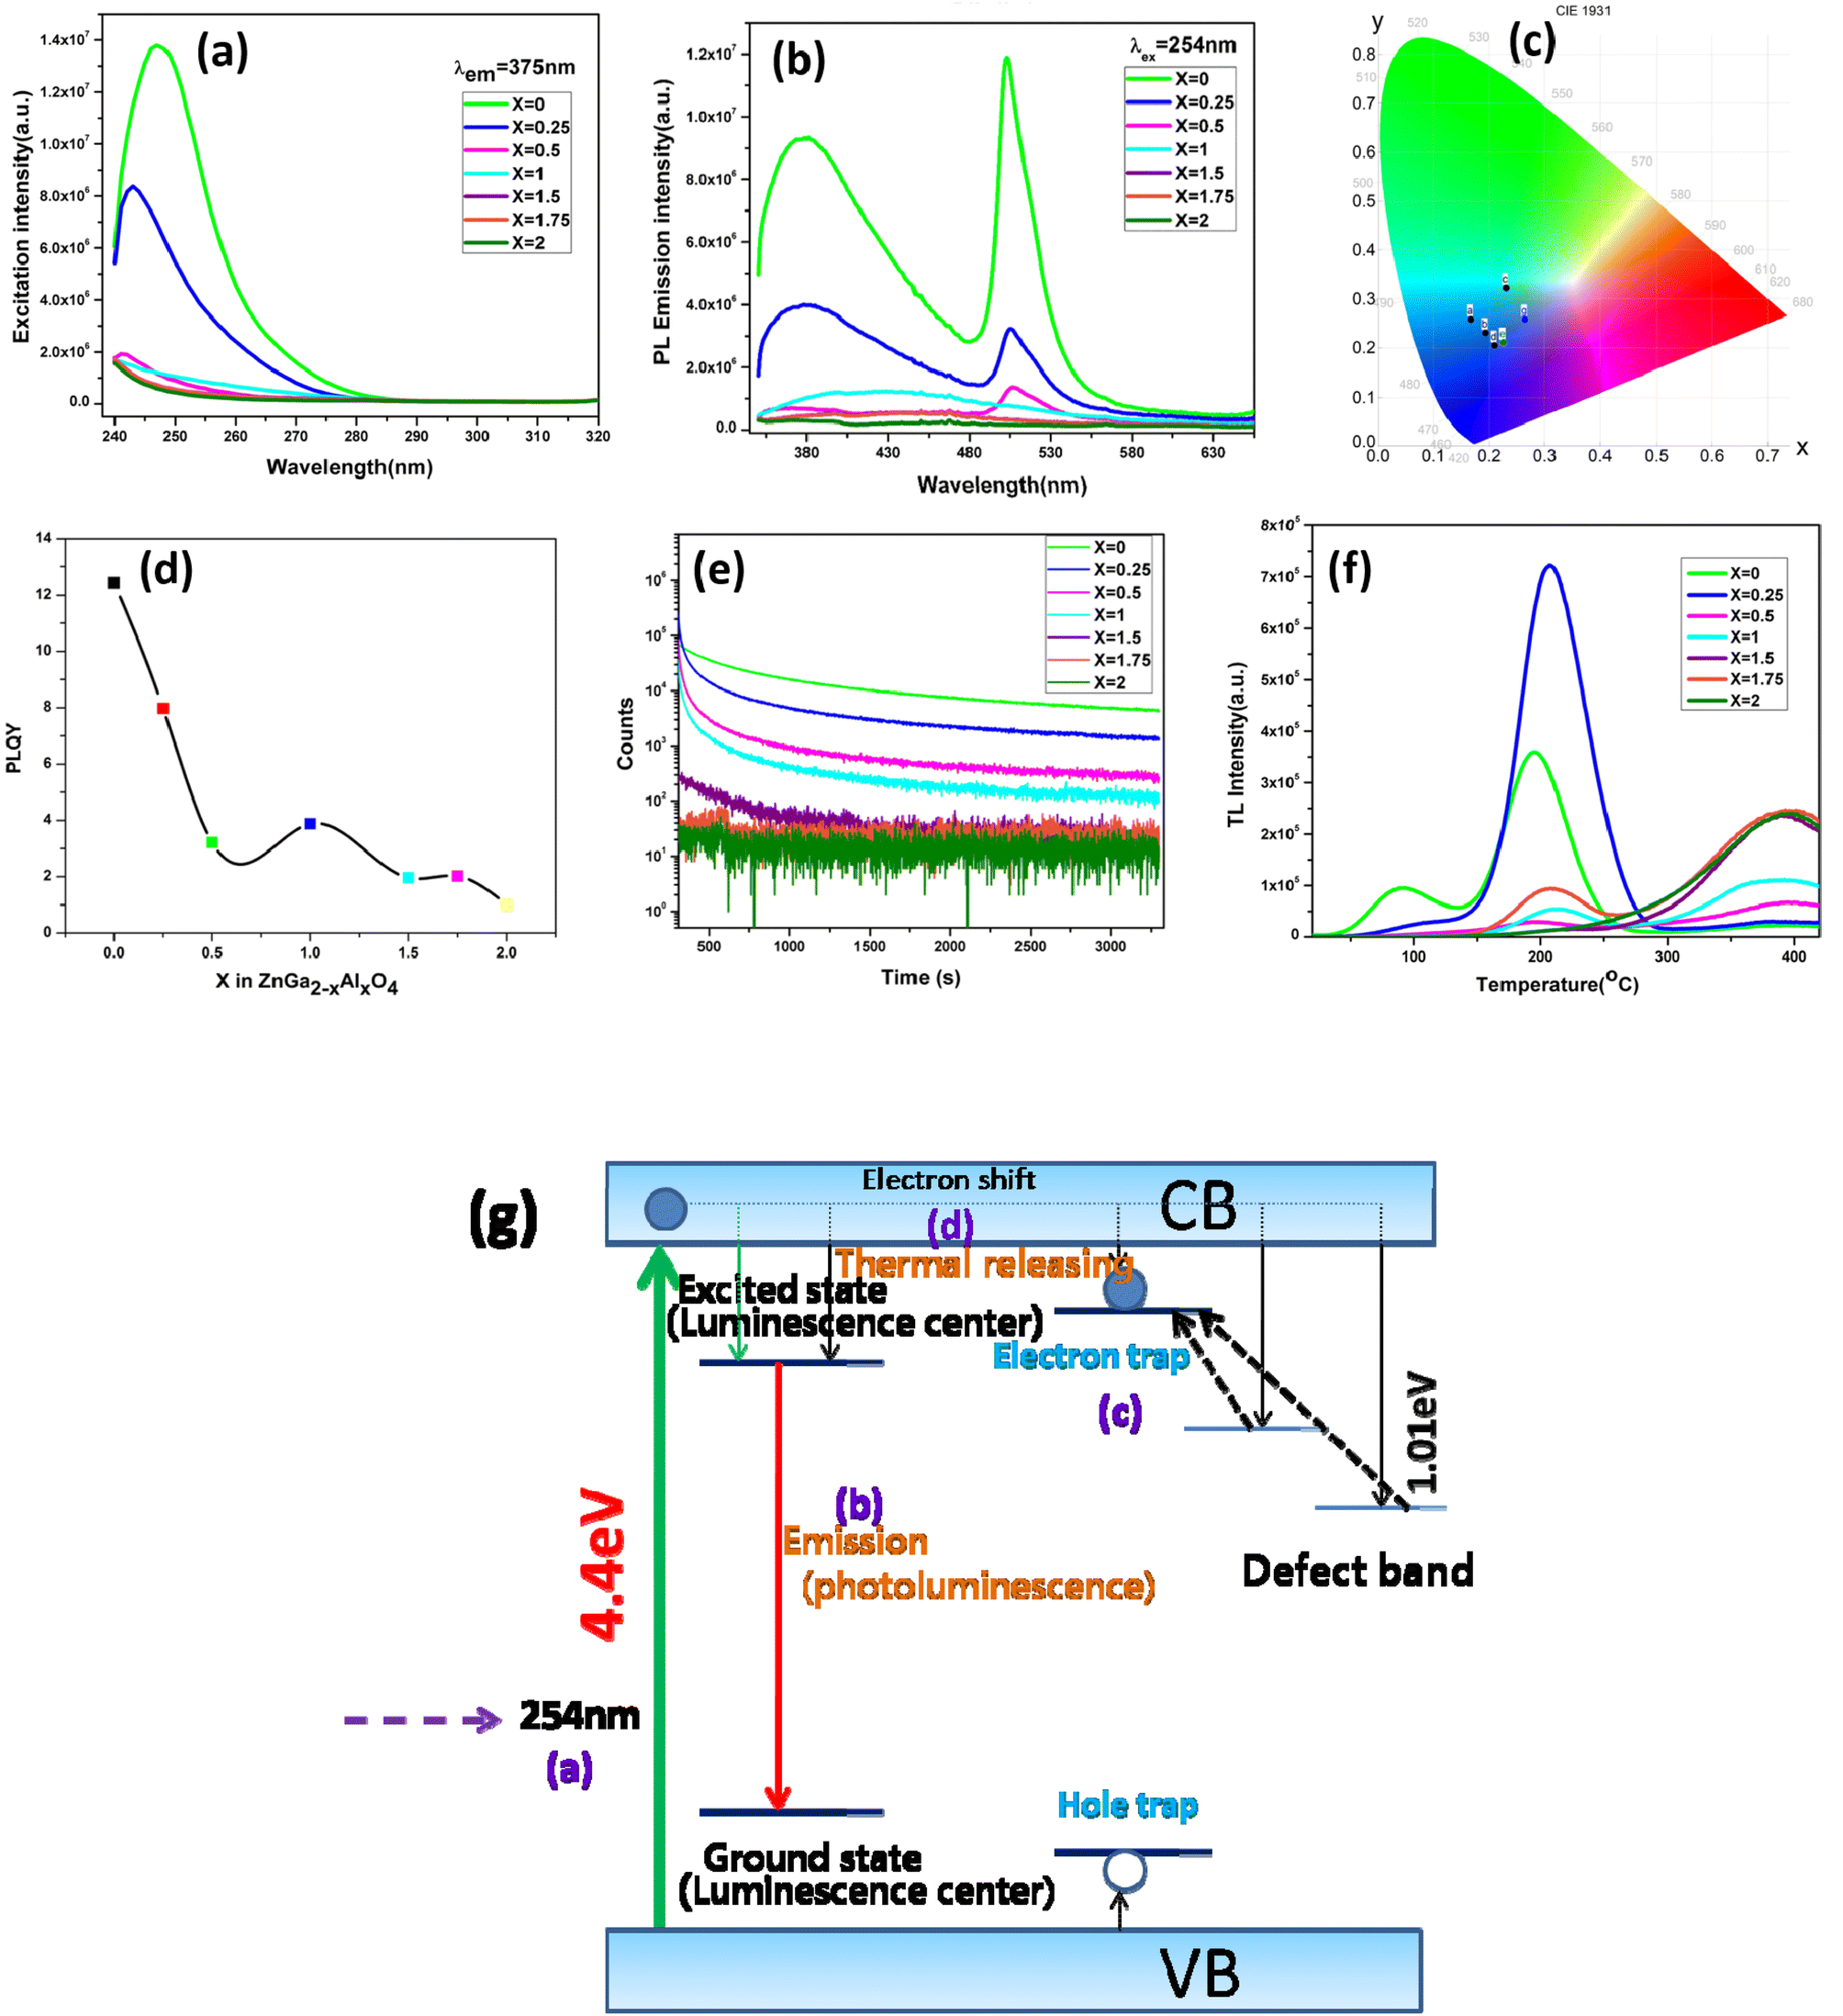 | ||
| Fig. 3 (a) Excitation spectra (b) emission spectra (c) CIE diagram (d) plot of quantum yield against concentration (e) persistent lifetime spectra (f) thermoluminescence spectra of ZnGa2−xAlxO4 (x = 0, 0.25, 0.5, 1, 1.5, 1.75, 2) (g) mechanism of the persistent luminescence. | ||
To tune the emission range in visible region, the normal way is to do the doping with different rare earth elements. But here the ZnGa2O4 produced via solid-state reaction route is showing emission in green region in addition to the blue region. This is due to the formation of vacancies at higher annealing temperature which subsequently create different defect energy levels between the two bands, thus making the visible range emission possible. The green emission is due to the presence of oxygen vacancies.49 Noto et al.50 have also reported similar kind of emission in ZnGa2O4 prepared by microwave assisted solid state reaction in the range of 380 to 660 nm and 665–740 nm. Till date we couldn't find any report on afterglow PL from undoped ZnGa2O4.
From the CIE diagram which is shown in Fig. 3c it is clear that although the material has emission peaks in blue, green and red region, the overall emission profile occurs in the blue region. With different Al content there is color tunability in the blue region. The corresponding x, y coordinates are shown in the Table S2.† On increasing the Al content and gradually replacing Ga3+ ion in ZnGa2O4 the photoluminescence quantum yield (PLQY) is getting reduced, the same trend is also observed in the emission intensity. ZnGa2O4 is having a higher quantum yield of ∼13% as can be seen from Fig. 3d.
In order to study the afterglow decay processes, the curve of all the samples is shown in the Fig. 3e. The samples have been irradiated by 254 nm UV lamp for 5 min. It is clear from the figure that ZnGa2O4 is showing a persistent luminescence of up to 55 minutes with appreciable counts. All the other samples are showing less persistent luminescence time. The presence of shallow traps in ZnGa2O4 is responsible for the persistent luminescence. With increase in the Al content the persistent luminescence has got degraded. From the decay curves it seen that the decay is a bi-exponential decay having a fast decaying and slow decaying component. The mechanism for the persistent luminescence is discussed in the later part of this section.
Fig. 3f shows the thermoluminescence (TSL) spectra of ZnGa2−xAlxO4 which is irradiated at 254 nm for 5 minutes then followed by heating the sample at a heating rate of 2 °C s−1. The experiment has been performed without using the filter. Shape of the glow curve determines the order of the kinetics. More precisely the term is defined as geometric shape factor or symmetry factor (μg) which is given by
| μg = δ/ω | (1) |
In the figure ZnGa2O4 is having two different glow peaks which indicate that there are two types of traps present. Since the low temperature peak is overlapping with the higher temperature peak we are only calculating the trap parameters for the high temperature peak. The TM, T1 and T2 of the high temperature peak of ZnGa2O4 are 195.7 °C, 167 °C and 225.3 °C respectively. Substituting the values to the above equation gives the value of μg as 0.507, which suggest that the peak is obeying the second order kinetics, since the μg value for a first order and second order kinetics have a value of 0.42 and 0.52 respectively.52
According to Chen's method, which is independent of the order of the kinetics, the trap parameters can be calculated by using the eqn (2).51
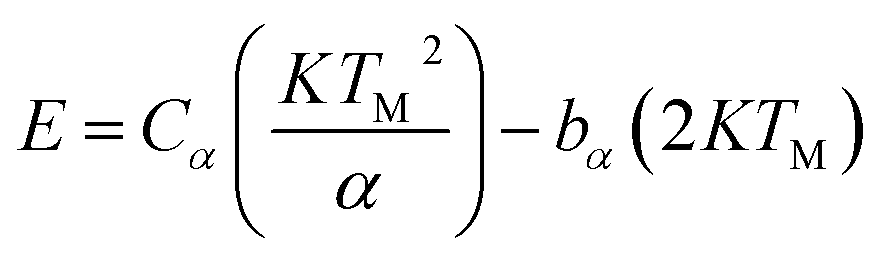 | (2) |
The corresponding activation energy is obtained as 1.013 eV. The frequency factor for a second order reaction has calculated by using the eqn (3).
 | (3) |
As it can be seen from the TSL data of the ZnGa2O4 sample, with relatively shallow traps has most favorable conditions to be used as a persistent luminescent material. This is evidenced from the persistent luminescence study also. With increase in Al content in the samples a small shift in the TL glow peak towards higher TM was observed which is attributed to the increase in the activation energy related to deeper traps. From the figure it is also clear that the TSL intensity of ZnGa1.75Al0.25O4 is high compared to other materials which suggest that the concentration of traps formed is higher in this. From the persistent luminescence and TSL study a possible mechanism has been proposed which has been shown in Fig. 3g. Initially upon irradiation with a UV light large number of electrons and holes are formed which is represented as process (a). Then the energy is transferred to the luminescence centre through the lattice thus producing the rapid luminescence which is the process (b). And for the delayed luminescence the two defect centres are responsible. In the process (c) the carriers are get trapped into the defect centres. After thermal treatment the carriers are get detrapped and producing the persistent luminescence by the process (d).53,54
3.4. Electro catalytic study
![[thin space (1/6-em)]](https://www.rsc.org/images/entities/char_2009.gif) :1) in the spinel, it exhibited the most efficient HER activity. The corresponding Tafel plot is shown in Fig. S5† where we have observed the lowest Tafel slope for ZnGa1Al1O4 sample. This data clearly indicates the fastest electrocatalytic HER kinetics for this ZnGa1Al1O4 material.
:1) in the spinel, it exhibited the most efficient HER activity. The corresponding Tafel plot is shown in Fig. S5† where we have observed the lowest Tafel slope for ZnGa1Al1O4 sample. This data clearly indicates the fastest electrocatalytic HER kinetics for this ZnGa1Al1O4 material.
 | ||
| Fig. 4 The left figure highlights the linear sweep voltammetry plots (HER) recorded for all the catalysts probed in this study in 1.0 M KOH solution (scan rate 5 mV s−1). The horizontal black arrow indicates the initial scan direction. The right hand side picture depicts the onset potential region for the HER activity. | ||
 | ||
| Fig. 5 Linear sweep voltammetry plots (OER) recorded for all the catalysts probed in this study in 1.0 M KOH solution (scan rate 5 mV s−1). The horizontal black arrow indicates the initial scan direction. | ||
Some of the previously reported electrocatalyst and their overpotential values are listed in Table S3.† It can be seen from this table that our OER and HER catalyst is having low overpotential values compared to those electrocatalysts. But we are aware of the fact that there are many more electrocatalysts with much lower overpotential values. So we would like to emphasize here that in this work, our aim is to unveil the structure–function relationship for Ga and Al-consisting Zn-spinels. Here, we have figured out the optimal ratio of Ga and Al for anodic OER and cathodic HER activity. Hence, we can now utilize different variants of the Zn-spinels in an electrolyser to drive the complete water-splitting.
All data are fitted by using an R(RC) circuit. The total electrical equivalent model consists of a solution resistance (RS), in a series with a parallel connection of internal resistance (RP) and a double-layer capacitance (Cdl). RP = RS + Rct can be illustrated as the sum of bulk electrolyte resistance and charge transfer resistance. For solid electrodes, double-layer capacitance can be replaced by a constant phase element (CPE).57 The fitted data based on Fig. 6a are summarized in Table 3. The less Rct (47.3 ohms) of ZnGa1.75Al0.25O4 indicates better electro-catalytic activity for OER compared to the other synthesized catalysts at the same applied potential (1.6 V). Fig. 6b shows the Nyquist plot of ZnGa1.75Al0.25O4 at 1.55 V, 1.6 V, and 1.65 V vs. RHE. Dotted lines are original data and solid lines are fitted one. All the data are fitted by using an R(RC) circuit with a minimal error (χ2, 0.05 to 0.08).
 | ||
| Fig. 6 Nyquist plot of (a) all synthesized catalysts at 1.6 V vs. RHE in 1.0 M KOH solution and (b) ZnGa1.75Al0.25O4 catalyst. | ||
| Electrodes | RS (ohm) | RP (ohm) | RCT (ohm) |
|---|---|---|---|
| Blank carbon paper | 4.1 | 303.19 | 299.1 |
| ZnGa2O4 | 4.12 | 84.97 | 80.85 |
| ZnAl2O4 | 4.08 | 106 | 101.92 |
| ZnGa1.5Al0.5O4 | 4.16 | 79.5 | 75.34 |
| ZnGa0.5Al1.5O4 | 4.02 | 105.51 | 101.49 |
| ZnGa1Al1O4 | 4.06 | 84.29 | 80.23 |
| ZnGa0.25Al1.75O4 | 4.3 | 80.7 | 76.4 |
| ZnGa1.75Al0.25O4 | 3.97 | 51.2 | 47.23 |
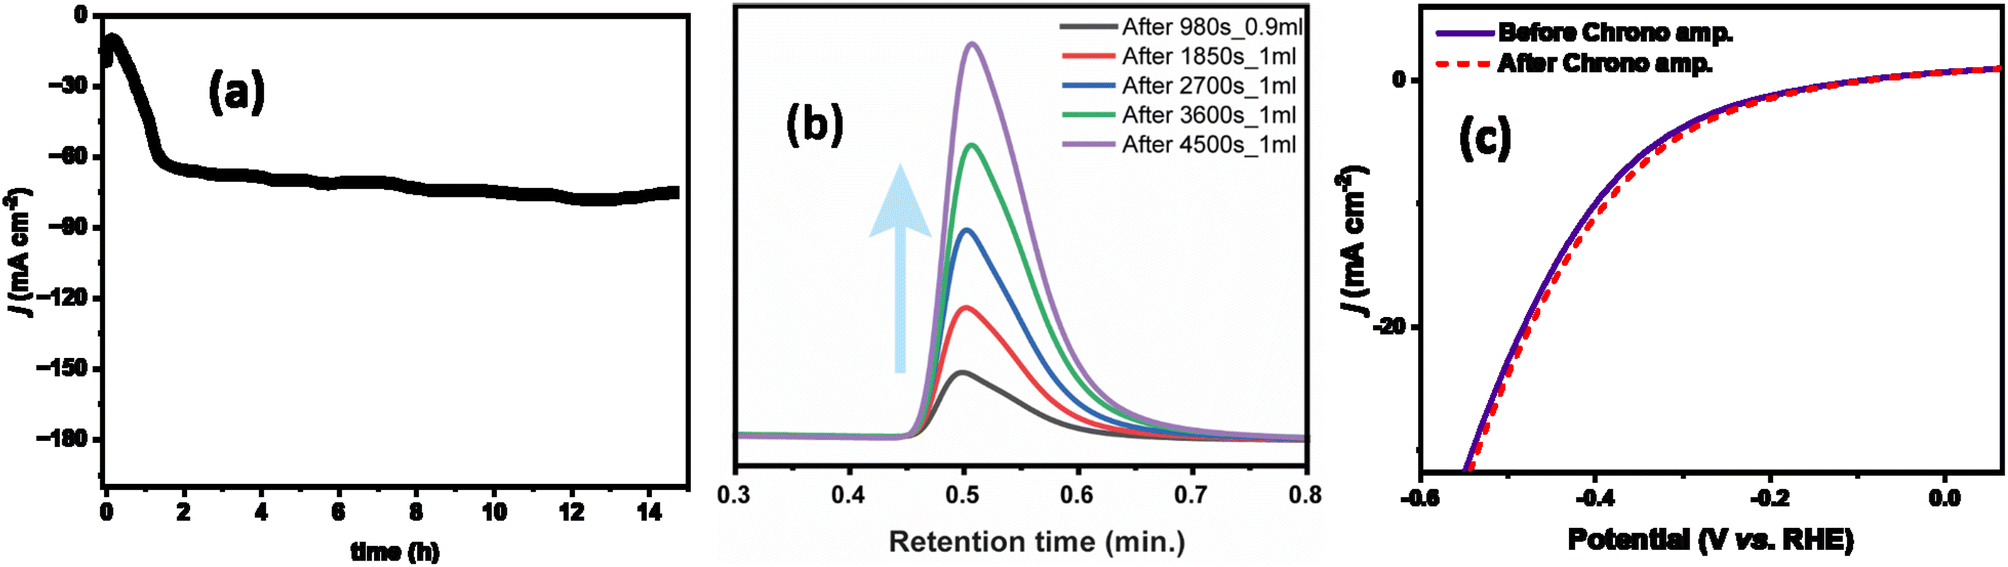 | ||
| Fig. 7 (a) Time dependence of current density of ZnGa1Al1O4 catalyst under a constant potential of −1.45 V, (b) volume of hydrogen gas measured during chronoamperometry test by gas chromatography, and (c) polarization curves, before and after chronoamperometry test of ZnGa1Al1O4 catalyst. | ||
The current density was slightly changed after 15 hours of chronoamperometry due to the sluggish mass transfer of HER and the blockage of some active sites of the catalyst. However, this catalyst exhibited fascinating faradaic efficiency of 88.7%. During the chronoamperometry test, the volume of H2 increased concerning time (Fig. 7b).
As shown in Fig. 7c, before and after the stability test the ZnGa1Al1O4 catalyst exhibited almost the same polarization curve with a slightly smaller overpotential of 360 mV to attain j10. Also we have varied the current density from 50 mA cm−2 to 250 mA cm−2, and observed a regular change in the potential. This experiment was performed over a period of ∼16 hours, where the potential remains stable at a current density of 250 mA cm−2. This has shown in Fig. S6.† The leaching of the aluminum is not observed in the electrolyte and it is below the detection limit of the instrument (<1 ppm). This suggests the good stability of the electrocatalysts. ICP results are shown in Table S4.†
4. Conclusion
The present work comprises the synthesis of solvent-free one pot synthesis of ZnGa2O4 to ZnAl2O4 by changing the Ga/Al ratio via solid state reaction. The materials have been characterized by using XRD, FTIR, Raman, XPS, PALS and EDAX. ZnGa2O4 showed a persistent luminescence of about 60 min with appreciable counts and the mechanism for the same has been proposed by using thermoluminescence studies. Al3+ incorporation reduces both PL and persistent luminescence duration owing to reduction in shallow traps and increase in non-radiative channels. Optical characterization indicates that ZnGa2O4 spinel displays excellent PL properties, with PLQY ∼ 13%. Moreover, due to synergistic effect of Al3+ incorporation and formation of oxygen vacancy, the resulting solid-state solution of ZnGa2O4 and ZnAl2O4 catalyst showed a bifunctional catalytic activity and superior stability for the OER and HER reaction with very low charge transfer resistance for the former and high faradaic efficiency of ∼90% for the later. Apart from the use of ZnGa1Al1O4 as electrocatalysts for HER, ZnGa1.75Al0.25O4 for OER catalysts, the unique PL and afterglow properties of ZnGa2O4 indicate a promising potential of these materials for energy and solid-state lighting applications.Conflicts of interest
There are no conflicts of interest to declare.Acknowledgements
The author would like to thank Dr Hirakendu Basu, ACD for his help in EDAX measurements. Dr N. S. Rawat, RPAD for his help in TL measurements, Dr Ruma Gupta, FCD, BARC for SEM measurements and Dr M. Awasthi for the guidance in electrochemical measurements. The work is partly funded by Science and Engineering Research Board (SERB) via grant no. SERB: CRG/2020/001239.References
- S. K. Gupta, J. P. Zuniga, M. Abdou, M. P. Thomas, M. D. A. Goonatilleke, B. S. Guiton and Y. Mao, Chem. Eng. J., 2020, 379, 122314 CrossRef CAS.
- Z. Zhu, D. W. H. Ng, H. S. Park and M. C. McAlpine, Nat. Rev. Mater., 2021, 6, 27–47 CrossRef.
- G. B. Nair, H. Swart and S. Dhoble, Prog. Mater. Sci., 2020, 109, 100622 CrossRef CAS.
- S. Pokrant, Nature, 2020, 581(7809), 386–388 CrossRef CAS PubMed.
- M. D. Bhatt and J. S. Lee, RSC Adv., 2017, 7, 34875–34885 RSC.
- S. A. Zahra and S. Rizwan, RSC Adv., 2022, 12, 8405–8413 RSC.
- T. Tian, L. Ai and J. Jiang, RSC Adv., 2015, 5, 10290–10295 RSC.
- T. Li, T. Hu, L. Dai and C. M. Li, J. Mater. Chem. A, 2020, 8, 23674–23698 RSC.
- Y. Zhou, S. Sun, C. Wei, Y. Sun, P. Xi, Z. Feng and Z. J. Xu, Adv. Mater., 2019, 31, 1902509 CrossRef CAS PubMed.
- S. Zhu, J. Lei, Y. Qin, L. Zhang and L. Lu, RSC Adv., 2019, 9, 13269–13274 RSC.
- S. Tamilarasan, S. S. Basha, S. B. Sundararaj, H. Amir, V. Chinnusamy and S. Thangavelu, J. Phys. Chem. C, 2022, 126, 11915–11926 CrossRef CAS.
- S. Ratha, R. T. Khare, M. A. More, R. Thapa, D. J. Late and C. S. Rout, RSC Adv., 2015, 5, 5372–5378 RSC.
- J. Zheng, X. Peng, Z. Xu, J. Gong and Z. Wang, ACS Catal., 2022, 12, 10245–10254 CrossRef CAS.
- R. Schmitt, A. Nenning, O. Kraynis, R. Korobko, A. I. Frenkel, I. Lubomirsky, S. M. Haile and J. L. Rupp, Chem. Soc. Rev., 2020, 49, 554–592 RSC.
- C. Xie, D. Yan, H. Li, S. Du, W. Chen, Y. Wang, Y. Zou, R. Chen and S. Wang, ACS Catal., 2020, 10, 11082–11098 CrossRef CAS.
- D. Das, S. K. Gupta, M. Mohapatra and K. Sudarshan, Dalton Trans., 2021, 50, 17378–17389 RSC.
- D. Das, J. Prakash, U. K. Goutam, S. Manna, S. K. Gupta and K. Sudarshan, Dalton Trans., 2022, 51, 18572–18582 RSC.
- S. K. Gupta, K. Sudarshan, B. Modak, A. K. Yadav, P. Modak, S. N. Jha and D. Bhattacharyya, J. Phys. Chem. C, 2020, 124, 16090–16101 CrossRef CAS.
- S. K. Gupta, K. Sudarshan, P. Modak, D. Chandrashekhar, M. Tyagi, B. Modak and M. Mohapatra, Phys. Chem. Chem. Phys., 2022, 24, 23790–23801 RSC.
- Y. Zhang, L. Tao, C. Xie, D. Wang, Y. Zou, R. Chen, Y. Wang, C. Jia and S. Wang, Adv. Mater., 2020, 32, 1905923 CrossRef CAS PubMed.
- J. Chen, Y. Han, X. Kong, X. Deng, H. J. Park, Y. Guo, S. Jin, Z. Qi, Z. Lee and Z. Qiao, Angew. Chem., Int. Ed., 2016, 55, 13822–13827 CrossRef CAS PubMed.
- L. Tao, M. Qiao, R. Jin, Y. Li, Z. Xiao, Y. Wang, N. Zhang, C. Xie, Q. He and D. Jiang, Angew. Chem., Int. Ed., 2019, 58, 1019–1024 CrossRef CAS PubMed.
- X. Xu, Y. Huang, L. Xie, D. Wu, Z. Ge and J. He, Chem. Mater., 2020, 32, 1693–1701 CrossRef CAS.
- J. Ma, R. Long, D. Liu, J. Low and Y. Xiong, Small Struct., 2022, 3, 2100147 CrossRef CAS.
- J. Xiong, J. Di, J. Xia, W. Zhu and H. Li, Adv. Funct. Mater., 2018, 28, 1801983 CrossRef.
- X. Yan, L. Zhuang, Z. Zhu and X. Yao, Nanoscale, 2021, 13, 3327–3345 RSC.
- K. Ye, K. Li, Y. Lu, Z. Guo, N. Ni, H. Liu, Y. Huang, H. Ji and P. Wang, TrAC, Trends Anal. Chem., 2019, 116, 102–108 CrossRef CAS.
- B. B. Srivastava, S. K. Gupta, S. Mohan and Y. Mao, Chem.–Eur. J., 2021, 27, 11398–11405 CrossRef CAS PubMed.
- B. B. Srivastava, S. K. Gupta, R. Barbosa, A. Villarreal, K. Lozano and Y. Mao, Mater. Adv., 2021, 2, 4058–4067 RSC.
- Z. Pan, Y.-Y. Lu and F. Liu, Nat. Mater., 2012, 11, 58–63 CrossRef CAS PubMed.
- X. Wang and Y. Mao, Adv. Opt. Mater., 2022, 10, 2102157 CrossRef CAS.
- B. B. Srivastava, A. Kuang and Y. Mao, Chem. Commun., 2015, 51, 7372–7375 RSC.
- S. K. Gupta, K. Sudarshan, B. Modak and R. Gupta, ACS Appl. Electron. Mater., 2023, 5, 1286–1294 CrossRef CAS.
- H. Zhang, H. Zhang, A. Pan, B. Yang, L. He and Y. Wu, Adv. Mater. Technol., 2021, 6, 2000648 CrossRef CAS.
- J. V. Olsen, P. Kirkegaard, N. J. Pedersen and M. Eldrup, Phys. Status Solidi C, 2007, 4, 4004–4006 CrossRef CAS.
- S. G. Menon, K. S. Choudhari, S. A. Shivashankar, S. Chidangil and S. D. Kulkarni, New J. Chem., 2017, 41, 5420–5428 RSC.
- S.-F. Wang, G.-Z. Sun, L.-M. Fang, L. Lei, X. Xiang and X.-T. Zu, Sci. Rep., 2015, 5, 12849 CrossRef CAS PubMed.
- M. M. Can, G. H. Jaffari, S. Aksoy, S. I. Shah and T. Fırat, J. Alloys Compd., 2013, 549, 303–307 CrossRef CAS.
- R. E. Rojas-Hernandez, F. Rubio-Marcos, I. Romet, A. Del Campo, G. Gorni, I. Hussainova, J. F. Fernandez and V. Nagirnyi, Inorg. Chem., 2022, 61, 11886–11896 CrossRef CAS PubMed.
- S. K. Gupta, B. Modak, D. Das, A. K. Yadav, P. Modak, A. K. Debnath and K. Sudarshan, ACS Appl. Electron. Mater., 2021, 3, 3256–3270 CrossRef CAS.
- X. Wang, H. Qiao, X. Wang, Y. Xu, T. Liu, F. Song, Z. An, L. Zhang and F. Shi, J. Mater. Sci.: Mater. Electron., 2022, 33, 19129–19137 CrossRef CAS.
- M. Jain, Manju, R. Kumar, S. O. Won, K. H. Chae, A. Vij and A. Thakur, Sci. Rep., 2020, 10, 385 CrossRef CAS PubMed.
- X. Bai, X. Zhao and W. Fan, RSC Adv., 2017, 7, 53145–53156 RSC.
- D. P. Dutta, R. Ghildiyal and A. Tyagi, J. Phys. Chem. C, 2009, 113, 16954–16961 CrossRef CAS.
- H.-J. Byun, J.-U. Kim and H. Yang, Nanotechnology, 2009, 20, 495602 CrossRef PubMed.
- Z. Gu, F. Liu, X. Li, J. Howe, J. Xu, Y. Zhao and Z. Pan, J. Phys. Chem. Lett., 2010, 1, 354–357 CrossRef CAS.
- I.-K. Jeong, H. L. Park and S.-i. Mho, Solid State Commun., 1998, 105, 179–183 CrossRef CAS.
- P. M. Aneesh, K. M. Krishna and M. K. Jayaraj, J. Electrochem. Soc., 2009, 156, K33 CrossRef CAS.
- C. R. Garcia, J. Oliva, L. A. Diaz-Torres, E. Montes, G. Hirata, J. Bernal-Alvarado and C. Gomez-Solis, Ceram. Int., 2019, 45, 4972–4979 CrossRef CAS.
- L. L. Noto and M. Mbongo, Phys. B, 2020, 578, 411768 CrossRef CAS.
- R. Chen, J. Appl. Phys., 1969, 40(2), 570–585 CrossRef CAS.
- J. Manam and S. Das, Solid State Sci., 2010, 12, 1435–1444 CrossRef CAS.
- D. Li, Y. Wang, K. Xu, L. Li and Z. Hu, Mater. Res. Express, 2015, 2, 046202 CrossRef.
- D. Li, Y. Wang, K. Xu, L. Li, Z. Hu and H. Zhao, Opt. Mater., 2015, 42, 313–318 CrossRef CAS.
- N. Basavaraju, K. R. Priolkar, D. Gourier, S. K. Sharma, A. Bessière and B. Viana, Phys. Chem. Chem. Phys., 2015, 17, 1790–1799 RSC.
- R. Pandey, J. D. Gale, S. K. Sampath and J. M. Recio, J. Am. Ceram. Soc., 1999, 82, 3337–3341 CrossRef CAS.
- G. J. Brug, A. L. G. van den Eeden, M. Sluyters-Rehbach and J. H. Sluyters, J. Electroanal. Chem. Interfacial Electrochem., 1984, 176, 275–295 CrossRef CAS.
Footnote |
| † Electronic supplementary information (ESI) available. See DOI: https://doi.org/10.1039/d3ra05017c |
| This journal is © The Royal Society of Chemistry 2023 |