
 Open Access Article
 This Open Access Article is licensed under a Creative Commons Attribution-Non Commercial 3.0 Unported Licence
Synthesis and biological evaluation of capsaicin analogues as antioxidant and neuroprotective agents†
Mao Xie‡
a,
Huixian Wu‡ab,
Jing Bian‡c,
Shutong Huangb,
Yuanzheng Xiac,
Yujun Qinc and
Zhiming Yan *ab
*ab
aDepartment of Otolaryngology-Head & Neck Surgery, First Affiliated Hospital of Guangxi Medical University, Nanning, Guangxi, China
bPharmaceutical College, Guangxi Medical University, Nanning, Guangxi, China. E-mail: zhiming_yan@126.com
cJiangsu Key Laboratory of Bioactive Natural Product Research, State Key Laboratory of Natural Medicines, School of Traditional Chinese Pharmacy, China Pharmaceutical University, Nanjing, Jiangsu, China
First published on 1st November 2023
Abstract
Capsaicin and its analogues 3a–3q were designed and synthesized as potential new antioxidant and neuroprotective agents. Many analogues exhibited good antioxidant effects, and some showed more potent free radical scavenging activities than the positive drug quercetin (IC50 = 8.70 ± 1.75 μM for DPPH assay and 13.85 ± 2.87 μM for ABTS assay, respectively). The phenolic hydroxyl of capsaicin analogues was critical in determining antioxidant activity. Among these compounds, 3k displayed the most potent antioxidant activity. Cell vitality tests revealed that the representative compound 3k was good at protecting cells from H2O2-induced oxidative damage at low concentrations (cell viability increased to 90.0 ± 5.5% at 10 μM). In addition, the study demonstrated that 3k could reduce intracellular ROS accumulation and increase GSH levels to prevent H2O2-induced oxidative stress in SY5Y cells. In the mitochondrial membrane potential assay, 3k significantly increased the MMP level of SY5Y cells treated with H2O2 and played an anti-neuronal cell death role. These results provide a promising strategy to develop novel capsaicin analogues as potential antioxidant and neuroprotective agents.
1. Introduction
The capsicum genus consists of more than 200 varieties, classified according to the Scoville ‘Heat’ Units from the very hot habanero to the sweet bell pepper.1 The spicy ingredients in pepper mainly come from capsaicin (8-methyl-N-vanillaldehyde-6-nononic acid) and dihydrocapsaicin, nordihydrocapsaicin, homodihydrocapsaicin, and homocapsaicin, etc., collectively referred to as capsaicinoids.2 Capsaicinoids are not only widely used as food additives but also used to treat rheumatoid arthritis, post-operative pain, acute/chronic neuropathic and musculoskeletal pain, prostate cancer, leukemia, etc.3 More than two hundred clinical trials were carried out on capsaicin, and most of these focus on the pain-relieving effect of capsaicin.4 The three structural features of capsaicin are the key to receptor action, including the lipophilic moiety (nonenyl of capsaicin), which can be substituted by the alkyl/alkenyl chain; the polar head (3-methoxy-4-hydroxybenzyl) and the linker (an amide of capsaicin).5 Kogure et al.6 suggested that the phenolic hydroxyl of capsaicin was not associated with radical scavenging, arguing that the radical scavenging site was the C7-benzyl carbon, and the presence of an acetamide was of great significance for the radicals to obtain hydrogen from the C7-benzyl carbon of capsaicin. On the contrary, Okada et al.7 reported that the radical scavenging site of capsaicin was not dependent on C7-benzyl carbon and acetamide but on the phenolic hydroxyl group of capsaicin, and suggested that the antioxidant site of capsaicin was 2-methoxy-4-methyl-phenol. Capsaicin was a promising small molecule for further optimization.8–10 Moreover, the role of capsaicin analogues in the structure–activity relationship of anti-oxidative and neuroprotective has not been reported.In vivo, radicals can be generated through normal physiological reactions. A free radical is a kind of substance that contains one or more lone electrons. Due to the incomplete electron shell, it has high reactivity and participates in various physiological reactions.11 Reactive oxygen species (ROS) is the active form of oxygen, mainly including oxygen-containing radicals and peroxides prone to the formation of radicals, such as hydrogen (H2O2), superoxide (O2−), hydroxyl radical (˙OH), etc.12 Oxygen participates in high-energy electron transfer and generates large amounts of ATP through oxidative phosphorylation to provide energy in normal physiological reactions.13 Also, the organism is also under oxidative attack by ROS constantly. There are a variety of antioxidant enzymes, such as catalase (CAT), superoxide dismutase (SOD), glutathione peroxidase (GSH-Px), etc. ROS produced in cells are continuously cleared by these enzymes, under normal physiological conditions, keeping the organism in a stable oxidation–reduction system balance.14 Oxidative stress occurs because of an imbalance between ROS production and the ability of the body to counteract its effects.15 High concentrations of ROS, including hydroxyl, hydrogen peroxide and superoxide, may cause damage to lipids, proteins and DNA of biological system,16 leading to tissue damage and the development of cataracts, cardiovascular disease, chronic obstructive pulmonary diseases, chronic kidney disease, neurodegenerative diseases, cancer, diabetes and sarcopenia.17–19
Neurodegenerative diseases are considered related to the loss of neurons, or their myelin sheaths, they worsen over time and dysfunctional.20 Oxidative stress is closely related to the occurrence and progression of neurodegenerative diseases, including Parkinson's disease, Alzheimer's disease,21,22 Huntington's disease and amyotrophic lateralizing sclerosis.23 The brain has high oxygen consumption and produces a large amount of ROS. Although the brain has an antioxidant defense mechanism, it is mainly composed of glutathione, vitamin E, melatonin and antioxidant enzyme, and its antioxidant capacity is very limited, so the brain is more vulnerable to oxidative damage than other tissues.24,25 Therefore, antioxidants may be beneficial for neurodegenerative diseases.
ROS are mainly originated from mitochondria, while ROS accumulation further damages mitochondria.26 Mitochondria are the key factors that determine cell survival and death. Studies suggest the participation of mitochondria dysfunction in neurodegenerative diseases. In addition, excessive ROS can reduce mitochondrial membrane potential (MMP) and then induce cell apoptosis.27 Thus, increased MMP may rescue and reverse ROS-promoted neuronal cell death and combat neurodegenerative diseases.
In this study, we modified the structure of capsaicin, the main active ingredient of pepper, synthesized a series of capsaicin analogues, and evaluated their antioxidant activity and underlying neuroprotective mechanism.
2. Results and discussion
2.1. Synthesis
Capsaicin analogues were synthesized as shown in Scheme 1. The initial compounds 3a, 1 and 2 were purchased from the market. Dihydrocapsaicin 3b could be obtained by hydrogenation from capsaicin 3a, the amidation of acid 2 and amine 1 generated the intermediates 3d–3g, 3i–3j, 3l–3m and 3o–3p in the presence of HOBt, EDCI. Finally, the target compound 3c, 3k, 3n, 3h and 3q was formed via demethylation from the corresponding precursors 3 under BBr3.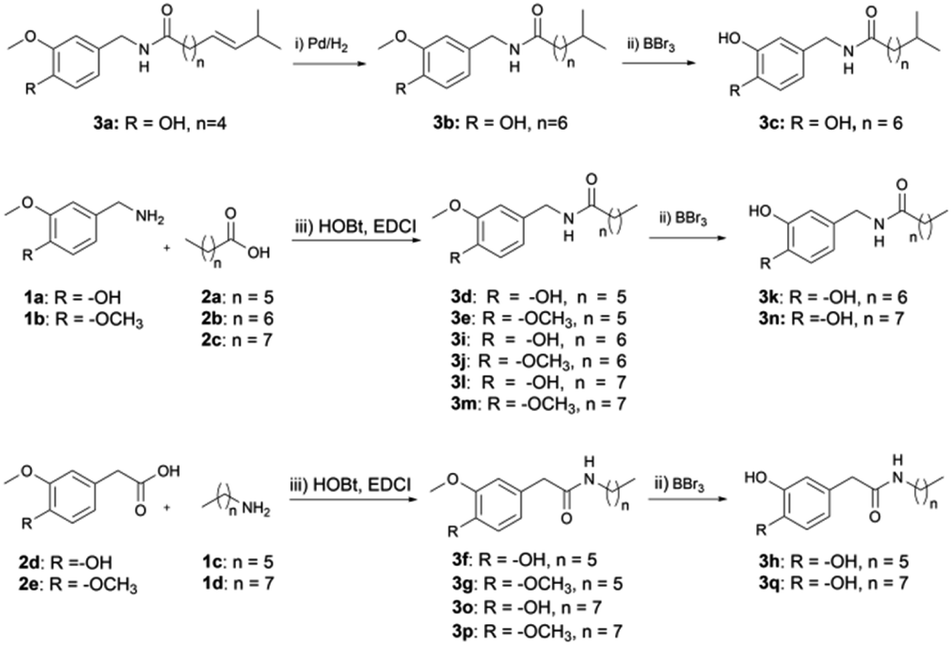 | ||
| Scheme 1 Synthesis of compounds 3b–3q. Reagents and conditions: (i) Pd, H2, THF, r.t., 12–24 h; (ii) BBr3, −78 °C → r.t., DCM, 4–5 h; (iii) HOBt, EDCI, Et3N, DCM, r.t., 4–5 h. | ||
2.2. Prediction of physical properties and BBB penetration of compounds 3a–3q
A major impediment to the development of neuroprotective agents for neurodegenerative diseases is that many large-molecule drugs fail to cross the BBB.28 Lipinski's rules were used for the prediction of physical properties and BBB penetration of compounds 3a–3q. Lipinski's rules: molecular weight (MW) ≤ 500, the calculated logarithm of the octanol–water partition coefficient (Clog![[thin space (1/6-em)]](https://www.rsc.org/images/entities/char_2009.gif) P) ≤ 5, the number of hydrogen bond acceptor atoms (HBA) ≤ 10, the number of hydrogen bond donor atoms (HBD) ≤ 5, and the small polar surface area ≤ 90 Å2. The calculation of logBB by means of the equation is shown in the footnote of Table 1. As shown in Table 1, compounds 3a–3q fulfill drug-like criteria and could penetrate the blood–brain barrier.
P) ≤ 5, the number of hydrogen bond acceptor atoms (HBA) ≤ 10, the number of hydrogen bond donor atoms (HBD) ≤ 5, and the small polar surface area ≤ 90 Å2. The calculation of logBB by means of the equation is shown in the footnote of Table 1. As shown in Table 1, compounds 3a–3q fulfill drug-like criteria and could penetrate the blood–brain barrier.
| Compd | MWa | ClogPa |
HBAa | HBDa | tPSAa | logBBa |
|---|---|---|---|---|---|---|
| a MW: molecular weight, ClogP: calculated logarithm of the octanol–water partition coefficient, HBA: hydrogen-bond acceptor atoms, HBD: hydrogen-bond donor atoms, tPSA: polar surface area, logBB = −0.0148 × tPSA + 0.152 × ClogP + 0.130. |
||||||
| 3a | 305.41 | 3.43 | 3 | 2 | 58.56 | −0.22 |
| 3b | 307.43 | 3.7 | 3 | 2 | 58.56 | −0.17 |
| 3c | 293.4 | 3.34 | 3 | 3 | 69.56 | −0.39 |
| 3d | 265.35 | 2.73 | 3 | 2 | 58.56 | −0.32 |
| 3e | 279.37 | 3.13 | 3 | 1 | 47.56 | −0.10 |
| 3f | 265.35 | 2.67 | 3 | 2 | 58.56 | −0.33 |
| 3g | 279.37 | 3.07 | 3 | 1 | 47.56 | −0.11 |
| 3h | 251.32 | 2.44 | 3 | 3 | 69.56 | −0.53 |
| 3i | 279.37 | 2.42 | 3 | 2 | 58.56 | −0.37 |
| 3j | 293.4 | 3.51 | 3 | 1 | 47.56 | −0.04 |
| 3k | 265.35 | 2.82 | 3 | 3 | 69.56 | −0.47 |
| 3l | 293.4 | 3.44 | 3 | 2 | 58.56 | −0.21 |
| 3m | 307.43 | 3.82 | 3 | 1 | 47.56 | 0.01 |
| 3n | 279.37 | 3.12 | 3 | 3 | 69.56 | −0.43 |
| 3o | 293.4 | 3.38 | 3 | 2 | 58.56 | −0.22 |
| 3p | 307.43 | 3.84 | 3 | 1 | 47.56 | 0.01 |
| 3q | 279.37 | 3.16 | 3 | 3 | 69.56 | −0.42 |
| Rules | ≤500 | ≤5.0 | ≤10 | ≤5 | ≤90 | ≥−1.0 |
2.3. Antioxidant activity
| Compd | R | n | DPPHa (IC50, μM) | ABTSb (IC50, μM) |
|---|---|---|---|---|
| a IC50 values were expressed as mean ± SEM for three determinations.b Data were expressed as IC50, the compound's concentration that inhibits 50% of free radicals (mean ± SEM).c The measurements were performed in the presence of 0.5 mM compounds. | ||||
| 3a | –OH | 4 | 52.07 ± 3.21 | 16.89 ± 1.64 |
| 3b | –OH | 6 | 50.87 ± 4.08 | 11.26 ± 1.55 |
| 3c | –OH | 6 | 7.33 ± 0.98 | 16.77 ± 2.10 |
| 3d | –OH | 5 | 67.64 ± 4.74 | 24.32 ± 3.62 |
| 3e | –OCH3 | 5 | 27.33 ± 2.88%c | 11.47 ± 2.47%c |
| 3f | –OH | 5 | 138.72 ± 6.89 | 13.07 ± 1.47 |
| 3g | –OCH3 | 5 | 12.76 ± 2.54%c | 12.45 ± 1.03%c |
| 3h | –OH | 5 | 4.49 ± 0.74 | 18.60 ± 3.03 |
| 3i | –OH | 6 | 27.89 ± 4.55 | 13.61 ± 2.90 |
| 3j | –OCH3 | 6 | 22.72 ± 5.47%c | 11.73 ± 3.11%c |
| 3k | –OH | 6 | 5.06 ± 1.34 | 10.62 ± 1.28 |
| 3l | –OH | 7 | 27.20 ± 3.47 | 44.16 ± 4.65 |
| 3m | –OCH3 | 7 | 18.56 ± 2.33%c | 8.06 ± 1.17%c |
| 3n | –OH | 7 | 5.91 ± 0.77 | 22.66 ± 2.34 |
| 3o | –OH | 7 | 184.93 ± 9.86 | 30.88 ± 2.79 |
| 3p | –OCH3 | 7 | 30.48 ± 3.44%c | 20.08 ± 3.22%c |
| 3q | –OH | 7 | 4.14 ± 1.09 | 21.64 ± 3.69 |
| Quercetin | — | — | 8.70 ± 1.75 | 13.85 ± 2.87 |
2.4. 3k protected SH-SY5Y cells from H2O2
Many studies have shown that oxidative stress is an important cause of neurodegenerative diseases.30 However, this non-equilibrium state is produced by cells overproducing ROS, which exceeds the scavenging capacity of their antioxidant system. ROS can react with different molecules to promote neuronal cell death and cause neurodegenerative diseases.31,32 H2O2 is one of the ROS produced by metabolism in vivo and is often used to establish an in vitro oxidative stress model.33 Firstly, compounds 3a, 3b, 3c, 3k, 3n, 3q and quercetin were tested for cytotoxicity by MTT assay respectively. As shown in Fig. 1A, compounds 3c, 3n, or 3q displayed strong growth inhibition on SH-SY5Y cells. Therefore, compounds 3a, 3b, 3k and quercetin were selected for further detection. To establish the oxidative stress model, the cell viability of SH-SY5Y in the presence of 25–800 μM H2O2 was tested by MTT assay. H2O2 at the concentrations of 25 and 50 μM had no apparent inhibitory or promotive effects on SH-SY5Y cells (Fig. 1B). While with the increase of the concentration of H2O2, SH-SY5Y cell viability gradually decreased in a concentration-dependent manner. H2O2 at 100 μM showed 38.1 ± 7.6% inhibition in SH-SY5Y cells, thus 100 μM H2O2 was chosen for further experiments (Fig. 1B).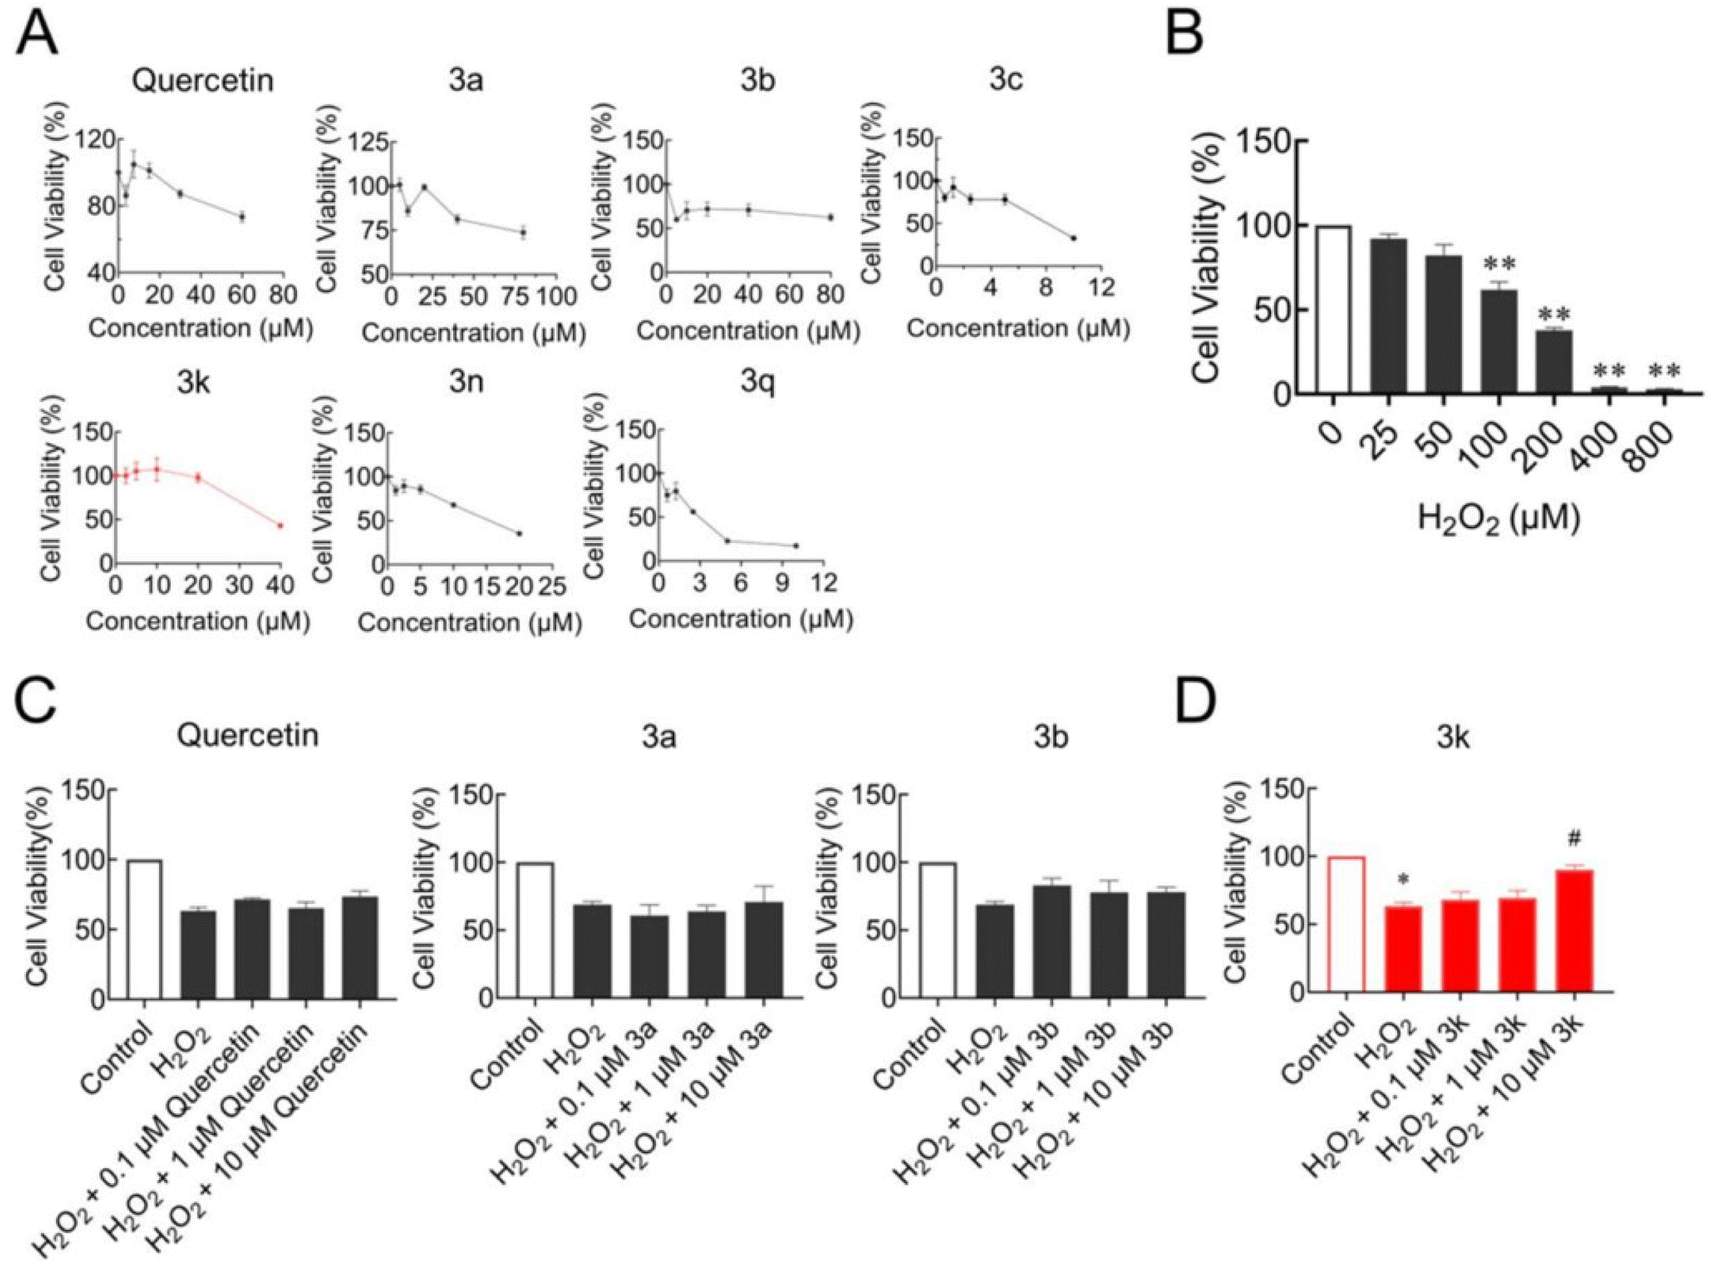 | ||
| Fig. 1 3k markedly enhanced SH-SY5Y cell viability induced by H2O2. (A) Cytotoxicity of compounds 3a, 3b, 3c, 3k, 3n, 3q and quercetin. (B) Screening of H2O2 concentration with MTT assay. (C and D) MTT assay of SH-SY5Y cells exposed to 100 μM H2O2 with or without 3a, 3b, 3k or quercetin preincubation. The absorbance of control cells was regarded as 100%. Error bars represented SEM. *P < 0.05, and **P < 0.01, versus control. #P < 0.05 versus 100 μM H2O2 treated group. | ||
Then, the capacity to resist oxidative stress of four compounds 3a, 3b, 3k or quercetin were investigated respectively. Compared with the control, the cell viability of H2O2-treated SY5Y cells decreased to 63.3 ± 4.5%, which proved that the oxidative stress model was stable and repeatable (Fig. 1C). Chemicals at the concentration of 0.1 μM, 1 μM or 10 μM were pretreatment respectively. Compound 3k showed antioxidative capacity, and the cell viability increased dose-dependently manner. Significantly, 3k at 10 μM increased the cell viability to 90.0 ± 5.5% (Fig. 1D).
2.5. 3k reduced the accumulation of intracellular ROS and enhanced the antioxidative capacity of SH-SY5Y cells
To detect whether 3k suppressed cell death via decreasing oxidative stress, the intracellular ROS levels of SY5Y cells were measured by using DCFH-DA assay. The intensity of fluorescence generally represents the degree of oxidation. The results showed that the green fluorescence intensity of cells was significantly enhanced after 24 h treated with H2O2 compared with control, which indicated the ROS levels were elevated (Fig. 2A). The fluorescence intensity was decreased gradually with concentration gradient 3k treatment. These results demonstrated 3k inhibited the degree of oxidation and protected SY5Y cells from oxidative stress. In addition, we examined GSH, which plays a significant role in protecting oxidative stress-induced cellular damage cells.34–36 As shown in Fig. 2B, the levels of intracellular GSH were decreased after H2O2 stimulation, which was blocked by pretreatment with 10 μM of 3k.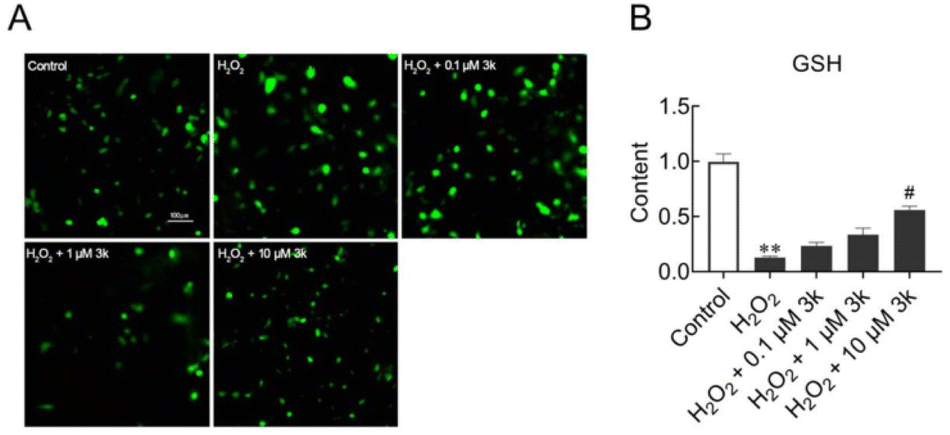 | ||
| Fig. 2 3k inhibited ROS levels and increased GSH content in H2O2-injured SY5Y cells. (A) 3k restrained the overproduction of intracellular ROS. DCFH-DA probe was used to detect ROS fluorescence intensity. (B) 3k improved GSH levels. Error bars represent SEM. ##P < 0.01 versus control. *P < 0.05 versus H2O2 treated group. | ||
2.6. 3k prevented the injury of MMP induced by H2O2
Mitochondrial membrane potential (MMP) usually reflects the functional status of mitochondria, which was detected by the JC-1 fluorescent probe. As shown in Fig. 3A and B, the red fluorescence in SY5Y cells decreased significantly after 100 μM H2O2 treatment for 24 h. With 10 μM 3k administration, the H2O2-induced reduction of MMP was blocked significantly. These findings indicated that 3k can inhibit H2O2-mediated mitochondrial dysfunction. | ||
| Fig. 3 3k prevented the decrease of MMP in H2O2-incubated SY5Y cells. (A) Variations of MMP with BD FACS Calibur flow cytometer detection using JC-1 probe. Red fluorescence represented higher MMP, while green fluorescence represented lower MMP. (B) Quantitative analysis of MMP in SY5Y cells. Error bars represent SEM. #P < 0.05, ##P < 0.01 versus H2O2 treatment group, *P < 0.05 versus control. | ||
2.7. In vitro blood–brain barrier permeation assay
To facilitate drugs' effectiveness in targeting the central nervous system, it is imperative that they possess commendable blood–brain-barrier (BBB) permeability. Di et al.37 provided insights into this by assessing their compounds' BBB permeability using the Parallel Artificial Membrane Permeation Assay for the Blood–Brain-Barrier (PAMPA-BBB). To validate this, a comparative analysis was performed, measuring the experimental permeability of 9 commercially available drugs against previously documented values (Table 3). The results demonstrated a strong linear correlation between the experimental data and the bibliographic references, as expressed by the equation: Pe (exp.) = 1.033Pe (bibl.) + 0.2019 (R2 = 0.9659) (Fig. 4). Leveraging this equation and taking into consideration Di et al.'s established threshold for BBB permeability, we have defined the subsequent permeability ranges: (a) ‘CNS+’ (high BBB permeation predicted): Pe (×10−6 cm s−1) > 4.33. (b) ‘CNS−’ (low BBB permeation predicted): Pe (×10−6 cm s−1) < 2.27. (c) ‘CNS±’ (BBB permeation uncertain): Pe (×10−6 cm s−1) from 4.33 to 2.27. From Table 4, the Pe values of all selective compounds were higher than 4.33, which indicated all compounds had a high permeability of the blood–brain barrier.| Commercial drugs | Bibliographya | Experimentb |
|---|---|---|
| a Taken from ref. 37.b Experimental data are presented as mean from three independent experiments, using PBS:EtOH (70:30) as solvent. |
||
| Testosterone | 17.0 | 16.40 ± 0.47 |
| Estradiol | 12.0 | 13.20 ± 0.51 |
| Progesterone | 9.3 | 8.90 ± 0.34 |
| Chlorpromazine | 6.5 | 7.30 ± 0.85 |
| Corticosterone | 5.1 | 4.72 ± 0.59 |
| Hydrocortisone | 1.9 | 1.0 ± 0.23 |
| Caffeine | 1.3 | 0.79 ± 0.10 |
| Atenolol | 1.02 | 1.90 ± 0.21 |
| Theophylline | 0.1 | 0.54 ± 0.13 |
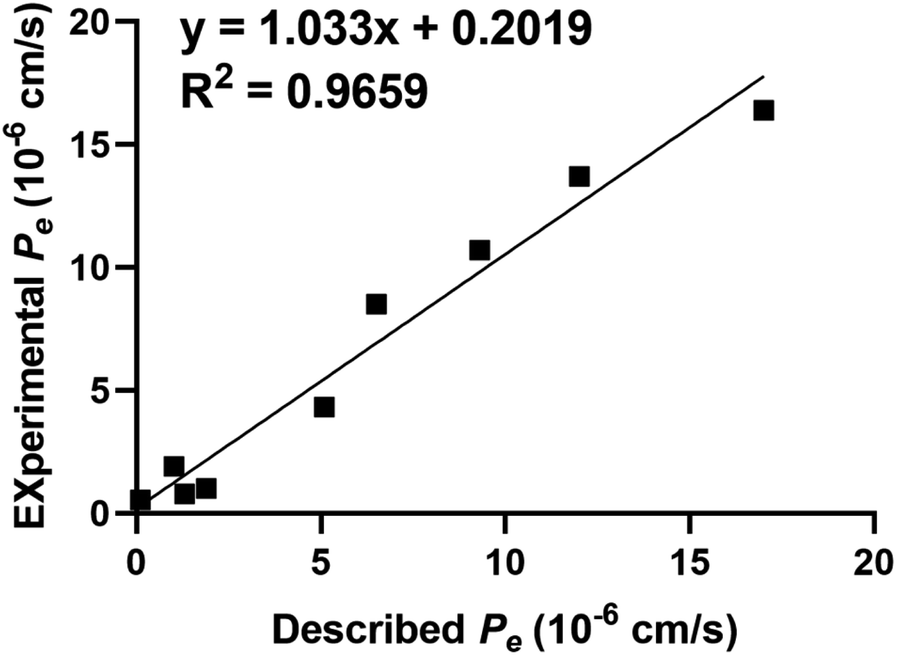 | ||
| Fig. 4 Lineal correlation between experimental and reported permeability of commercial drugs using the PAMPA-BBB assay. Pe (exp.) = 1.033Pe (bibl.) + 0.2019 (R2 = 0.9659). | ||
| Compd | Pea (×10−6 cm s−1) | Predictionb |
|---|---|---|
| a Permeability Pe (×10−6 cm s−1) values are presented as mean from three independent experiments, using PBS:EtOH (70:30) as solvent.b CNS+ is predicted as high BBB permeation with Pe (×10−6 cm s−1) > 4.33, CNS− is predicted as low BBB permeation with Pe (×10−6 cm s−1) < 2.27, CNS± is uncertain for BBB permeation with 2.27 < Pe (×10−6 cm s−1) < 4.33. |
||
| 3b | 5.96 ± 0.78 | CNS+ |
| 3c | 8.45 ± 0.57 | CNS+ |
| 3e | 10.75 ± 1.03 | CNS+ |
| 3f | 6.24 ± 0.98 | CNS+ |
| 3g | 11.25 ± 0.68 | CNS+ |
| 3h | 7.68 ± 0.47 | CNS+ |
| 3k | 9.23 ± 0.57 | CNS+ |
| 3m | 10.58 ± 0.38 | CNS+ |
| 3n | 10.11 ± 0.34 | CNS+ |
| 3q | 6.54 ± 0.81 | CNS+ |
3. Conclusions
A series of capsaicin analogues 3a–3q were designed, synthesized, evaluated their antioxidant activity and explored underlying neuroprotective mechanisms. The radical scavenging capacity of compound 3c–3q was measured by DPPH and ABTS tests, respectively. Some analogues showed stronger antioxidant activity than the positive drug quercetin (IC50 = 8.70 ± 1.75 μM for DPPH assay and 13.85 ± 2.87 μM for ABTS assay, respectively). According to the structure–activity relationship study, the phenolic hydroxyl of capsaicin analogues played a critical role in antioxidant activity. Compound 3k had the best antioxidant activity in the ABTS assay among these compounds. Cytotoxicity assay showed that compound 3k had little toxicity against the SH-SY5Y cell line. The promising compound 3k had a significant protective effect on SH-SY5Y cells from oxidative damage induced by H2O2. Moreover, the determination of intercellular ROS and GSH levels further proved that compound 3k not only prevented oxidative stress induced by H2O2 but also had neuroprotective effect on cells. In the mitochondrial membrane potential assay, the levels of MMP in H2O2-treated SH-SY5Y cells were increased significantly after a low concentration of 3k incubation, indicating that mitochondrial function had been restored to a certain extent, which was beneficial for neurodegenerative diseases.In summary, the objective of our study was to explore some potential antioxidant and neuroprotective agents and their possible mechanisms. The results from this paper not only help us to make better use of natural active ingredients but also provide more possibilities for the treatment of neurodegenerative disorder.
4. Experimental
4.1. Chemical reagents and instruments
Chemicals reagents were purchased at the highest commercial quality (>95%) and used without further purification. Reactions were monitored by thin-layer chromatography (TLC) carried out on 0.25 mm Tsingdao silica gel glass-backed plates and visualized under UV light at 254 nm. Tsingdao silica gel (particle size 0.040–0.063 mm) was used for flash column chromatography. Yields refer to chromatographically. The synthesized intermediates or target compounds were characterized by melting points apparatus, 1H NMR, 13C NMR and high-resolution mass spectrometry (HRESIMS) respectively, NMR spectra were obtained at 500 MHz (1H) and 125 MHz (13C) using Brüker Avance 500 spectrometer. Residual solvent peaks of DMSO-d6 (δ H: 2.50 ppm, δ C: 39.52 ppm) and CDCl3 (δ H: 7.26 ppm, δ C: 77.16 ppm) were used as an internal reference.4.2. General procedure for the synthesis of compounds 3b–3q
To a solution of capsaicin 3a (0.5 mmol, 1.0 equiv.) in dry THF (4 mL) was added Pd/C (10%), stirred at r.t. for 24 h under the H2 atmosphere. After completion, the reaction mixture was filtered, concentrated and purified by flash chromatography on silica gel (eluent: PE/EtOAc, 10/1 to 1/1) to give compound 3b.To a solution of acid 2 (4.0 mmol, 1.0 equiv.) in DCM (25 mL) was added amine 1 (4.0 mmol, 1.0 equiv.), followed by HOBT (5.2 mmol, 1.3 equiv.), EDCI (5.2 mmol, 1.3 equiv.) and stirred at r.t. for 8 h. After completion, the reaction mixture was transferred to a 100 mL separating funnel, the additional 10 mL DCM was added, washed sequentially with H2O (40 mL), 1 M HCl (40 mL) and saturated NaHCO3 (40 mL). Repeated the above extraction procedure three times, the combined organic phases were washed with brine, dried by anhydrous Na2SO4, filtered and concentrated. Finally, the residue was purified by flash chromatography on silica gel (eluent: PE/EtOAc, 10/1 to 1/1) to give compounds 3d–3g, 3i–3j, 3l–3m, 3o–3p.
To a solution of 3b, 3f, 3i, 3l, 3o (2.0 mmol, 1.0 equiv.) in DCM (15 mL) was added BBr3 (4.0 mmol, 2.0 equiv.) dropwise at −76 °C and stirred for 3 h, then warmed up to r.t. for 2 h, the reaction was quenched by 3 mL H2O, and the reaction mixture was transferred to a 100 mL separating funnel, the additional 15 mL DCM and 30 mL H2O was added, then extracted three times with DCM (3 × 30 mL), the combined organic phases were washed with brine, dried by anhydrous Na2SO4, filtered and concentrated. Finally, the residue was purified by flash chromatography on silica gel (eluent: PE/EtOAc, 10/1 to 1/1) to give compounds 3c, 3h, 3k, 3n, 3q.
4.3. DPPH radical scavenging assay
According to the reported method,29 antioxidant activities of compounds 3a–3q were evaluated by determination of DPPH radical scavenging activity. Quercetin was used as a positive control for antioxidant activity. In sample terms, the concentration gradient of compounds was diluted with 0.2 mL methanol, and 2 mL DPPH solution (0.5 mM) was added. After 30 min, the absorbance of the compounds of each concentration at 517 nm was measured. The calculation formula of DPPH free radical scavenging rate is as follows: DPPH radical scavenging (%) = [ADPPH − A(DPPH + compound)]/ADPPH × 100%. The radical scavenging activity is represented by the average IC50 ± SEM of the experiment repeated three times.4.4. ABTS radical cationic decolorization assay
The antioxidant activity of the compounds can be determined according to the method reported in the literature.38 As described below, solid manganese dioxide is added to 20 mL 5 mM ABTS solution preconfigured with 75 mM Na/K buffer of pH 7. Quercetin was used as a positive control for antioxidant activity, and its standard curve was determined at a series of different concentrations. The compounds were vortically, ultrasonically, centrifugally and extracted in methanol:water (1:1, v/v) solution, and diluted appropriately in a Na/K buffer of pH 7. The diluted sample was mixed with 200 μL of ABTS radical cationic solution in a 96-well plate and the absorbance at 750 nm is read in a ThermoMax micrometer. The sample was repeated three times. The results were calculated according to the standard curve.
4.5. Cell culture and treatment
Human neuroblastoma SH-SY5Y cells were purchased from Stem Cell Bank, Chinese Academy of Sciences. SH-SY5Y cells were maintained routinely in Minimum Essential Medium (Invitrogen, 11090081) and Ham's F-12 Nutrient Mixture (Invitrogen, 11765054) supplemented with 10% fetal bovine serum (Gibco), 1% Gluta-max (Invitrogen, 35050061), sodium pyruvate (Invitrogen, 11360070), NEAA (Invitrogen, 11140050) at 37 °C in a humidified atmosphere of 5% CO2 and 95% air. The medium was changed every 2 days. Cells were exposed to 100 μM H2O2 (Sigma-Aldrich) in the presence or absence of 3k in all experiments.4.6. Analysis of cell viability using MTT assay
SH-SY5Y cells were plated into 96-well plates at a density of 8 × 10³ cells per well for 24 h. The cytotoxicity of quercetin (control group), 3a, 3b, 3c, 3k, 3n and 3q (0, 5, 10, 20, 40 or 80 μM) were detected by MTT assay. SY5Y cells were incubated with quercetin (control group), 3a, 3b and 3k (0.1, 1 or 10 μM) at 37 °C for 3 h, prior to the addition of H2O2 (100 μM) for 24 h. And then MTT was added for 4 h, the culture solution was removed and DMSO was added to dissolve the formazan. Using a microplate reader (Spectramax Plus 384, Molecular Devices, Sunnyvale, CA, USA) to detect the absorbance at 570 nm.4.7. Measurement of intracellular reactive oxygen species
Intracellular reactive oxygen species (ROS) levels were examined by a Reactive Oxygen Species Assay Kit (Beyotime, China). SY5Y cells were treated with 3k (0.1, 1 or 10 μM) for 3 h, prior to the addition of H2O2 (100 μM) for 24 h. Then the cells were incubated with 10 μM DCFH-DA at 37 °C for 20 min. In the end, the fluorescence of DCF (FITC) was detected using ImageXpress® Micro Confocal (Molecular Devices, USA).4.8. Measurement of glutathione
SY5Y cells were treated with 3k (0.1, 1 or 10 μM) for 3 h, prior to the addition of H2O2 (100 μM) for 24 h. Based on the instructions of the manufacturer (Beyotime, China), we used the DTNB [5,5′-dithiobis(2-nitrobenzoic acid)]-GSSG reductase recycling assay to examine total glutathione (GSH) levels at 412 nm, compared to control.4.9. Mitochondrial membrane potential assay
JC-1 was used to detect mitochondrial membrane potential (MMP). When the MMP is high, in a normal state, JC-1 produces red fluorescence. While the MMP is low, JC-1 cannot collect in the matrix of mitochondria and produce green fluorescence.A change in the fluorescence from red to green displays a decrease of in the MMP. After the treatment above, the cells were incubated with a JC-1 probe for 20 min at 37 °C based on the instructions of the manufacturer (Beyotime, China). Then, the fluorescence was tested through BD FACS Calibur flow cytometer (Becton & Dickinson Company, Franklin Lakes, NJ).
4.10. Statistical analysis
The Tukey multiple comparison test statistical method was used for experimental analysis by GraphPad Prism version 8.0.2 (GraphPad Software, San Diego, CA). P < 0.05 indicates a significant difference. The data are shown as mean ± standard error of mean (x ± SEM).4.11. In vitro blood–brain barrier permeation assay
The blood–brain-barrier (BBB) permeability of synthesized compounds was assessed using the Parallel Artificial Membrane Permeation Assay (PAMPA). The experimental materials included commercial drugs sourced from Sigma and Alfa Aesar, porcine brain lipid (PBL) from Avanti Polar Lipids, a donor microplate with a PVDF membrane (pore size 0.45 mm), an acceptor microplate, and a 96-well UV plate from Corning Incorporated. To prepare the assay, the filter membrane was coated with PBL (4 mL) in dodecane (20 mg mL−1), and the acceptor 96-well microplate was treated with 300 mL of PBS/EtOH (7:3) solution. The compounds were diluted to a concentration of 100 mg mL−1 using a solution of DMSO (<0.1%) and PBS/EtOH (7:3) and then added to the donor wells. A sandwich was created by placing the donor and acceptor filter membranes together, and this assembly was left undisturbed for 16 hours at 25 °C. The concentration of the compound in the acceptor wells was measured using a UV-plate reader (FlexStation® 3). Commercial drugs with known BBB permeability were included as controls in this experiment.
Author contributions
M. X., Z. Y.: conceptualization; M. X., H. W., J. B.: methodology; M. X.: funding acquisition; M. X., Z. Y., J. B.: project administration; M. X., Z. Y., J. B.: supervision; S. H., Y. X., Y. Q.: formal analysis; H. W.: writing – original draft; M. X., H. W., J. B., S. H., Y. X., Y. Q., Z. Y.: writing – review & editing. All authors contributed to the article and approved the submitted version.Conflicts of interest
The authors declare no conflict of interest.Acknowledgements
This work is supported by the Guangxi Natural Science Foundation for Youth Science Foundation (No. 2022GXNSFBA035478), the Guangxi Science and Technology Base and Talent Special Project (Grant No. AD21220076), the Guangxi Natural Science Foundation for Youth Science Foundation (No. 2023GXNSFBA026321), the State Key Laboratory for Chemistry and Molecular Engineering of Medicinal Resources (Guangxi Normal University, CMEMR2023-B10), the Guangxi Medical University Training Program for Distinguished Young Scholars.References
- S. A. Pal and P. Bigoniya, Research & Reviews: A Journal of Pharmacognosy, 2018, 5, 25–38 Search PubMed.
- X.-J. Luo, J. Peng and Y.-J. Li, Eur. J. Pharmacol., 2011, 650, 1–7 CrossRef CAS PubMed.
- P. Patowary, M. P. Pathak and K. Zaman, et al., Biomed. Pharmacother., 2017, 96, 1501–1512 CrossRef CAS PubMed.
- G. Jia, S. Cang and P. Ma, et al., Bioorg. Chem., 2020, 103, 104161 CrossRef CAS PubMed.
- F. Aiello, M. Badolato and F. Pessina, et al., ACS Chem. Neurosci., 2016, 7, 737–748 CrossRef CAS PubMed.
- K. Kogure, Biochim. Biophys. Acta, 2002, 1573, 84–92 CrossRef CAS PubMed.
- Y. Okada, K. Tanaka and E. Sato, et al., J. Am. Oil Chem. Soc., 2010, 87, 1397–1405 CrossRef CAS.
- Z. C. Wang, B. Wei and F. N. Pei, et al., Eur. J. Med. Chem., 2020, 198, 112352 CrossRef CAS PubMed.
- F. Naaz, A. Khan and A. Kumari, et al., Bioorg. Chem., 2021, 113, 105031 CrossRef CAS PubMed.
- E. Viayna, N. Coquelle and M. Cieslikiewicz-Bouet, et al., J. Med. Chem., 2021, 64, 812–839 CrossRef CAS PubMed.
- M. Homayouni-Tabrizi, A. Asoodeh and M. Soltani, J. Food Drug Anal., 2017, 25, 567–575 CrossRef CAS PubMed.
- A. Capperucci, M. Coronnello and F. Salvini, et al., Bioorg. Chem., 2021, 110, 104812 CrossRef CAS PubMed.
- G. J. Burton and E. Jauniaux, Best Pract. Res. Clin. Obstet. Gynaecol., 2011, 25, 287–299 CrossRef PubMed.
- C. C. Winterbourn, Nat. Chem. Biol., 2008, 4, 278–286 CrossRef CAS PubMed.
- T. Persson, B. O. Popescu and A. Cedazo-Minguez, Oxid. Med. Cell. Longevity, 2014, 2014, 427318 Search PubMed.
- K. Sugamura and J. F. Keaney Jr, Free Radical Biol. Med., 2011, 51, 978–992 CrossRef CAS PubMed.
- C. Wen, J. Zhang and Y. Feng, et al., Food Chem., 2020, 327, 127059 CrossRef CAS PubMed.
- A. Spector, J. Ocul. Pharmacol. Ther., 2000, 16, 193–201 CrossRef CAS PubMed.
- I. Liguori, G. Russo and F. Curcio, et al., Clin. Interventions Aging, 2018, 13, 757–772 CrossRef CAS PubMed.
- P. Sooknual, R. Pingaew and K. Phopin, et al., Bioorg. Chem., 2020, 105, 104384 CrossRef CAS PubMed.
- Y. Bai, D. Liu and H. Zhang, et al., Bioorg. Chem., 2021, 115, 105255 CrossRef CAS PubMed.
- S. Shi, H. Wang and J. Wang, et al., Bioorg. Chem., 2020, 100, 103917 CrossRef CAS PubMed.
- M. T. Lin and M. F. Beal, Nature, 2006, 443, 787–795 CrossRef CAS PubMed.
- A. Dairam, R. Fogel and S. Daya, et al., J. Agric. Food Chem., 2008, 56, 3350–3356 CrossRef CAS PubMed.
- Q. A. Nazari, T. Kume and N. Izuo, et al., Biol. Pharm. Bull., 2013, 36, 1356–1362 CrossRef CAS PubMed.
- P. Bakthavachalam and P. S. T. Shanmugam, J. Neurol. Sci., 2017, 375, 417–423 CrossRef CAS PubMed.
- T. Iijima, Neurosci. Res., 2006, 55, 234–243 CrossRef CAS PubMed.
- W. M. Pardridge, Alzheimer's Dementia, 2009, 5, 427–432 CrossRef PubMed.
- M. N. Alam, N. J. Bristi and M. Rafiquzzaman, Saudi Pharm. J., 2013, 21, 143–152 CrossRef PubMed.
- V. Dias, E. Junn and M. M. Mouradian, J. Parkinson's Dis., 2013, 3, 461–491 CAS.
- A. Singh, R. Kukreti and L. Saso, et al., Molecules, 2019, 24, 1583 CrossRef CAS PubMed.
- K. J. Barnham, C. L. Masters and A. I. Bush, Nat. Rev. Drug Discovery, 2004, 3, 205–214 CrossRef CAS PubMed.
- M. A. Martinez, J. L. Rodriguez and B. Lopez-Torres, et al., Environ. Int., 2020, 135, 105414 CrossRef CAS PubMed.
- M. Jozefczak, T. Remans and J. Vangronsveld, et al., Int. J. Mol. Sci., 2012, 13, 3145–3175 CrossRef CAS PubMed.
- P. Diaz-Vivancos, A. de Simone and G. Kiddle, et al., Free Radical Biol. Med., 2015, 89, 1154–1164 CrossRef CAS PubMed.
- T. Homma and J. Fujii, Curr. Drug Metab., 2015, 16, 560–571 CrossRef CAS PubMed.
- L. Di, E. H. Kerns and K. Fan, et al., Eur. J. Med. Chem., 2003, 38, 223–232 CrossRef CAS PubMed.
- N. P. Seeram, S. M. Henning and Y. Niu, et al., J. Agric. Food Chem., 2006, 54, 1599–1603 CrossRef CAS PubMed.
Footnotes |
| † Electronic supplementary information (ESI) available: Experimental procedures including characterization data of novel synthetic compounds. See DOI: https://doi.org/10.1039/d3ra05107b |
| ‡ These authors contributed equally to this work. |
| This journal is © The Royal Society of Chemistry 2023 |