 Open Access Article
Creative Commons Attribution 3.0 Unported Licence
Novel “on–off” fluorescence sensing for rapid and accurate determination of Cr3+ based on g-CNQDs†
Xiaohua Xua,
Huye Lib,
Yapeng Sunc,
Tianfeng Maa,
Lin Shia,
Wencheng Mua,
Huan Wang *a and
Yongchang Lu
 *a
*a
aModern Tibetan Medicine Creation Engineering Technology Research Center of Qinghai Province, College of Pharmacy, Qinghai Nationalities University, Xining 810007, China. E-mail: qhmuwh1028@126.com; qhlych@126.com
bThe Fourth People's Hospital of Qinghai Province, Xining 810007, China
cNo. 2 Middle School in Xining City, Xining 810007, Qinghai Province, China
First published on 28th September 2023
Abstract
Cr3+ is one of the most essential trace elements in living organisms and plays a vital role in human metabolism. However, both deficiency and excess intake of Cr3+ can be harmful to the human body. Therefore, the quantitative determination of Cr3+ is of great significance in the field of life science. Based on this, in this study, a g-CNQDs@p-acetaminophenol fluorescence sensing system was developed for the quantitative detection of Cr3+ in actual complex samples. G-CNQDs were synthesized with sodium citrate and urea as precursors. The fluorescence signal was enhanced by the synergistic effect between p-acetaminophenol (APAP) and g-CNQDs. The fluorescence quenching phenomenon can be produced when Cr3+ is introduced into the fluorescence-enhanced g-CNQDs@p-acetaminophenol system. An “on–off” fluorescence sensing system was constructed based on g-CNQDs@p-acetaminophenol for the quantitative detection of Cr3+. The experimental data showed a wide linear region in the concentration range of 0.64–63.0 μM, and the detection limit was as low as 0.23 μM. The construction of the sensor system broadens the research field for the practical application of Cr3+.
1 Introduction
Cr3+ is one of the essential trace elements in humans and animals and has a direct impact on the metabolism of carbohydrates, fats, proteins, and nucleic acids.1,2 The lack of Cr3+ has been reported to cause vascular disease, diabetes, etc., while excessive intake can damage cell composition and cause harm to the body, causing disorders of blood glucose and lipid metabolism.3–6 It is well known that the human body needs a small amount of Cr3+, which can only be taken from food due to its inability to synthesize it. To prevent the lack and excessive intake of Cr3+, the Chinese Nutrition Society recommends a daily dietary Cr3+ intake of 50–200 μg for adults,7 and the United States Environmental Protection Agency standard limit for Cr3+ in drinking water is 0.1 mg mL−1.6 In addition, Cr3+ is easily oxidized to Cr6+ by oxidants. Cr6+ has higher toxicity compared with Cr3+, which can cause allergy through skin contact, and easy to cause genetic defects or cancer after inhalation. It can cause long-lasting harm to the environment when Cr6+ is discharged into the environment.8–10 Therefore, it is urgently required to construct a simple, efficient, and selective method for the quantitative detection of Cr3+ in the field of environmental and biological health monitoring.At present, various detection techniques have been successfully developed for the determination of Cr3+, including chromatography,11,12 spectrophotometry,13,14 inductively coupled plasma-mass spectrometry (ICP-MS),15–17 atomic absorption spectrometry,18,19 and electrochemical methods.20,21 Although these methods have high accuracy and sensitivity, they still have disadvantages, such as expensive equipment, complicated sample pretreatment, and time-consuming, which limit their wide application to some extent. Therefore, finding a simple, fast, and sensitive analytical technique for Cr3+ has become a hot research topic. In contrast, fluorescence spectrophotometry represented by carbon quantum dots is widely popular because of its low cost, simple operation, fast response, remarkable selectivity, and high sensitivity.6,22 Therefore, it is of great significance to construct novel fluorescent sensors to detect Cr3+ for accurate and selective identification and quantitative monitoring of Cr3+. In addition, it has been reported that fluorescence sensing systems can be used to detect Cr3+ in a low-cost, ultra-sensitive, simple, and rapid way. Krishnan et al. designed and synthesized a new diphenylimidazole-based fluorescent probe 5, which realizes the dual sensing of Hg2+ and Cr3+ ions. It also has been successfully used for the detection of Cr3+ in environmental water samples and E. coli bacteria cells.6 Wang et al. designed a chemiluminescent sensor L based on a coumarin base, which could realize the rapid and selective detection of Cr3+. The cell imaging and real-time monitoring of Cr3+ in living HepG2 cells have been successfully realized due to its good water solubility and biocompatibility.23
In recent years, semiconductor quantum dot (SQD) materials have gained wide applications in bioimaging and biosensors owing to their unique optical properties.24 However, some common quantum dots, such as cadmium sulfide (CdS) and cadmium telluride (CdTe), have certain toxicities that will have harmful effects on human health and the environment.25 Compared with traditional organic dyes and semiconductor quantum dots, graphitic carbon nitride quantum dots (g-CNQDs), as an emerging non-metallic semiconductor nanomaterial, not only maintain good water solubility, chemical stability, biocompatibility, and high photoluminescence quantum yield but also have the advantages of low cost, easy synthesis, non-toxicity, and green environmental protection. g-CNQDs have shown great promise for applications in photocatalysis, chemical and biological sensing, bioimaging, and drug delivery owing to their excellent optical properties.26,27 These excellent properties make it possible to replace conventional quantum dots in biological detection. To date, a number of fluorescent sensors based on g-CNQDs have been developed for the detection of biological ions. For example, Wang et al. used a simple one-step hydrothermal method to synthesize blue fluorescent carbon quantum dots for the highly sensitive detection of the environmental pollutant Cr6+.28 Guo et al. prepared a novel nanoprobe based on S, O-doped carbon nitride quantum dots (S,O-CNQDs), which show great potential for the detection of folate and targeted imaging of cancer cells.29 In conclusion, g-CNQDs can be used as a fast, simple, and highly selective fluorescent sensing probe for the detection of biological and environmental samples because of their good physicochemical properties.
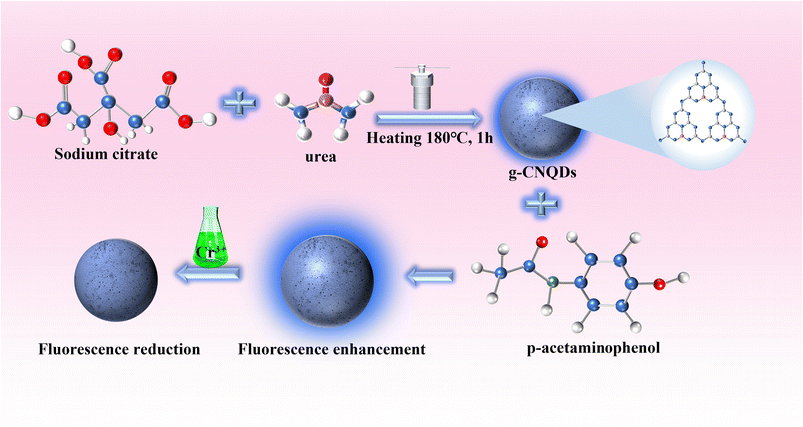
In this study, g-CNQDs were synthesized and used for Cr3+ detection (Fig. 1). g-CNQDs were prepared using the low-temperature solid phase reaction method.30 The synthesis method has the characteristics of a simple process, low energy consumption, and low pollution. The maximum fluorescence emission spectrum of g-CNQDs at 446 nm was enhanced due to the synergistic effect between g-CNQDs and p-acetaminophenol when p-acetaminophenol was injected into luminophor. At this time, the sensor system was turned on. The enhanced fluorescence intensity was quenched due to photoinduced electron transfer between g-CNQDs@p-acetaminophenol and Cr3+ when Cr3+ was further introduced into the proposed sensing system. Thus, the sensor study of g-CNQDs@p-acetaminophenol on Cr3+ was conducted. The quantitative analysis of Cr3+ in environmental water samples was successfully performed. Compared with various previously reported detection methods, the fluorescence sensor constructed in this study is simple, sensitive, and efficient. The proposed sensing system exhibits good potential for application in the monitoring of Cr3+ in complex environmental samples.
2 Experimental
2.1 Reagents
All reagents were of analytical reagent grade and were used without further purification. Urea was purchased from the Hedong District of the Tianjin Hongyan Reagent Factory (Tianjin, China). Sodium citrate was purchased from the Beijing Chemical Factory (Beijing, China). p-Acetaminophenol and quinine sulfate were purchased from Aladdin Co., Ltd. (Shanghai, China). Sodium dihydrogen phosphate, disodium hydrogen phosphate, sodium chloride, H2O2, and chromium chloride (CrCl3·6H2O) were purchased from the Tianjin Damao Chemical Reagent Factory (Tianjin, China). The preparation reagents for the metal ion solutions were purchased from Sinopharm Chemical Reagent Co., Ltd. (Shenyang, China). Anhydrous ethanol was purchased from Xinxiang Zhengxin Chemical Co., Ltd. (Henan, China).2.2 Characterization methods
Transmission electron microscopy (TEM) and high-resolution TEM (HRTEM) images of g-CNQDs were obtained using a JEM-2100 transmission electron microscope (Shimadzu Corporation, Japan) at an accelerating voltage of 200 kV. The X-ray diffraction (XRD) analysis of g-CNQDs was performed using an X-ray powder diffractometer (PANalytical B.V., Netherlands). The elemental composition and proportion of g-CNQDs were obtained using X-ray photoelectron spectroscopy (XPS) using a D8AA25 X-ray photoelectron spectrometer (Bruker Corporation, Germany). The fluorescence properties of g-CNQDs were determined using an RF-5301PC fluorescence spectrophotometer (Shimadzu Corporation, Japan). UV-Vis absorption spectroscopy was performed using a TU-1901 double-beam UV-Vis spectrophotometer (Beijing Purkinje General Instrument Co., Ltd., China). Fourier transform infrared spectroscopy (FT-IR) was carried out using a Nicolet IS-10 FT-IR spectrometer (Thermo Fisher, USA). The pH of the PBS buffer solution was determined using a pHS-2C digital pH meter (Ridao Science Instrument Co., Ltd., China).2.3 Preparation of materials
2.4 Interference experiment with the Cr3+ fluorescent sensor
In order to explore the sensing performance of g-CNQDs, 13 metal ions (Al3+, K+, Mg2+, Ni2+, Na+, Hg2+, Mn2+, Pb2+, Cu2+, Zn2+, Ba2+, Cd2+, and Cr3+) with concentrations of 1 mmol L−1 were prepared to evaluate the selectivity of the fluorescent sensor. The optimized g-CNQDs and p-acetaminophenol solutions were taken and added to a quartz cuvette to make a mixed solution. Then, the above metal ions were added to the mixed solution separately. After incubation for 1 min at room temperature, the fluorescence spectra were monitored at the excitation wavelength of 340 nm to evaluate if the presence of other ions interfered with the quenching effect of Cr3+.2.5 Detection of Cr3+ in the actual samples
The environmental water samples used in the experiments were obtained from the laboratory of Qinghai University for Nationalities. The serum in the actual sample analysis was provided by the Fourth People's Hospital of Qinghai Province. Before analysis, all samples were centrifuged at 8000 rpm for 5 min and then filtered using a 0.22 μm filter membrane. The prepared 3 mL g-CNQDs@p-acetaminophenol solution was added to the above water sample solution at different volumes. The fluorescence intensity was detected after the reaction at room temperature for 3 min. The reliability and accuracy of g-CNQDs@p-acetaminophenol fluorescence sensor for the detection of Cr3+ were verified by standard recovery experiments.3 Results and discussion
3.1 Characterization of the prepared g-CNQDs
g-CNQDs were synthesized by a simple low-temperature solid-phase reaction using trisodium citrate and urea as raw materials. To prove the successful synthesis of g-CNQDs, the prepared g-CNQDs were characterized using TEM, XRD, FT-IR, and XPS. TEM was used to characterize the morphology, particle size, and dispersion of the synthesized g-CNQDs, as shown in Fig. 2. Through TEM characterization at 5 nm (Fig. 2A) and HR-TEM images (Fig. 2B), it was shown that the prepared g-CNQDs had a spherical morphology, uniform particle size, and good dispersion. From HR-TEM (Fig. 2B), it can be clearly observed that the prepared g-CNQDs have obvious crystal characteristics, and the lattice spacing was measured at 0.32 nm. Fig. 2C shows that 108 nanoparticles were selected and added to the statistics using the ImageJ software to determine the particle size of g-CNQDs. It can be seen that the particle size distribution of g-CNQDs ranges from 2 nm to 4.5 nm with an average particle size of 3.3 nm. The XRD characterization shown in Fig. 2D further indicated the two characteristic peaks of g-CNQDs, which corresponded to the (100) and (002) crystal planes of pure carbon nitride.31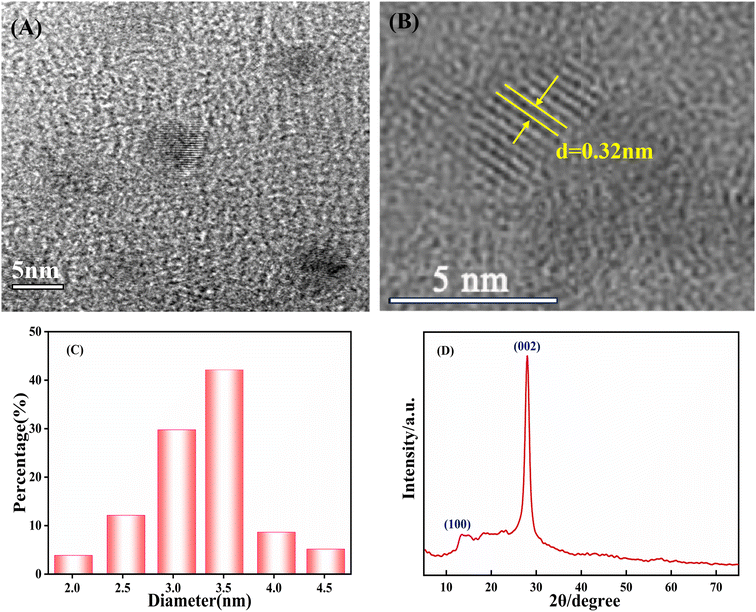 | ||
| Fig. 2 (A) TEM images, (B) HR-TEM images, (C) particle size distribution histogram, and (D) XRD of the prepared g-CNQDs. | ||
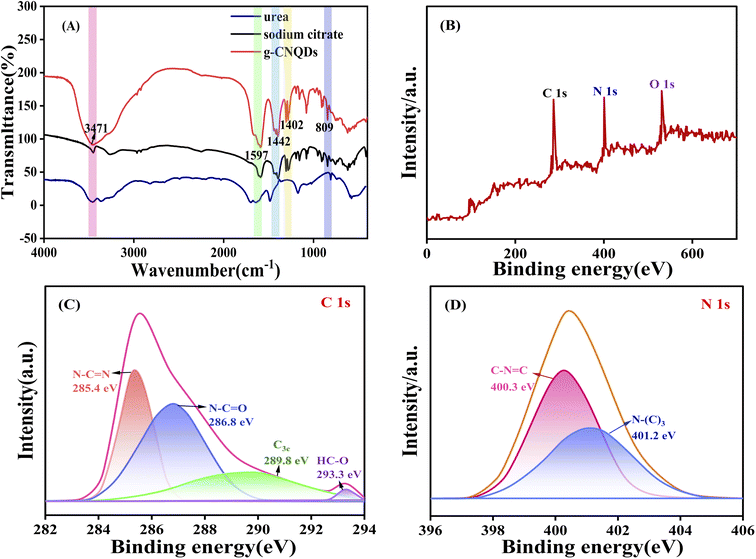
The surface functional groups of the prepared g-CNQDs were further measured using FT-IR spectroscopy, as shown in Fig. 3A. According to the obtained data, the absorption peak near 811 cm−1 was due to the stretching vibration of C–N in the triazine ring.32 The absorption bands at 1402 and 1442 cm−1 were attributed to the typical stretching vibrations of C![[double bond, length as m-dash]](https://www.rsc.org/images/entities/char_e001.gif) N and C–N bonds on the C–N heterocycles, respectively. The absorption peaks at 3300–3500 cm−1 were attributed to the stretching vibrations of N–H and O–H. The high-intensity peak at 1590 cm−1 was associated with the C
N and C–N bonds on the C–N heterocycles, respectively. The absorption peaks at 3300–3500 cm−1 were attributed to the stretching vibrations of N–H and O–H. The high-intensity peak at 1590 cm−1 was associated with the C![[double bond, length as m-dash]](https://www.rsc.org/images/entities/char_e001.gif) O asymmetric stretching vibration of the carboxylate anion.33 The results indicated that the surfaces of g-CNQDs were modified by amino and hydroxyl groups, which endowed g-CNQDs with good water solubility.
O asymmetric stretching vibration of the carboxylate anion.33 The results indicated that the surfaces of g-CNQDs were modified by amino and hydroxyl groups, which endowed g-CNQDs with good water solubility.
The elemental composition and oxidation states of g-CNQDs were further investigated using XPS. As shown in Fig. 3B, the three XPS peaks at 286.2, 400.5, and 530.8 were attributed to C 1s, N 1s, and O 1s, respectively, indicating the presence of carbon, nitrogen, and oxygen atoms in g-CNQDs. In addition, high-resolution XPS characterization was performed for C 1s and N 1s. The HR-XPS spectra of C 1s in Fig. 3C show three main peaks in 285.4 eV, 286.8 eV, and 289.8 eV. The characteristic peaks at 285.4 eV and 286.8 eV were attributed to N–C![[double bond, length as m-dash]](https://www.rsc.org/images/entities/char_e001.gif) N and N–C
N and N–C![[double bond, length as m-dash]](https://www.rsc.org/images/entities/char_e001.gif) O, respectively. While the peak at 289.8 eV was attributed to C3c. A smaller peak at 293.3 eV was attributed to HC–O.34 The HR-XPS spectra of N 1s in Fig. 3D show that the N 1s peak was split into two peaks, indicating the presence of two different types of nitrogen in g-CNQDs. The peak at 400.3 eV shows the presence of C–N
O, respectively. While the peak at 289.8 eV was attributed to C3c. A smaller peak at 293.3 eV was attributed to HC–O.34 The HR-XPS spectra of N 1s in Fig. 3D show that the N 1s peak was split into two peaks, indicating the presence of two different types of nitrogen in g-CNQDs. The peak at 400.3 eV shows the presence of C–N![[double bond, length as m-dash]](https://www.rsc.org/images/entities/char_e001.gif) C, indicating nitrogen bonded to two carbon atoms. The characteristic peak at 401.2 eV was attributed to quaternary nitrogen bonded by three sp2 carbon atoms, called graphitic nitrogen.35 The ratio of N1/N2 was 1
C, indicating nitrogen bonded to two carbon atoms. The characteristic peak at 401.2 eV was attributed to quaternary nitrogen bonded by three sp2 carbon atoms, called graphitic nitrogen.35 The ratio of N1/N2 was 1![[thin space (1/6-em)]](https://www.rsc.org/images/entities/char_2009.gif) :
:![[thin space (1/6-em)]](https://www.rsc.org/images/entities/char_2009.gif) 40, which was close to the triazine-based graphitized C3N4. The above results indicate that g-CNQDs based on the C3N4 structure of the graphite phase were synthesized successfully.
40, which was close to the triazine-based graphitized C3N4. The above results indicate that g-CNQDs based on the C3N4 structure of the graphite phase were synthesized successfully.
3.2 Optical properties of g-CNQDs
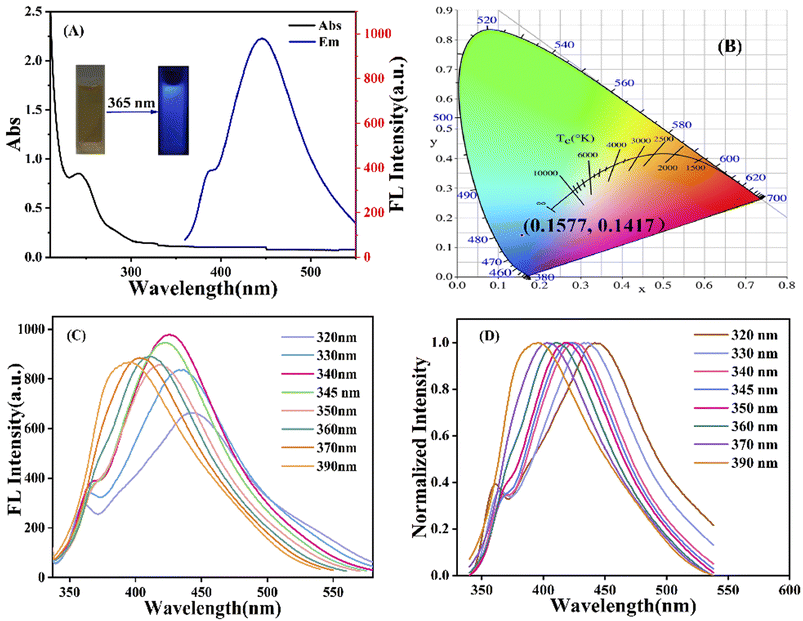
The optical properties of g-CNQDs were investigated using UV-Vis absorption spectroscopy and fluorescence spectroscopy. The UV-Vis absorption spectra of g-CNQDs were studied, as shown in Fig. 4A. The absorption peak at 254 nm in the black line was attributed to the n–π* transition between OH and C–N– on the surface of g-CNQDs.36 The fluorescence emission spectrum is represented by the blue line. It is displayed that the maximum fluorescence emission wavelength was obtained at 446 nm when the excitation wavelength of the g-CNQDs solution was 340 nm. The inset illustration indicated that the aqueous solution of g-CNQDs was yellow in visible light (left) and produced blue fluorescence under 365 nm UV light (right), indicating that the fluorescence was derived from the synthesized g-CNQDs. The CIE colour coordinates were simulated (0.1577, 0.1417) using simulation software. The dependence of the excitation wavelength was also examined, as shown in Fig. 4C. The fluorescence intensity initially increased with the increase of the excitation wavelength. The corresponding fluorescence emission intensity showed a decreasing trend when the excitation wavelength reached 340 nm. This meant that the fluorescence emission peak of g-CNQDs had a good excitation wavelength dependence. Fig. 4D shows the normalized fluorescence emission spectra of g-CNQDs at the excitation wavelength of 320–390 nm. The experimental results further proved that the position of the fluorescence emission peak of g-CNQDs gradually redshifted with the increasing excitation wavelength in the range of 320–390 nm.3.3 Study on fluorescence spectral stability of g-CNQDs
In addition, the fluorescence stabilities of g-CNQDs are essential for chemical sensing applications. The effect of NaCl solutions with different concentrations on the fluorescence intensity of g-CNQDs was studied, as shown in Fig. S1A.† Experiments showed that there was no significant change in fluorescence intensity when the concentrations of NaCl solutions were in the range from 0.25 to 1.5 M. At the same time, in order to investigate the antioxidant activity of g-CNQDs, the fluorescence intensity was detected by adding different concentrations of H2O2 to the g-CNQDs solution, as shown in Fig. S1B.† The results indicated that the fluorescence intensity of g-CNQDs maintained strong stability in the concentration range from 0 to 500 μM H2O2. In addition, the effects of temperature and UV radiation on the fluorescence intensity of g-CNQDs were also investigated. As can be seen from Fig. S1C,† there was no significant change in the fluorescence intensity of g-CNQDs when the temperature was changed from 25 to 55 °C, indicating that the g-CNQDs had a strong ability to withstand high temperatures. As shown in Fig. S1D,† g-CNQDs still had good photostability even after 90 min of continuous UV irradiation. In conclusion, the prepared g-CNQD fluorescence sensor has excellent resistance to high temperature, salt, oxidation, and photobleaching, which demonstrates that g-CNQDs have good potential for application in the analysis of complex samples.3.4 Construction of sensing system
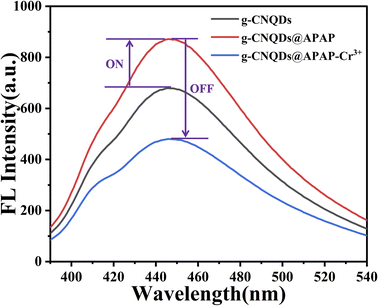
Using g-CNQDs as fluorescent probes, the fluorescence intensity of g-CNQDs was enhanced based on the synergistic effect between p-acetaminophenol and g-CNQDs. The enhanced fluorescence intensity was further quenched based on the specific reaction between the p-acetaminophenol and Cr3+ when Cr3+ was further introduced into g-CNQDs@p-acetaminophenol (Fig. 5). Therefore, a fluorescence sensing system for Cr3+ was constructed based on g-CNQDs@p-acetaminophenol.3.5 Optimization of analysis parameters
In order to explore the chemical stability of g-CNQD aqueous solution and the sensitivity of the detection method, the effects of the pH of the buffer solution, concentration of p-acetaminophenol, reaction time between g-CNQDs and p-acetaminophenol, and reaction time between Cr3+ and p-acetaminophenol on the fluorescence intensity of g-CNQDs were investigated. The optimization of the experimental conditions was carried out to select the best parameters for the detection of complex samples.Different pH values of the phosphate buffer solution may have a significant effect on the fluorescence intensity of the fluorescence sensing system. Considering that the buffer solution affects the fluorescence intensity of g-CNQDs, different pH values of PBS were optimized in the fluorescence sensing system, as shown in Fig. S2.† The fluorescence intensity increased with pH increasing from 6 to 7.5. g-CNQDs exhibited the strongest fluorescence intensity when pH was 7.5. The fluorescence intensity gradually decreased with further increase in pH. Therefore, PBS with pH = 7.5 was used for the aqueous medium for further experimental studies.
In addition, as an intermediate bridge, the concentration of p-acetaminophenol and its interaction time with g-CNQDs also had a significant effect on the fluorescence intensity of the whole sensing system. Thus, the concentration of p-acetaminophenol and the reaction time of the advocated sensing system were optimized, as shown in Fig. S3.† It is easy to see that the fluorescence intensity of g-CNQDs was significantly enhanced when p-acetaminophenol was added to the g-CNQD fluorescence probe. The fluorescence intensity was proportional to the concentration of p-acetaminophenol. The fluorescence intensity reached the highest when the concentration was 1 mmol L−1. The corresponding fluorescence intensity will exceed the maximum value of the instrument when the concentration is further increased, therefore, 1 mmol L−1 p-acetaminophenol was selected as the optimal concentration. At the same time, the stability of the interaction time of p-acetaminophenol with g-CNQDs on the fluorescence intensity was also studied, as shown in Fig. S3B.† The results indicated that the fluorescence intensity of g-CNQDs was unstable in the range of 0–2 min. The fluorescence intensity of g-CNQDs tended to remain stable with the further extension of reaction time between p-acetaminophenol and g-CNQDs. Therefore, the optimal reaction time was chosen as 3 min.
The reaction time between p-acetaminophenol and Cr3+ was studied, as shown in Fig. S4.† The results indicated that the response of g-CNQDs@p-acetaminophenol to Cr3+ was very sensitive; the fluorescence quenching could be completed within 1 min, and the fluorescence intensity has a strong stability for 10 min.
3.6 Selectivity of the Cr3+ fluorescence sensing system
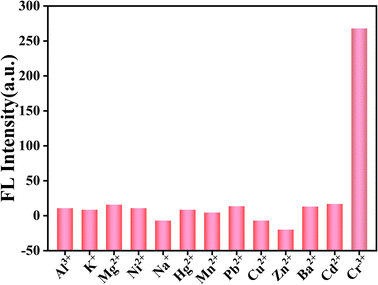
Selectivity experiments play an important role in the sensing system. Based on the excellent optical properties of g-CNQDs, the selectivity of g-CNQDs@p-acetaminophenol fluorescence sensing system was implemented. The effect of different ions on fluorescence intensity was further explored, as shown in Fig. 6. Some interfering ions (Al3+, K+, Mg2+, Ni2+, Na+, Hg2+, Mn2+, Pb2+, Cu2+, Zn2+, Ba2+, and Cd2+) were used as control solutions. Then, the above solutions were added sequentially to the optimized mixed solution for fluorescence detection. The results showed that only Cr3+ showed significant fluorescence quenching on the g-CNQDs@p-acetaminophenol system in the presence of 100 times the Cr3+ concentration of interfering ions. This meant that the effect of other ions on the fluorescence intensity was almost negligible. These results indicated that the g-CNQDs@p-acetaminophenol system has excellent selectivity for Cr3+.3.7 Construction of sensitivity and linear relation of the sensing system
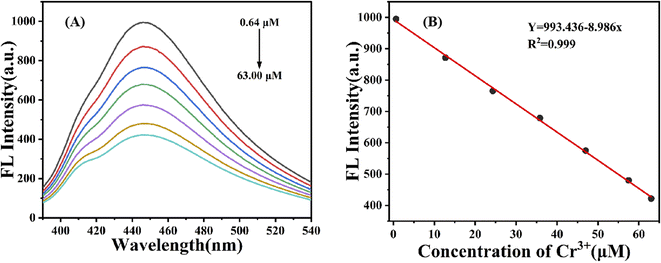
To further investigate the sensitivity of the g-CNQDs@p-acetaminophenol fluorescence sensing system to Cr3+, the quenching effect of different concentrations of Cr3+ in the solution was evaluated. Fig. 7A shows the corresponding changes in the fluorescence intensity of the sensor system after the addition of different concentrations of Cr3+. The fluorescence intensity of the sensing system gradually decreased with the increase in Cr3+ concentration. The concentrations were 0.64, 12.71, 24.3, 35.8, 47.0, 57.5, and 63.0. This phenomenon indicated that g-CNQDs@p-acetaminophenol system was sensitive to Cr3+ concentration, which further confirmed the sensitivity of Cr3+ as an “off” fluorescent probe.Furthermore, the linear relationship between the corresponding Cr3+ concentration in the range of 0.64–63.0 μM and the fluorescence intensity of the g-CNQDs@p-acetaminophenol system was studied, as shown in Fig. 7B. The linear equation of the standard curve by fitting was Y = 993.436 − 8.986x (R2 = 0.999) with the linear ranges of 0.64–63.0 μM, and the detection limit was calculated to be 0.23 μM by 3δ/k (δ: the blank standard deviation; k: the slope of the linear fitting curve equation).
3.8 Analysis performance comparison
In addition, to examine the sensing performance of the fluorescent sensor in this experiment, the detection limit and linear range of the present study system were compared with other methods reported in the literature for the determination of Cr3+. The results are shown in Table S1.† As can be seen from the chart, the fluorescence sensor designed in this study had a wide detection range and low detection limit compared with the other sensing systems. This means that the fluorescence sensing system designed in this study can be applied to the detection of Cr3+ in complex environments, and it has potential application prospects in the long run.3.9 Exploration of the fluorescence detection mechanism
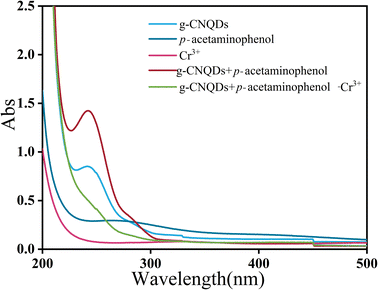
In order to verify the “on–off” mechanism in this sensing system, the UV-visible absorption spectra of g-CNQDs, p-acetaminophenol, Cr3+, g-CNQDs@p-acetaminophenol, and g-CNQDs@p-acetaminophenol–Cr3+ were studied. As shown in Fig. 8, neither p-acetaminophenol nor Cr3+ exhibited UV-visible absorption. Only g-CNQDs had a distinct UV-visible absorption peak at 254 nm. The UV-visible absorbance at 254 nm significantly increased when p-acetaminophenol was added to g-CNQDs. In the corresponding fluorescence spectrum, p-acetaminophenol also enhanced the fluorescence intensity of g-CNQDs. These phenomena suggest a possible synergistic effect between g-CNQDs and p-acetaminophenol. Therefore, the fluorescence signal of g-CNQDs is in the “on” state at this moment. The UV-visible absorbance peak at 254 nm was significantly reduced when Cr3+ was added to the g-CNQDs@p-acetaminophenol system. The corresponding fluorescence spectrum of g-CNQDs@p-acetaminophenol was also significantly reduced. These phenomena further prove that photoinduced electron transfer (PET) may have occurred with the addition of Cr3+. Therefore, the fluorescence signal of g-CNQDs is in the “off” state at this moment. Subsequently, the “on–off” fluorescence sensing system of g-CNQDs was constructed to realize the rapid detection of Cr3+.3.10 Application of actual samples
Cr3+ is an essential trace element for the human body, which is a critical element for normal growth and development, and regulation of blood glucose. Therefore, it is necessary to evaluate the feasibility of the g-CNQDs@p-acetaminophenol fluorescence sensor for the detection of Cr3+ in actual samples. The accuracy and reproducibility of this analytical method were estimated by the standard recovery test. The fluorescence analysis of Cr3+ in tap water, bottled water, and river water was performed under optimized conditions. The experimental results are presented in Table 1. The recovery rates of Cr3+ were 97.40% to 103.87%. The above results indicated that the fluorescence quenching sensor for the quantitative detection of Cr3+ was accurate, reliable, and reproducible, and could be applied to the detection of Cr3+ in actual biological samples.4 Conclusions
In summary, g-CNQDs were synthesized using a modified low-temperature solid-phase reaction. The prepared g-CNQDs were of uniform size, good dispersion, and excellent water solubility. The g-CNQDs@p-acetaminophenol fluorescence sensing system showed remarkable selectivity for the detection of Cr3+. Further studies showed that g-CNQDs exhibited good salt tolerance and oxidation resistance in NaCl and H2O2 solutions. Meanwhile, based on the photoinduced electron transfer effect between Cr3+ and g-CNQDs@p-acetaminophenol can be used as a fluorescent sensor for the quantitative detection of Cr3+. The established fluorescence analysis method could be used for the detection of actual samples through the recovery of the added standards, indicating that this fluorescence sensing system was expected to be used for the real-time monitoring of Cr3+ in complex samples. Therefore, the sensor system has important practical significance for future applications in biological detection and environmental analysis.Author contributions
Xiaohua Xu: edited the manuscript, experimental scheme design, and formal analysis. Huye Li: conceptualization, experimental scheme design, reviewed the manuscript, and supervised the project. Yapeng Sun: formal analysis and edited the manuscript. Tianfeng Ma: experimental scheme design, performed the experiments and formal analysis. Lin Shi: experimental scheme design, performed the experiments and formal analysis. Wencheng Mu: experimental scheme design and formal analysis. Huan Wang: edited the manuscript and reviewed the manuscript. Yongchang Lu: reviewed the manuscript and supervised the project. All authors have read and agreed to the published version of the manuscript.Conflicts of interest
The authors declare no conflict of interest.Acknowledgements
This work was supported by the Natural Science Foundation of Qinghai Province, China (Grant No. 2019-ZJ-944Q); Phytochemistry Key Laboratory of Tibetan Plateau of Qinghai Province, China; the Provincial Thousand Talents Program of High-level Innovation Talent, China; the Key Laboratory of Protection, Development, and Utilization of Tibetan Medicine Resources on Qinghai-Tibet Plateau, State Ethnic Affairs Commission, China; Qinghai Nationalities University Postgraduate Innovation Project, China; the University-level Planning Project of Qinghai Nationalities University of Qinghai Province in China (Grant No. 2021XJGH16); and the Innovation Team of Medicinal Material Resource Protection and High-value Utilization in Qinghai Province (Grant No. 2021XJPI02).References
- X.-M. Tian, S.-L. Yao, C.-Q. Qiu, T.-F. Zheng, Y.-Q. Chen, H. Huang, J.-L. Chen, S.-J. Liu and H.-R. Wen, Inorg. Chem., 2020, 59, 2803–2810 CrossRef CAS PubMed.
- W. Cheng, P. Tang, X. He, X. Xing, S. Liu, F. Zhang, X. Lu and L. Zhong, Anal. Bioanal. Chem., 2021, 413, 2951–2960 CrossRef CAS PubMed.
- M.-J. Tsai, K.-S. Liao, L.-J. Hsu and J.-Y. Wu, J. Solid State Chem., 2021, 304, 122564 CrossRef CAS.
- Y. e. Yu, Y. Wang, H. Yan, J. Lu, H. Liu, Y. Li, S. Wang, D. Li, J. Dou and L. Yang, Inorg. Chem., 2020, 59, 3828–3837 CrossRef CAS PubMed.
- S. Paul, A. Manna and S. Goswami, Dalton Trans., 2015, 44, 11805–11810 RSC.
- U. Krishnan and S. K. Iyer, J. Photochem. Photobiol., A, 2022, 425, 113663 CrossRef CAS.
- L. Fishbein, Toxicol. Environ. Chem., 1987, 14, 73–99 CrossRef CAS.
- A. Sharma, D. Kapoor, J. Wang, B. Shahzad, V. Kumar, A. S. Bali, S. Jasrotia, B. Zheng, H. Yuan and D. Yan, Plants, 2020, 9, 100 CrossRef CAS PubMed.
- Z. Rahman and L. Thomas, Front. Microbiol., 2021, 11, 619766 CrossRef PubMed.
- R. T. Kapoor, M. F. B. Mfarrej, P. Alam, J. Rinklebe and P. Ahmad, Environ. Pollut., 2022, 119044 CrossRef CAS PubMed.
- A. Roig-Navarro, Y. Martinez-Bravo, F. Lopez and F. Hernandez, J. Chromatogr. A, 2001, 912, 319–327 CrossRef CAS PubMed.
- E. J. Arar and J. D. Pfaff, J. Chromatogr. A, 1991, 546, 335–340 CrossRef CAS PubMed.
- M. Zayed, B. Barsoum and A. E. Hassan, Microchem. J., 1996, 54, 72–80 CrossRef CAS.
- U. Atikarnsakul, P. Varanusupakul and W. Alahmad, Anal. Lett., 2018, 51, 983–997 CrossRef CAS.
- H. Hagendorfer and W. Goessler, Talanta, 2008, 76, 656–661 CrossRef CAS PubMed.
- F. Moreno, T. Garcia-Barrera and J. Gomez-Ariza, Analyst, 2010, 135, 2700–2705 RSC.
- N. Zhang, J. S. Suleiman, M. He and B. Hu, Talanta, 2008, 75, 536–543 CrossRef CAS PubMed.
- H. Chen, P. Du, J. Chen, S. Hu, S. Li and H. Liu, Talanta, 2010, 81, 176–179 CrossRef CAS PubMed.
- E. Yilmaz and M. Soylak, Talanta, 2016, 160, 680–685 CrossRef CAS PubMed.
- M. Sugiyama, O. Fujino, S. Kihara and M. Matsui, Anal. Chim. Acta, 1986, 181, 159–168 CrossRef CAS.
- S.-I. Ohira, K. Nakamura, M. Chiba, P. K. Dasgupta and K. Toda, Talanta, 2017, 164, 445–450 CrossRef CAS PubMed.
- X. Tang, H. Yu, B. Bui, L. Wang, C. Xing, S. Wang, M. Chen, Z. Hu and W. Chen, Bioact. Mater., 2021, 6, 1541–1554 CrossRef CAS PubMed.
- J. Wang, Y. Zhou, G. Si, G. Xu, S. Zhou and X. Xue, J. Inorg. Biochem., 2023, 112302 CrossRef CAS PubMed.
- L. Wang, D. Xu, J. Gao, X. Chen, Y. Duo and H. Zhang, Sci. China Mater., 2020, 63, 1631–1650 CrossRef CAS.
- Q. Fan, A. Dehankar, T. K. Porter and J. O. Winter, Coatings, 2021, 11, 895 CrossRef CAS.
- X. Xiang, L. Tian, X. Zhu, Y. Zhong, C. Xiao, L. Chen and S.-F. Zhou, J. Electrochem. Soc., 2022, 169, 117507 CrossRef CAS.
- S. Deshmukh, K. Pawar, V. Koli and P. Pachfule, Acs Appl. Bio Mater., 2023, 6, 1339–1367 CrossRef CAS PubMed.
- Q. Huang, Q. Bao, C. Wu, M. Hu, Y. Chen, L. Wang and W. Chen, J. Pharm. Anal., 2022, 12, 104–112 CrossRef PubMed.
- S. Guo, L. Zheng, W. He, C. Chai, X. Chen, S. Ma, N. Wang, M. M. Choi and W. Bian, Arabian J. Chem., 2023, 16, 104520 CrossRef CAS.
- Z. Liu, X. Zhang, X. Ge, L. Hu and Y. Hu, Sens. Actuators, B, 2019, 297, 126790 CrossRef CAS.
- Q. Cheng, X. Liu, Y. He, Y. Ge, J. Zhou and G. Song, J. Fluoresc., 2019, 29, 719–726 CrossRef CAS PubMed.
- T. Sun, X. Yu, S. Zhong, L. Xu and Y. Zhao, J. Mater. Sci., 2020, 55, 15152–15166 CrossRef CAS.
- S. Feng, F. Pei, Y. Wu, J. Lv, Q. Hao, T. Yang, Z. Tong and W. Lei, Spectrochim. Acta, Part A, 2021, 246, 119004 CrossRef CAS PubMed.
- H. Xie, Y. Fu, Q. Zhang, K. Yan, R. Yang, K. Mao, P. K. Chu, L. Liu and X. Wu, Talanta, 2019, 196, 530–536 CrossRef CAS PubMed.
- Y.-L. T. Ngo, J. S. Chung and S. H. Hur, Dyes Pigm., 2019, 168, 180–188 CrossRef.
- M. Devi, P. Das, P. K. Boruah, M. J. Deka, R. Duarah, A. Gogoi, D. Neog, H. S. Dutta and M. R. Das, J. Environ. Chem. Eng., 2021, 9, 104803 CrossRef CAS.
Footnote |
| † Electronic supplementary information (ESI) available. See DOI: https://doi.org/10.1039/d3ra05091b |
| This journal is © The Royal Society of Chemistry 2023 |

