
 Open Access Article
 This Open Access Article is licensed under a
 Creative Commons Attribution 3.0 Unported Licence
Deciphering the electrochemical sensing capability of novel Ga12As12 nanocluster towards chemical warfare phosgene gas: insights from DFT†
Muhammad Javeda,
Muhammad Usman Khan *a,
Riaz Hussain*a,
Sarfraz Ahmedb and
Tansir Ahamadc
*a,
Riaz Hussain*a,
Sarfraz Ahmedb and
Tansir Ahamadc
aDepartment of Chemistry, University of Okara, Okara-56300, Pakistan. E-mail: usman.chemistry@gmail.com; usmankhan@uo.edu.pk; riazhussain@uo.edu.pk
bWellman Center for Photomedicine, Harvard Medical School, Massachusetts General Hospital, Boston, MA 02114, USA
cDepartment of Chemistry, College of Science, King Saud University, Saudi Arabia
First published on 2nd October 2023
Abstract
The applications of 3D inorganic nanomaterials in environmental and agriculture monitoring have been exploited continuously; however, the utilization of semiconductor nanoclusters, especially for detecting warfare agents, has not been fully investigated yet. To fill this gap, the molecular modelling of novel inorganic semiconductor nanocluster Ga12As12 as a sensor for phosgene gas (highly toxic for living things and the environment) is accomplished employing benchmark DFT and TD-DFT investigations. Computational tools have been applied to explore different adsorption sites and the potential sensing capability of the Ga12As12 nanoclusters. The calculated adsorption energy (−21.34 ± 2.7 kcal mol−1) for ten selected complexes, namely, Pgn–Cl@4m-ring (MS1), Pgn–Cl@6m-ring (MS2), Pgn–Cl@XY66 (MS3), Pgn–O@4m-ring (MS4), Pgn–O@XY66 (MS5), Pgn–O@XY64 (MS6), Pgn–O@Y (MS7), Pgn–planar@Y (MS8), Pgn–planar@X (MS9), and Pgn–planar@4m-ring (MS10), manifest the remarkable and excessive adsorption response of the studied nanoclusters. The explored molecular electronic properties, such as interaction distance (3.05 ± 0.5 Å), energy gap (∼2.17 eV), softness (∼0.46 eV), hardness (1.10 ± 0.01 eV), electrophilicity index (10.27 ± 0.45 eV), electrical conductivity (∼1.98 × 10⁹), and recovery time (∼3 × 10⁻¹² s−1) values, ascertain the elevated reactivity and an imperishable sensitivity of the Ga12As12 nanocluster, particularly for its complex MS8. QTAIM analysis exhibits the presence of a strong electrostatic bond (positive ∇2ρ(r) values), electron delocalization (ELF < 0.5), and a strong chemical bond (because of high all-electron density values). In addition, NBO analysis explores the lone pair electron delocalization of phosgene to the nanocluster stabilized by intermolecular charge transfer (ICT) and different kinds of non-covalent interactions. Also, the green region existence expressed by NCI analysis (between the nanocluster and adsorbate) stipulate the energetic and dominant interactions. Furthermore, the UV-Vis, thermodynamic analysis, and density of state (DOS) demonstrate the maximum absorbance (562.11 nm) and least excitation energy (2.21 eV) by the complex MS8, the spontaneity of the interaction process, and the significant changes in HOMO and LUMO energies, respectively. Thus, the Ga12As12 nanocluster has proven to be a promising influential sensing material to monitor phosgene gas in the real world, and this study will emphasize the informative knowledge for experimental researchers to use Ga12As12 as a sensor for the warfare agent (phosgene).
Introduction
Warfare agents are a serious threat towards populations, mainly in urban areas. They are more toxic, reactive, and mostly produced in industries. Phosgene gas, having the molecular formula COCl2, is one of the most poisonous warfare agents and was used in World War I as a chemical weapon.1 It can be used to produce polyurethanes, isocyanate, plastics, dyes, pesticides, and pharmaceutical products. It is also used in the industry as a protective gas to produce dimethyl diphenyl urea. The annual production of phosgene is about 2 million tons, which is used to produce fine chemicals and polymers. It is very dangerous to store, transport, and utilize phosgene gas due to its high volatility and toxicity.2,3 Phosgene gas attained a reputation for the first time when its exposure caused about 80% of deaths due to all warfare agents during World War I. It can cause irritation in the mucosal membrane and lung damage when its concentration is below 3 ppm, but at high concentration above 150 ppm, it can cause latent non-cardiogenic pulmonary edema, and it is also life-threatening.4,5In the recent 20 years, after the discovery of carbon-based nanoparticles and nanoclusters, several efforts have been made to discover other nanoparticles that include metallic nanoparticles, ceramic-type nanoparticles, and semiconductor nanoparticles.6 These nanoparticles have gained more attention from researchers to detect, absorb, and destroy more toxic chemicals and warfare agents because of their unique properties.7 The porous surfaces, the large surface-to-volume ratio, and the optical, electrical, mechanical, and magnetic properties of these nanoparticles make them unique. The particles also have a large HOMO–LUMO gap and special chemical and physical properties.8 Therefore, they have a wide range of applications in the chemical industry, medicine, electronics, and aviation. The most important application of these nanoparticles and nanoclusters is because of their sensing property to detect and absorb poisonous and toxic gases and warfare agents.9 The sensing property, reactivity, physical and chemical properties, and molecular structure of nanoparticles and nanoclusters are examined by density functional theory (DFT).10–13
Literature review has shown the adsorption of toxic gases, especially warfare agents, by many fullerene-like inorganic nanoclusters due to their large HOMO–LUMO gap.14,15 The adsorption, sensing, and detection of phosgene gas by different nanomaterials have been investigated. For instance, Ti, Ni, and Cu-decorated borospherene nanocluster,16 Al12N12 nanocluster as a potential sensor,1 different angle oriented boron nitride (BN) nanocones with 60°, 120°, 180°, and 240° disclination angles,17 Sc-doped BN nanoclusters,18 pristine and Cu-decorated B12N12 nanocluster,19 and Ca12O12, Mg12O12, and Al12N12 nanomaterials20 have been investigated to be good sensing nanomaterials for phosgene gas.
Several inorganic nanoclusters such as B12P12,21 Ga12As12,22,23 and Al12P12 (ref. 24) have been investigated to explore their potential applications in non-linear optics,25,26 the photoelectrochemical solar energy conversion,27,28 and in sensing devices for the detection of wide range of chemicals.29,30 These fullerene-like nanoclusters have been found to show intermolecular interactions with diazomethane31 and for the adsorption of alkali and alkaline earth metals.32 They also exhibited interaction with halo-methane33 and used it for the adsorption of toxic gasses.19 They have been employed for 4-aminopyridine drug delivery and the adsorption of the sorbic acid drug using density functional theory.34,35
According to the best of our literature investigation and knowledge, no specific investigations has been fully done regarding the sensing capability of the Ga12As12 nanocluster for toxic chemical warfare agents because the detection of dangerous chemical warfare agents by a fast and accurate method is the need of current situation, which urged us to investigate the potential sensing of the Ga12As12 nanocluster toward phosgene gas. For this purpose, the sensing and adsorption of phosgene gas with different orientations on different adsorption sites of Ga12As12 nanocluster have been studied comprehensively by applying benchmark DFT and TD-DFT computations.
Various analyses such as HOMO–LUMO, natural bond orbitals (NBO), quantum theory of atoms in a molecule (QTAIM), non-covalent interactions (NCI), molecular electrostatic potential (MEP), density of state (DOS), and thermodynamic analysis have been conducted to investigate the intermolecular interactions and charge distributions between the Ga12As12 nanocluster and phosgene gas and to elucidate the sensing capability of the Ga12As12 nanocluster. With the evidence of the current investigations, it is optimistically proposed that the Ga12As12 nanocluster will be utilized as an excellent and potential sensor for phosgene gas detection.
Computational studies
In the current research, the geometry optimization, frequency analysis, interaction energy, HOMO–LUMO energy gap, and Fermi level energy calculations of the Ga12As12 nanocluster and its ten selected complexes (MS1–MS10) were performed using DFT and TD-DFT at the B3LYP-D3/6-31G(d,p) level of theory using GaussView and Gaussian 09 suite of programs.36,37 This B3LYP-D3/6-31G(d,p) level of theory was selected by comparing the bond length of the optimized structure of the nanocluster by different functionals with the already reported data.32 Utilizing the same functional, the NBO38 and MEP analyses were performed to analyze the charge distributions of the nanocluster complexes and the net charge on phosgene gas. The DOS analysis of the nanocluster and complexes was performed using the Multiwfn 3.8 program.39 To find out the electronic transition within the nanocluster and complexes, HOMO–LUMO plots have been obtained using the Avogadro-1.2.0 program.40 The topological analysis quantum theory of atoms in molecules (QTAIM) and non-covalent interactions (NCI) analysis was used to attain more insights into the nature of the inter-atomic interactions visual molecular dynamic (VMD) 1.9.4 program.41 The computations of QTAIM were done via Multiwfn 3.8 program.39 A mathematical method named thermodynamic analysis (TDA) was applied to study spontaneous and non-spontaneous behavior of the system based on the interaction of work and heat with chemical reactions and variations in the physical state through the law of thermodynamics.42,43Results and discussion
Selection of the method
The Ga12As12 nanocluster was optimized by applying three reported and widely used functionals of DFT, namely, CAM-B3LYP,44 B3LYP-D3,45 and ωB97XD,46 assigned with the 6-31G(d,p) basis set. The functional CAM-B3LYP demonstrates long-range interactions but does not provide dispersion correction and charge transfer excitations to a fine extent. To obtain long-range interactions and form dispersion correction, the ωB97XD functional was developed by Head-Gordon et al.46 The bond lengths of all the different sides of the nanocluster have been calculated and compared with the already reported data, as shown in Table 1.| Module | ML-2.420a | MR2.423a | T-2.417a | TL-2.484b | TR-2.480b | RB-2.426b | RC-2.484b |
|---|---|---|---|---|---|---|---|
| a XY64 sides of the nanocluster.b XY66 sides of the nanocluster, ML = mid left, MR = mid right, T = top, TL = top left, TR = top right, RB = rim B, RC = rim C. | |||||||
| B3LYP-D3 | 2.33711 | 2.33711 | 2.33711 | 2.42042 | 2.42042 | 2.33711 | 2.42042 |
| CAMB3LYP | 2.32197 | 2.32197 | 2.32197 | 2.39467 | 2.39467 | 2.32197 | 2.39467 |
| ωB97XD | 2.31803 | 2.31803 | 2.31803 | 2.39027 | 2.39027 | 2.31803 | 2.39027 |
The calculated bond lengths of the nanocluster optimized using DFT with the functional B3LYP-D3 known as D3 and GD3 with the 6-31G(d,p) basis set were found to be consistent with previously published studies.31 Thus, this functional developed by Grimme et al. was selected as the most suitable method to investigate the sensing capability of the studied system. In order to compare the bond lengths of the nanocluster structure optimized by three different functionals with the reported data, the names of all the sites of the nanocluster were proposed and are represented in Fig. 1.
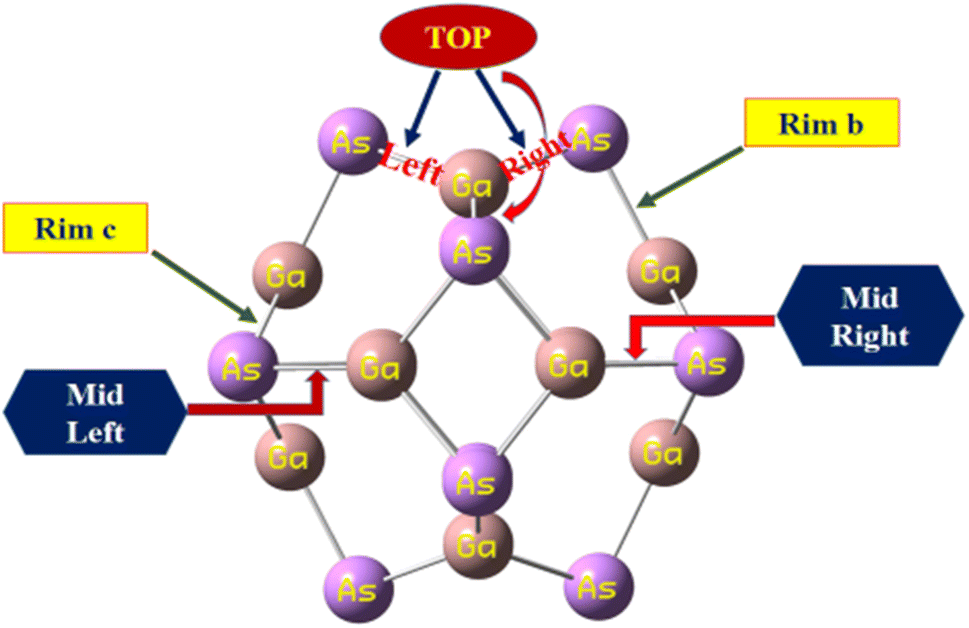 | ||
| Fig. 1 The proposed names of all the sites of the nanocluster to compare the bond lengths with the reported data. | ||
Geometry optimization
The geometry optimization of the Ga12As12 nanocluster, phosgene gas, and their possible complexes were carried out using DFT at the latest functional B3LYP-D3/6-31G(d,p) level of theory. The Ga12As12 nanocluster contains eight symmetric 6-membered rings and six symmetric 4-membered rings and has equal adsorption sites to sense any toxic and dangerous chemicals on their outer surface. The adsorption and sensing sites are classified as follows: on top of the X-atom, on top of the Y-atom, on top of the r-6 position, on top of the r-4 position, on top of the XY66 bond, and on top of the XY64 bond (Fig. 2a). After the optimization of the isolated nanocluster and phosgene gas, the gas is placed on the surface of the nanocluster on six different sites, as mentioned above, with three different orientations, namely, planar, oxygen toward the nanocluster, and chlorine toward the nanocluster. The gas is placed at a vertical distance between 4.7 and 5.0 Å on the outer surface of the nanocluster. | ||
| Fig. 2 The adsorption sites of the nanocluster (a), the optimized structure of the gas (b) and the nanocluster (c). | ||
The optimized geometry of the phosgene gas and bond lengths of the nanocluster were calculated from the optimized structures of the isolated Ga12As12 nanocluster obtained by the B3LYP-D3 and shown in Fig. 2b and c, respectively. By evaluating all possible doping sites of Ga12As12, a comprehensive investigation of the phosgene atoms interaction with Ga12As12 was carried out. Ten designed complexes with phosgene (Pgn) gas named as Pgn–Cl@4m-ring (MS1), Pgn–Cl@6m-ring (MS2), Pgn–Cl@XY66 (MS3), Pgn–O@4m-ring (MS4), Pgn–O@XY66 (MS5), Pgn–O@XY64 (MS6), Pgn–O@Y (MS7), Pgn–planar@Y (MS8), Pgn–planar@X (MS9), and Pgn–planar@4m-ring (MS10) were optimized to the true minima, as evidenced by all real frequencies. The final B3LYP-D3 optimized structures of nanocluster complexes, the interaction distances with the phosgene gas, and their bond lengths variations have been calculated and shown in Fig. 3. The interaction distance along with the interacting atoms between the nanocluster and the phosgene gas is calculated and expressed in Table S1 (ESI†). The complex having less interaction distance represents a relatively stronger interaction between the gas and the nanocluster and expresses an excellent sensing response and vice versa.
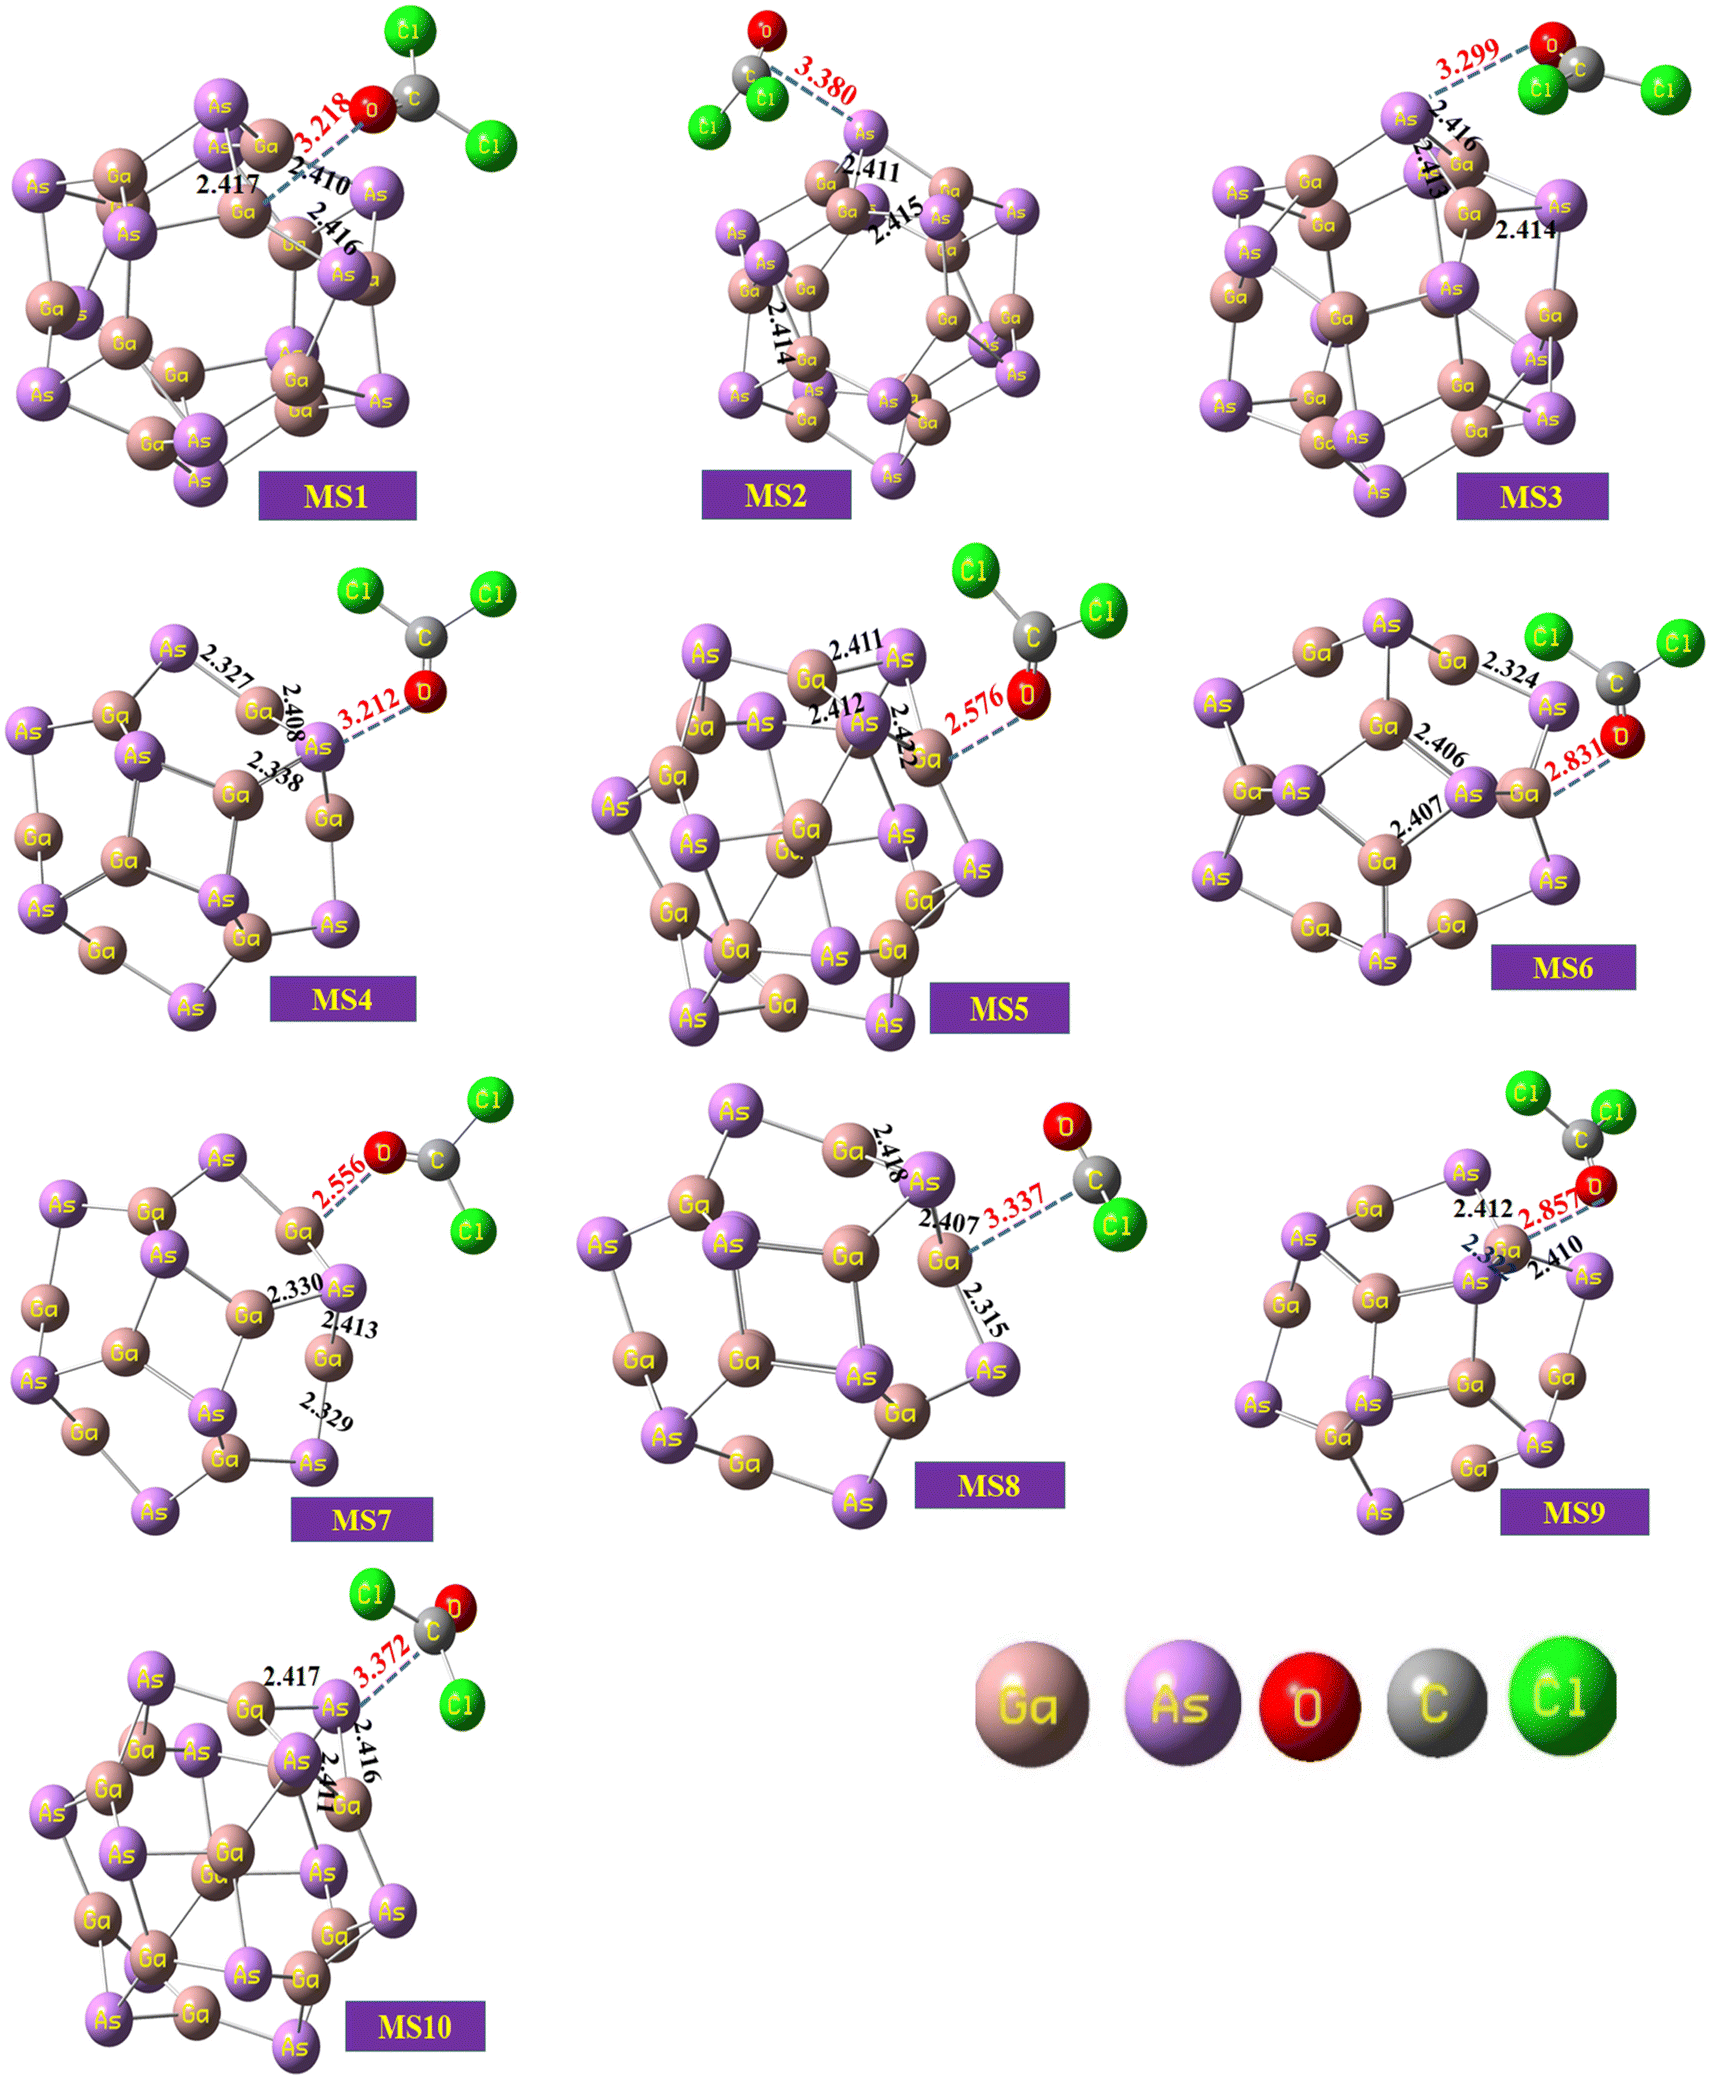 | ||
| Fig. 3 The optimized structures of the complexes of the studied system calculated at the B3LYP-D3/6-31G(d,p) level of theory. | ||
It has been observed that complexes MS5 and MS7 indicate the minimum interaction distances to express comparatively stronger interactions and reactivity while complexes MS2 and MS10 indicate maximum interaction distances between the phosgene gas and the surface of the Ga12As12 nanocluster. The bond distances of the nanocluster after the interaction of the gas are mentioned in Fig. 3 that can be compared with Fig. 2c to observe a variation as a result of interaction.
Adsorption studies
The interaction energy of the nanocluster complexes with phosgene gas has been calculated to improve its reliability and find out all possible interactions. The interaction energy of the gas with nanocluster was calculated by eqn (1)–(3).47,48| Eads = Ecomplex − Enanocage − Egas | (1) |
| EINT = Ecomplex − Enanocage − Egas + EBSSE | (2) |
| ΔEBSSE = ΔEsystem − ΔEsystem–complex − ΔEsystem–gas | (3) |
According to the above equation, the negative values of Eads represent the stability of the formed complex and the positive values of Eads represent the barrier in gas adsorption to the nanocluster. The interaction energy has been calculated by placing gas on the mentioned positions of the nanocluster. A minor difference in the interaction energy has been observed for the six possible positions for adsorption. Using gas with different orientations, such as planar, oxygen toward the nanocluster and chlorine toward the nanocluster, many identical results for Eads are obtained.49 One result of similar values is chosen to show interaction energies for corresponding adsorption sites with three different orientations of phosgene gas. Ten complexes have been selected out of eighteen due to having identical results of adsorption energy values; these results are shown in Table 2.
| Name | Eads | EBSSE | EINT |
|---|---|---|---|
| a EINT and Eads are in kcal mol−1 and BSSE in hartree. | |||
| MS1 | −24.04078 | 0.03223 | −3.81549 |
| MS2 | −22.29381 | 0.02839 | −4.47724 |
| MS3 | −20.27640 | 0.02722 | −3.19817 |
| MS4 | −18.64804 | 0.02473 | −3.13091 |
| MS5 | −20.52678 | 0.02545 | −4.55651 |
| MS6 | −21.27789 | 0.02649 | −4.65782 |
| MS7 | −20.62906 | 0.02556 | −4.59190 |
| MS8 | −21.82508 | 0.03014 | −2.56082 |
| MS9 | −21.47493 | 0.03129 | −2.19224 |
| MS10 | −20.54560 | 0.02753 | −3.26912 |
The selection of the site for adsorption has a minor effect on other sites of corresponding energy values as in the present work; the MS1 complex shows the highest adsorption response and better sensing capability toward phosgene gas while complex MS6 represents the highest counterpoise corrected interaction energy (EINT) among all the complexes of the nanocluster. The adsorption position showing high interaction energy values indicates better sensing capability of the nanocluster's complex. Among all the adsorption sites with three different orientations, the maximum difference in their adsorption energies for all the complexes is about 5.392 kcal mol−1.
Frontier molecular orbitals analysis
The highest occupied molecular orbitals (HOMO) and lowest unoccupied molecular orbitals (LUMO) have importance for a molecule and are named frontier molecular orbitals (FMOs). FMO analysis is very important as it determines the material's electronic behavior and optical characteristics.50,51 It also provides information about the material's electrical conductivity, electron distribution, stability, and sensing response.52 The reactivity and interaction of the gas with the nanocluster and many other properties are obtained from the HOMO–LUMO energy gap (Eg). The information about the transfer of charges and reactivity response of the system can be explored by the Eg values. The least energy gap values express a high electronic distribution from the donor to acceptor orbitals, which enhance the electrical conductivity of the corresponding complex. It has been also evidenced from the literature survey that the smaller Eg represents higher electrical conductivity, higher electron distribution, less stability, higher sensitivity, and vice versa.53For the current investigation, the graph expressing the HOMO and LUMO relation of the complexes along with energy gap is shown in Fig. 5. It has been observed that the complex MS8 having less energy gap indicates high electronic distribution, less stability, high electrical conductivity, and high sensitivity, while complexes MS5 and MS7 have higher energy gap and exhibit less electronic distribution, high stability, low electrical conductivity, and low sensitivity as compared to all other complexes. The FMO orbitals of the nanocluster and complexes have been obtained by the Avogadro software, and these are shown in Fig. 4 with the corresponding energy values and Eg values for each complex. Similar to the Eg values, the Fermi level energy and work function values also provide information about the stability and reactivity of the system. The work function is the amount of required energy for the loss of an electron from the Fermi level, where the Fermi level energy (Ef) is the amount of energy occupied by an electron at absolute zero temperature and can be calculated from the FMO orbitals, as given in eqn (4).54
 | (4) |
 | ||
| Fig. 4 The HOMO and LUMO plots along with their calculated energy gap (Eg) values for the studied nanocluster and complexes. | ||
 | ||
| Fig. 5 The graphical representation of HOMO/LUMO. | ||
The Ef and work function (Φ) values for the studied complexes are also affected due to the interaction of gas and are found to be different from the isolated nanocluster values. The Ef is calculated as the average of HOMO and LUMO energy values, and the work function (Φ) is taken as the negative of the Fermi level energy value because the electrostatic potential energy is equal to zero.55 The relation between work function and Fermi level energy is given by eqn (5)
| Φ = Vel(+,∞) − Ef | (5) |
Literature review has shown that the variation in the work function (Φ) values due to the interaction of gas produces a sound by influencing the gate voltage to detect gas.56 Also, the changes in the work function values demonstrate the transfer of charges between phosgene gas and the studied nanocluster. The minimum work function and Fermi level energy values are experienced by the complexes MS5 and MS7, as shown in Table 3.
| Name | EHOMO | ELUMO | Eg | Ef | Φ |
|---|---|---|---|---|---|
| a All factors are in electron volt (eV). | |||||
| Ga12As12 | −5.97 | −3.75 | 2.23 | −4.86 | 4.86 |
| MS1 | −5.89 | −3.69 | 2.21 | −4.79 | 4.79 |
| MS2 | −5.96 | −3.74 | 2.22 | −4.85 | 4.85 |
| MS3 | −5.92 | −3.69 | 2.22 | −4.80 | 4.80 |
| MS4 | −5.86 | −3.66 | 2.20 | −4.76 | 4.76 |
| MS5 | −5.81 | −3.57 | 2.24 | −4.69 | 4.69 |
| MS6 | −5.88 | −3.66 | 2.22 | −4.77 | 4.77 |
| MS7 | −5.81 | −3.57 | 2.24 | −4.69 | 4.69 |
| MS8 | −5.91 | −3.74 | 2.17 | −4.82 | 4.82 |
| MS9 | −5.89 | −3.68 | 2.22 | −4.78 | 4.78 |
| MS10 | −5.95 | −3.73 | 2.22 | −4.84 | 4.84 |
Global indices of reactivity
The HOMO and LUMO energies provide information about various reactive, electrical, and optical properties of a molecule, such as electron affinity (A), ionization potential (I), and electronegativity (χ), which is equal to the negative of chemical potential (μ) expressed by Koopmans' theorem.57,58 The chemical hardness (η) is associated with the difference in electron affinity, and ionization potential and inverse of chemical hardness provide electrophilicity index (ω).59 The softness (S) and ΔNmax are also obtained by the equations provided in the ESI.† ΔNmax is the maximum amount of electronic charge accepted by the system.60 These properties are calculated and listed in Table 4. The softness and hardness of the compound are obtained from the energy gap (Eg). The large energy gap represents the hardness of the compound, while the small energy gap shows the soft compound, and these energy gaps also provide information about the reactivity and sensitivity of the compound.61 The capability of the species to attract electrons toward itself is called electronegativity (A) while the ionization potential (I) is the required amount of energy for the loss of electrons from the surface of the compound.| Name | Eg | I | A | η | μ | s | ω | ΔNmax |
|---|---|---|---|---|---|---|---|---|
| a Here, Eg = energy gap, I = ionization potential, A = electron affinity, η = chemical hardness, μ = chemical potential, s = chemical softness, ω = electrophilicity index, N = electronic charge density. All parameters are in eV. | ||||||||
| Ga12As12 | 2.23 | 5.97 | 3.75 | 1.11 | −4.86 | 0.45 | 10.61 | 4.37 |
| MS1 | 2.21 | 5.89 | 3.69 | 1.10 | −4.79 | 0.45 | 10.38 | 4.34 |
| MS2 | 2.22 | 5.96 | 3.74 | 1.11 | −4.85 | 0.45 | 10.62 | 4.38 |
| MS3 | 2.22 | 5.92 | 3.69 | 1.11 | −4.80 | 0.45 | 10.38 | 4.32 |
| MS4 | 2.20 | 5.86 | 3.66 | 1.10 | −4.76 | 0.45 | 10.30 | 4.33 |
| MS5 | 2.24 | 5.81 | 3.57 | 1.12 | −4.69 | 0.45 | 9.82 | 4.19 |
| MS6 | 2.22 | 5.88 | 3.66 | 1.11 | −4.77 | 0.45 | 10.23 | 4.29 |
| MS7 | 2.24 | 5.81 | 3.57 | 1.12 | −4.69 | 0.45 | 9.82 | 4.19 |
| MS8 | 2.17 | 5.91 | 3.74 | 1.09 | −4.82 | 0.46 | 10.71 | 4.44 |
| MS9 | 2.22 | 5.89 | 3.68 | 1.11 | −4.78 | 0.45 | 10.32 | 4.31 |
| MS10 | 2.23 | 5.95 | 3.73 | 1.11 | −4.84 | 0.45 | 10.54 | 4.35 |
The literature survey shows that the system having higher values of ionization potential and chemical hardness indicates less reactivity and less sensitivity. In contrast, the system indicates high sensitivity and reactivity and less stability because of low ionization potential values and chemical hardness. Similar results have been observed in view of the chemical softness as the system indicates high sensitivity and less stability by having higher values of chemical softness and vice versa. Also, the electrophilicity index (ω) values for the nanocluster and the complexes demonstrate the capability of the fragment to attain electrons. It also provides information about the stabilization energy to gain many electrons by the chemical species.62,63 In the current study, complex MS8 indicates comparatively higher sensitivity and reactivity because of the low chemical hardness (1.09 eV), high chemical softness (0.46 eV), and high electrophilicity index (10.71 eV) among all the other complexes of the studied system to attain the high capability to attain electrons and high electronic distribution. In comparison, complexes MS5 and MS7 have high chemical hardness (1.12 eV), low chemical softness (0.45 eV), and low electrophilicity index (9.81 eV) and therefore indicate less sensitivity among all other complexes. This information is also correlated with FMO analysis results and expresses the better sensing response of the nanocluster. Because the energy gap (Eg) of the HOMO and LUMO orbitals of the nanocluster has been calculated to be 2.23 eV, the interaction of phosgene gas on the surface of the nanocluster reduces the energy gap to 2.22, 2.21, 2.20, and 2.17 eV on different adsorption sites. The reduction in the energy gap values expresses the enhanced interactions and reactivity of the Ga12As12 nanocluster toward phosgene gas.
NBO analysis
This analysis indicates natural bond orbitals (NBO) using stabilization energy named as 2nd order perturbation energy.64 This energy is useful for studying intermolecular and intramolecular charge transfer.65 The information about the distribution of electrons between atoms within the molecular bonds was developed by Weinhold et al.66 The information about the type of orbitals, interactions nature, and occupancy level present in between the occupied and virtual Lewis s orbitals are provided by NBO analysis.42,67 The stabilization energy is mathematically represented by eqn (6).
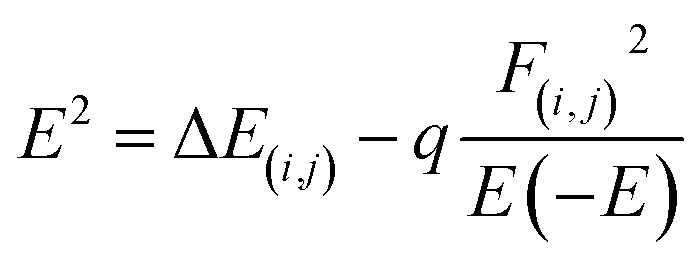 | (6) |
The diagonal elements are represented by Ei and Ej. The Fock matrix and donor occupancy are denoted by F(i,j) and q, respectively. The important transitions providing stabilization energy to the investigated systems are presented in Table 5 while the remaining transitions are mentioned in Table S2 (ESI†). RY (Rydberg) and Cr (center core pair) interaction values are not mentioned in the NBO data of the studied system because these values represent loosely bonded and weak interactions. For complex MS1, the prominent and highest stabilization energy values are 38.88 kcal mol−1 and 21.69 kcal mol−1 corresponding to the LP(O28) → σ*(C25–Cl27) and LP(Cl26) → π*(C25–O28) interactions, while the highest stabilization energy values for complex MS2 are 42.15 kcal mol−1 and 21.22 kcal mol−1, associated with by LP(O28) → σ*(C25–Cl26) and LP(Cl27) → π*(C25–O28) interactions, respectively.
| Type | Donor | Type | Acceptor | E2 (kcal mol−1) | E(j) − E(i) | F(i,j) |
|---|---|---|---|---|---|---|
| MS1 | ||||||
| LP | O28 | σ* | C25–Cl27 | 38.88 | 0.39 | 0.112 |
| LP | Cl26 | π* | C25–O28 | 21.69 | 0.29 | 0.073 |
| MS2 | ||||||
| LP | O28 | σ* | C25–Cl26 | 42.15 | 0.37 | 0.115 |
| LP | Cl27 | π* | C25–O28 | 21.22 | 0.3 | 0.073 |
| MS3 | ||||||
| LP | O28 | σ* | C25–Cl26 | 8.4 | 0.39 | 0.112 |
| LP | Cl26 | π* | C25–O28 | 3.39 | 0.28 | 0.075 |
| MS4 | ||||||
| LP | O28 | σ* | C25–Cl27 | 38.74 | 0.39 | 0.113 |
| LP | Cl27 | π* | C25–O28 | 23.33 | 0.28 | 0.075 |
| MS5 | ||||||
| LP | O28 | σ* | C25–Cl27 | 36.76 | 0.42 | 0.113 |
| LP | Cl26 | π* | C25–O28 | 23.41 | 0.29 | 0.076 |
| MS6 | ||||||
| LP | O28 | σ* | C25–Cl26 | 38.56 | 0.4 | 0.114 |
| LP | Cl27 | π* | C25–O28 | 24.14 | 0.28 | 0.075 |
| MS7 | ||||||
| LP | O28 | σ* | C25–Cl27 | 36.53 | 0.42 | 0.113 |
| LP | Cl26 | π* | C25–O28 | 25.62 | 0.27 | 0.077 |
| MS8 | ||||||
| LP | As13 | σ* | Ga6–As13 | 6.05 | 0.73 | 0.06 |
| LP | Cl26 | π* | C25–O28 | 19.66 | 0.31 | 0.071 |
| MS9 | ||||||
| LP | O28 | σ* | C25–Cl27 | 37.95 | 0.39 | 0.111 |
| LP | Cl26 | π* | C25–O28 | 20.89 | 0.3 | 0.073 |
| MS10 | ||||||
| LP | O28 | σ* | C25–Cl26 | 41.87 | 0.37 | 0.114 |
| LP | Cl27 | π* | C25–O28 | 21.37 | 0.29 | 0.073 |
The highest stabilization energy values for complex MS3 are 8.4 kcal mol−1 corresponding to the LP(O28) → σ*(C25–Cl26) interactions while the highest E2 values for complex MS4 are 38.74 kcal mol−1 and 23.33 kcal mol−1 associated with by the (O28) → σ*(C25–Cl27) and LP(Cl27) → π*(C25–O28) interactions, respectively. Similarly, the highest stabilization energy values for complex MS5 associated with LP(O28) → σ*(C25–Cl27) and LP(Cl26) → π*(C25–O28) interactions are 36.76 kcal mol−1 and 23.41 kcal mol−1 and for complex MS6 are 38.56 kcal mol−1 and 24.14 kcal mol−1 as a result of LP(O28) → σ*(C25–Cl26) and LP(Cl27) → π*(C25–O28) interactions, respectively. For complex MS7, the prominent and highest E2 values are 36.53 kcal mol−1 and 25.62 kcal mol−1 corresponding to the LP(O28) → σ*(C25–Cl27) and LP(Cl26) → π*(C25–O28) interactions, respectively, while the highest stabilization energy values for complex MS8 are 19.66 kcal mol−1, associated with LP(As13) → σ*(Ga6–As13) interactions. The complex MS9 with LP(O28) → σ*(C25–Cl27), LP(Cl26) → π*(C25–O28) interactions has the highest E2 values, which are 37.95 kcal mol−1 and 20.89 kcal mol−1, while for complex MS10, they are 41.87 kcal mol−1 and 21.37 kcal mol−1 from the LP(O28) → σ*(C25–Cl26) and LP(Cl27) → π*(C25–O28) interactions, respectively.
The above-mentioned transitions (lone pair to surface) ensure the effective delocalization of the electrons of chlorine and oxygen atom of phosgene to the entire studied system. These results also explore that the donor–acceptor interactions are stabilized by intermolecular charge transfer (ICT) and different kinds of non-covalent interactions (NCI). These interactions and transfer of charges in between the molecules are because of the electron delocalization of the oxygen and the chlorine lone pair of the phosgene to the sigma and pi anti-bonding orbitals of the studied nanocluster. For these interactions, the complexes MS2 and MS10 have the highest stabilization energies, as mentioned in Table 5. The charge transfer transitions from LP to the ring provide the clue of binding, interaction, and sensing capability. Because of these bond evidences, it can be explored that the NCI and ICT network is present in the studied system, which represents a synchronism of NBO that results with NCI analysis and QTAIM analysis.
QTAIM analysis
The analysis based on the quantum theory of atoms in a molecule, abbreviated as QTAIM, is useful for the topological study of the system. The QTAIM theory has been derived from Bader's theory.68 Its purpose was to investigate the molecule more deeply because the geometrical and electronic investigation of the system does not provide enough information to study the intermolecular interactions of the system. The information about the critical point properties of the system is provided by QTAIM analysis. The formation of complexes after interactions have been investigated by QTAIM analysis and the investigation data obtained are given in Table 6. The bond critical point, all electrons density ρ(r), electron density Laplacian, energy density, electronic charge density, and Hamiltonian and Lagrangian kinetic energies are the topological parameters denoted by BCP, ρ(r), ∇2ρ(r), E(r), V(r), H(r), and G(r), respectively, and obtained by QTAIM analysis.69,70 ∇2ρ(r) and ρ(r) is used to determine the critical bond points that represent the intermolecular bonds by the sharing of electrons between the atoms in a molecule.71| Interaction | BCP | ρ(r) | ∇2ρ(r) | G(r) | K(r) | V(r) | H(r) | |V(r)|/G(r) | ELF | ε |
|---|---|---|---|---|---|---|---|---|---|---|
| MS1 | ||||||||||
| Cl27–As21 | 40 | 0.00651 | 0.01905 | 0.00373 | −0.00104 | −0.00269 | 0.00104 | 0.72237 | 0.02952 | 0.55317 |
| As23–O28 | 48 | 0.00920 | 0.02787 | 0.00615 | −0.00082 | −0.00533 | 0.00082 | 0.86667 | 0.03425 | 0.79641 |
| As21–Cl26 | 62 | 0.00341 | 0.01999 | 0.00392 | −0.00108 | −0.00284 | 0.00108 | 0.72543 | 0.03119 | 0.35509 |
| O28–As19 | 71 | 0.01001 | 0.02974 | 0.00660 | −0.00083 | −0.00577 | 0.00083 | 0.87406 | 0.03911 | 0.80730 |
| MS2 | ||||||||||
| As19–Cl27 | 41 | 0.00619 | 0.01930 | 0.00369 | −0.00113 | −0.00256 | 0.00113 | 0.69334 | 0.02555 | 0.22728 |
| Cl27–As20 | 61 | 0.00718 | 0.02189 | 0.00426 | −0.00121 | −0.00306 | 0.00121 | 0.71704 | 0.00121 | 0.07491 |
| As13–C25 | 67 | 0.00812 | 0.02509 | 0.00497 | −0.00130 | −0.00366 | 0.00130 | 0.73743 | 0.03453 | 1.00327 |
| Ga2–Cl26 | 80 | 0.00680 | 0.01686 | 0.00360 | −0.00062 | −0.00298 | 0.00062 | 0.82793 | 0.03633 | 3.53518 |
| MS3 | ||||||||||
| As22–O28 | 45 | 0.00831 | 0.02506 | 0.00552 | −0.00075 | −0.00477 | 0.00075 | 0.86448 | 0.03043 | 0.04651 |
| Cl27–Ga10 | 52 | 0.00768 | 0.01911 | 0.00411 | −0.00067 | −0.00344 | 0.00067 | 0.83784 | 0.04164 | 0.94279 |
| O28–Als23 | 74 | 0.00822 | 0.02690 | 0.00537 | −0.00135 | −0.00402 | 0.00135 | 0.74792 | 0.03090 | 1.07179 |
| MS4 | ||||||||||
| Ga11–Cl26 | 47 | 0.00713 | 0.01810 | 0.00384 | −0.00069 | −0.00315 | 0.00069 | 0.82149 | 0.03734 | 1.79382 |
| As22–O28 | 73 | 0.01013 | 0.03043 | 0.00686 | −0.00075 | −0.00610 | 0.00075 | 0.89027 | 0.03784 | 0.41201 |
| As23–O28 | 74 | 0.01021 | 0.03058 | 0.00689 | −0.00076 | −0.00613 | 0.00076 | 0.89022 | 0.03846 | 0.40887 |
| MS5 | ||||||||||
| O28–Ga3 | 43 | 0.02119 | 0.06849 | 0.01752 | 0.00040 | −0.01792 | −0.00040 | 1.02292 | 0.06593 | 0.03493 |
| As16–Cl26 | 68 | 0.00685 | 0.02071 | 0.00402 | −0.00116 | −0.00287 | 0.00116 | 0.71274 | 0.02995 | 0.19027 |
| As15–Cl26 | 69 | 0.00714 | 0.02150 | 0.00419 | −0.00118 | −0.00302 | 0.00118 | 0.71880 | 0.03161 | 0.18004 |
| MS6 | ||||||||||
| Ga3–O28 | 48 | 0.01447 | 0.03910 | 0.00986 | 0.00008 | −0.00994 | −0.00008 | 1.00846 | 0.05889 | 0.82473 |
| As14–Cl27 | 68 | 0.00689 | 0.02115 | 0.00411 | −0.00118 | −0.00293 | 0.00118 | 0.71305 | 0.02929 | 0.19529 |
| As15–Cl27 | 71 | 0.00750 | 0.02313 | 0.00454 | −0.00124 | −0.00330 | 0.00124 | 0.72593 | 0.03190 | 0.24332 |
| Cl27–As17 | 87 | 0.00603 | 0.01886 | 0.00359 | −0.00113 | −0.00246 | 0.00113 | 0.68639 | 0.02480 | 0.32665 |
| MS7 | ||||||||||
| O28–Ga6 | 54 | 0.02204 | 0.07190 | 0.01849 | 0.00051 | −0.01900 | −0.00051 | 1.02766 | 0.06743 | 0.01111 |
| As19–Cl26 | 74 | 0.00716 | 0.02172 | 0.00424 | −0.00119 | −0.00304 | 0.00119 | 0.71862 | 0.03136 | 0.16373 |
| As18–Cl26 | 78 | 0.00717 | 0.02173 | 0.00424 | −0.00119 | −0.00305 | 0.00119 | 0.71863 | 0.03136 | 0.16392 |
| MS8 | ||||||||||
| As18–Cl26 | 37 | 0.00565 | 0.01598 | 0.00314 | −0.00086 | −0.00227 | 0.00086 | 0.72558 | 0.02607 | 2.79972 |
| As18–O28 | 41 | 0.00692 | 0.02124 | 0.00453 | −0.00078 | −0.00375 | 0.00078 | 0.82827 | 0.02466 | 1.02710 |
| O28–Ga6 | 52 | 0.00654 | 0.01944 | 0.00411 | −0.00075 | −0.00337 | 0.00075 | 0.81851 | 0.02480 | 0.09686 |
| O28–As19 | 57 | 0.00693 | 0.02126 | 0.00454 | −0.00078 | −0.00376 | 0.00078 | 0.82846 | 0.02468 | 1.01979 |
| Cl27–As19 | 69 | 0.00565 | 0.01598 | 0.00314 | −0.00086 | −0.00228 | 0.00086 | 0.72583 | 0.02609 | 2.82783 |
| MS9 | ||||||||||
| O28–Ga6 | 49 | 0.01322 | 0.03723 | 0.00910 | −0.00021 | −0.00889 | 0.00021 | 0.97728 | 0.05143 | 0.38964 |
| As19–Cl27 | 65 | 0.00687 | 0.02059 | 0.00405 | −0.00109 | −0.00296 | 0.00109 | 0.72987 | 0.02994 | 0.64918 |
| Cl27–As18 | 69 | 0.00502 | 0.01475 | 0.00283 | −0.00085 | −0.00198 | 0.00085 | 0.69850 | 0.02165 | 0.62355 |
| MS10 | ||||||||||
| Cl26–Ga11 | 43 | 0.00716 | 0.01739 | 0.00373 | −0.00062 | −0.00312 | 0.00062 | 0.83499 | 0.04002 | 1.65260 |
| C25–As22 | 51 | 0.00807 | 0.02531 | 0.00502 | −0.00131 | −0.00370 | 0.00131 | 0.73860 | 0.03330 | 0.78816 |
| Cl27–As23 | 71 | 0.00726 | 0.02172 | 0.00425 | −0.00118 | −0.00306 | 0.00118 | 0.72096 | 0.03265 | 0.47826 |
It has been shown in Table 6 that ∇2ρ(r) for all the complexes is positive. The positive Laplacian electron density indicates the strong electrostatic bond between the two bonded atoms.72 The all-electron density ρ(r) is used to determine the strength of the chemical bond between the gas and the cage. Its positive values show the closed shell interactions, and the higher value of all electron density values indicates the greater strength of the chemical bond and vice versa.
The comparatively strong chemical bond has been observed in complex MS7 and the weak chemical bond in complex MS8 due to the comparatively higher and lower values of electron density, respectively, while all the other complexes have intermediate values of electron density, as shown in Table 6. The division of the chemical bond of the complexes into strong covalent, partial covalent, and non-covalent is achieved by the values of both ∇2ρ(r) and H(r). For the strong covalent, ∇2ρ(r) < 0, H(r) < 0. For the partial covalent, ∇2ρ(r) > 0, H(r) < 0, and for non-covalent, ∇2ρ(r) > 0, H(r) > 0.
It has been shown in Table 6 that the complexes MS5, MS6, and MS7 indicate partially covalent interactions while all the other complexes indicate weak covalent or non-covalent interactions. Furthermore, the energy densities of the bonds explain the nature and strength of interactions in the complex.73 The ratio between Hamiltonian kinetic energy values and absolute values of electronic charge density is represented as |V(r)|/G(r). The ratio |V(r)|/G(r) less than 1 indicates the presence of ionic bond or weak interactions (van der Waals interactions), while its value greater than 1 and less than 2 show mixed type of interactions. If the value of the ratio is greater than 2, then it indicates covalent bond.74
In the current study, complexes MS1 to MS4 and complexes MS8 to MS10 have less than 1 values of the ratio |V(r)|/G(r), and these complexes indicate van der Waals interactions, while the complexes MS5, MS6, and MS7 have mixed and covalent nature of interactions as the value of the ratio is >1 for these complexes (Fig. 6).
 | ||
| Fig. 6 The schematic structures of the studied complexes by QTAIM analysis to represent bond critical points between the nanocluster and the adsorbate. | ||
Another parameter, ellipticity, defines the stability of the interactions as its value > 1 represents the instability of the structure while its value < 1 shows the strength of the structure and interactions. In the current work, the ellipticity values of the complexes of the studied system ranges from 0.0111 to 3.5351 a.u. The maximum number of critical points are represented by complex MS8, indicating more interaction between the surface and the adsorbate. Another tool electron localization function (ELF) is useful for covalent bond analysis. The values of ELF range from 0.5 to 1.00, indicating the localization of bonding and non-bonding electrons, while its values < 0.5 indicate delocalized electrons.75 It is observed from Table 6 the values of ELF for all the complexes of the studied system are less than 0.5, and the electrons are delocalized for the studied system. All the above parameters indicate the excellent performance of the surface as an adsorbent material for sensing phosgene gas.
Density of states
The important parameter of solid physics, through which numbers of states are described in the unit intervals of energy for the provided chemical system, is called density of states. The DOS graph is useful for analyzing the nature of electronic structure with the configuration of molecular orbitals with their proposed energies. The Multiwfn software was employed to calculate the DOS of the Ga12As12 complexes. The comparison between the DOS plot of the nanocluster and the DOS plots of its complexes with phosgene gas demonstrates the sensitivity of complexes toward phosgene gas and the variation in the complexes' electronic properties. By the interaction of the nanocluster and the gas for each complex, a few new energy states appeared around Ef, which caused an increase and decrease in the energy gap (Eg) values, as shown in Fig. 7. | ||
| Fig. 7 The calculated TDOS and PDOS plots of the studied complexes by DFT at the B3LYP-D3/6-31G(d,p) level of theory. | ||
The decrease in the Eg values for complexes MS1, MS4, and MS8 has been calculated as 0.02 eV, 0.03 eV, and 0.05 eV, respectively, while for complexes MS2, MS3, MS6, MS9, and MS10, it is 0.01 eV, but the increase in the Eg values for complexes MS5 and MS7 has been calculated as 0.01 eV. It has been shown that the maximum variation in the Eg value is observed for complex MS8, which represents the maximum conductivity and sensitivity of the studied system.
NCI analysis
Non-covalent bonds are analyzed by applying the Multiwfn software. Hydrogen bonding, van der Waals interactions, and electrostatic interactions are those mechanisms through which non-covalent interactions are carried out. In order to predict weak interactions, NCI analysis of basic functions such as electron density, reduced density gradient, and Hessian 2nd density eigenvalue is utilized. The information about the type of interactions is given by isosurface plots that involve two functions, namely, the eigenvalue of Hessian 2nd density and electron density plotted against RDG.By the isosurface plot, the nature of interactions is defined based on the eigenvalue. The negative values of λ2(r)ρ(r) and the high value of electron density represent strong non-covalent interactions, such as hydrogen bonding through the blue region, while the positive value of λ2(r)ρ(r) through the red region represents weak non-covalent interactions such as steric effect and reduced electron density.
In the case of the green region, the value of λ2(r)ρ(r) is zero, and it represents comparatively weak intermolecular interactions such as van der Waals interactions.47,76 In the current work, it has been evident through the plots shown in Fig. 8 that the existence of the blue region in between the nanocluster represents strong non-covalent interactions.
 | ||
| Fig. 8 The pictorial display of the non-covalent interactions of the studied system. | ||
The existence of the green region in between phosgene gas and the nanocluster for all complexes indicates the presence of van der Waals interactions. Further, repulsive interactions such as the steric effect were also observed in between the atoms of the nanocluster and indicated by the red region.
Molecular electrostatic potential analysis
In order to analyze the limit of charge distribution in a molecule, molecular electrostatic potential (MEP) analysis is very useful. The system's physiochemical properties, such as chemical reactivity, partial charges, and dipole moment, are correlated with the system's geometry by MEP analysis.29 The analysis was done by DFT at the B3LYP-D3/6-31G(d,p) level of theory. The charge distribution is disclosed in Fig. 9. | ||
| Fig. 9 The MEP diagrams of the Ga12As12 nanocluster and complexes under study. | ||
Commonly, the electropositive end (electron deficient area) is represented by the blue region, while the electronegative end (electron-rich area) is characterized by the yellow region and the green area existing between two extreme regions indicates the mean potential in the web version.77 The isolated nanocluster indicates equal charge distribution with both charges at a similar extent because of the symmetrical geometry. The nanocluster fixed with phosgene gas produces insignificant charge separation by decreasing the blue region intensity on the nanocluster and shifting toward the gas in the case of complexes MS4, MS5, MS6, and MS7. In the case of other complexes, the intensity of the yellow region increases on the gas, as shown in Fig. 9.
The pure Ga12As12 nanocluster has zero dipole moment because of the same number of electronegative and electropositive atoms, but after the interaction of phosgene gas, the variation in dipole moment takes place due to the shifting of (blue and yellow region) charges between the nanocluster and the gas. In MEP analysis, to understand the interaction strength of phosgene gas with the nanocluster, the charge distribution is also correlated with dipole moment (Dm), which is further supported by QT (the calculated net charge on phosgene gas) analysis. For all complexes of the studied system, the irregular behavior of Dm was observed. The maximum value of Dm was observed for complex MS7, and it causes the shifting of the blue region toward the phosgene gas, as shown in the MEP plots. The 2nd largest Dm value has been noted for complex MS5, and some changes have been observed in its MEP plot.
The MEP plots of the complexes MS2 and MS10 indicate similar potential, and a similar change in charge distribution has been observed because of the low and moderate values of Dm and EINT, respectively. In the same context, different charge distribution has been observed due to different Dm and EINT values and different interaction distances. This result also correlates with NBO findings.
The calculated dipole moment values and QT values are found to be consistent with each other, as shown in Table 7. The highest QT value has been observed for complex MS7 with large Dm and EINT values. The variation in QT and Dm values for different complexes has been observed because of extra charge distribution and due to which the shifting of blue and yellow regions has been observed. These observations indicate the excellent response of the nanocluster in the sensing and detection of phosgene gas.
| System | ΔE (eV) | Dm (debye) | QT | λmax (nm) | f |
|---|---|---|---|---|---|
| Ga12As12 | 2.25 | 0.000 | 551.95 | 0.0007 | |
| MS1 | 2.25 | 1.698 | 0.058 | 549.92 | 0.0007 |
| MS2 | 2.23 | 0.799 | 0.062 | 556.63 | 0.0008 |
| MS3 | 2.26 | 1.510 | 0.054 | 548.68 | 0.0008 |
| MS4 | 2.26 | 2.337 | 0.058 | 547.68 | 0.0008 |
| MS5 | 2.28 | 3.638 | 0.093 | 542.74 | 0.0010 |
| MS6 | 2.25 | 2.091 | 0.077 | 551.83 | 0.0008 |
| MS7 | 2.29 | 3.722 | 0.096 | 542.17 | 0.0010 |
| MS8 | 2.21 | 1.290 | 0.049 | 562.11 | 0.0009 |
| MS9 | 2.23 | 1.818 | 0.060 | 556.56 | 0.0009 |
| MS10 | 2.25 | 0.916 | 0.060 | 551.56 | 0.0008 |
UV-Vis analysis
The UV-Vis spectra of all the complexes of the Ga12As12 nanocluster with phosgene gas have been calculated utilizing the TD-DFT method at the B3LYP-D3/6-31G(d,p) level of theory. The adsorption behavior of the isolated nanocluster has been calculated and compared with its complexes after the adsorption of phosgene gas to demonstrate its sensing capability based on the UV-Vis adsorption technique. The strong overlapping due to the interacting moieties is indicated by enhanced absorption wavelength along with oscillator strengths (f), as mentioned in Table 7.In the current work, the change in the adsorption spectra of the Ga12As12 nanocluster due to the presence of phosgene gas has been explained. The combined adsorption spectrum of the nanocluster with its complexes has been shown in Fig. 10. The combined adsorption spectrum of the studied system is composed of eleven peaks located in the wavelength range of 400–850 nm.
 | ||
| Fig. 10 The UV-Vis adsorption spectrum of the studied system. | ||
The maximum absorbance of the isolated nanocluster is at 551.95 nm. The maximum absorbance of complexes MS2, MS9, and MS8 is red-shifted because of the shifting to longer wavelengths 556.63 nm, 556.56 nm, and 562.11 nm, respectively, because of nanocluster interaction with phosgene gas. The red-shifted absorbance indicates the reduced band gap and enhanced electrical conductivity and the sensing response of the studied system.78 Similar complexes have minimum excitation energy (ΔE) and high conductivity values. Herein, the comparatively maximum absorbance wavelength and minimum excitation energy value is represented by complex MS8 while the minimum absorbance wavelength and maximum excitation energy values are represented by complexes MS5 and MS7. This result is correlated with FMO analysis and chemical reactivity indices values where MS8 show the least energy gap, high softness, high electrophilicity index, and maximum conductivity and express high sensing response. It can also be noted the λmax is also blue-shifted for all the other complexes because of shifting toward shorter wavelength (551.83–542.17 nm), and for complex MS1, the interaction of phosgene gas with the nanocluster creates considerable variation in the adsorption spectrum. The variation in molar adsorption coefficient values and red/blue shift absorbance wavelength after phosgene adsorption indicate that the Ga12As12 nanocluster has the potential as an excellent sensor for phosgene gas.
Sensing mechanism
The main purpose of the work is to investigate the capability of the nanocluster to detect and sense phosgene gas. The sensing mechanism is a parameter that characterizes conductivity and resistance changes before and after gas interaction. The sensing response of the nanocluster is associated with the change in the conductivity of the nanocluster and the conductivity of its complexes. It could be determined by the given eqn (7)
 | (7) |
Electrical conductivity
The movement of electrons from the valence bond to the conduction bond is termed as electrical conductivity.79 The changes in the electrical conductivity of the complexes are due to their different electronic characteristics. The electrical conductivity is determined by eqn (8).55
 | (8) |
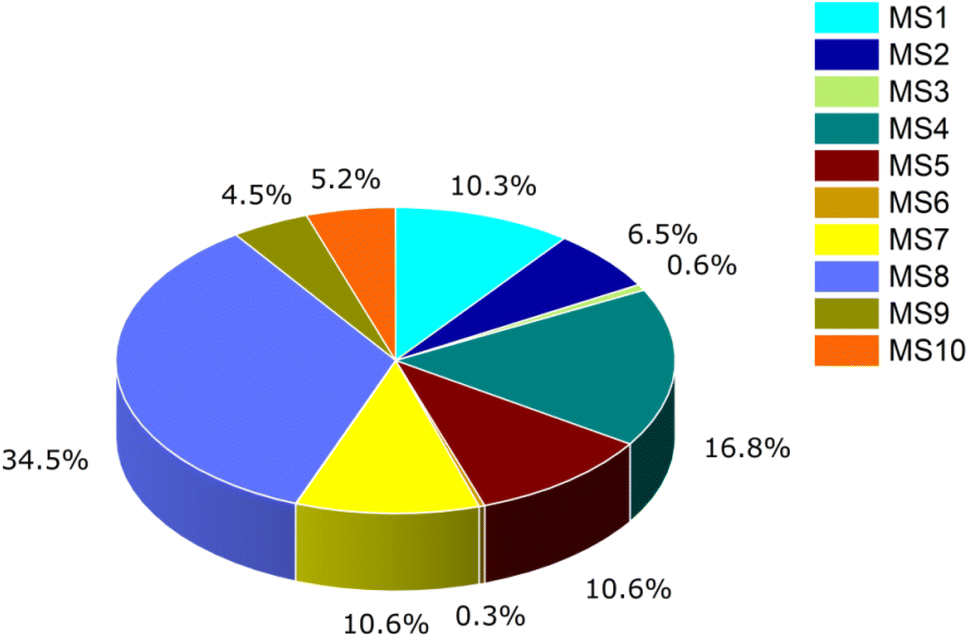
The electrical conductivity of the studied system has been calculated to determine the sensing response of the complexes. The sensitivity of all the complexes of the nanocluster with phosgene gas has been calculated and shown in Table 8. Complex MS8, having less energy gap and high electrical conductivity, respond excellently in sensing, and this result is also correlated with FMO analysis, global indices of reactivity, and UV-Vis analysis. It can be evidence to express the mechanistic sensing capability of the nanocluster. The sensing response of the studied system is displayed by Fig. 11.
| Name | EINT | Eg | σ | τ | S |
|---|---|---|---|---|---|
| a Here, Eg = energy gap, EINT = counterpoise corrected interaction energy in kcal mol−1, τ = recovery time in second, σ = complexes electrical conductivity, S = sensitivity. | |||||
| MS1 | −3.8154 | 2.21 | 1.98 × 10⁹ | 4.66 × 10⁻¹² | 0.0032 |
| MS2 | −4.4772 | 2.22 | 1.97 × 10⁹ | 6.09 × 10⁻¹² | 0.0020 |
| MS3 | −3.1981 | 2.22 | 1.97 × 10⁹ | 3.63 × 10⁻¹² | 0.0002 |
| MS4 | −3.1309 | 2.20 | 1.98 × 10⁹ | 3.54 × 10⁻¹² | 0.0052 |
| MS5 | −4.5565 | 2.24 | 1.96 × 10⁹ | 6.28 × 10⁻¹² | −0.0033 |
| MS6 | −4.6578 | 2.22 | 1.97 × 10⁹ | 6.55 × 10⁻¹² | 0.0001 |
| MS7 | −4.5920 | 2.24 | 1.96 × 10⁹ | 6.37 × 10⁻¹² | −0.0033 |
| MS8 | −2.5608 | 2.17 | 1.99 × 10⁹ | 2.42 × 10⁻¹² | 0.0107 |
| MS9 | −2.1920 | 2.22 | 1.97 × 10⁹ | 2.81 × 10⁻¹² | 0.0014 |
| MS10 | −3.2691 | 2.22 | 1.97 × 10⁹ | 3.74 × 10⁻¹² | 0.0016 |
 | ||
| Fig. 11 The sensing response of the studied system. | ||
Recovery time
The time a sensor utilizes to return to its original shape after the adsorption of the material is named its recovery time and denoted by τ. It indicates the sensing performance of the material. The surface having a shorter recovery time performs better to sense the material and vice versa. It can be calculated by the given eqn (9).81
 | (9) |
The adsorption strength also affects the sensing capability of the material because it makes for difficult desorption of the gas and long recovery time. In the present work, the recovery time of the complexes has been calculated by putting counterpoise corrected interaction energy (EINT) values in eqn (2) to investigate the absolute relation of recovery time and sensitivity, as shown in Table 8. Among all the complexes, complex MS8 has the shortest recovery time and represents the highest reactivity and sensitivity. This investigation is also correlated with UV-Vis analysis, chemical reactivity of indices, FMO analysis, and conductivity response to describe the mechanistic sensing response of the nanocluster.
Thermodynamics analysis
The interaction of work and heat with chemical reactions and variations in the physical state through the law of thermodynamics is studied by thermodynamic analysis (TDA). This mathematical method is applied to study the spontaneous and non-spontaneous behavior of the system and chemical equations.42,43 The current work is concerned with enthalpy change and Gibbs' free energy change. The relation between the internal energy of the system and enthalpy change is represented by the equation ΔH = Q + PV. The positive and negative values of the enthalpy change depend upon the absorbance and release of heat. The enthalpy change is positive due to the absorbance of heat by the system, and the reaction is endothermic. In contrast, the enthalpy change is negative due to the release of heat by the system, and the response is exothermic. The relation of enthalpy change with Gibbs' free energy change is expressed by eqn (10)| ΔG = ΔH − TΔS | (10) |
| ΔH = TΔS | (11) |
The enthalpy changes and Gibbs' free energy change of the complexes have been calculated from the optimized geometries of the complexes using the following eqn (12)–(15).
| ΔH0(298 K) = ∑productΔfH0prod.(298 K) − ∑reactantΔfH0react.(298 K) | (12) |
| ΔfH0(298 K) = ∑(E0 + HCorr)product − ∑(E0 + HCorr)reactants | (13) |
| ΔG0(298 K) = ∑productΔrG0prod.(298 K) − ∑reactantΔrG0react.(298 K) | (14) |
| ΔrG0(298 K) = ∑(E0 + GCorr)product − ∑(E0 + GCorr)reactants | (15) |
In the current work, the calculated enthalpy changes and Gibbs' free energy changes of the nanocluster and phosgene gas complexes are clearly shown in Table S3 (ESI†) in a detailed form. The enthalpy of formation for all the studied complexes MS1, MS2, MS3, MS4, MS5, MS6, MS7, MS8, MS9, and MS10 is −22.8441, −21.1185, −19.0917, −17.5242, −19.3157, −20.0674, −19.4174, −20.2733, −20.6397, and −19.3653 kcal mol−1, respectively. The standard enthalpy is negative as the heat is released by the system due to the interaction between the nanocluster and gas, indicating that the reaction is exothermic. Also, the values of ΔrG0 calculated for the complexes of the studied system after phosgene adsorption are −12.8537 kcal mol−1 for MS1, −11.3383 kcal mol−1 for MS2, −10.7183 kcal mol−1 for MS3, and −8.1776 kcal mol−1 for MS4, −10.7008 kcal mol−1 for MS5, −10.3895 kcal mol−1 for MS6, −10.5922 kcal mol−1 for MS7, −10.2741 kcal mol−1 for MS8, −11.1293 kcal mol−1 for MS9, and −10.4127 kcal mol−1 for MS10. All the values of ΔrG0 are also negative and show that the reaction is spontaneous.
Conclusion
The capability of the semiconductor Ga12As12 nanocluster to sense and adsorb the warfare agent phosgene gas is examined employing comprehensive DFT insights. Utilizing computational tools, geometry optimization, adsorption studies, frontier molecular orbitals analysis, global indices of reactivity, NBO analysis, topological QTAIM analysis, NCI analysis, MEP analysis, UV-Vis analysis, thermodynamics analysis, and the density of states of ten selected complexes of the studied system has been investigated. The adsorption studies represent the maximum adsorption response of the nanocluster with −21.34 ± 2.7 kcal mol−1 adsorption energy and the least interaction distance (3.05 ± 0.5 Å) with phosgene gas. FMO analysis revealed that complex MS8 has the least energy gap (2.17 eV) and indicates less stability and high conductivity. DOS analysis has also been performed in support of FMO analysis, which explores the distribution patterns of HOMO–LUMO orbitals. The global indices of reactivity indicate comparatively the highest softness (0.46 eV), least hardness (1.09 eV), high electrophilicity index (10.71 eV), and high reactivity of complex MS8 among all the complexes of the studied system. The ionization potential values of the studied system have been reduced by the adsorption of phosgene gas, and these factors indicate the enhanced reactivity and sensitivity of the studied system. Furthermore, NBO results explore that the donor–acceptor interactions are stabilized by intermolecular charge transfer (ICT) and different kinds of non-covalent interactions. These interactions and transfer of charges in between the molecules are because of electron delocalization of the oxygen and chlorine lone pair of the phosgene to the sigma and pi anti-bonding orbitals of the studied nanocluster because of high stabilization energy values. The topological parameters of QTAIM analysis provide information about the presence of partially covalent and non-covalent interactions and delocalized electrons between the nanocluster and phosgene gas. NCI analysis indicates green region existence, and its results are also compatible with the information obtained by NBO and QTAIM analysis. MEP analysis provides confirmation about the charge distribution by shifting the yellow region toward the nanocluster and shows that the calculated dipole moment and QT values of the studied system are found to be consistent with each other. UV-Vis analysis expresses the maximum absorbance (redshift) and minimum excitation energy of complex MS8, and this information is also correlated with the results of FMO analysis and global indices of reactivity. The sensing mechanism indicates the shortest recovery time (2.42 × 10⁻¹²), high conductivity (1.99 × 10⁹), and excellent sensing response (0.0107) of nanocluster's complex MS8 toward the phosgene gas. It is also correlated with FMO analysis, global indices of reactivity analysis, and UV-Vis analysis. Furthermore, thermodynamics analysis shows spontaneous thermodynamic behavior and exothermic interaction process of the studied nanocluster with phosgene gas. Thus, it can be concluded from all these investigations that the Ga12As12 nanocluster is a promising influential sensor for phosgene gas detection, MS8 has proven to be the best isomer of the studied system, and this research will emphasize the informative knowledge for experimental researchers to use Ga12As12 as a sensor for chemical defence and environmental monitoring in industry and military safety. It can be used further for chemical agent neutralization upon detection and forensic investigation to analyze traces of chemical warfare agent after chemical attack.Conflicts of interest
There are no conflicts to declare.Acknowledgements
The authors thank the Researchers Supporting Project number (RSP2023R6), King Saud University, Riyadh, Saudi Arabia.References
- M. T. Baei, A. Soltani, S. Hashemian and H. Mohammadian, Can. J. Chem., 2014, 92, 605–610 CrossRef CAS.
- P. Voßnacker, A. Wüst, T. Keilhack, C. Müller, S. Steinhauer, H. Beckers, S. Yogendra, Y. Schiesser, R. Weber, M. Reimann, R. Müller, M. Kaupp and S. Riedel, Sci. Adv., 2021, 7, eabj5186 CrossRef PubMed.
- T. Zhang, H. Sun, F. Wang, W. Zhang, J. Ma, S. Tang, H. Gong and J. Zhang, Appl. Surf. Sci., 2018, 427, 1019–1026 CAS.
- S. T. Hobson, R. A. Richieri and M. H. Parseghian, Toxicol. Mech. Methods, 2021, 31, 293–307 CrossRef CAS PubMed.
- S. Todd, S. Bland and J. Ritson, in Textbook of Acute Trauma Care, ed. P. Lax, Springer International Publishing, Cham, 2022, pp. 783–799, DOI:10.1007/978-3-030-83628-3_41.
- N. Baig, K. Irshad and F. Wail, Nanomaterials: a review of synthesis methods, properties, recent progress, and challenges, Mater. Adv., 2021, 2(6), 1821–1871 RSC.
- H. Jouypazadeh and H. Farrokhpour, J. Mol. Struct., 2018, 1164, 227–238 CrossRef CAS.
- J. A. Agwupuye, P. A. Neji, H. Louis, J. O. Odey, T. O. Unimuke, E. A. Bisiong, E. A. Eno, P. M. Utsu and T. N. Ntui, Heliyon, 2021, 7, e07544 CrossRef CAS PubMed.
- H. Louis, D. E. Charlie, I. O. Amodu, I. Benjamin, T. E. Gber, E. C. Agwamba and A. S. Adeyinka, ACS Omega, 2022, 7, 35118–35135 CrossRef CAS PubMed.
- M. D. Mohammadi, H. Y. Abdullah, V. Kalamse and A. Ajay Chaudhari, Comput. Theor. Chem., 2021, 1204, 113391 CrossRef CAS.
- M. D. Mohammadi, H. Y. Abdullah, S. Bhowmick and G. Biskos, Comput. Theor. Chem., 2021, 1198, 113168 CrossRef CAS.
- M. D. Mohammadi, H. Y. Abdullah and A. Suvitha, Iran. J. Sci. Technol., Trans. A: Sci., 2021, 45, 1287–1300 CrossRef.
- H. Raissi, M. Yoosefian, F. Mollania and S. Khoshkhou, Struct. Chem., 2013, 24, 123–137 CrossRef CAS.
- M. T. Baei, M. R. Taghartapeh, E. T. Lemeski and A. Soltani, Phys. B, 2014, 444, 6–13 CrossRef CAS.
- A. S. Rad and K. Ayub, J. Alloys Compd., 2016, 672, 161–169 CrossRef.
- K. A. Soliman and S. A. Aal, Mater. Sci. Semicond. Process., 2022, 144, 106574 CrossRef CAS.
- A. Hosseinian, M. Salary, S. Arshadi, E. Vessally and L. Edjlali, Solid State Commun., 2018, 269, 23–27 CrossRef.
- J. Beheshtian, A. A. Peyghan and Z. Bagheri, Sens. Actuators, B, 2012, 171–172, 846–852 CrossRef CAS.
- S. Hussain, R. Hussain, M. Y. Mehboob, S. A. S. Chatha, A. I. Hussain, A. Umar, M. U. Khan, M. Ahmed, M. Adnan and K. Ayub, ACS Omega, 2020, 5, 7641–7650 CrossRef CAS PubMed.
- H. Louis, I. O. Amodu, T. O. Unimuke, T. E. Gber, B. B. Isang and A. S. Adeyinka, Mater. Today Commun., 2022, 32, 103946 CrossRef CAS.
- J. Beheshtian, M. Kamfiroozi, Z. Bagheri and A. Ahmadi, Comput. Mater. Sci., 2012, 54, 115–118 CrossRef CAS.
- Z. Syum and H. Woldeghebriel, Comput. Theor. Chem., 2014, 1048, 7–17 CrossRef CAS.
- C. Chang, A. B. C. Patzer, E. Sedlmayr, T. Steinke and D. Sülzle, Chem. Phys. Lett., 2001, 350, 399–404 CrossRef CAS.
- A. S. Rad and K. Ayub, J. Alloys Compd., 2016, 678, 317–324 CrossRef CAS.
- F. Khaliq, K. Ayub, T. Mahmood, S. Muhammad, S. Tabassum and M. A. Gilani, Mater. Sci. Semicond. Process., 2021, 135, 106122 CrossRef CAS.
- F. Ullah, N. Kosar, A. Ali, T. Mahmood and K. Ayub, Phys. E, 2020, 118, 113906 CrossRef CAS.
- T. Soga, Nanostructured materials for solar energy conversion, Elsevier, 2006 Search PubMed.
- P. Zhang, X. F. Lu, D. Luan and X. W. Lou, Angew. Chem., 2020, 132, 8205–8209 CrossRef.
- S. Hussain, S. A. Shahid Chatha, A. I. Hussain, R. Hussain, M. Y. Mehboob, T. Gulzar, A. Mansha, N. Shahzad and K. Ayub, ACS Omega, 2020, 5, 15547–15556 CrossRef CAS PubMed.
- H. Farrokhpour, H. Jouypazadeh and S. Vakili Sohroforouzani, Mol. Phys., 2020, 118, 1626506 CrossRef.
- M. D. Mohammadi, H. Y. Abdullah, S. Bhowmick and G. Biskos, Can. J. Chem., 2021, 99, 733–741 CrossRef CAS.
- M. D. Mohammadi, H. Y. Abdullah, V. Kalamse and A. Chaudhari, Comput. Theor. Chem., 2021, 1204, 113391 CrossRef CAS.
- M. Doust Mohammadi, H. Y. Abdullah, V. G. Kalamse and A. Chaudhari, Comput. Theor. Chem., 2022, 1208, 113544 CrossRef CAS.
- R. Padash, A. Sobhani-Nasab, M. Rahimi-Nasrabadi, M. Mirmotahari, H. Ehrlich, A. S. Rad and M. Peyravi, Appl. Phys. A: Mater. Sci. Process., 2018, 124, 582 CrossRef.
- Y. Shyma Mary, Y. Sheena Mary and Z. Ullah, J. Cluster Sci., 2022, 33, 1809–1819 CrossRef CAS.
- M. J. Frisch, G. W. Trucks, H. B. Schlegel, G. Scuseria, M. A. Robb, J. R. Cheeseman, G. Scalmani, V. Barone, B. Mennucci, G. Petersson, H. Nakatsuji, M. Caricato, X. Li, H. P. Hratchian, A. F. Izmaylov, J. Bloino, G. Zheng, J. L. Sonnenberg, M. Hada, M. Ehara, K. Toyota, R. Fukuda, J. Hasegawa, M. Ishida, T. Nakajima, Y. Honda, O. Kitao, H. Nakai, T. Vreven, J. A. Montgomery, J. E. Peralta, F. Ogliaro, M. Bearpark, J. J. Heyd, E. Brothers, K. N. Kudin, V. N. Staroverov, R. Kobayashi, J. Normand, K. Raghavachari, A. Rendell, J. C. Burant, S. S. Iyengar, J. Tomasi, M. Cossi, N. Rega, J. M. Millam, M. Klene, J. E. Knox, J. B. Cross, V. Bakken, C. Adamo, J. Jaramillo, R. Gomperts, R. E. Stratmann, O. Yazyev, A. J. Austin, R. Cammi, C. Pomelli, J. W. Ochterski, R. L. Martin, K. Morokuma, V. J. Zakrzewski, G. A. Voth, P. Salvador, J. J. Dannenberg, S. Dapprich, A. D. Daniels, O. Farkas, J. B. Foresman, J. V. Ortiz, J. Cioslowski and D. J. Fox, D. 0109, Revision D. 01, Gaussian, Inc., Wallingford, CT, 2009 Search PubMed.
- R. D. Dennington, T. A. Keith and J. M. Millam, GaussView 5.0.8, Gaussian Inc, 2008 Search PubMed.
- E. D. Glendening, C. R. Landis and F. Weinhold, J. Comput. Chem., 2013, 34, 1429–1437 CrossRef CAS PubMed.
- T. Lu and F. Chen, J. Comput. Chem., 2012, 33, 580–592 CrossRef CAS PubMed.
- M. D. Hanwell, D. E. Curtis, D. C. Lonie, T. Vandermeersch, E. Zurek and G. R. Hutchison, J. Cheminf., 2012, 4, 17 CAS.
- W. Humphrey, A. Dalke and K. Schulten, J. Mol. Graphics, 1996, 14, 33–38 CrossRef CAS PubMed.
- T. O. Unimuke, H. Louis, E. A. Eno, E. C. Agwamba and A. S. Adeyinka, ACS Omega, 2022, 7, 13704–13720 CrossRef CAS PubMed.
- A. Mardiana-Idayu and S. B. Riffat, Energy Build., 2011, 43, 2533–2538 CrossRef.
- T. Yanai, D. P. Tew and N. C. Handy, Chem. Phys. Lett., 2004, 393, 51–57 CrossRef CAS.
- S. Grimme, S. Ehrlich and L. Goerigk, J. Comput. Chem., 2011, 32, 1456–1465 CrossRef CAS PubMed.
- J.-D. Chai and M. Head-Gordon, Phys. Chem. Chem. Phys., 2008, 10, 6615–6620 RSC.
- H. Louis, T. C. Egemonye, T. O. Unimuke, B. E. Inah, H. O. Edet, E. A. Eno, S. A. Adalikwu and A. S. Adeyinka, ACS Omega, 2022, 7, 34929–34943 CrossRef CAS PubMed.
- E. Nemati-Kande, M. Abbasi and M. D. Mohammadi, J. Mol. Struct., 2020, 1199, 126962 CrossRef CAS.
- J. Wang, L. Ma, J. Zhao, G. Wang, X. Chen and R. B. King, J. Chem. Phys., 2008, 129, 044908 CrossRef PubMed.
- H. Louis, T. E. Gber, F. C. Asogwa, E. A. Eno, T. O. Unimuke, V. M. Bassey and B. I. Ita, Mater. Chem. Phys., 2022, 278, 125518 CrossRef CAS.
- R. Guo, Q. Liu, W. Wang, R. Tayebee and F. Mollania, J. Mol. Liq., 2021, 325, 114798 CrossRef CAS.
- X. Xie, L. Zhang, W. Zhang, R. Tayebee, A. Hoseininasr, H. H. Vatanpour, Z. Behjati, S. Li, M. Nasrabadi and L. Liu, J. Mol. Liq., 2020, 309, 113024 CrossRef CAS.
- W. Liu, X. Qiu, Y. Song, X. Zhang, S. Tian and L. Liu, Surf. Sci., 2022, 719, 122032 CrossRef CAS.
- C. Kim, B. Kim, S. M. Lee, C. Jo and Y. H. Lee, Phys. Rev. B, 2002, 65, 165418 CrossRef.
- H. Louis, D. Etiese, T. O. Unimuke, A. E. Owen, A. O. Rajee, T. E. Gber, C. M. Chima, E. A. Eno and E. N. Nfor, RSC Adv., 2022, 12, 30365–30380 RSC.
- A. Chandrasekaran and J. J. Betouras, Phys. Rev. B, 2022, 105, 075144 CrossRef CAS.
- R. G. Pearson, Inorg. Chem., 1984, 23, 4675–4679 CrossRef CAS.
- R. G. Parr, L. v. Szentpály and S. Liu, J. Am. Chem. Soc., 1999, 121, 1922–1924 CrossRef CAS.
- C. D. D. Sundari, A. L. Ivansyah, O. Floweri, I. M. Arcana and F. Iskandar, New J. Chem., 2022, 46, 3966–3977 RSC.
- A. Soltani, S. G. Raz, V. J. Rezaei, A. Dehno Khalaji and M. Savar, Appl. Surf. Sci., 2012, 263, 619–625 CrossRef CAS.
- A. D. Udoikono, H. Louis, E. A. Eno, E. C. Agwamba, T. O. Unimuke, A. T. Igbalagh, H. O. Edet, J. O. Odey and A. S. Adeyinka, J. Photochem. Photobiol., 2022, 10, 100116 CrossRef.
- P. Jaramillo, L. R. Domingo and P. Pérez, Chem. Phys. Lett., 2006, 420, 95–99 CrossRef CAS.
- M. M. Edim, O. C. Enudi, B. B. Asuquo, H. Louis, E. A. Bisong, J. A. Agwupuye, A. G. Chioma, J. O. Odey, I. Joseph and F. I. Bassey, Heliyon, 2021, 7, e06138 CrossRef CAS PubMed.
- J. A. Agwupuye, H. Louis, T. O. Unimuke, P. David, E. I. Ubana and Y. L. Moshood, J. Mol. Liq., 2021, 337, 116458 CrossRef CAS.
- R. Tayebee and A. H. Nasr, J. Mol. Liq., 2020, 319, 114357 CrossRef CAS.
- F. Weinhold, Isr. J. Chem., 2022, 62, e202100026 CrossRef CAS.
- R. Tayebee, N. Zamand, A. Hosseini-nasr and M. Kargar Razi, J. Mol. Struct., 2014, 1065–1066, 135–142 CrossRef CAS.
- H. Louis, I. B. Onyebuenyi, J. O. Odey, A. T. Igbalagh, M. T. Mbonu, E. A. Eno, A. M. S. Pembere and O. E. Offiong, RSC Adv., 2021, 11, 28433–28446 RSC.
- H. Louis, B. I. Ita and N. I. Nzeata, Eur. Phys. J. Plus, 2019, 134, 315 CrossRef.
- M. Fu, R. Tayebee, S. Saberi, N. Nourbakhsh, E. Esmaeili, B. Maleki and R. H. Vatanpour, Curr. Mol. Med., 2021, 21, 698–705 CrossRef CAS PubMed.
- J. A. Agwupuye, P. A. Neji, H. Louis, J. O. Odey, T. O. Unimuke, E. A. Bisiong, E. A. Eno, P. M. Utsu and T. N. Ntui, Heliyon, 2021, 7, e07544 CrossRef CAS PubMed.
- S. Sarkar, T. B. E. Grønbech, A. Mamakhel, M. Bondesgaard, K. Sugimoto, E. Nishibori and B. B. Iversen, Angew. Chem., Int. Ed., 2022, 61, e202202742 CrossRef CAS PubMed.
- V. M. Bassey, C. G. Apepende, P. S. Idante, H. Louis, W. Emori, C. R. Cheng, J. A. Agupuye, T. O. Unimuke, K. Wei and F. C. Asogwa, J. Fluoresc., 2022, 1–13 Search PubMed.
- M. Doust Mohammadi and H. Y. Abdullah, J. Mol. Model., 2020, 26, 287 CrossRef CAS PubMed.
- M. Doust Mohammadi and H. Y. Abdullah, Can. J. Chem., 2020, 99, 51–62 CrossRef.
- B. E. Inah, H. Louis, I. Benjamin, T. O. Unimuke and A. S. Adeyinka, Can. J. Chem., 2022, 101, 11–24 CrossRef.
- Y. S. Mary, H. T. Varghese, C. Y. Panicker, M. Girisha, B. K. Sagar, H. S. Yathirajan, A. A. Al-Saadi and C. Van Alsenoy, Spectrochim. Acta, Part A, 2015, 150, 543–556 CrossRef CAS PubMed.
- H. Sajid, T. Mahmood, M. H. Mahmood and K. Ayub, J. Phys. Org. Chem., 2019, 32, e3960 CrossRef.
- P. Xu, L. Cui, S. Gao, N. Na and A. G. Ebadi, Mol. Phys., 2022, 120, e2002957 CrossRef.
- H. R. A. El-Mageed and M. A. A. Ibrahim, J. Mol. Liq., 2021, 326, 115297 CrossRef CAS.
- R. Padash, M. R. Esfahani and A. S. Rad, J. Biomol. Struct. Dyn., 2021, 39, 5427–5437 CrossRef CAS PubMed.
- M. T. Baei, A. Soltani, S. Hashemian and H. Mohammadian, Can. J. Chem., 2014, 92, 605–610 CrossRef CAS.
Footnote |
| † Electronic supplementary information (ESI) available. See DOI: https://doi.org/10.1039/d3ra05086f |
| This journal is © The Royal Society of Chemistry 2023 |