 Open Access Article
Creative Commons Attribution 3.0 Unported Licence
Evaluating the ability of end-point methods to predict the binding affinity tendency of protein kinase inhibitors†
Martiniano Bello *a and
Cindy Bandalab
aLaboratorio de Diseño y Desarrollo de Nuevos Fármacos e Innovación Biotecnológica, Escuela Superior de Medicina, Instituto Politécnico Nacional, Plan de San Luis y Diaz Mirón, s/n, Col. Casco de Santo Tomas, Ciudad de México 11340, Mexico. E-mail: bellomartini@gmail.com; mbellor@ipn.mx
bEscuela Superior de Medicina, Instituto Politécnico Nacional, México City 11340, Mexico
First published on 22nd August 2023
Abstract
Because of the high economic cost of exploring the experimental impact of mutations occurring in kinase proteins, computational approaches have been employed as alternative methods for evaluating the structural and energetic aspects of kinase mutations. Among the main computational methods used to explore the affinity linked to kinase mutations are docking procedures and molecular dynamics (MD) simulations combined with end-point methods or alchemical methods. Although it is known that end-point methods are not able to reproduce experimental binding free energy (ΔG) values, it is also true that they are able to discriminate between a better or a worse ligand through the estimation of ΔG. In this contribution, we selected ten wild-type and mutant cocrystallized EGFR–inhibitor complexes containing experimental binding affinities to evaluate whether MMGBSA or MMPBSA approaches can predict the differences in affinity between the wild type and mutants forming a complex with a similar inhibitor. Our results show that a long MD simulation (the last 50 ns of a 100 ns-long MD simulation) using the MMGBSA method without considering the entropic components reproduced the experimental affinity tendency with a Pearson correlation coefficient of 0.779 and an R2 value of 0.606. On the other hand, the correlation between theoretical and experimental ΔΔG values indicates that the MMGBSA and MMPBSA methods are helpful for obtaining a good correlation using a short rather than a long simulation period.
1. Introduction
Protein kinase (PK) enzymes are part of a huge superfamily and play an important role in diverse cellular activation events.1 PK enzymes catalyze the addition of a phosphate group to target residues (threonine, serine, tyrosine, and histidine) present in the catalytic site of enzymes, also known as the ATP binding site, and this represents a crucial process for the regulation of enzymatic activity. The three-dimensional structure of PK enzymes is canonically formed by two domains, also known as lobes, linked to each other through a flexible hinge region. The interface between these two domains forms a hydrophobic cleft that structures the ATP binding site (Fig. 1). The smaller N-terminal domain is structured by β-sheets (β1–β5) and one helix, known as αC, while the second C-terminal domain is enriched by several α-helices (αD–αI).2–4 PK enzymes share some regions involved in the catalytic process, that is, the activation loop, the DFG motif, the hinge, and the P-loop (Fig. 1). The catalytic activity of the enzymes is also connected with active or inactive states. In the active state, the activation loop is in the DFG-in state, whereas in the inactive state it is in the DFG-out conformation. In the inactive state, the Asp residue present in the DFG motif, which participates in the transfer of the phosphate group from ATP to the substrate, blocks the catalytic binding site avoiding substrate access, whereas in the active state, a conformational change in the activation loop allows access to the ATP binding site.5,6 Although normally the transition from the inactive to the active state is the result of phosphorylation at the activation loop, it can also be promoted by the binding of PK inhibitors.7–9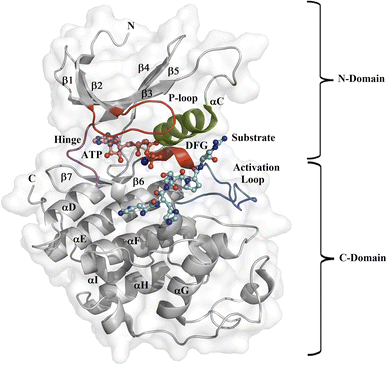 | ||
| Fig. 1 Design of the PK catalytic domain. The structural topology of a PK exemplified by CDK2 (PDB entry 1QMZ). The figure illustrates the N- and C-domains of CDK2, which forms a complex with ATP and the substrate at the catalytic binding domain. The activation loop is in blue, the P-loop in red, the αC-helix in green, the hinge region in magenta, the Mg2+ ion in orange, the ATP in pink, and the substrate in cyan. | ||
Phosphorylation of the enzyme contributes to modifying the physicochemical environment of the enzyme's active site, allowing PKs to develop their basic functions. However, some circumstances, such as changes in the expression level of PKs or mutations at the ATP binding site of PKs, affect diverse cellular events by modifying the catalytic activity of the enzyme or producing a constitutively active PK. Some mutations that affect the catalytic activity of the ATP binding site are mutations at the gatekeeper, the activation loop position, and the glycine-rich loop. L858R at the activation loop, G719S proximal to the glycine-rich loop in the epidermal growth factor receptor (EGFR), and T790M at the gatekeeper position are three examples of mutations that destabilize the inactive conformation.10 T790M in EGFR is an example of a gatekeeper mutation with bulkier side chain substitutions that block access to the catalytic binding site. This mutation impacts the hydrogen bonds between Thr and the ligand and also promotes the constitutive active state of EGFR,11–13 without impacting ATP binding.14,15
Recent advances in theoretical methods and the increase in experimental information about the impact of PK mutations on the inhibitor affinity of several PKs have allowed the development and evaluation of different methodologies for predicting the impact of mutations on inhibitor affinity. Although ideally it would be better to explore the impact of PK mutations through experimental methods, this turns out to be difficult because of time and economic aspects, so theoretical methods represent a good alternative for developing new PK inhibitors. Among the main theoretical approaches used to predict the difference in the binding affinity energy of wild-type versus mutated systems in protein–ligand systems are statistic-based machine-learning methods16 and structure-based methods.17–19 Of these two methods, structure-based methods are based on physical models. Although they are not as efficient and accurate as statistic-based machine-learning methods,20,21 structure-based methods have more advantages in the model implementation of different types of systems and in the interpretation of the results.22–25 Structure-based methods can be divided into alchemical and end-point methods. Alchemical methods, such as free energy perturbation (FEP) and thermodynamics integration (TI), are robust and precise methods for predicting binding free energies.26 However, these methods are computationally demanding and require long simulation times to converge, which makes them unsuitable for large-scale drug design projects. End-point methods, such as the molecular mechanics generalized-Born surface area (MMGBSA) and molecular mechanics Poisson–Boltzmann surface area (MMPBSA) methods,27 are the most employed methods for predicting the binding free energy (ΔG) and consider only the initial and final states of the evaluated system. MMGBSA and MMPBSA are computationally faster than alchemical methods and, because of that, have been successfully used in different types of systems and situations, such as getting insight into the drug resistance mechanisms of some pharmacological medicines.25–31 Comparing the MMGBSA and the FEP method on a massive number of mutations in protein–protein systems revealed better Pearson correlation coefficients against the experimental data for the FEP (r = 0.50–0.61) than for the MMGBSA (r = 0.14–0.18) method.32 On the other hand, Ikemura et al. determined the difference in binding free energy between PK inhibitors and EGFR containing rare mutations and compared the results against the experimental values using the MMGBSA and MMPBSA approaches, finding good Pearson correlation values (r = 0.57).30 More recently, Yu et al. predicted the binding free energy values for different kinds of protein–ligand systems containing mutations, using the MMGBSA and MMPBSA approaches but incorporating different computational strategies, such as different lengths of molecular dynamics (MD) simulations, different values of dielectric constants, and the incorporation of entropic effects in the final binding free energy.33 Based on this latter study, in which PK enzymes were not included, Yu et al. identified that 100 ns-long MD simulations benefit the prediction accuracy between theoretical and experimental ΔΔG values of both methods with relatively good correlation values (r = 0.44). Furthermore, it was observed that the correlation is improved when the system contains multiple mutations. In this study, we predicted the binding free energy for a set of 10 wild-type and mutated EGFR–inhibitor complexes containing experimental affinity values, using the first 25 ns or the last 50 ns from 100 ns-long MD simulations combined with the MMGBSA and MMPBSA approaches with two dielectric constants and the incorporation of entropic effects in the binding free energy.
2. Methods
Table S1† shows our data set, containing single or double mutations within ten EGFR–inhibitor systems. For the preparation of the systems, all the crystal structures with missing regions were repaired using a Swiss model server.34 The EGFR–inhibitor complexes were constructed with antechamber and tleap modules present in the Amber22 package.26,35 The inhibitors were parametrized with the general Amber force field (GAFF)26 and AM1-BCC atomic charges,36 whereas the proteins were built using the Amber ff14SB force field.37 The systems were immersed in a truncated octahedral water box with a 12 Å TIP3P water model38 and neutralized by adding counterions to equilibrate the total charge.2.1 Molecular dynamics (MD) simulations
With prior MD simulations, the systems were minimized and equilibrated, as follows. The minimization process consisted of 5000 cycles of steepest descent and 4000 cycles of conjugate gradient minimization. The temperature of the systems was increased for 200 ps from 0 to 310 K under an NVT ensemble using a Berendsen thermostat,39 during which heavy atoms in the protein were constrained with an elastic constant of 3 kcal mol−1 Å−2. Then, the density was equilibrated for 200 ps under an NTP ensemble using a Langevin thermostat40,41 and a Berendsen barostat,39 and a constant pressure was applied for 600 ps to accomplish equilibration at 310 K, maintaining the same constraints on the heavy atoms as used in the heating process. MD simulations were run under an NTP ensemble using a Langevin thermostat40,41 and a Berendsen barostat39 without any restrictions. The van der Waals and short-range electrostatic interactions were set to 10 Å, while the particle mesh Ewald (PME) algorithm42 was used to treat the long-range electrostatic interactions.43 The time step of the simulations was set to 2 fs, and the SHAKE algorithm44 was used to constrain the bond length between the hydrogen atoms and the linked heavy atoms. All the MD simulations were run in triplicate with the pmemd.cuda module in Amber22.26,35 A single joined trajectory was created by concatenating triplicate simulations and employed to estimate the root-mean-square deviation (RMSD) and the radius of gyration (RG) and to conduct the clustering analysis and binding free energy calculations.2.2 Binding free energy studies with MMGBSA and MMPBSA
The binding free energy was determined for each system during the first 25 and the last 50 ns from the triplicate 100 ns-long MD trajectories, using the MMGBSA and MMPBSA methods and the single-method MD simulation protocol with the MMPBSA.py module45 present in the Amber22 simulation software. With these methods, the binding free energy can be decomposed into its energetic contributions, as follows:26| ΔGbind = Gcomplex − Greceptor − Gligand |
| ΔGbind = ΔEMM + ΔGsolvation − TΔS |
2.3 Molecular docking
Docking studies were performed using two different algorithms: MOE 2014.09,51 and SwissDock.52 The ligand geometries were minimized with Avogadro53 with a UFF force field, using the steepest descent method followed by conjugate gradient algorithms. Docking calculations with MOE 2014.09 were carried out using the triangle matcher function to create the initial binding poses. The best 30 poses from the London dG score were then rescored using GBVI/WSA dG. For docking studies with SwissDock, the default parameters were used. For all the cases, the search space was set at the known binding pocket, and the receptor–ligand system with the lowest binding score was chosen as the representative complex.3. Results and discussion
We selected a set of 10 cocrystallized wild-type and mutated EGFR–inhibitor complexes containing experimental affinity values (Table S1†). Fig. 2 illustrates six of these mutated EGFR–inhibitor cocrystallized complexes. Of the evaluated systems, four contain a single mutation, and two have two mutations almost all evaluated systems showed that the mutations are located close to the cocrystallized ligand, suggesting essential interactions between the ligand and the ligand binding site. These systems were submitted to MD simulations combined with various protocols of end-point binding free energy methods with the purpose of evaluating the ability of this methodology to predict the impact of mutations on the binding affinity. We also evaluate the binding affinity of these complexes using two different docking algorithms, the results of which are compared with the MD simulation results.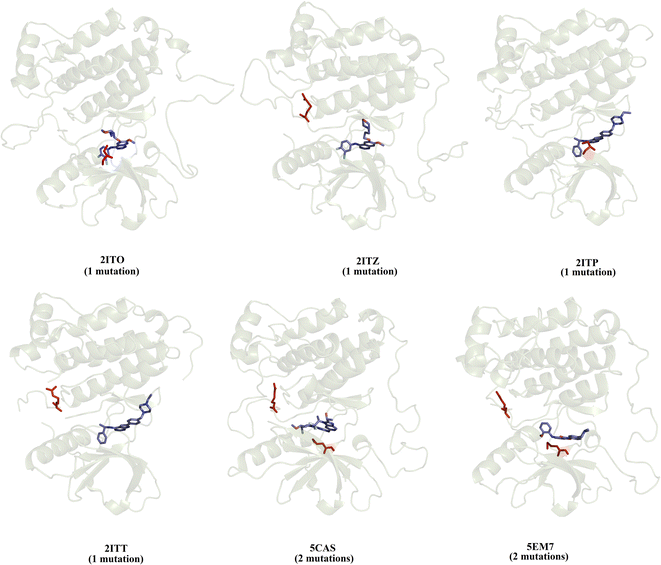 | ||
| Fig. 2 Structural details of the investigated systems. The set of mutated EGFR–inhibitor cocrystallized complexes. | ||
3.1 Stabilization of the wild-type and mutated EGFR–inhibitor complexes
The RMSD and RG plots of the EGFR–inhibitor complexes illustrate that all the complexes reached equilibrated values between 20 and 50 ns, with average RMSD values between 2.05 and 5.52 Å, whereas that average RG values fluctuated between 19.9 and 20.8 Å (Table S2†). Based on this analysis, a clustering analysis was performed using both the equilibrated simulation time (the last 50 ns) and the time before reaching the equilibrium (the first 25 ns) to obtain the most populated complexes and evaluate the RMSD value of the ligand binding pose obtained during simulations concerning the cocrystallized ligand conformation. This analysis showed that the ligand poses exhibited RMSD values lower than 2.0 for the MD simulation studies before and after reaching equilibrium (Table S3†). The results indicated similar ligand displacement with respect to the cocrystallized ligand conformer before and after reaching equilibrium, except for the 2j6m system, which improves its RMSD value during the last 50 ns.3.2 Impact of the MD simulation time on the binding free energy
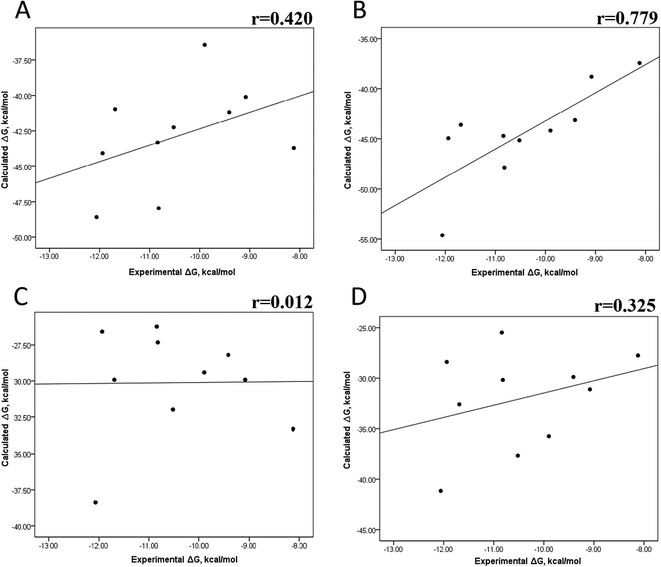
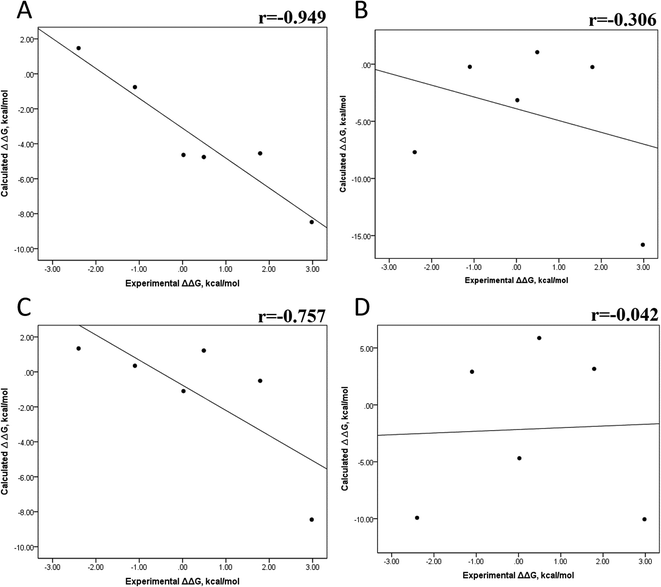
The minimized wild-type and mutated cocrystallized PK–ligand complexes were submitted to MD simulations combined with MMGBSA and MMPBSA using a dielectric constant (εin = 2) that has been reported to be the most suitable one for studying protein–ligand systems.49,50,54,55 In addition, we found similar results with a higher dielectric contact (εin = 4; data not shown), as previously reported,33 so in this research, we showed only results for εin = 2.Tables S4–S7 and S12† show all the binding free energy (ΔG) values using MMGBSA (ΔGgb) or MMPBSA (ΔGpb) during the first 25 ns or the last 50 ns of the 100 ns-long MD simulations. The Pearson correlation coefficients between the calculated and the experimental ΔG values showed a better correlation for the last 50 ns (r = 0.779) (Fig. 3B) than for the first 25 ns (r = 0.420) (Fig. 3A). The ΔGpb values obtained with the MMPBSA approach showed a lack of correlation for the first 25 ns (r = 0.012) (Fig. 3C), which improved for the last 50 ns (r = 0.325) (Fig. 3D). Although a comparison between the predicted and experimental ΔG values (Tables S1 and S12†) clearly showed that the MMGBSA or MMPBSA methods were not able to reproduce the experimental ΔG values, our results indicated that the MMGBSA method reproduced the affinity tendency for the group of wild-type and mutant EGFR–inhibitor complexes with a coefficient value similar to that previously reported for different protein–ligand systems33,56 and between some PK inhibitors and EGFR containing rare mutations.30 Based on this result, we also determined the correlation between the mutated and the wild-type systems (ΔΔG = ΔGMT − ΔGWT). Fig. 4A and B for MMGBSA show that with an increase in the MD simulation time, the Pearson correlation coefficient decreases from −0.949 of the conformers during the first 25 ns to −0.306 during the last 50 ns of the 100 ns-long MD simulations. A similar trend is shown for the results using the MMPBSA approach. In this case, the Pearson correlation coefficient also reduces from −0.757 of the conformers during the first 25 ns to −0.042 during the last 50 ns of the 100 ns-long MD simulations (Fig. 4C and D). A comparison of the correlations of calculated ΔG (Fig. 3) or ΔΔG (Fig. 4) using the two methods reveals that the better method for reproducing the experimental ΔG tendency for EGFR–inhibitor systems is the MMGBSA method using more extended MD simulations. On the other hand, the predicted versus experimental ΔΔG correlation indicates that the MMGBSA and MMPBSA methods help obtain good correlations when short rather than long simulation periods are used.
3.3 Impact of the conformational entropy on the binding affinity
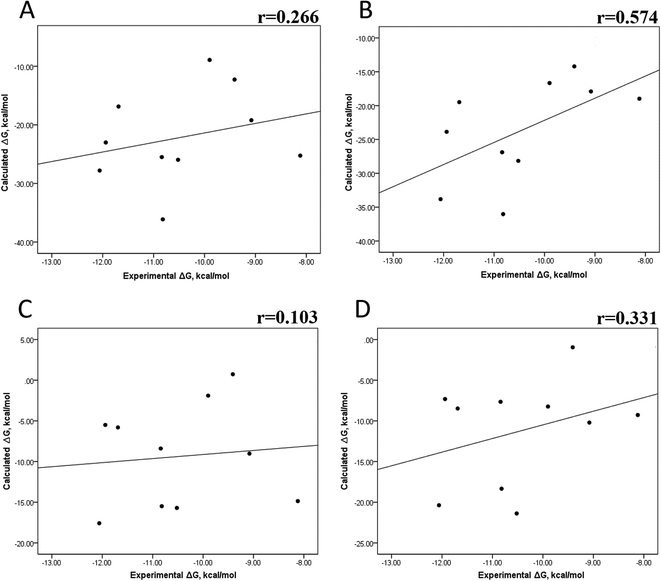
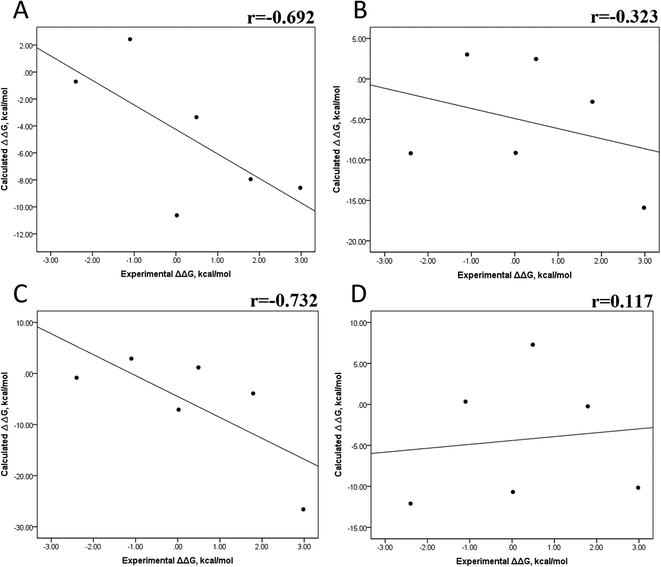
We also evaluated the impact of the conformational entropy, although it has been stated that introducing the entropy contribution in the prediction of the binding free energy is not able to improve the correlation between the predicted and the experimental binding free energy.54 Tables S8–S11 and S12† also present all the ΔG values using the MMGBSA or MMPBSA method, considering the entropic component. The correlation between the calculated and experimental ΔG values with MMGBSA during the first 25 ns (Fig. 5A) and the last 50 ns (Fig. 5B) of the 100 ns-long MD simulations revealed a better correlation for the last 50 ns (r = 0.574) than for the first 25 ns (r = 0.266). The correlation obtained using the MMPBSA approach was worse than that obtained using the MMGBSA approach, in which a higher correlation was observed during the last 50 ns (r = 0.331) than during the first 25 ns (r = 0.103). The ΔΔG values were also calculated from our ΔG values for estimating the correlation between the predicted and experimental ΔΔG values (Fig. 6).In panels A and B of Fig. 6, a decrease in the Pearson correlation coefficient from −0.692 during the first 25 ns to −0.323 during the last 50 ns is observed for the MMPBSA approach. Similarly, for the MMPBSA approach, it was observed that the Pearson correlation coefficient reduces from −0.732 during the first 25 ns to 0.117 during the last 50 ns of the 100 ns-long MD simulations.
A comparison of the correlations of ΔG (Fig. 5) or ΔΔG (Fig. 6) using the two methods reveals that the best method for reproducing the experimental ΔG tendency in EGFR–inhibitor systems is also the MMGBSA method using long MD simulation periods, as observed for the ΔG values without considering the entropic component (Fig. 3). However, it was also observed that incorporating entropy into the prediction seriously weakens the prediction accuracy, as previously reported.33,54 On the other hand, the predicted versus experimental ΔΔG analysis indicated that short MD simulations generate a better correlation value for both methods than long MD simulations when the entropic component is incorporated in ΔG prediction. This result points out that mutations near the binding site do not require to experience significant conformational changes through long MD simulations to reach good theoretical versus experimental ΔΔG tendency, contrasting with long-distance mutations of other protein systems that require long MD simulations to get good theoretical versus experimental ΔΔG tendencies.33
3.4 Evaluating the ability of docking programs to predict the affinity
Previous research evaluated the ability of six different docking programs—four web-based knowledge-based scoring functions (DSX-ONLINE, KDEEP, Pose&Rank, and PRODIGY-LIG) and two general scoring functions (HADDOCK2.2 and PDBePISA)—to determine ΔGdocking for several wild-type and their respective mutant kinases. Correlation studies between calculated and experimental ΔΔG values (IC50, Kd, Ki) showed they could predict whether a mutation improves or worsens the binding affinity. Interestingly, the best Pearson correlation was observed for the web-based protein–ligand scoring function DSX-ONLINE with the Ki data set.57 Because we observed that the best correlation between theoretical and experimental ΔG values was obtained for the last 50 ns-long MD simulations (r = 0.779) without considering the entropic contributions, suggesting that the conformational changes did not greatly impact the theoretical ΔG values, we performed docking simulations using two different general scoring functions to obtain the predicted ΔG values (Table S13†) and evaluate their correlation with experimental ΔG values. RMSD analysis between the ligand binding pose generated by docking procedures and the cocrystallized ligand reveals RMSD values lower than 2.5 Å, however, these values are in general higher than that of MD simulations (Table S3†). A comparison of RMSD values of docking with MD simulations indicates that the ligand experiment shows lower displacement with respect to the cocrystallized ligand conformer than docking procedures, suggesting that docking procedures may unfavorably impact the protein–ligand interactions with respect to MD simulations. Fig. 7 showed a poor Pearson correlation coefficient of 0.354 for MOE (Fig. 7A), and 0.152 for SwissDock (Fig. 7B), respectively. The value reached by these two docking programs indicates that they are worse than MMGBSA and MMPBSA methods for reproducing the experimental ΔG tendency. The ΔΔG values were also calculated from our docking ΔG values for estimating the correlation between the calculated and experimental ΔΔG values (Fig. 8). In Fig. 8, a Pearson correlation coefficient of 0.405 is observed for MOE (Fig. 8B) and of −0.229 for SwissDock (Fig. 8C). A comparison between the two docking algorithms indicates that despite the low capacity of both algorithms for generating good correlation values, MOE shows a better performance than SwissDock.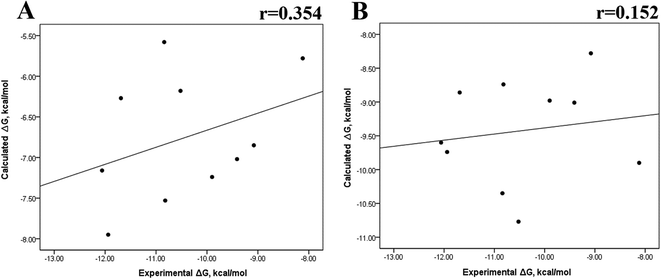 | ||
| Fig. 7 Calculated versus experimental ΔG between the mutated and the wild-type systems obtained using docking methods. Correlation obtained using MOE (A), and SwissDock (B). | ||
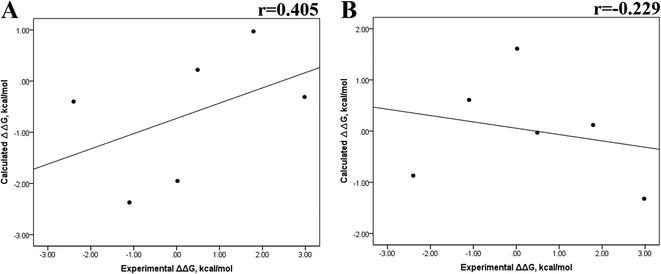 | ||
| Fig. 8 Calculated versus experimental ΔΔG between the mutated and the wild-type systems obtained using docking methods. Correlation obtained using MOE (A), and SwissDock (B). | ||
4. Conclusion
In this research, we explore the performance of the MMGBSA and MMPBSA methods under different conditions to evaluate their ability to reproduce the experimental binding tendency and the difference between wild-type and mutant EGFR–inhibitor systems. In addition, we compare these two methodologies with two docking algorithms. Our results indicate that the MMGBSA protocol without the entropic component and with a long MD simulation time of at least 100 ns is useful for obtaining good reproducibility of the experimental ΔG tendency, indicating that some conformational changes are needed to reproduce the ΔG tendency. On the other hand, the ΔΔG values between wild-type and mutant systems showed a good reproducibility tendency for both the MMGBSA and the MMPBSA protocol without the entropic component and with short MD simulations of about 25 ns. The results indicate that mutations close to the binding site do not require conformational rearrangement to reach a good experimental ΔΔG tendency. On the other hand, the two docking programs explored failed to reproduce experimental ΔG and ΔΔG tendencies, corroborating the necessity of MMGBSA or MMPBSA methods to reproduce experimental tendencies.Data availability
The datasets supporting the conclusions of this research are contained within the paper and its additional files.Conflicts of interest
The authors declare they have no conflict of interest in terms of the content of this manuscript.Acknowledgements
This work is supported by a project grant from SIP-IPN 20230344.References
- G. Manning and T. Hunter, Eukaryotic Kinomes: Genomics and Evolution of Protein Kinases, in Handb. Cell Signaling, Academic Press, California, 2nd edn, 2010, pp. 393–397 Search PubMed.
- D. Bossemeyer, Protein kinases—structure and function, FEBS Lett., 1995, 369(1), 57–61 CrossRef CAS PubMed.
- A.-P. Kornev and S. S. Taylor, Dynamics-driven allostery in protein kinases, Trends Biochem. Sci., 2015, 40(11), 628–647 CrossRef CAS PubMed.
- T. J. Weber and W. Qian, Protein Kinases, in Compr. Toxicol, Elsevier Ltd, AL, USA, 3rd edn, 2018, pp. 264–285 Search PubMed.
- F. Cruzalegui, Protein Kinases: From Targets to Anti-Cancer Drugs, Ann. Pharm. Fr., 2010, 68(4), 254–259 CrossRef CAS PubMed.
- M. Huse and J. Kuriyan, The Conformational Plasticity of Protein Kinases, Cell, 2002, 109(3), 275–282 CrossRef CAS PubMed.
- J. A. Adams, Activation Loop Phosphorylation and Catalysis in Protein Kinases: Is There Functional Evidence for the Autoinhibitor Model?, Biochemistry, 2003, 42(3), 601–607 CrossRef CAS PubMed.
- M.-P. Martin, J.-Y. Zhu, H. R. Lawrence, R. Pireddu, Y. Luo, R. Alam, S. Ozcan, S. M. Sebti, N. J. Lawrence and E. Schönbrunn, A Novel Mechanism by Which Small Molecule Inhibitors Induce the DFG Flip in Aurora A, ACS Chem. Biol., 2012, 7(4), 698–706 CrossRef CAS PubMed.
- R. S. K. Vijayan, P. He, V. Modi, K. C. Duong-Ly, H. Ma, J. R. Peterson, R. L. Dunbrack and R. M. Levy, Conformational Analysis of the DFG-Out Kinase Motif and Biochemical Profiling of Structurally Validated Type II Inhibitors, J. Med. Chem., 2015, 58(1), 466–479 CrossRef CAS PubMed.
- A. Torkamani, G. Verkhivker and N. J. Schork, Cancer Driver Mutations in Protein Kinase Genes, Cancer Lett., 2009, 281(2), 117–127 CrossRef CAS PubMed.
- J. Brognard and T. Hunter, Protein Kinase Signaling Networks in Cancer, Curr. Opin. Genet. Dev., 2011, 21(1), 4–11 CrossRef CAS PubMed.
- A. Mortlock, K. Foote, J. Kettle and B. Aquila, Kinase Inhibitors in Cancer, in Ref. Module Chem., Mol. Sci. Chem. Eng., Elsevier Ltd, 2014, p. B9780124095472110000 Search PubMed.
- A. A. Mortlock, D. M. Wilson, J. G. Kettle, F. W. Goldberg and K. M. Foote, Selective Kinase Inhibitors in Cancer, in Compr. Med. Chem. III, Elsevier Ltd, 2017, pp. 39–75 Search PubMed.
- H. Daub, K. Specht and A. Ullrich, Strategies to Overcome Resistance to Targeted Protein Kinase Inhibitors, Nat. Rev. Drug Discovery, 2004, 3(12), 1001–1010 CrossRef CAS PubMed.
- R. Barouch-Bentov and K. Sauer, Mechanisms of Drug Resistance in Kinases, Expert Opin. Investig. Drugs, 2011, 20(2), 153–208 CrossRef CAS PubMed.
- M. Koohi-Moghadam, H. Wang, Y. Wang and X. Yang, Predicting disease associated mutation of metal-binding sites in proteins using a deep learning approach, Nat. Mach. Intell., 2019, 1, 561–567 CrossRef.
- K. Hauser, C. Negron, S. K. Albanese, S. Ray, T. Steinbrecher, R. Abel, J. D. Chodera and L. Wang, Predicting Resistance of Clinical Abl Mutations to Targeted Kinase Inhibitors Using Alchemical Free-Energy Calculations, Commun. Biol., 2018, 1, 70 CrossRef PubMed.
- M. Aldeghi, V. Gapsys and B. L. de Groot, Predicting kinase inhibitor resistance: physics-based and data-driven approaches, ACS Cent. Sci., 2019, 5, 1468–1474 CrossRef CAS PubMed.
- A. P. Bhati, S. Wan and P. V. Coveney, Ensemble-based replica exchange alchemical free energy methods: the effect of protein mutations on inhibitor binding, J. Chem. Theory Comput., 2019, 15, 1265–1277 CrossRef CAS PubMed.
- S. Iqbal, F. Li, T. Akutsu, D. B. Ascher, G. I. Webb and J. Song, Assessing the performance of computational predictors for estimating protein stability changes upon missense mutations, Briefings Bioinf., 2021, 22(6), bbab184 CrossRef PubMed.
- B. Li, Y. T. Yang, J. A. Capra and M.-B. Gerstein, Predicting changes in protein thermodynamic stability upon point mutation with deep 3D convolutional neural networks, PLoS Comput. Biol., 2020, 16, e1008291 CrossRef CAS PubMed.
- V. Gapsys, L. Pérez-Benito, M. Aldeghi, D. Seeliger, H. van Vlijmen, G. Tresadern and B. L. de Groot, Large scale relative protein ligand binding afnities using non-equilibrium alchemy, Chem. Sci., 2019, 11, 1140–1152 RSC.
- W. Jespers, G. V. Isaksen, T. A. Andberg, S. Vasile, A. van Veen, J. Åqvist, B. O. Bramdsdal and H. Gutiérrez-de-Terán, QresFEP: an automated protocol for free energy calculations of protein mutations in Q, J. Chem. Theory Comput., 2019, 15, 5461–5473 CrossRef CAS PubMed.
- Z. Li, Y. Huang, Y. Wu, J. Chen, D. Wu, C. Zhan and H. Luo, Absolute binding free energy calculation and design of a subnanomolar inhibitor of phosphodiesterase-10, J. Med. Chem., 2019, 62, 2099–2111 CrossRef CAS PubMed.
- J. Chen, X. Wang, L. Pang, J. Z. H. Zhang and T. Zhu, Efect of mutations on binding of ligands to guanine riboswitch probed by free energy perturbation and molecular dynamics simulations, Nucleic Acids Res., 2019, 47, 6618–6631 CrossRef CAS PubMed.
- E. Wang, H. Sun, J. Wang, Z. Wang, H. Liu, J. Z. H. Zhang and T. Hou, End-point binding free energy calculation with MM/PBSA and MM/GBSA: strategies and applications in drug design, Chem. Rev., 2019, 119, 9478–9508 CrossRef CAS PubMed.
- P. A. Kollman, I. Massova, C. Reyes, B. Kuhn, S. Huo, L. Chong, M. Lee, T. Lee, Y. Duan, W. Wang, O. Donini, P. Cieplak, J. Srinivasan, D. A. Case and T. E. Cheatham 3rd, Calculating structures and free energies of complex molecules: combining molecular mechanics and continuum models, Acc. Chem. Res., 2000, 33, 889–897 CrossRef CAS PubMed.
- X. Kong, H. Sun, P. Pan, S. Tian, D. Li, Y. Li and T. Hou, Molecular principle of the cyclindependent kinase selectivity of 4-(thiazol-5-yl)-2-(phenylamino) pyrimidine-5-carbonitrile derivatives revealed by molecular modeling studies, Phys. Chem. Chem. Phys., 2016, 18, 2034–2046 RSC.
- H. Sun, Y. Li, D. Li and T. Hou, Insight into crizotinib resistance mechanisms caused by three mutations in ALK tyrosine kinase using free energy calculation approaches, J. Chem. Inf. Model., 2013, 53, 2376–2389 CrossRef CAS PubMed.
- S. Ikemura, H. Yasuda, S. Matsumoto, M. Kamada, J. Hamamoto, K. Masuzawa, K. Kobayashi, T. Manabe, D. Arai, I. Nakachi, I. Kagawa, K. Ishioka, M. Nakamura, H. Namkoong, K. Naoki, F. Ono, M. Araki, R. Kanada, B. Ma, Y. Hayashi, S. Mimaki, K. Yoh, S. S. Kobayashi, T. Kohno, Y. Okuno, K. Goto, K. Tsuchihara and K. Soejima, Molecular dynamics simulation-guided drug sensitivity prediction for lung cancer with rare EGFR mutations, Proc. Natl. Acad. Sci. U.S.A., 2019, 116, 10025–10030 CrossRef CAS PubMed.
- S. Fulle, J. S. Saini, N. Homeyer and H. Gohlke, Complex long-distance efects of mutations that confer linezolid resistance in the large ribosomal subunit, Nucleic Acids Res., 2015, 43, 7731–7743 CrossRef CAS PubMed.
- A. J. Clark, C. Negron, K. Hauser, M. Sun, L. Wang, R. Abel and R. A. Friesner, Relative binding afnity prediction of charge-changing sequence mutations with FEP in protein–protein interfaces, J. Mol. Biol., 2019, 431, 1481–1493 CrossRef CAS PubMed.
- Y. Yu, Z. Wang, L. Wang, S. Tian, T. Hou and H. Sun, Predicting the mutation effects of protein-ligand interactions via end-point binding free energy calculations: strategies and analyses, J. Cheminf., 2022, 14(1), 56 CAS.
- A. Waterhouse, M. Bertoni, S. Bienert, G. Studer, G. Tauriello, R. Gumienny, F. T. Heer, T. A. P. de Beer, C. Rempfer, L. Bordoli, R. Lepore and T. Schwede, SWISS-MODEL: homology modelling of protein structures and complexes, Nucleic Acids Res., 2018, 46(W1), W296–W303 CrossRef CAS PubMed.
- D. A. Case, T. E. Cheatham 3rd, T. Darden, H. Gohlke, R. Luo, K. M. Merz Jr, A. Onufriev, C. Simmerling, B. Wang and R. J. Woods, The Amber biomolecular simulation programs, J. Comput. Chem., 2005, 26, 1668–1688 CrossRef CAS PubMed.
- A. Jakalian, D. B. Jack and C. I. Bayly, Fast, efficient generation of high-quality atomic charges. AM1-BCC model: II. Parameterization and validation, J. Comput. Chem., 2002, 23, 1623–1641 CrossRef CAS PubMed.
- C. Tian, K. Kasavajhala, K. A. Belfon, L. Raguette, H. Huang, A. N. Migues, J. Bickel, Y. Wang, J. Pincay, Q. Wu and C. Simmerling, ff19SB: Amino-acid-specific protein backbone parameters trained against quantum mechanics energy surfaces in solution, J. Chem. Theory Comput., 2020, 16(1), 528–552 CrossRef PubMed.
- W. L. Jorgensen, J. Chandrasekhar, J. D. Madura, R. W. Impey and M. L. Klein, Comparison of simple potential functions for simulating liquid water, J. Chem. Phys., 1983, 79, 926–935 CrossRef CAS.
- H. J. C. Berendsen, J. P. M. Postma, W. F. van Gunsteren, A. DiNola and J. R. Haak, Molecular dynamics with coupling to an external bath, J. Chem. Phys., 1984, 81, 3684–3690 CrossRef CAS.
- B. P. Uberuaga, M. Anghel and A. F. Voter, Synchronization of trajectories in canonical molecular-dynamics simulations: Observation, explanation, and exploitation, J. Chem. Phys., 2004, 120, 6363–6374 CrossRef CAS PubMed.
- D. J. Sindhikara, S. Kim, A. F. Voter and A. E. Roitberg, Bad Seeds Sprout Perilous Dynamics: Stochastic Thermostat Induced Trajectory Synchronization in Biomolecules, J. Chem. Theory Comput., 2009, 5, 1624–1631 CrossRef CAS PubMed.
- T. Darden, D. York and L. Pedersen, Particle mesh Ewald: AnN·log(N) method for Ewald sums in large systems, J. Chem. Phys., 1993, 98, 10089–10092 CrossRef CAS.
- D. M. York, T. A. Darden and L. G. Pedersen, The effect of long-range electrostatic interactions in simulations of macromolecular crystals: a comparison of the Ewald and truncated list methods, J. Chem. Phys., 1993, 99, 8345–8383 CrossRef CAS.
- J. P. Ryckaert, G. Ciccotti and H. J. C. Berendsen, Numerical integration of the Cartesian equations of motion of a system with constraints: molecular dynamics of n-alkanes, J. Comput. Phys., 1997, 23, 327–341 CrossRef.
- B. R. Miller 3rd, T. D. McGee, J. M. Swails, N. Homeyer, H. Gohlke and A. E. Roitberg, MMPBSA.py: an efficient program for end-state free energy calculations, J. Chem. Theory Comput., 2012, 8, 3314–3321 CrossRef PubMed.
- J. Weiser, P. S. Shenkin and W.-C. Still, Approximate atomic surfaces from linear combinations of pairwise overlaps (LCPO), J. Comput. Chem., 1999, 20, 217–230 CrossRef CAS.
- A. Onufriev, D. Bashford and D.A. Case, Exploring protein native states and large-scale conformational changes with a modified generalized born model, Proteins, 2004, 55, 383–394 CrossRef CAS PubMed.
- C. Tan, L. Yang and R. Luo, How well does Poisson-Boltzmann implicit solvent agree with explicit solvent? A quantitative analysis, J. Phys. Chem. B, 2006, 110, 18680–18687 CrossRef CAS PubMed.
- H. Sun, Y. Li, S. Tian, L. Xu and T. Hou, Assessing the performance of MM/PBSA and MM/GBSA methods. 4. Accuracies of MM/PBSA and MM/GBSA methodologies evaluated by various simulation protocols using PDBbind data set, Phys. Chem. Chem. Phys., 2014, 16, 16719–16729 RSC.
- H. Sun, L. Duan, F. Chen, H. Liu, Z. Wang, P. Pan, F. Xhu, J. Z. H. Zhang and T. Hou, Assessing the performance of MM/PBSA and MM/GBSA methods. 7. Entropy efects on the performance of end-point binding free energy calculation approaches, Phys. Chem. Chem. Phys., 2018, 20, 14450–14460 RSC.
- Molecular Operating Environment (MOE), Chemical Computing Group Inc. Home Page, Montreal, Quebec, Canada, 2014, https://www.chemcomp.com/.
- A. Grosdidier, V. Zoete and O. Michielin, SwissDock, a protein-small molecule docking web service based on EADock DSS, Nucleic Acids Res., 2011, 39(suppl_2), W270–W277 CrossRef CAS PubMed.
- M. D. Hanwell, D. E. Curtis, D. C. Lonie, T. Vandermeersch, E. Zurek and G. R. Hutchison, Avogadro: an advanced semantic chemical editor, visualization, and analysis platform, J. Cheminf., 2012, 4(1), 1–17 Search PubMed.
- P. Soderhjelm, J. Kongsted and U. Ryde, Ligand affinities estimated by quantum chemical calculations, J. Chem. Theory Comput., 2010, 1726–1737 CrossRef PubMed.
- S. Genheden and U. Ryde, The MM/PBSA and MM/GBSA methods to estimate ligand-binding affinities, Expert Opin. Drug Discovery, 2015, 10(5), 449–461 CrossRef CAS PubMed.
- T. Hou, J. Wang, Y. Li and W. Wang, Assessing the performance of the molecular mechanics/Poisson Boltzmann surface area and molecular mechanics/generalized Born surface area methods. II. The accuracy of ranking poses generated from docking, J. Comput. Chem., 2011, 32(5), 866–877 CrossRef CAS PubMed.
- M. Erguven, T. Karakulak, M. K. Diril and E. Karaca, How Far Are We from the Rapid Prediction of Drug Resistance Arising Due to Kinase Mutations?, ACS Omega, 2021, 6(2), 1254–1265 CrossRef CAS PubMed.
Footnote |
| † Electronic supplementary information (ESI) available. See DOI: https://doi.org/10.1039/d3ra04916g |
| This journal is © The Royal Society of Chemistry 2023 |

