 Open Access Article
Optimizing oxygen vacancies and electrochemical performance of CeO2−δ nanosheets through the combination of di- and tri-valent doping
Jun Xiea,
Muneerah Alomarc,
M. A. K. Yousaf Shah b,
Muhammad Sultan Arshad
 d and
Naveed Mushtaq
 *e
*e
aSchool of Electronic Engineering, Nanjing Xiaozhuang University, Nanjing 211171, China. E-mail: xiejun@njxzc.edu.cn
bJiangsu Provincial Key Laboratory of Solar Energy Science and Technology/Energy Storage Joint Research Center, School of Energy and Environment, Southeast University, No. 2 Si Pai Lou, Nanjing 210096, China
cDepartment of Physics, College of Science, Princess Nourah bint Abdulrahman University, P. O. Box 84428, Riyadh 11671, Saudi Arabia. E-mail: MUNAlomar@pnu.edu.sa
dMinistry of Education Key Laboratory for the Green Preparation and Application of Functional Materials, Hubei Key Laboratory of Polymer Materials (Hubei University), Collaborative Innovation Center for Advanced Organic Chemical Materials Co-Constructed by the Province and Ministry School of Materials Science and Engineering, Hubei University, Wuhan 430062, China. E-mail: muhammadsultanirshad@hubu.edu.cn
eSchool of Physics, Electronics and Intelligent Manufacturing, Huaihua University, Huaihua, 418000, China. E-mail: naveedmushtaq@seu.edu.cn
First published on 11th September 2023
Abstract
Ceramic fuel cells presently hold an important position in the future of sustainable energy. However, new concepts and designs are vital for each individual cell's component materials to improve the overall power output and stability. The limited ionic conductivity of the electrolyte component is one major challenge among these. In the present work, we developed nanosheets with a cubic fluoride structure of CeO2 and introduced the di- and tri-valent doping of La and Sr to study their impact on oxygen vacancies and its ionic transport, keeping in mind the fact that CeO2 is reduced when exposed to a reducing atmosphere. The attained La- and Sr-doped fluorite structures of CeO2 exhibited good ionic conductivity of >0.05 S cm−1 at low temperature, and their use in a fuel cell resulted in achieving a power output of >900 mW cm−2 while operating at 550 °C. Therefore, we have found that laterally combining di- and tri-valent doping could be textured to give a highly oxygen-deficient CeO2 structure with high ionic transport. Furthermore, various microscopic and spectroscopic analyses, such as HR-TEM, XPS, Raman, UV-visible, EIS, and density functional theory, were applied to investigate the change in structural properties and mechanism of the ionic transport of the synthesized La and Sr co-doped CeO2 electrolyte. This work provides some new insights for designing high-ionic-conductivity electrolytes from low-cost semiconductor oxides for energy storage and conversion devices.
1 Introduction
The term solid oxide fuel cells (SOFCs) was coined for the feasible and attractive devices for converting chemical energy directly into electrical energy with negligible pollution. This is one of the compatible and competitive candidates for the efficient production of sustainable energy to meet the present and ever-increasing high energy demand. However, there is a problem associated with the required high ionic conduction and low-temperature operation, which has limited the advancement and full commercialization of SOFCs.1 Therefore, researchers are devoting great efforts to overcome this problem to enhance ionic conduction in the electrolyte and pursuing options for low-temperature operation.1–3 In this regard, various technical efforts have been made in terms of micro-thin film technology to reduce the size of the induced electrolyte layer to overcome the associated problems,4–6 which could help to overcome polarization losses under a reduced operating temperature; however, micro-thin film technology involves an expensive and complex method.7 Therefore, Goodenough et al. proposed investigating and designing new oxide-ion conductors as alternative materials for use with the possible low temperatures and to be technically useful.8 However, despite the great efforts of many researchers to design and investigate new oxide materials for high ionic conductivity, still the materials are constrained below the level of 0.1 S cm−1 ionic conductivity.9The addition of ceria or ceria-based materials has drawn significant attention due to their highly active and demonstrated multifunctionality in many fields, such as catalytic and electronic applications, solar cells and photoelectrochemistry, lithium batteries, sensors and biosensor, fuel cells, and a variety of other energy-related applications.10–21 One of the attractive characteristics of ceria is the easily changeable oxidation states in the Ce4+/Ce3+ redox cycle that can be used to release and store oxygen, which would be entirely dependent on the concentration and type of oxygen vacancies in the lattice, as well the surface structures and states. There are unique physical properties linked with Ce3+ ions and oxygen vacancies, but issues also exist, especially for doped ceria oxides, which concern the redox instability induced by the reduction from Ce4+ to Ce3+, resulting in electronic conduction and an undesirable structural change.22,23 However, ceria is considered a competent candidate as an electrolyte for SOFCs and has been reported in heterostructures as well as in dopants. In this regard, the use of 7CeO2–3CuO composite as an electrolyte was reported, where Ce played a key role in achieving a high ionic conductivity of 0.137 S cm−1 at 550 °C.24 Furthermore, Qiao Z. et al. reported doping ceria with ZnO in a composite weight ratio of 7LCP-3ZnO, where the primary part was doped ceria and contributed significantly to the increase in the ionic conductivity.25
Moreover, Wachsman and Lee reported co-doped bismuth-oxide-based materials and demonstrated the known highest conductivity as a solid-state oxide electrolyte for SOFCs.26 Furthermore, the ceria was further tuned by introducing δ-Bi2O3 via the formation of coherent and high interfaces of Er2O3-stabilized δ-Bi2O3 and Gd2O3-doped CeO2.27 Interestingly, the designed layered structured materials with highly coherent interfaces demonstrated exceptionally high chemical stability even in a reducing environment and repeated redox cycles at elevated temperature. In addition, the introduction of thulium doping into SrCeO2 led to a significantly enhanced ionic conductivity 0.13 S cm−1 at 550 °C resulting from the bulk doping; however, there remains a need to modify ceria with new dopants to achieve stable and high ionic conductivity at low operating temperature with high power density.
Inspired from the above discussion, we introduced dopants of La and Sr into ceria to form La0.15Sr0.05Ce0.80O2 (LSC) and applied this as an electrolyte in CFC for the enhancement of ionic conductivity and power density. The as-prepared materials were physically characterized to analyze the phase pattern, microstructure and surface morphology, chemical and oxidation states, weight loss, and formation of oxygen vacancies via X-ray diffraction, high-resolution transmission electron microscopy (HR-TEM), field emission scanning electron microscopy (FE-SEM), XPS, and TGA. In addition, the as-prepared LaSrCeO2−δ was used as an electrolyte membrane, which generated a high content of oxygen vacancies, resulting in an enhanced ionic conductivity, and demonstrated high electrochemical performance compared to pure CeO2, respectively.
2 Experimental methods
2.1 Materials and methods
2.2 Material characterizations
The phase structures of the above-synthesized samples were determined using a Bruker D8 advanced X-ray diffractometer (Germany, Bruker Corporation) with Cu Kα radiation (λ = 1.5418 Å). The scan range of 2θ was set from 20°–80° with a scanning step of 0.02°. X-Ray diffractometer refinements were done using MJAD 6.5 software. High-resolution transmission electron microscopy was performed using the FEI Tecnai GI F30 system along with energy-dispersive spectroscopy and element mapping of the LSC samples. The surface morphological features of the synthesized samples were studied by FESEM (JEOL JSM7100F). A Physical Electronics Quantum 2000 system with a source of Al Kα X-rays was hired for the surface and chemical analysis. CASA XPS software was used to analyze the XPS data. An NT-MDT Raman spectrometer at 532 nm and with a 20 mW solid-state laser source was used to measure the Raman spectra of pure CeO2 and gradiently doped CeO2. Kelvin probe force microscopy (KPFM, Bruker Multimode 8) was employed to detect the surface potential height images for the LSC samples with the tapping mode in comparison with CeO2.2.3 Cell fabrication and electrochemical measurements
The preparation of dense electrolyte membranes on porous electrodes is an important step for the fabrication of high-performance CFCs. In our study, we used a simple dry-pressing method to prepare a ceria-based and doped CeO2 electrolyte on a Ni0.8Co0.15Al0.05LiO2−δ symmetrical electrode. In details, a Ni0.8Co0.15Al0.05LiO2−δ, (NCAL) solid powder was obtained from Bamo Sci. & Tech. Joint Stock Ltd, China. A slurry of NCAL was made by mixing it with terpinol + ethanol (90% + 10% volume ratio). The obtained slurry of NCAL was fixed on porous Ni-foam of 2.5 mm thickness and laterally followed by drying at 130 °C for 4 h to remove organic compounds to serve as the electrode. However, the high-density filled CeO2 and LSC electrolyte powders were sandwiched in-between the Ni-foam painted-NCAL electrode and simultaneously pressed at 200 MPa to obtain complete tri-layer fuel cells. The thickness of the fuel cells after pressing was about 150 μm with an active-area of 0.64 cm2, respectively. An ITECH8511 system (ITECH Electrical Co., Ltd) was used to measure the electrochemical performance of the fabricated fuel cell using H2 fuel and air with a flow rate of 120–130 mL min−1 and 100 ml min−1, respectively. The current density–voltage (I–V) and current density-power density (I–P) were recorded for presentation of the I–V and I–P curves. A Gamry ref. 3000 system was used to measure the electrochemical impedance spectroscopy in open-circuit voltage (OCV) conditions. The impedance spectra were measured in the frequency range of 106 to 0.01 Hz along with a 10 mV dc signal. ZSIMPWIN 3.3 software was used to model the EIS data.2.4 Density functional theory (DFT) calculations
DFT calculations of the La and Sr co-doped CeO2 structure were performed with the Vienna ab initio simulation package with the projector augmented wave (PAW) method for the undoped and doped CeO2. The ion exchange–correlation with electrons was described and controlled using the GGA + U (generalized gradient approximation) and PBE (Perdew–Burke–Ernzerhof) method with a plane wave cut-off energy of 520 eV. The values of Ueff = U were set to 6.30 for Ce 4-f, respectively. A 2 × 2 × 2 k-point grid Brillouin zone of each structure was used for the calculations. The geometry of each supercell was relaxed until the forces at each atom became smaller than 0.01 eV Å−1 and the energy change was less than 1 × 10⁻⁴ eV. The reaction pathways for the protons were accurately examined using the climbing-image nudged elastic band method (CI-NEB).28 The vacancy formation energy (E![[V with combining umlaut]](https://www.rsc.org/images/entities/i_char_0056_0308.gif) O) was calculated as,
O) was calculated as,E![[V with combining umlaut]](https://www.rsc.org/images/entities/i_char_0056_0308.gif) O = Etot(voq) − Etot(ideal) + μ + q(EF + Evalan + ΔV) O = Etot(voq) − Etot(ideal) + μ + q(EF + Evalan + ΔV) |
![[V with combining umlaut]](https://www.rsc.org/images/entities/i_char_0056_0308.gif) o is the vacancy formation energy, Etot (voq) is the superlattice's total energy in the q charge state, Etot (ideal) is total energy of the ideal structure, μ is the chemical potential, EF is the orientation of the Fermi level, Evalan refers to the valence band maximum, and ΔV is the change in the electrostatic potential with the defective lattice.
o is the vacancy formation energy, Etot (voq) is the superlattice's total energy in the q charge state, Etot (ideal) is total energy of the ideal structure, μ is the chemical potential, EF is the orientation of the Fermi level, Evalan refers to the valence band maximum, and ΔV is the change in the electrostatic potential with the defective lattice.
3 Results and discussion
3.1 Structural and compositional study
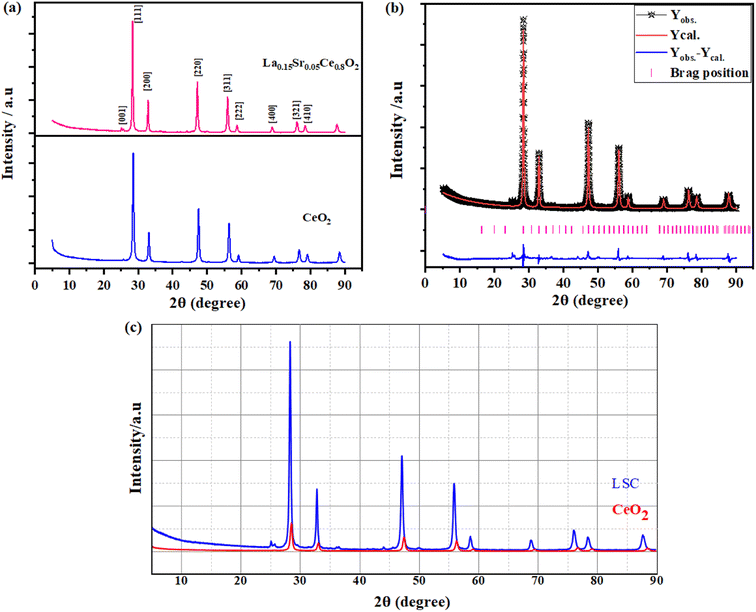
To prove the incorporation of interstitial La and Sr-doping into the CeO2 crystal structure, various characterization techniques were employed, and a detailed comparison between the doped and undoped materials is discussed below. The XRD patterns of CeO2, and La–Sr co-doped CeO2 (LSC) are shown in Fig. 1a, where it can be observed that the pure CeO2 crystal and LSC structure had identical XRD patterns without any secondary phase with the Fm![[3 with combining macron]](https://www.rsc.org/images/entities/char_0033_0304.gif) 221 space group.28 However, Rietveld refinement of the XRD pattern for pristine La–Sr co-doped CeO2 (LSC) materials was done with the FullProf Suite software. Fig. 1b shows the Rietveld refinement pattern of LSC, where the calculated patterns are shown by solid red curves, and the black empty bullets show the observed intensities, while the differences between the observed and calculated intensities are presented by solid blue curves with a violet bar space group. Apparently, the diffraction peaks of the as-prepared target could be indexed as a typical fluoride structure with the space group Fm
221 space group.28 However, Rietveld refinement of the XRD pattern for pristine La–Sr co-doped CeO2 (LSC) materials was done with the FullProf Suite software. Fig. 1b shows the Rietveld refinement pattern of LSC, where the calculated patterns are shown by solid red curves, and the black empty bullets show the observed intensities, while the differences between the observed and calculated intensities are presented by solid blue curves with a violet bar space group. Apparently, the diffraction peaks of the as-prepared target could be indexed as a typical fluoride structure with the space group Fm![[3 with combining macron]](https://www.rsc.org/images/entities/char_0033_0304.gif) , except for the increase in the lattice constant, which can clearly be seen by the apparent shift of the XRD peaks to lower angles for the La, Sr-doped CeO2 sample. The increase in the lattice parameter for La–Sr Co-doping CeO2 could possibly be due to the larger ionic radii of La and Sr compared to Ce4+/3+ ions.29
, except for the increase in the lattice constant, which can clearly be seen by the apparent shift of the XRD peaks to lower angles for the La, Sr-doped CeO2 sample. The increase in the lattice parameter for La–Sr Co-doping CeO2 could possibly be due to the larger ionic radii of La and Sr compared to Ce4+/3+ ions.29
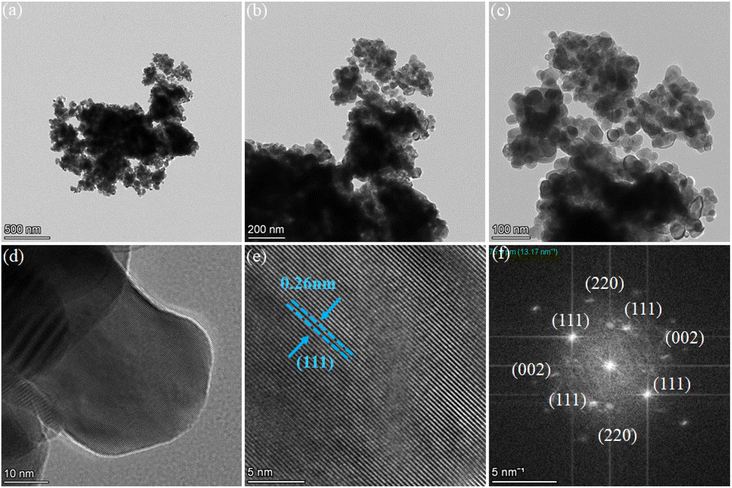
Moreover, the HR-TEM images confirmed the nanosheets-type morphology of the synthesized LSC powders. The LSC nanosheets had diameters of 20–30 nm as shown in Fig. 2a–c. Afterward, HR-TEM was used to study the crystal planes and the lattice spacing of 0.26 nm corresponding to the (111) plane of cubic LSC fluorite structure, indicating that when the (111) planes were exposed to the crystal face some structural defects/disorder were generated at the exposed surfaces, as shown in Fig. 2d and e. Furthermore, selected area electron diffraction (SAED) was performed for the multiplanes of the LSC pattern, as shown in Fig. 2f, where the main diffraction patterns of the (111), (002), and (220) planes can be observed.28,29
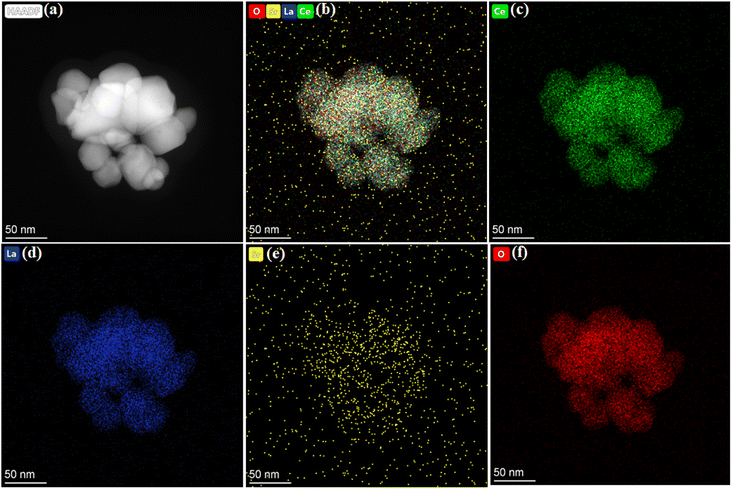
Furthermore, Fig. 3a shows the high annular dark-field image of La0.15Sr0.05Ce0.8O2−δ, where the grain level interactions of each grain can be clearly seen with sophisticated and fine nano-sized sheets with diameters of 20–30 nm.30 To confirm the elemental distribution at the particle level, energy-dispersive spectrometry (EDS) mapping was performed using HAADF-STEM, as shown in the image in Fig. 3a. Fig. 3b–f show the elemental mapping of La0.15Sr0.05Ce0.8O2−δ, where a homogenous chemical spreading of each individual element, such as La, Sr, and Ce, could be seen, confirming the well-controlled nanosheets formation with a homogenous chemical concentration.31
3.2 Spectroscopic analysis of the LSC electrolyte
Fig. 4a displays the typical SEM image of the LSC electrolyte. The SEM image also shows that the LSC electrolyte seemed to be fully nanostructured. Further, XPS spectroscopy was used to deeply understand the characteristics of La and Sr doping on the structural properties.21,32 Moreover, Fig. 4b–f show the XPS plots of the high-resolution XPS spectra and XPS survey of each element in the pristine and doped sample for comparison. Fig. 4b shows the XPS spectra of the Ce-3d of pristine CeO2 and of the La- and Sr-doped sample. The Ce4+ and Ce3+ peaks of the LSC sample appeared at 881.8/901.2 eV and 898.2/916.3 eV, whereas for pure CeO2, the Ce4+ and Ce3 peaks were at 882.212/901.65 and 898.52/916.78 eV,16,28,29 respectively, showing a significant change in the binding energy as a shift down to about 0.5 ± 0.05 eV for LSC, related to the Ce-3d of CeO2. However, the Ce3+ concentration in LSC was higher than that of the pure CeO2, indicating an obvious signal for the presence of oxygen vacancies and maintaining the overall charge neutrality. The O 1s XPS spectra could further provide information about its ionic conductivity. However, the O 1s spectra of LSC comprised peaks for lattice O2, highly oxidant O2, surface-active oxygen, and surface adsorbed water, wherein the representative peaks were located at 528.8, 529.5, 530.1, and 531.4 eV, respectively. The LSCC sample showed a relatively high surface-active to lattice O2 ratio compared to that of the individual CeO2 (as shown in Fig. 4c). This indicator can be used for the assessment of LSC as having high adsorption abilities. The high surface-active to lattice O2 ratio also provides information that La- and Sr-doping in the CeO2 lattice provide better surface coverage for absorbing hydroxide species, which is mandatory for O2−/H+ transport.22,23 However, the XPS results confirmed that the gradiently doped CeO2 sample had a high surface-active oxygen species density, which could be described as providing an important role in proton conduction. The effects of gradient doping on the proton transport and electrochemical performance are further explored in the following parts.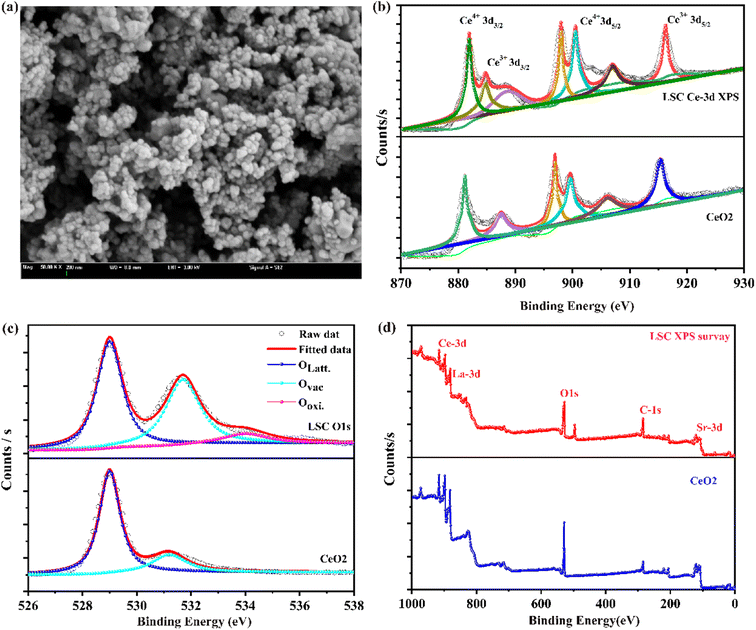 | ||
| Fig. 4 (a) SEM image of La0.15Sr0.05Ce0.8O2 powders, (b–d) X-ray photoelectron spectra of LSC and CeO2 corresponding high-resolution XPS spectra of Ce-3d, O 1s, and the XPS survey, respectively. | ||
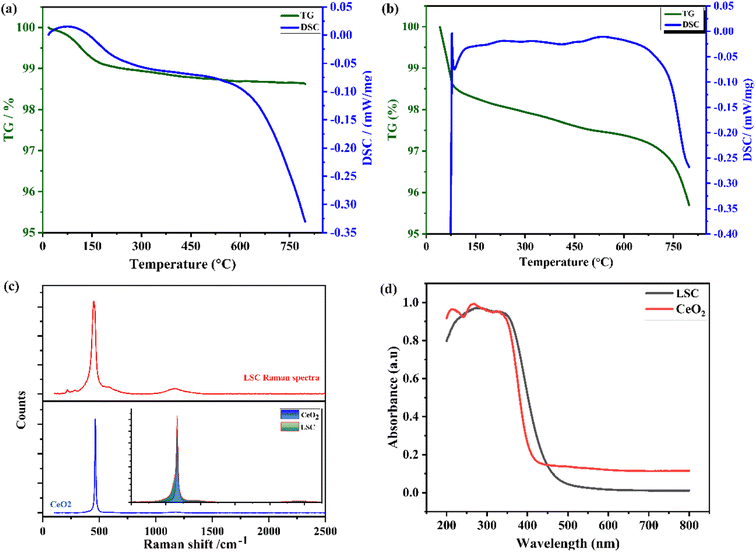
Furthermore, TGA/DSC analysis was carried out for CeO2 and LSC in the air at a temperature range of 25–800, and plots of the obtained data are shown in Fig. 5a and b, respectively. The initial weight loss at a low operating temperature of 25–180 could be due to the physisorbed water content.31,32 The mass change (loss) progressively increased with temperature up to a high value above 600, when the powders started to be thermally reduced and released the lattice oxygen to form oxygen vacancies. The LSC sample showed the highest mass loss at this temperature, indicating that the LSC sample could exhibit more ionic conductivity compared to the pure CeO2 sample.33 The differential scanning calorimetry (DSC) curve showed obvious thermal effects, indicating that there were 1st-order phase transitions in both samples. Furthermore, Raman spectroscopy was employed for structural characterization of the LSC in comparison to pure CeO2. Fig. 5c displays the specific Raman shifts in the bands centered at 463 cm−1 corresponding to the stretching vibrations of F_2g, indicating the symmetric vibration of oxygen ions around Ce4+ ions in CeO2 (octahedra sites).29,34–36 The significant shift to lower wavenumber values was due to the cell expansion resulting from the substitution of dopants ions in the CeO2 lattice and the subsequent loss of oxygen around the cation sites. A singlet Raman peak observed around ∼1083 cm−1 in the calcined and sintered sample of LSC arose from the symmetric stretching vibration of Na2CO3, which could be because of the precipitating agent. Further, the effect of the co-doping of La and Sr into CeO2 was investigated through the energy band gap by UV-vis spectroscopy, as shown in Fig. 5d. Initially, UV-vis was employed to record the absorbance spectra in the range from 200–800 nm. There was a sharp absorption peak, and the spectra of CeO2 showed slightly higher absorbance than LSC. It could be noticed that there was a red-shift at the absorption edge and this red-shift signified the shallow levels in the energy bandgap due to the increase in doping concentration. The optical bandgaps of both the intermediate and lower concentrations of doping could be calculated via the following relation:33: (αhv) = βo (hv − Eg)n, where α, hv, Eg, βo, and n denote the absorbance coefficient, energy of photons, energy band gap, constant, and the type of bandgap, respectively. The linear part of the graph where hv and (αhv)2 meet the x-axis gives the value of the bandgap.34 The obtained energy bandgaps via that equation were 3.2 and 2.91 eV for CeO2 and LSC, respectively, which shows that co-doping induced a lower bandgap value than for pure CeO2. This lowering of the energy bandgap value suggested the formation of an intermediate energy level in-between the conduction and valence band levels. Additionally, the decrease in the bandgap is also helpful for reducing the activation energy for the transport of ionic conduction. Therefore, analysis of the energy bandgaps based on the co-doping of La and Sr into CeO2 provided us with evidence to assist in the formation of oxygen vacancies during the transport of charge carriers from the valence band to the conduction band, which can lead to the easy and fast transport of ion conduction.35–37
3.3 Electrochemical performance measurements
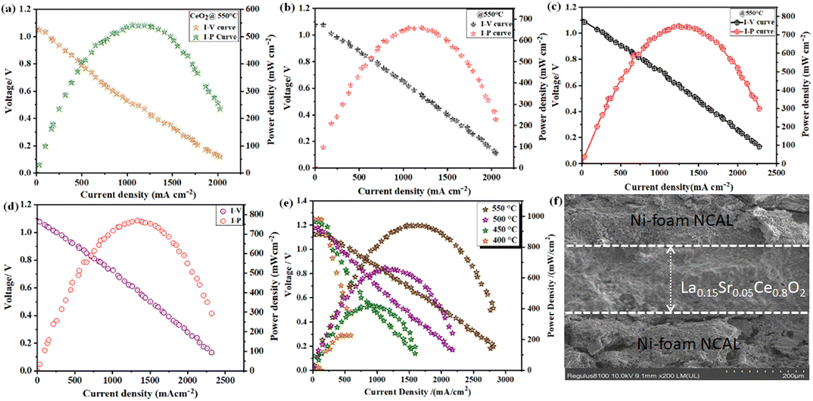
Fig. 6a–e show the I–V and I–P characteristic plots of the fuel cells with CeO2, Sr-doped CeO2, La-doped CeO2, 10% Sr, 10% La-doped CeO2, and 5% Sr- and 15% La-doped CeO2 electrolytes-based fuel cells operating at 550 °C, respectively. The highest OCV of above 1.1 V and power density of 910 mW cm−2 were achieved for the 15% La and 5% Sr–CeO2-based electrolyte fuel cell, while the pure CeO2 electrolyte-based fuel cell exhibited a power densities of 520 mW cm−2; while the values were 660 and 750 mW cm−2 for the individual Sr and La-doped CeO2 electrolyte-based fuel cells, respectively. The OCV value of 1.12 V at 550 °C was in good agreement with the Nernst theoretical potential, expressing the ionic transfer number in the LSC electrolyte was near to unity.18,38Moreover, the 15%La and 5%Sr-doped CeO2-based electrolyte fuel cell also displayed an admirable electrochemical performance at lower operating temperatures. Fig. 6e shows the I–V and I–P curves of the LSC electrolyte operating at different temperatures, and power densities of 640, 420, and 228 mW cm−2 were achieved at 500 °C, 450 °C, and 400 °C, respectively. Therefore, the higher performance of the LSC electrolyte fuel cell over the CeO2 and individual La- and Sr-doped CeO2 cells further show the vital role of the co-doping of tri-valent La and di-valent Sr to drive faster ion transport with a lower energy barrier. Fig. 6f displays a typical-three-layered cross-sectional SEM image of the LSC electrolyte-based fuel cell attained after online sintering and a fuel test. The SEM image shows that the LSC electrolyte layer was fully dense, without obvious connected pores, and was well-adhered on the porous anode layer.
3.4 Electrochemical impedance and electrical properties
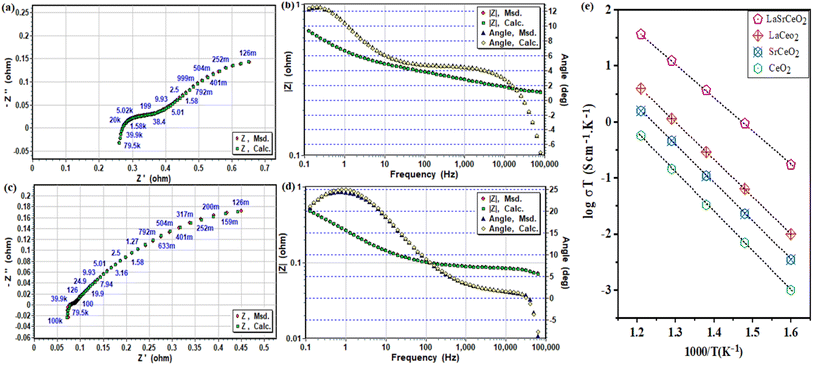
Moreover, EIS was used to understand the electrochemical process of the LSC electrolyte-based fuel cell compared with the pure CeO2 electrolyte-based cell. Fig. 6a–d show the Nyquist and Bode plots of the EIS spectra in OCV conditions. Furthermore, model circuiting was used to model the EIS spectra, e.g., Ro − (R1 − CPE1) − (R2 − CPE2), where Ro corresponds to the ohmic contribution to the total area specific resistance (ASR) that come from the electrolyte layer, and R1 and R2 refer to the electrode polarization resistances (charge- and mass-transport resistances).39 The model circuiting results showed that both the ohmic-ASR and polarization resistance were dramatically reduced using the LSC electrolyte-based fuel cell compared with the pure CeO2 elctrolyte cell. The low ohmic-ASR of the gradiently doped LSC strongly supported the electrochemical performance, whereby a highly improved ionic transport was observed. Moreover, the decrease in electrode polarization also showed that the electrocatalytic dissociation of H2 and oxygen reduction reaction with the LSC electrolyte were improved along with the ionic conductivity.11 The fuel cell with the LSC electrolyte exhibited an ohmic-ASR of only 0.08 Ω cm2, while the charge and mass transport ASR (R1&R2) were 0.07 and 0. 38 Ω cm2, respectively at 550 °C. Whereas, the fuel cell with pure CeO2 showed an ohmic-ASR of 0.26 Ω cm2 and &R2 values of 0.14 and 0.42 Ω cm2, respectively.17,18 The small ohmic-ASR could only be due to R1 the high ionic conductivity in the electrolyte and unfortunately is common when using conventional doping methods, like just trivalent dopants Sm3+, Gd3+, and Y3+, where the vacancies remain immobile when the sample is reduced or contribute to electronic conduction when used as an electrolyte.19,20 However, the ionic conductivity of the LSC and all the other prepared electrolytes were calculated using model circuiting of the measured impedance spectra. The ionic conductivity of 0.05 S cm−1 was achieved for LSC, as shown in Fig. 7e. These achieved results show that the ionic conductivity of the LSC fluorite structure was significantly higher than that of most the used state-of-the-art oxygen- and proton-conducting electrolytes, e.g., YSZ, doped ceria, and barium zirconate-based perovskite materials.173.5 Density functional theory calculations
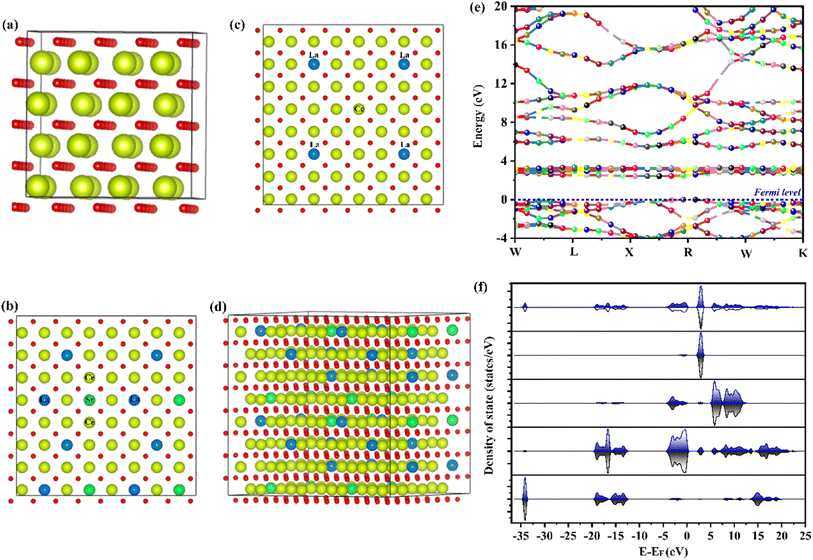
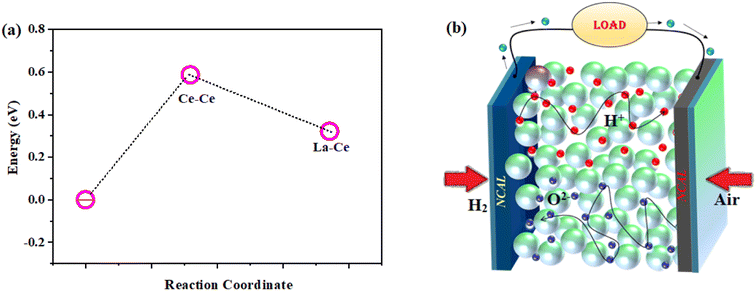
In order to deepen the understanding of gradient doping on the electronic structure, the density of states (DOS) for each individual orbital was calculated by the DFT24 method to investigate the accountable mechanism for the enhanced ionic conductivity. Fig. 8a–c display the optimized structures of CeO2, La-doped CeO2, and the La, Sr-doped CeO2 structure. However, using the conventional bulk doping, such as the Sm3+/Gd3+-doped case, oxygen vacancies can only be connected at long range. Therefore, O12− and O22− are partially occupied by different mixed coordination with d-orbital metal ions. However, the arrangement of vacancies needs a high activation energy for a random distribution. However, we introduced a combination of di- and tri-valent doping with bulk doping to consider mixed valence doping to connect the small-range vacancies with low activation energies. This positional disorder of vacancies allowed forming easy transport units with variable local geometries. Meanwhile, the energy band structure and partial DOS for pure LSC structures were calculated as shown in Fig. 8e and f, respectively. The DOS showed a gradually increased DOS value near the Fermi level, correspond to a gradually enhanced chemical activity for the absorption of ions.25,26 Also, the DOS plots of LSC revealed that La, Sr doping could narrow the bandgaps between the valence and conduction bands (Fig. 8e), corresponding to a gradually increased electron concentration.Afterward, we calculated the vacancy formation energy along different sites of the LSC structure to support our experimental findings. Fig. 9a shows the obtained results, where the minimum vacancy formation energy was exhibited by the La-![[V with combining umlaut]](https://www.rsc.org/images/entities/i_char_0056_0308.gif) o-Ce site.40–45 A schematic diagram of the fuel cell and the mechanism of the power output are shown in Fig. 9b.
o-Ce site.40–45 A schematic diagram of the fuel cell and the mechanism of the power output are shown in Fig. 9b.
4 Conclusion
The work performed herein demonstrated the excellent ionic conducting properties in nanosheets of CeO2 with a suitable combination of di- and tri-valent doping of La and Sr. The dexterous design showed a drastic improvement in power output and ionic conductivity. Further, we used different microscopic and spectroscopic analyses to study the mechanism behind the drastic increase in ionic conductivity of the LSC nanosheets in a fuel cell operation. We found that the synthesized nanostructured LSC structure could easily be modified to form an oxygen-deficient structure that facilitates ionic transport effectively when a suitable amount of di- and tri-valent elements is doped. The ex situ spectroscopies, including EIS, UV-visible, XPS, and TGA, clearly described and confirmed our findings and the structural change properties of the LSC electrolyte. In conclusion, this method could form the basis of interest to develop new oxide and proton-conducting electrolytes, which could be useful for all energy devices and material systems.Conflicts of interest
There are no conflicts to declare.Acknowledgements
This work was financially supported by Fundamental Research Funds for the Central Universities (Grant No.3203002105A2 and 4303002184), Jiangsu Provincial program (Project No. JSSCRC2021491). The partial support of this work is supported by the Foundation of Nanjing Xiaozhuang University (Grant No. 2020NXY12). This work is funded by Princess Nourah bint Abdulrahman University Researchers Supporting Project number (PNURSP2023R398), Princess Nourah bint Abdulrahman University, Riyadh, Saudi Arabia.References
- L. Fan, et al., Nanomaterials and technologies for low temperature solid oxide fuel cells: recent advances, challenges and opportunities, Nano Energy, 2018, 45, 148–176 CrossRef CAS.
- J. Will, et al., Fabrication of thin electrolytes for second-generation solid oxide fuel cells, Solid State Ionics, 2000, 131(1–2), 79–96 CrossRef CAS.
- S. de Souza, S. J. Visco and L. C. De Jonghe, Thin-film solid oxide fuel cell with high performance at low-temperature, Solid State Ionics, 1997, 98(1–2), 57–61 CrossRef CAS.
- Y.-Y. Chen and W.-C. J. Wei, Processing and characterization of ultra-thin yttria-stabilized zirconia (YSZ) electrolytic films for SOFC, Solid State Ionics, 2006, 177(3–4), 351–357 CrossRef CAS.
- H. Huang, et al., High-performance ultrathin solid oxide fuel cells for low-temperature operation, J. Electrochem. Soc., 2006, 154(1), B20 CrossRef.
- J. H. Shim, et al., Atomic layer deposition of yttria-stabilized zirconia for solid oxide fuel cells, Chem. Mater., 2007, 19(15), 3850–3854 CrossRef CAS.
- C. Xia, et al., Shaping triple-conducting semiconductor BaCo0.4Fe0.4Zr0.1Y0.1 O3-δ into an electrolyte for low-temperature solid oxide fuel cells, Nat. Commun., 2019, 10(1), 1–9 CrossRef CAS PubMed.
- J. B. Goodenough, Oxide-ion conductors by design, Nature, 2000, 404(6780), 821–823 CrossRef CAS PubMed.
- J. Xu, et al., Phase formation and conductivity degradation of Sr1−xKxSiO3−0.5x ionic conductors, J. Mater. Chem. A, 2016, 4(17), 6313–6318 RSC.
- Q. Fu, H. Saltsburg and M. Flytzani-Stephanopoulos, Active nonmetallic Au and Pt species on ceria-based water-gas shift catalysts, Science, 2003, 301(5635), 935–938 CrossRef CAS PubMed.
- G. Accardo, G. Dell'Agli, L. Spiridigliozzi, S. P. Yoon and D. Frattini, On the oxygen vacancies optimization through Pr co-doping of ceria-based electrolytes for electrolyte-supported solid oxide fuel cells, Int. J. Hydrogen Energy, 2020, 45(38), 19707–19719 CrossRef CAS.
- A. Trovarelli, et al., The utilization of ceria in industrial catalysis, Catal. Today, 1999, 50(2), 353–367 CrossRef CAS.
- A. Corma, et al., Hierarchically mesostructured doped CeO2 with potential for solar-cell use, Nat. Mater., 2004, 3(6), 394–397 CrossRef CAS PubMed.
- L. G. Carvalho, et al., Color tunability in green, red and infra-red upconversion emission in Tm3+/Yb3+/Ho3+ co-doped CeO2 with potential application for improvement of efficiency in solar cells, J. Lumin., 2015, 159, 223–228 CrossRef CAS.
- X. Lu, et al., Facile synthesis of free-standing CeO2 nanorods for photoelectrochemical applications, Chem. Commun., 2010, 46(41), 7721–7723 RSC.
- C. Hua, et al., Lithium storage mechanism and catalytic behavior of CeO2, Electrochem. Commun., 2012, 25, 66–69 CrossRef CAS.
- G. Wang, et al., Preparation and electrochemical performance of a cerium oxide–graphene nanocomposite as the anode material of a lithium ion battery, Scr. Mater., 2011, 65(4), 339–342 CrossRef CAS.
- B. C. Steele and A. Heinzel, Materials for fuel-cell technologies, in Materials for sustainable energy: a collection of peer-reviewed research and review articles from nature publishing group, World Scientific, 2011, pp. 224–231 Search PubMed.
- S. Park, J. M. Vohs and R. J. Gorte, Direct oxidation of hydrocarbons in a solid-oxide fuel cell, Nature, 2000, 404(6775), 265–267 CrossRef CAS PubMed.
- M. Melchionna and P. Fornasiero, The role of ceria-based nanostructured materials in energy applications, Mater. Today, 2014, 17(7), 349–357 CrossRef CAS.
- J.-D. Qiu, S.-G. Cui and R.-P. Liang, Hydrogen peroxide biosensor based on the direct electrochemistry of myoglobin immobilized on ceria nanoparticles coated with multiwalled carbon nanotubes by a hydrothermal synthetic method, Microchim. Acta, 2010, 171(3–4), 333–339 CrossRef CAS.
- Y. Liu, et al., Superionic conductivity of Sm3+, Pr3+, and Nd3+ triple-doped ceria through bulk and surface two-step doping approach, ACS Appl. Mater. Interfaces, 2017, 9(28), 23614–23623 CrossRef CAS PubMed.
- X. M. Ge, et al., Solid oxide fuel cell anode materials for direct hydrocarbon utilization, Adv. Energy Mater., 2012, 2(10), 1156–1181 CrossRef CAS.
- M. Akbar, et al., Demonstrating the dual functionalities of CeO2–CuO composites in solid oxide fuel cells, Int. J. Hydrogen Energy, 2021, 46(15), 9938–9947 CrossRef CAS.
- Z. Qiao, et al., Electrochemical and electrical properties of doped CeO2-ZnO composite for low-temperature solid oxide fuel cell applications, J. Power Sources, 2018, 392, 33–40 CrossRef CAS.
- E. D. Wachsman and K. T. Lee, Lowering the temperature of solid oxide fuel cells, Science, 2011, 334(6058), 935–939 CrossRef CAS PubMed.
- S. Sanna, et al., Enhancement of the chemical stability in confined δ-Bi2O3, Nat. Mater., 2015, 14(5), 500–504 CrossRef CAS PubMed.
- J. W. Shin, S. Oh, S. Lee, D. Go, J. Park, H. J. Kim, B. C. Yang, G. Y. Cho and J. An, ALD CeO2-Coated Pt anode for thin-film solid oxide fuel cells, Int. J. Hydrogen Energy, 2021, 46(38), 20087–20092 CrossRef CAS.
- U. Aarthi, et al., Strontium mediated modification of structure and ionic conductivity in samarium doped ceria/sodium carbonate nanocomposites as electrolytes for LTSOFC, RSC Adv., 2016, 6(88), 84860–84870 RSC.
- B. Wang, et al., Fast ionic conduction in semiconductor CeO2−δ electrolyte fuel cells, NPG Asia Mater., 2019, 11(1), 1–12 CrossRef CAS.
- X. Zhou, J. Yang, R. Wang, W. Zhang, S. Yun and B. Wang, Advances in lithium-ion battery materials for ceramic fuel cells, Energy Mater., 2022, 2, 200041 CrossRef CAS.
- N. K. Oh, et al., In-situ local phase-transitioned MoSe2 in La0.5Sr0.5CoO3-δ heterostructure and stable overall water electrolysis over 1000 hours, Nat. Commun., 2019, 10(1), 1–12 CrossRef CAS PubMed.
- M. A. K. Y. Shah, Y. Lu, N. Mushtaq, M. Singh, S. Rauf, M. Yousaf and B. Zhu, ZnO/MgZnO heterostructure membrane with type II band alignment for ceramic fuel cells, Energy Mater., 2022, 2, 200031 CrossRef CAS.
- S. Singh, et al., A study of hydrothermally grown ZnO nanorod-based metal-semiconductor-metal UV detectors on glass substrates, Nanomater. Nanotechnol., 2017, 7, 1847980417702144 CrossRef CAS.
- J. Zheng, H. Zhu, W. Li, Z. Ma, X. Ou, Yu Fan, Y. Guo, X. Wang and Y. Ling, Numerical study on the electron-blocking effect and optimized operation parameters of ceria-SOFCs with the pure Sm doping CeO2 electrolyte, Int. J. Hydrogen Energy, 2021, 46(24), 13318–13329 CrossRef CAS.
- N. Cao, Y. Liu, Xi Xu, Y. Xu, X. Wang and L. Bi, Ambient electrosynthesis of NH3 from N2 using Bi-doped CeO2 cube as electrocatalyst, Int. J. Hydrogen Energy, 2021, 46(62), 31523–31532 CrossRef CAS.
- A. Rajapriya, S. Keerthana, A. Rebekah, C. Viswanathan and N. Ponpandian, Enriched oxygen vacancy promoted heteroatoms (B, P, N, and S) doped CeO2: Challenging electrocatalysts for oxygen evolution reaction (OER) in alkaline medium, Int. J. Hydrogen Energy, 2021, 46(75), 37281–37293 CrossRef CAS.
- G. Nabi, W. Ali, A. Majid, T. Alharbi, S. Saeed and M. A. Albedah, Controlled growth of Bi-Functional La doped CeO2 nanorods for photocatalytic H2 production and supercapacitor applications, Int. J. Hydrogen Energy, 2022, 47(34), 15480–15490 CrossRef CAS.
- M. A. K. Yousaf Shah, Z. Tayyab, S. Rauf, M. Yousaf, N. Mushtaq, M. A. Imran, P. D. Lund, M. Imran Asghar and B. Zhu, Interface engineering of bi-layer semiconductor SrCoSnO3-δ-CeO2−δ heterojunction electrolyte for boosting the electrochemical performance of low-temperature ceramic fuel cell, Int. J. Hydrogen Energy, 2021, 46(68), 33969–33977 CrossRef.
- L. Li, B. Zhu, J. Zhang, C. Yan and Y. Wu, Electrical properties of nanocube CeO2 in advanced solid oxide fuel cells, Int. J. Hydrogen Energy, 2018, 43(28), 12909–12916 CrossRef CAS.
- M. Akbar, Z. Tu, B. Jin, N. Mushtaq, Z. He, W. Dong, B. Wang, X. Wang and C. Xia, Demonstrating the dual functionalities of CeO2–CuO composites in solid oxide fuel cells, Int. J. Hydrogen Energy, 2021, 46(15), 9938–9947 CrossRef CAS.
- R. Chockalingam and S. Basu, Impedance spectroscopy studies of Gd-CeO2-(LiNa)CO3 nano composite electrolytes for low temperature SOFC applications, Int. J. Hydrogen Energy, 2011, 36(22), 14977–14983 CrossRef CAS.
- X. Zhang, Y. Qiu, Li Qin, F. Liu, X. Ji and J. Liu, Facile construction of heterostructural Ni3(NO3)2(OH)4/CeO2 bifunctional catalysts for boosted overall water splitting, Int. J. Hydrogen Energy, 2022, 47(55), 23221–23229 CrossRef CAS.
- Y. Lu, B. Zhu, J. Shi and S. Yun, Advanced low-temperature solid oxide fuel cells based on a built-in electric field, Energy Mater., 2021, 1, 100007 CrossRef CAS.
- B. Zhu, Y. Mi, C. Xia, B. Wang, J. S. Kim, P. Lund and T. Li, A nanoscale perspective on solid oxide and semiconductor membrane fuel cells: materials and technology, Energy Mater., 2021, 1, 100002 CrossRef CAS.
| This journal is © The Royal Society of Chemistry 2023 |

