 Open Access Article
Development of a novel hypochlorite ratio probe based on coumarin and its application in living cells†
Hao Wena,
Zifan Liub,
Zixia Suc,
Jamal. A. H. Kowaha,
Erwei Hao*c and
Xu Liu *b
*b
aDepartment of Chemical Engineering and Technology, College of Chemistry and Chemical Engineering, Guangxi University, Nanning 530004, China
bDepartment of Pharmacy, College of Medicine, Guangxi University, Nanning 530004, China
cGuangxi Key Laboratory of Efficacy Study on Chinese Materia Medica, Guangxi University of Chinese Medicine, Nanning 530200, Guangxi, China
First published on 3rd November 2023
Abstract
Hypochlorous acid is a reactive oxygen species that is widely present in the body and has been found to exhibit an elevated concentration in tumors. As a result, fluorescent probes for tumor detection have recently gained significant attention. In this study, we designed and synthesized a novel ratiometric fluorescent probe, LW-1, using coumarin as a scaffold, and characterized its spectral properties. LW-1 displayed indigo blue fluorescence at low concentrations of hypochlorous acid. As the concentration of hypochlorous acid increased, the probe underwent a reaction, resulting in a red shift in its fluorescence peak and exhibiting green fluorescence. The fluorescence intensity ratio (green/blue) was a susceptible detection signal for HClO. LW-1 exhibited favorable characteristics, including a low detection limit, high sensitivity, good stability, and low background interference. The detection limit has reached 2.4642 nM. Moreover, we successfully employed LW-1 to image normal human liver and colon cancer cells in vitro, demonstrating its potential as a promising tool for tumor detection. Overall, our findings suggest that LW-1 could serve as a valuable addition to the current arsenal of fluorescent probes for tumor detection, with potential applications in the diagnosis and treatment of cancer.
Introduction
Reactive oxygen species (ROS), such as superoxide, hydrogen peroxide, and hydroxyl radical, have gained recognition as important signaling molecules both inside and outside of cells in recent years.1,2 Mitochondria are the primary source of intracellular ROS and play a critical role in regulating cellular processes, including proliferation, apoptosis, and metabolism.3,4 Understanding the role of ROS in cellular processes is essential for elucidating the mechanisms underlying tumorigenesis. Among the various ROS species, hypochlorous acid (HOCl) generated by myeloperoxidase (MPO) has been shown to play a pivotal role in many physiological processes owing to its ability to react with biomolecules.5–12HOCl is an important ROS species in the body, widely distributed in mitochondria and lysosomes, and present at higher concentrations in tumor cells than in normal cells.
The tumor microenvironment is a complex and dynamic environment characterized by hypoxia, nutrient deprivation, and immune suppression. It is now widely recognized that the tumor microenvironment plays a critical role in tumor. Due to the unique nature of the tumor microenvironment, researchers have sought to gain a comprehensive understanding of its characteristics to devise more effective treatment strategies. Fluorescence spectroscopy is a powerful technique that has emerged as a valuable tool for studying molecular entities in the tumor microenvironment.13 It works by exciting molecules with a specific wavelength of light and measuring the resulting emission of light at a different wavelength. This emission provides information about the structure, dynamics, and interactions of molecules in the sample.
One of the key advantages of fluorescence spectroscopy is its high sensitivity, which allows for detecting even small amounts of molecules in complex samples. Additionally, the technique is user-friendly and can be easily adapted for use in various experimental settings.
Molecular imaging of the tumor microenvironment provides a better understanding of its characteristics and functions in cancer biology, thereby facilitating the development of novel diagnostic and therapeutic strategies for early cancer detection and treatment. The similarity of tumor microenvironment characteristics in different types of cancer enables probes designed for specific biomarkers to have extensive clinical applications for various cancers.14 Intraoperative cancer fluorescence imaging is a powerful technique that aids in identifying cancer lesions and minimizing the risk of leaving positive surgical margins. Fluorescent imaging probes targeting different tumor antigens, tumor-related enzymes, pH values, and other factors have been developed as visual guidance tools for surgery or endoscopy. Probes are indispensable in detecting and monitoring material abnormalities in the tumor microenvironment. Commonly used probes, such as coumarins, fluorescein, rhodamine, BODIPY, and others, react with substances altered by cancer cells in the tumor microenvironment, displaying different colors or brightness. These probes facilitate the visualization of substance content changes, enabling cancer cells' differentiation and radical treatment.
The high sensitivity, selectivity, fast response time, and high spatial resolution offered by fluorescent probes have garnered considerable interest among researchers in detecting reactive oxygen species (ROS) and reactive nitrogen species (RNS).15–25 Although various methods have been developed for this purpose, fluorescent probes are particularly attractive due to their ability to provide real-time, noninvasive detection of these species in living cells and tissues. Various methods have been developed for detecting hypochlorite/hypochlorous acid, including colorimetry, iodometric titration, chemiluminescence, coulometry, and radiolysis.26–28 However, these techniques often require complex procedures and have relatively high detection limits. In contrast, fluorescent probes offer several advantages, such as high sensitivity, selectivity, fast response time, and wide detection range. Moreover, the detection process typically does not damage the sample and has minimal impact on cells.29–35 For example, Guangfei Wu et al.36 developed a water-soluble probe based on BODIPY design. Xiaohong Cheng et al.37 proposed a new design strategy for removing OCl− fluorescence activated chemical probes with C![[double bond, length as m-dash]](https://www.rsc.org/images/entities/char_e001.gif) N isomerization. The HClO probe of Daoxue Li et al.38 is designed for mitochondria.
N isomerization. The HClO probe of Daoxue Li et al.38 is designed for mitochondria.
Ratio-based fluorescent probes have become an increasingly popular research topic due to their ease of observation and low background interference caused by fluorescence changes. For example, Shirong Fang et al.39 and Saravanan Embanathan et al.40 synthesized HClO ratio probes with excellent properties. In this study, a novel ratio-based fluorescent probe (LW-1) was designed and synthesized for detecting hypochlorite using coumarin. LW-1 can react with hypochlorite to generate LW-0 (Scheme 1). The sensitivity, selectivity, photostability, and response time of LW-1 were analyzed using UV-visible absorption spectroscopy and fluorescence emission spectroscopy. The fluorescence performance of LW-1 was verified using normal human liver cells and colon cancer cells. These results demonstrate the potential of LW-1 as a promising tool for tumor detection due to its low detection limit, high sensitivity, good stability, and minimal background interference. The detection limit has reached 2.4642 nM, and the quantum yield was 0.381.
Results and discussion
Spectral properties of LW-1
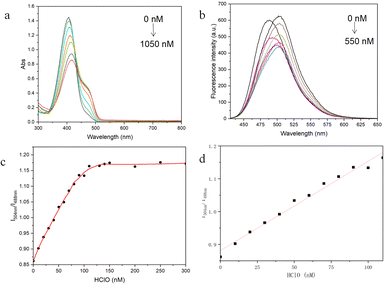
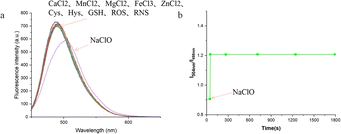
The UV-visible absorption and fluorescence emission spectra of the LW-1 probe were measured and are depicted in Fig. 1a. Notably, the original solution of LW-1 exhibited a strong absorption peak at 405 nm in the UV-visible spectrum. Upon increasing the NaClO content, the absorption peak underwent a significant redshift, with the peak at 405 nm gradually decreasing and the peak at 462 nm gradually increasing. Subsequent titration with NaClO solution revealed in the fluorescence emission spectrum, shown in Fig. 1b, that the maximum emission wavelength of LW-1 underwent a redshift, reaching 504 nm. This shift occurred upon adding 550 nM of NaClO, demonstrating the probe's ability to detect HClO at the nanomolar level. Comparison of the fluorescence curves of the solution without NaClO addition and the solution with the addition of 550 nM NaClO revealed a significant change in fluorescence emission intensity at 488 nm, which continued to decrease, and at 504 nm, which continued to increase, with changes in the HClO content in dozens of nanomolar. However, the mutual influence between the front and rear fluorescence peaks occurred since the two peaks did not converge too far. As a result, as the HClO concentration continued to increase, the fluorescence emission peak curve first showed a trend of redshift and decrease, followed by a trend of redshift and increase. Similar fluorescence peaks were observed in the study by Yong Woong Jun et al.41 The relationship between the HClO content and fluorescence intensity ratio of LW-1, with the ratio of fluorescence intensity at 504 nm to fluorescence intensity at 488 nm as the ordinate and the amount of HClO as the abscissa, was plotted and subjected to S-shaped fitting (Fig. 1c). The graph indicated that the fluorescence intensity at 504 nm and the fluorescence intensity ratio at 488 nm first continuously decreased with increasing HClO content. When the hypochlorite content reached a certain concentration, the fluorescence emission peak at 504 nm dominated, resulting in a stable ratio of fluorescence emission peaks. Furthermore, linear fitting of the graph within the range of 0 to 110 nM revealed that the fluorescence intensity ratio of LW-1 exhibited a good linear relationship with the change in HClO concentration, with an R2 value of 0.986 (Fig. 1d).To evaluate the performance of the coumarin derivative LW-1, we conducted a series of tests to assess its response time, fluorescence stability, and selectivity. Initially, we investigated the probe's selectivity by exposing it to various metal ions, biological mercaptans, and active oxygen and reactive nitrogen species molecules in a methanol solution. As illustrated in Fig. 2a, LW-1 exhibited a negligible fluorescence intensity change in the presence of interfering ions or molecules, such as CaCl2, MnCl2, MgCl2, FeCl3, ZnCl2, Cys, Hys, GSH, ROS, RNS, among others. However, upon reacting with NaClO, LW-1 demonstrated a significant red shift and intensity change in fluorescence emission peak, confirming its excellent selectivity for HClO. Subsequently, we assessed the response time and fluorescence stability of LW-1 to HClO. Fig. 2b illustrates the time-dependent process of the fluorescence intensity ratio at 504 nm to 488 nm at room temperature. Notably, the fluorescence intensity ratio of LW-1 at 504 nm to 488 nm changed promptly, reaching stability following the addition of NaClO, with no significant changes over time. This response was accomplished within 5 seconds, indicating the swift response and outstanding fluorescence stability of LW-1 towards HClO.
Imaging application of LW-1
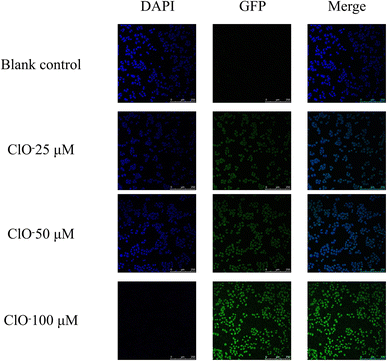
To investigate the influence of fluorescent probes on cellular fluorescence imaging following intervention with a hypochlorite solution, experiments were conducted on the human normal liver cell line LO2, where three different concentration groups were treated with hypochlorite. The confocal microscopy system results demonstrated that the control group, treated with fluorescent probes only, exhibited significant blue fluorescence under the DAPI channel. In contrast, slight green fluorescence was observed under the GFP channel, which may have originated from inherent cellular fluorescence. The treatment groups with varying concentrations of hypochlorite solution exhibited a gradual decrease in blue fluorescence intensity under the DAPI channel with increased hypochlorite concentration. In contrast, the green fluorescence intensity under the GFP channel progressively increased. The green fluorescence became increasingly prominent upon merging the two channels, while the blue fluorescence gradually diminished. These observations are depicted in Fig. 3. | ||
| Fig. 3 Effect of fluorescence probe on fluorescence imaging of LO2 cells interventioned by hypochloric acid. | ||
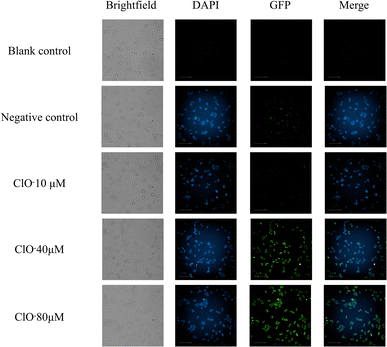
Furthermore, fluorescence imaging experiments were conducted on HT-29 human colon cancer cells to investigate the response of the fluorescence probe to hypochlorite treatment. Specifically, three groups with varying hypochlorite concentrations were established and monitored using a high-resolution cell imaging system. The results revealed that the blank control group, which did not undergo any treatment, did not exhibit significant fluorescence in the DAPI or GFP channels. The negative control group, treated solely with fluorescent probes, generated significant blue fluorescence in the DAPI channel. In contrast, slight green fluorescence was observed in the GFP channel, likely due to inherent cellular autofluorescence.
In comparison, the treatment groups exposed to different hypochlorite concentrations demonstrated a gradual decrease in blue fluorescence in the DAPI channel, accompanied by a corresponding increase in green fluorescence in the GFP channel as the hypochlorite concentration increased. The merged images of the two channels showed a gradual shift from blue to green fluorescence, with the former gradually diminishing and the latter becoming more pronounced as the hypochlorite concentration increased. The results are illustrated in Fig. 4.
 | ||
| Fig. 4 The effect of fluorescence probe on fluorescence imaging of HT-29 human colon cancer cells intervened with hypochloric acid. | ||
Conclusions
In summary, the present study describes a newly developed ratio-based fluorescent probe, LW-1, that enables selective detection of hypochlorite concentration in cells. The probe is easy to synthesize and possesses merits such as high sensitivity, rapid response kinetics, and low background interference. Fluorescence imaging of normal human liver and colon cancer cells demonstrates that LW-1 can detect changes in HClO concentration with high sensitivity. These findings suggest that LW-1 will serve as a valuable tool for exploring the correlation between alterations in HClO concentration and diverse pathological conditions in biological and medical investigations.Author contributions
Hao Wen: methodology, data curation, writing – original dra. ZiFan Liu: validation, data curation. Zixia Su: data curation. Jamal. A. H. Kowah: writing – original dra. Erwei Hao: supervision. Xu Liu: supervision, project administration, funding acquisition.Conflicts of interest
There are no conflicts to declare.Acknowledgements
The work is financially supported by National Natural Science Foundation of China (no. 22078073), and Guangxi Natural Science Foundation (2020GXNSFAA297178).Notes and references
- R. O. Jones and O. Gunnarsson, Rev. Mod. Phys., 1989, 61, 689–746 CrossRef CAS.
- A. H. Ashoka, F. Ali, R. Tiwari, R. Kumari, S. K. Pramanik and A. Das, ACS Omega, 2020, 5, 1730–1742 CrossRef CAS PubMed.
- R. O. Jones, Rev. Mod. Phys., 2015, 87, 897–923 CrossRef.
- A. L. Samuel, IBM J. Res. Dev., 2000, 44, 206–226 Search PubMed.
- Z. Zhang, Y. Zhang, T. Zhou, J. Zhang, W. You, K. Pan and W. Li, J. Multidiscip. Cancer Manage., 2021, 2, 6–20 Search PubMed.
- Z. Yin, M. Wang, W. You, K. Pan and W. Li, J. Multidiscip. Cancer Manage., 2022, 2, 54–67 Search PubMed.
- R. L. Siegel, K. D. Miller, N. S. Wagle and A. Jemal, Cancer J. Clin., 2023, 73, 17–48 CrossRef PubMed.
- N. M. Anderson and M. C. Simon, Curr. Biol., 2020, 30, R921–R925 CrossRef CAS PubMed.
- M. A. Swartz, N. Iida, E. W. Roberts, S. Sangaletti, M. H. Wong, F. E. Yull, L. M. Coussens and Y. A. DeClerck, Cancer Res., 2012, 72, 2473–2480 CrossRef CAS PubMed.
- D. Hanahan and R. A. Weinberg, Cell, 2011, 144, 646–674 CrossRef CAS PubMed.
- Z.-G. Song, Q. Yuan, P. Lv and K. Chen, Sensors, 2021, 21, 6326 CrossRef CAS PubMed.
- M. P. Algi, J. Fluoresc., 2016, 26, 487–496 CrossRef CAS PubMed.
- Z. Zhou and Z. R. Lu, Adv. Drug Delivery Rev., 2017, 113, 24–48 CrossRef CAS PubMed.
- D. F. Quail and J. A. Joyce, Nat. Med., 2013, 19, 1423–1437 CrossRef CAS PubMed.
- M. G. Sikkandhar, A. M. Nedumaran, R. Ravichandar, S. Singh, I. Santhakumar, Z. C. Goh, S. Mishra, G. Archunan, B. Gulyás and P. Padmanabhan, Int. J. Mol. Sci., 2017, 18, 1036 CrossRef PubMed.
- S. G. Rhee, Science, 2006, 312, 1882–1883 CrossRef PubMed.
- L. Diebold and N. S. Chandel, Free Radicals Biol. Med., 2016, 100, 86–93 CrossRef CAS PubMed.
- F. Weinberg and N. S. Chandel, Cell. Mol. Life Sci., 2009, 66, 3663–3673 CrossRef CAS PubMed.
- F. Weinberg and N. S. Chandel, Ann. N. Y. Acad. Sci., 2009, 1177, 66–73 CrossRef CAS PubMed.
- Y. Huang, Y. Zhang, F. Huo, J. Chao and C. Yin, Sens. Actuators, B, 2019, 287, 453–458 CrossRef CAS.
- K. Xiong, F. Huo, Y. Zhang, Y. Wen, J. Chao and C. Yin, Sens. Actuators, B, 2018, 255, 2378–2383 CrossRef CAS.
- Y. Yang, F. Huo, C. Yin, M. Xu, Y. Hu, J. Chao, Y. Zhang, T. E. Glass and J. Yoon, J. Mater. Chem. B, 2016, 4, 5101–5104 RSC.
- Y. Zhang, L. Ma, C. Tang, S. Pan, D. Shi, S. Wang, M. Li and Y. Guo, J. Mater. Chem. B, 2018, 6, 725–731 RSC.
- Y. Zhang, H. Teng, Y. Gao, M. W. Afzal, J. Tian, X. Chen, H. Tang, T. D. James and Y. Guo, Chin. Chem. Lett., 2020, 31, 2917–2920 CrossRef CAS.
- C. Duan, M. Won, P. Verwilst, J. Xu, H. S. Kim, L. Zeng and J. S. Kim, Anal. Chem., 2019, 91, 4172–4178 CrossRef CAS PubMed.
- T. C. Pham, S. Heo, V.-N. Nguyen, M. W. Lee, J. Yoon and S. Lee, ACS Appl. Mater. Interfaces, 2021, 13, 13949–13957 CrossRef CAS PubMed.
- S. Samanta and T. Govindaraju, ACS Chem. Neurosci., 2019, 10, 4847–4853 CrossRef CAS PubMed.
- Y. Feng, J. Cheng, L. Zhou, X. Zhou and H. Xiang, Analyst, 2012, 137, 4885–4901 RSC.
- B. Daly, J. Ling and A. P. de Silva, Chem. Soc. Rev., 2015, 44, 4203–4211 RSC.
- W. Sun, M. Li, J. Fan and X. Peng, Acc. Chem. Res., 2019, 52, 2818–2831 CrossRef CAS PubMed.
- A. Torrado, G. K. Walkup and B. Imperiali, J. Am. Chem. Soc., 1998, 120, 609–610 CrossRef CAS.
- Y. Zheng, Q. Huo, P. Kele, F. M. Andreopoulos, S. M. Pham and R. M. Leblanc, Org. Lett., 2001, 3, 3277–3280 CrossRef CAS PubMed.
- X. Liu, D. Lin, Q. Wu, W. Yan and T. Luo, Acta Phys. Sin., 2018, 17, 27–40 Search PubMed.
- L. Luo, J. Niu, B. Mo, D. Lin and L. Liu, Spectrosc. Spectral Anal., 2021, 4, 1023–1031 Search PubMed.
- J. Luo, Z. Xie, J. W. Y. Lam, L. Cheng, H. Chen, C. Qiu, H. S. Kwok, X. Zhan, Y. Liu, D. Zhu and B. Z. Tang, Chem. Commun., 2001, 18, 1740–1741 RSC.
- G. Wu, F. Zeng and S. Wu, Anal. Methods, 2013, 5, 5589–5596 RSC.
- X. Cheng, H. Jia, T. Long, J. Feng, J. Qin and Z. Li, Chem. Commun., 2011, 47, 11978–11980 RSC.
- D. Li, Y. Feng, J. Lin, M. Chen, S. Wang, X. Wang, H. Sheng, Z. Shao, M. Zhu and X. Meng, Sens. Actuators, B, 2016, 483–491 CrossRef CAS.
- S. Fang, L. Wang, Y. Mei and K. Zheng, Spectrochim. Acta, Part A, 2022, 269, 120738–120744 CrossRef CAS PubMed.
- S. Embanathan, S. Manickam, S. Munusamy, D. Jothi, S. Manoj Kumar and S. Kulathu Iyer, New J. Chem., 2022, 46, 6570–6576 RSC.
- Y. W. Jun, S. Sarkar, S. Singha, Y. J. Reo, H. R. Kim, J.-J. Kim, Y.-T. Chang and K. H. Ahn, Chem. Commun., 2017, 53, 10800–10803 RSC.
Footnote |
| † Electronic supplementary information (ESI) available. See DOI: https://doi.org/10.1039/d3ra04729f |
| This journal is © The Royal Society of Chemistry 2023 |


