 Open Access Article
Catalytic evaluation and in vitro bacterial inactivation of graphitic carbon nitride/carbon sphere doped bismuth oxide quantum dots with evidential in silico analysis†
Muhammad Ikram *a,
Muhammad Shazaibb,
Ali Haider
 c,
Anum Shahzadid,
Shair Baza,
Mohammed M. Algaradahe,
Anwar Ul-Hamid
 *f,
Walid Nabgan
 *g,
Hisham S. M. Abd-Rabbohh and
Salamat Alib
aSolar Cell Applications Research Lab, Department of Physics, Government College University Lahore, 54000, Pakistan. E-mail: dr.muhammadikram@gcu.edu.pk
bDepartment of Physics, Riphah Institute of Computing and Applied Sciences (RICAS), Riphah International University, 14 Ali Road, Lahore, Pakistan
cDepartment of Clinical Sciences, Faculty of Veterinary and Animal Sciences, Muhammad Nawaz Shareef University of Agriculture, Multan 66000, Pakistan
dFaculty of Pharmacy, The University of Lahore, Lahore 54000, Pakistan
eChemistry Department, King Khalid Military Academy, Riyadh 11495, Saudi Arabia
fCore Research Facilities, King Fahd University of Petroleum & Minerals, Dhahran 31261, Saudi Arabia
gDepartament d’Enginyeria Química, Universitat Rovira i Virgili, Av Països Catalans 26, Tarragona 43007, Spain. E-mail: walid.nabgan@urv.cat
hChemistry Department, Faculty of Science, King Khalid University, P.O. Box 9004, Abha 61413, Saudi Arabia
First published on 23rd August 2023
Abstract
Herein, Bi2O3 quantum dots (QDs) have been synthesized and doped with various concentrations of graphitic carbon nitride (g-C3N4) and a fixed amount of carbon spheres (CS) using a co-precipitation technique. XRD analysis confirmed the presence of monoclinic structure along the space group P21/c and C2/c. Various functional groups and characteristic peaks of (Bi–O) were identified using FTIR spectra. QDs morphology of Bi2O3 showed agglomeration with higher amounts of g-C3N4 by TEM analysis. HR-TEM determined the variation in the d-spacing which increased with increasing dopants. These doping agents were employed to reduce the exciting recombination rate of Bi2O3 QDs by providing more active sites which enhance antibacterial activity. Notably, (6 wt%) g-C3N4/CS-doped Bi2O3 exhibited considerable antimicrobial potential in opposition to E. coli at higher values of concentrations relative to ciprofloxacin. The (3 wt%) g-C3N4/CS-doped Bi2O3 exhibits the highest catalytic potential (97.67%) against RhB in a neutral medium. The compound g-C3N4/CS-Bi2O3 has been suggested as a potential inhibitor of β-lactamaseE.![[thin space (1/6-em)]](https://www.rsc.org/images/entities/i_char_2009.gif) coli and DNA gyraseE.
coli and DNA gyraseE.![[thin space (1/6-em)]](https://www.rsc.org/images/entities/i_char_2009.gif) coli based on the findings of a molecular docking study that was in better agreement with in vitro bactericidal activity.
coli based on the findings of a molecular docking study that was in better agreement with in vitro bactericidal activity.
1. Introduction
Water is essential in every aspect of life and crucial for all living beings.1 The Earth's surface contains 71% water; only 0.03% is deemed healthy water when used immediately.2 The discharge of waste products into freshwater resources, such as organic and inorganic dyes pollutants, must be addressed to sustain a healthy atmosphere.3 These contaminants cause harm to sea life, terrestrial animals, and plants. Additionally, these contaminants have negative health impacts on humans, such as anemia, bladder discomfort, and gastrointestinal difficulties.4 The major aquatic contaminants are methyl orange, rhodamine blue (RhB), and methylene blue (MB); the water becomes unsuitable for utilization with these dyes in it.5 Particularly RhB, a potentially dangerous chemical fluorescent dye used in the biomedical and textile sectors.6 Another endemic challenge that today's humanity is beginning to encounter is the development of antibiotic resistance in microorganisms. According to the IDSA, the widespread infection of the most potentially fatal species of bacteria known as ESKAPE pathogens possess considerable antibiotic resistance.7 Annually, E. coli, an ESKAPE pathogen, kills 1.3 million children from diarrhea, mainly spreading through contaminated water.8 Numerous methods have been proposed for dye removal including photocatalysis,9 adsorption,10 coagulation,11 biodegradation,12 flocculation,13 micro-electrolysis14 and catalysis.15 Among these, catalysis is regarded as an excellent process for the purification of wastewater treatment. Nanomaterial semiconductors are important for catalysis in light of their chemical stability, minimal toxicity, and environmental friendliness.16The Bi-based semiconductor materials such as BiVO4, Bi2WO6, Bi2MoO6, BiOX (X = Cl, Br and I), and Bi2O3 have received a lot of research interest over the past few years owing to their layer structures and high catalytic properties.17 Among these Bi2O3 is frequently used in wastewater treatment. Bi2O3 has unique electrical structures that are responsible for the enhancement of absorption. Particularly p-type semiconductor Bi2O3 exhibits exceptional features, including a broadband gap, low toxicity, excellent conductivity, antimicrobial activity, and the ability to degrade organic dyes.18,19 Metal oxides are made more stable and have improved physiochemical characteristics as a result of the inclusion of polymers, leading to effective dye degradation and antibacterial activity.20
Pair production occurs when polymers interact with metal ions, which makes them more effective for dye degradation and antimicrobial activity. Various polymers have been used as capping agents and act as inhibitors of the size of material, including polyacrylic acid (PAA), polymethyl methacrylate (PMMA), polyvinylpyrrolidone (PVP), and polyvinyl alcohol (PVA).21–23 Consequently, a polymeric semiconductor g-C3N4 with sp2 hybridization, a graphite-like structure, with strong C–N bonds and van der Waals forces between the layers exhibits exceptional potential for catalytic degradation, antibacterial activity and many other applications because of low band gap energy, appealing electrical band structure, and good physicochemical stability. Organic substances like urea, ethylene diamine, and melamine with a nitrogen and carbon bond coupling are frequently paralyzed to the synthesized g-C3N4.24,25 Furthermore, it could be speculated that coupling Bi2O3 with g-C3N4 forms a heterojunction that promotes charge transfer and separation.26 Overall CS provides a high surface area, promoting efficient catalysis and enhancing the adsorption of dyes and bacterial cells. The g-C3N4 enables the generation of reactive oxygen species (ROS). This combined with the catalytic redox ability of Bi2O3 facilitates the degradation of dyes and the production of antibacterial ROS. Moreover, the tunability of these materials allows for customization to meet specific catalytic and antibacterial requirements. Combining these unique properties would enable g-C3N4/CS-doped Bi2O3 QDs promising material for a wide range of environmental remediation and healthcare applications. The selection of different wt% (3 and 6) of g-C3N4 as dopant27 was adopted from literature, experimental findings, and to attain optimal catalytic and antibacterial outcomes while taking practical feasibility into account.
Herein, the pure and g-C3N4/CS-doped Bi2O3 QDs were synthesized simultaneously by the co-precipitation method, which was cost-efficient and eco-friendly. Various characterization techniques were utilized to demonstrate the different properties of the synthesized QDs, and the potential for the inhibition of pathogenic microbe E. coli and degradation of RhB were investigated.
2. Experimental section
2.1 Materials
The precursor chemical bismuth nitrate pentahydrate (Bi(NO3)3·5H2O, 98%) was obtained from BDH laboratory supplies. Glucose, g-C3N4, and NaOH, 98% were purchased from Sigma-Aldrich Germany.2.2 Synthesis of CS
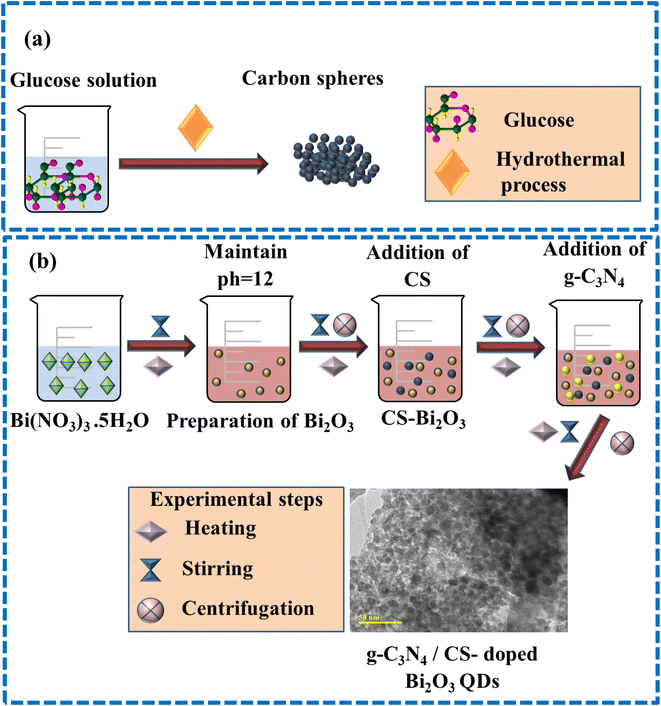
The CS were synthesized by employing the hydrothermal carbonization technique. The 1 M of glucose was diluted and stirred continuously to get the transparency of the solution. Finally, the above solution have been taken into an autoclave of stainless steel and kept for 12 h at 180 °C. The final precipitates were dried overnight at 100 °C using an oven after washing them multiple times with deionized (DI) water (Fig. 1a).2.3 Preparation of g-C3N4/CS doped Bi2O3
The 0.5 M of (Bi(NO3)3·5H2O) was used to prepare Bi2O3 with continuous stirring and heating at 100 °C for 30 min. 1 M NaOH was added dropwise for the formation of precipitates and to maintain pH ∼12. The prepared solution was washed thrice using a centrifuge at 7000 rpm and left on a hotplate at 150 °C for 12 h. Afterward, dried QDs have been pulverized nicely, and using the same method, the (3 and 6 wt%) of g-C3N4 and a fixed amount of CS, doped Bi2O3 QDs were prepared as depicted in Fig. 1b.2.4 Catalysis
The CA for degradation of RhB using bare and doped Bi2O3 was analyzed to ensure the reliability of the experimental findings. The reagents such as NaBH4 and RhB have been prepared freshly. The RhB solution of A 10 mg L−1 was equally distributed into three parts having the pH (pH = 4), (pH = 7), and (pH = 12), for acidic, neutral, and basic mediums respectively.28 400 μL of NaBH4 and 3 mL of the dye were combined and 400 μL of synthesized QDs solution (like Bi2O3 and g-C3N4/CS-Bi2O3) was added in a NaBH4 and RhB aqueous solution. A catalyst had been employed to limit the reaction's surface activation energy, which improved the stability and effectiveness of the reaction. A UV-vis spectrophotometer was used to assess the degree of dye degradation in the produced supernatant over a period of time and at 554 nm RhB emits its absorption signal.29 The color of RhB changes from pink to colorless as a result of the reduction and the % degradation has been calculated using the formula.2.5 Isolation and identification of E. coli
2.5.2.1 Antibiotic susceptibility. To examine antibiotic susceptibility, Kirby–Bauer test was employed on Mueller Hinton agar (MHA).31 The antimicrobial tests against the antibiotics such as tetracycline (Te) 30 μg (tetracyclines), azithromycin (Azm) 15 μg (macrolides), ciprofloxacin (Cip) 5 μg (quinolones), amoxicillin (A) 30 μg (penicillin), imipenem (Imi) 10 μg (carbapenem), ceftriaxone (Cro) 30 μg (cephalosporins) and gentamicin (Gm) 10 μg (aminoglycosides) were performed to observe the E. coli's resistance.32 The purified E. coli cultures were subjected to growth until they reached (0.5) MacFarland standard for turbidity and the spread plate had been placed on growth medium MHA (Oxoid Limited, Basingstoke, UK). To avoid inhibition zone overlap, the discs were placed apart from the infected plate and the antibiotic plates were cultured at 36 °C for 24 h. The results were examined under the guidelines of the Clinical, Diagnostic, and Laboratory Standard Institute.33
2.5.2.2 Antimicrobial activity. In vitro, the antibacterial capability was assessed via determining the inhibition zone of pristine and doped Bi2O3 against isolates of MDR E. coli. E. coli has been isolated on MacConkey agar plates of (0.5) McFarland standards 1.5 × 10⁸ CFU μL−1. The potentially harmful bacterial drugs have been sanitized by agar plates. The cork borer was utilized for drilling holes having a diameter of 6 millimeters (mm). Ciprofloxacin 5 mg/50 mL functions as the positive control while DI water 50 mL serves as the negative control. The bare and doped QDs were injected into the boreholes at low and high concentrations (0.5 mg/50 μL and 1.0 mg/50 μL). The capability of the QDs to suppress the growing process of microorganisms was measured by determining the expansion of the inhibition zone using a Vernier caliper.
2.5.2.3 Statistical analysis. To perform the preliminary identification of the effectiveness of antimicrobials, zones of inhibition were utilized, and the diameters of these zones have been analyzed statistically using one-way analysis of variance (ANOVA) in SPSS 20.34
2.6 Molecular docking study
The binding affinity of g-C3N4/CS-Bi2O3 QDs with specific enzyme targets was investigated. Based on the microbicidal activity of the synthesized QDs against E. coli, β-lactamase and DNA gyrase from E. coli were selected, and the binding strength within their respective active sites was evaluated. β-LactamaseE.![[thin space (1/6-em)]](https://www.rsc.org/images/entities/i_char_2009.gif) coli and DNA gyraseE.
coli and DNA gyraseE.![[thin space (1/6-em)]](https://www.rsc.org/images/entities/i_char_2009.gif) coli structural dimensions were derived from the protein data bank using accession codes 4KZ3 (Res: 1.67 Å)35 and 6KZX (Res: 2.1 Å),36 respectively. The software SYBYL-X 2.0 was used for docking research. In a previous study37,38 SYBYL-X 2.0 was used to construct three-dimensional structures of pharmaceuticals and to evaluate the binding affinities of QDs with active site residues of designated proteins.
coli structural dimensions were derived from the protein data bank using accession codes 4KZ3 (Res: 1.67 Å)35 and 6KZX (Res: 2.1 Å),36 respectively. The software SYBYL-X 2.0 was used for docking research. In a previous study37,38 SYBYL-X 2.0 was used to construct three-dimensional structures of pharmaceuticals and to evaluate the binding affinities of QDs with active site residues of designated proteins.
3. Results and discussion
X-ray diffraction (XRD) technique was utilized for the analysis of phase composition and crystallinity of bare and doped Bi2O3 QDs (Fig. 2a). Diffraction peaks in the range of 2θ (20–60°) appearing at 29.50° (![[3 with combining macron]](https://www.rsc.org/images/entities/char_0033_0304.gif) 11), 33.04° (
11), 33.04° (![[1 with combining macron]](https://www.rsc.org/images/entities/char_0031_0304.gif) 22), 35.05° (020), 38.39° (
22), 35.05° (020), 38.39° (![[3 with combining macron]](https://www.rsc.org/images/entities/char_0033_0304.gif) 12), and 47.57° (140) revealed the monoclinic structure along the space group P21/c and C2/c, well matched with the JCPDS files (01-083-0410/00-041-1449). The distinctive peaks of amorphous CS were observed at about 23.8° (002) and 44° (101) (Fig. 2a).39 The minor shift and the increase in peak intensities were ascribed to the significant dispersion of the CS between the host interlayers. Additionally, larger crystallites are given a specific crystal plane, resulting in more intense peaks in the XRD pattern.40 The characteristic peaks of g-C3N4 could not be observed ascribed to the small trace amount or low crystallinity, however, the peak intensities decrease gradually with an increasing percentage of g-C3N4.41 FTIR spectra of pristine and doped Bi2O3 QDs were analyzed to determine functional groups and vibrational modes can be seen in Fig. 2b. The FTIR spectra have a functional group region, ranging from 4000 to 1500 cm−1 and the zone of fingerprint can be observed between 1500 and 400 cm−1. The band observed at 3200–3400 is referred to as the characteristic vibrations of the O–H group.42 The band at 1640 cm−1 corresponds to the symmetry stretching vibration of the C
12), and 47.57° (140) revealed the monoclinic structure along the space group P21/c and C2/c, well matched with the JCPDS files (01-083-0410/00-041-1449). The distinctive peaks of amorphous CS were observed at about 23.8° (002) and 44° (101) (Fig. 2a).39 The minor shift and the increase in peak intensities were ascribed to the significant dispersion of the CS between the host interlayers. Additionally, larger crystallites are given a specific crystal plane, resulting in more intense peaks in the XRD pattern.40 The characteristic peaks of g-C3N4 could not be observed ascribed to the small trace amount or low crystallinity, however, the peak intensities decrease gradually with an increasing percentage of g-C3N4.41 FTIR spectra of pristine and doped Bi2O3 QDs were analyzed to determine functional groups and vibrational modes can be seen in Fig. 2b. The FTIR spectra have a functional group region, ranging from 4000 to 1500 cm−1 and the zone of fingerprint can be observed between 1500 and 400 cm−1. The band observed at 3200–3400 is referred to as the characteristic vibrations of the O–H group.42 The band at 1640 cm−1 corresponds to the symmetry stretching vibration of the C![[double bond, length as m-dash]](https://www.rsc.org/images/entities/char_e001.gif) O bond (in –COOH).43 The stretching vibrations of Bi–O–Bi and C–C were attributed to 540 and 1090 cm−1 bands, correspondingly.44,45 Furthermore, the 519 cm−1 band corresponds to the vibrations of Bi–O bonds, confirming the presence of the Bi2O3 QDs.46 The g-C3N4 introduction into CS-Bi2O3 results in forming a new mid-gap hybrid of p states, enhancing the infrared absorption capability. However, a higher level of g-C3N4 doping resulted in a decrease in infrared absorption due to band position changes and defects in the crystalline structure.47 The polycrystalline nature of Bi2O3, CS-Bi2O3, and (3 and 6 wt%) g-C3N4/CS-doped Bi2O3 QDs was confirmed with distinct rings and bright spots of SAED images. The circular rings were harmonized with the plans (
O bond (in –COOH).43 The stretching vibrations of Bi–O–Bi and C–C were attributed to 540 and 1090 cm−1 bands, correspondingly.44,45 Furthermore, the 519 cm−1 band corresponds to the vibrations of Bi–O bonds, confirming the presence of the Bi2O3 QDs.46 The g-C3N4 introduction into CS-Bi2O3 results in forming a new mid-gap hybrid of p states, enhancing the infrared absorption capability. However, a higher level of g-C3N4 doping resulted in a decrease in infrared absorption due to band position changes and defects in the crystalline structure.47 The polycrystalline nature of Bi2O3, CS-Bi2O3, and (3 and 6 wt%) g-C3N4/CS-doped Bi2O3 QDs was confirmed with distinct rings and bright spots of SAED images. The circular rings were harmonized with the plans (![[3 with combining macron]](https://www.rsc.org/images/entities/char_0033_0304.gif) 11), (
11), (![[1 with combining macron]](https://www.rsc.org/images/entities/char_0031_0304.gif) 22), (140), and (312) of XRD (Fig. 2c–e).
22), (140), and (312) of XRD (Fig. 2c–e).
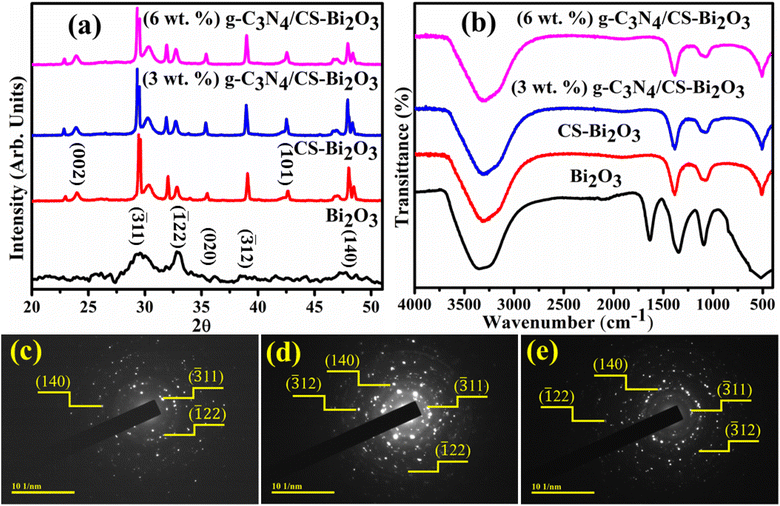 | ||
| Fig. 2 (a) XRD patterns, (b) FTIR spectra of pure and (3 and 6 wt%) g-C3N4/CS-doped Bi2O3 and (c–e) SAED images of pristine and CS-Bi2O3 and (3 wt%) g-C3N4 doped Bi2O3. | ||
The optical absorption characteristics of the synthesized Bi2O3 and (3 and 6 wt%) g-C3N4/CS-doped Bi2O3 have been assessed by employing an ultra-visible spectrophotometer by encompassing the wavelength range of 230–450 nm (Fig. 3a). The λmax of Bi2O3 was observed at 295 nm was ascribed to the π–π* transition due to the functional groups (such as OH, >C![[double bond, length as m-dash]](https://www.rsc.org/images/entities/char_e001.gif) O).48,49 Tauc's equation revealed the energy band gap of 4.2, 4.16, 3.54 and 3.97 eV for bare and doped QDs, respectively.50 The reduction in band gap energy from 4.2 to 3.54 eV with the incorporation (3 wt%) g-C3N4/CS-doped Bi2O3 caused improvement in the catalytic activity as the catalyst structure, surface area, and crystallite size have each a substantial impact on its catalytic activity.51 Furthermore, redshift was associated with particle size growth and the quantum size impact of QDs.52
O).48,49 Tauc's equation revealed the energy band gap of 4.2, 4.16, 3.54 and 3.97 eV for bare and doped QDs, respectively.50 The reduction in band gap energy from 4.2 to 3.54 eV with the incorporation (3 wt%) g-C3N4/CS-doped Bi2O3 caused improvement in the catalytic activity as the catalyst structure, surface area, and crystallite size have each a substantial impact on its catalytic activity.51 Furthermore, redshift was associated with particle size growth and the quantum size impact of QDs.52
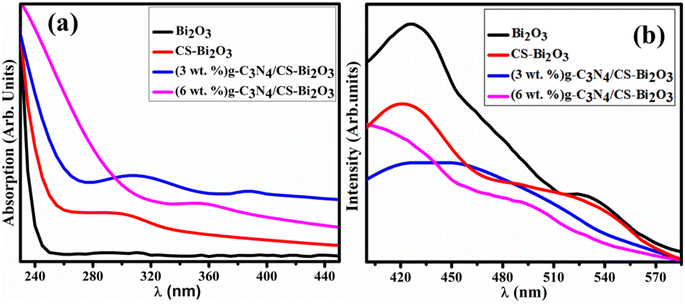 | ||
| Fig. 3 (a) UV-vis reflectance spectra (b) PL spectra of Bi2O3, CS-Bi2O3 (3 wt%) g-C3N4/CS-Bi2O3 and (6 wt%) g-C3N4/CS-Bi2O3 respectively. | ||
The PL spectra of the doped and undoped Bi2O3 were examined in the 400–580 nm regions. Bi2O3 QDs exhibit peaks in the visible spectrum ranging from 520 to 540 nm, corresponding to the presence of Bi3+ ions when excited at 300 nm.53 Another peak of Bi2O3 has been observed at 410–430 nm (Fig. 3b) and was matched with previous work.54 The decreased PL emission intensity of the synthesized Bi2O3 QDs upon the doping of CS and g-C3N4 was attributed to the reduction in the excitation recombination rate. Peak intensity was significantly decreased with the incorporation of (3 wt%) g-C3N4 compared to bare and (6 wt%) g-C3N4/CS-doped Bi2O3 QDs that suggests the tendency of high recombination rate of photo-generated charge carriers.55 According to prior research outcomes, lower peak intensity suggests increased surface vacancies of oxygen, resulting in improved catalytic efficiency.
The elemental compositions of prepared QDs were investigated using EDS analysis. The occurrence of Bi and O strong peaks confirms the presence of Bi2O3 QDs, gold peaks were the outcome of the coating sprayed for reducing charging effects, and NaOH produced the sodium peak used for maintaining the pH of the samples (Fig. S1(a)†). The smaller peaks of zinc and copper were caused by the presence of some contaminants and the brass sample holder used throughout the EDS analysis. Furthermore, the increase in the wt% of O denotes the presence of dopants (Fig. S1(b–d)†).
TEM analysis has been employed to examine the topography and morphology of prepared QDs (Fig. 4a–d). The Bi2O3 sample revealed multiple morphologies as few nanorods with the QDs were observed (Fig. 4a). The chunk-like morphology appeared with a higher degree of agglomeration of QDs. The addition of CS into Bi2O3 showed that the agglomerated QDs anchored with carbon sphere can be seen (Fig. 4b). The incorporation of g-C3N4 into the binary system of CS-Bi2O3 showed that QDs linked to CS and g-C3N4 each other forming a network may facilitate to charge carriers movement participate in dye degradation (Fig. 4c). With a higher concentration of g-C3N4, the agglomeration increased seems that as overlapped by C3N4 nanosheets to QDs anchored with CS (Fig. 4d). Gatan software was additionally employed to compute interlayer d-spacing from HR-TEM images (Fig. S2(a–d)†). The average d-spacing values for the Bi2O3 and (3 and 6 wt%) g-C3N4/CS-doped Bi2O3 QDs were determined to be 0.250, 0.266, 0.293 and 0.292, which are all under the XRD data. Furthermore, the variation in the lattice spacing of Bi2O3 among distinct materials was corroborated by TEM findings.
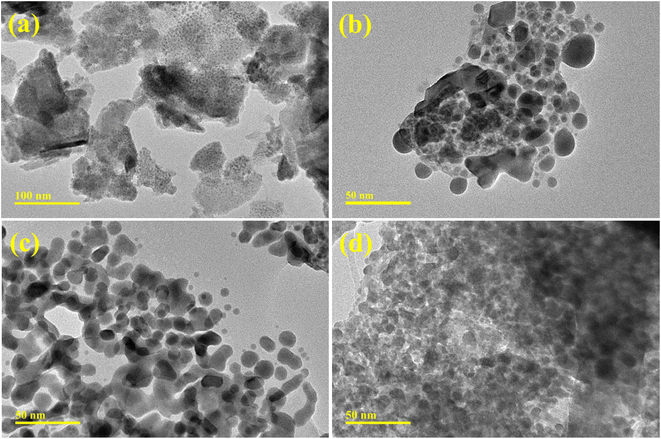 | ||
| Fig. 4 TEM images of (a) Bi2O3 (b) CS-Bi2O3 (c) (3 wt%) g-C3N4/CS-doped Bi2O3 (d) (6 wt%) g-C3N4/CS-doped Bi2O3 QDs. | ||
The monoclinic structure within the space groups P21/c and C2/c of bare and doped Bi2O3 QDs in the 2θ range (20–60°) was determined using the Analytical XPert PRO X-ray diffraction system. The FTIR spectra identified the stretching vibrations of Bi–O–Bi and C–C vibrations of Bi–O bonds, confirming the presence of Bi2O3 quantum dots. The λmax of Bi2O3, encompassing the wavelength range of 230–450 nm, was investigated through a UV-vis spectrophotometer to study π–π* transitions attributed to functional groups. The existence of Bi3+ ions and the excitation recombination rate of pure and doped Bi2O3 QDs were determined using PL spectra. Strong Bi and O peaks, indicating the presence of Bi2O3 QDs, EDS. TEM images shows that the incorporation of g-C3N4 into CS-Bi2O3 binary system creates a network, where QDs interconnect with CS and g-C3N4. This network enhances charge carrier mobility, contributing to efficient dye degradation.56 For the measurement of inter-planar d-spacing values, high-resolution transmission electron microscopy was employed.
CA of Bi2O3 and (3 and 6 wt%) g-C3N4/CS-Bi2O3 QDs for RhB dye in different pH mediums with the inclusion of NaBH4 was measured using UV-vis spectrophotometer. The bare and doped catalyst showed maximum degradation of 49.69, 84.36, 94.38, and 80.96% in acidic medium (pH = 4) 58, 83.09, 70.72, and 92.54% in basic medium (pH = 11) 60.21, 97.13, 97.67, and 95.65% at pH = 7 respectively for 5 min as revealed in Fig. 5a–c. CS-doped Bi2O3 sample showed enhanced catalytic activity in neutral basic and acidic mediums respectively. The CS-doped Bi2O3 catalyst exhibited a higher degradation rate due to the pristine material may not have the same effects on interfacial charge transfer or the trapping of electrons.57 CS acts as a dispersing support, preventing Bi2O3 particle agglomeration.58 Second, this reduces the band gap, increases the absorption range and CS plays a crucial role in enhancing the electron transport characteristics of Bi2O3;59 hence the CS-doped Bi2O3 shows enhanced catalytic activity as compared to the bare catalyst. The (3 wt%) g-C3N4/CS-doped Bi2O3 exhibits higher degradation efficiency at the natural pH of the RhB aqueous solution because g-C3N4 reduces charge recombination and increases the interfacial contact between the catalyst and the RhB.59 Furthermore, the increasing wt% of the g-C3N4 causes a decrease in the degrading efficiency because the higher doping of g-C3N4 may block the active sites and reduce the separation efficiency of the generated charges.60 It is challenging to assess the impact of pH on the efficiency of the catalytic degradation of organic molecules due to its diverse functions. In the context of three distinct aqueous mediums ranging from acidic to neutral, the catalytic efficiency of (6 wt%) g-C3N4/CS-doped Bi2O3 approached maximal levels, exhibiting a range between 80 and 95%. The optimum conditions for the catalyst to produce hydroxyl radicals, the most active species for RhB degradation, were probably responsible for a higher degradation efficiency at the natural pH of RhB.61 In addition to the collapse of the catalyst structure, electrostatic repulsion and the adsorption capacity of (6 wt%) g-C3N4/CS-doped Bi2O3 was dramatically reduced under basic to strong acid conditions.62 As a consequence of an increase in the OH-concentration, which more oxidizes RhB, the CA in the basic medium was higher than acidic but lower than neutral. It was caused by the OH− ions of the basic solution neutralizing the H+ ions on the catalyst surface.63
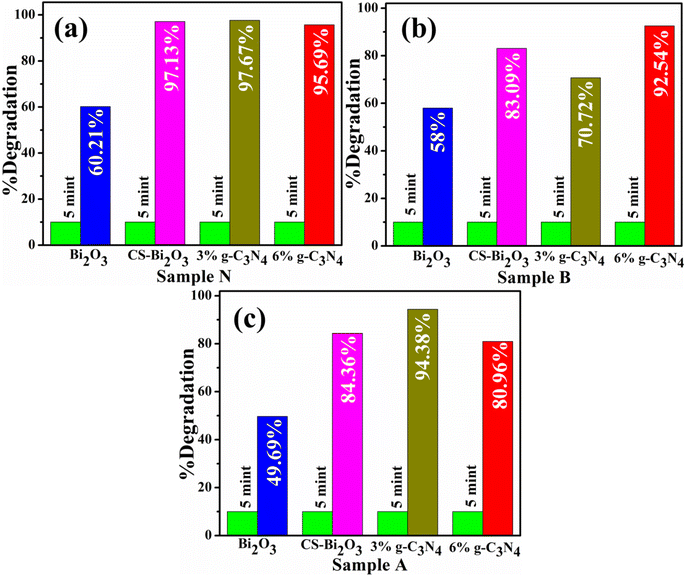 | ||
| Fig. 5 Catalytic activity of pristine and (3, 6 wt%) g-C3N4/CS-Bi2O3 in (a) neutral medium (b) basic medium, and (c) acidic medium. | ||
The catalytic mechanism of QDs was illustrated in Fig. S3,† the nanocatalyst and reducing agent play important role in dye degradation. The QDs help improve reaction speed and stability and lower the activation energy through electron transfer between the donor BH4- and acceptor RhB, commonly referred to as the electron relay effect. The degradation has been influenced by the catalyst surface size, area, and shape which provide more active sites, resulting in the reduction of RhB to Leuco (LRhB) by efficiently breaking down molecules while the OH− ions were produced. With the addition of nanocatalyst adsorption occurs and the NaBH4 had been dissociated into BH4− while more ions diffused onto the surface. QDs accelerated the adsorption of BH4− ions and the molecules of dye across numerous active sites, causing the dye to degrade more rapidly and effectively.64 With the small size and larger surface area, the catalyst has more active sites, which increases its catalytic activity. If the catalyst has a wide surface area, microporosity limits the active sites, which leads the degrading efficiency to drop. Without a catalyst, the reaction proceeds slowly, while adding a catalyst speeds up the dye degradation.65
The agar well diffusion method has been employed to assess the bactericidal potential of the pristine and (3 and 6 wt%) g-C3N4/CS-doped Bi2O3 QDs against E. coli. Significant inhibitory zones have been assessed by the regions 0–1.95 mm and 0.60–2.85 mm for low and high concentrations, respectively, as lower and higher concentrations against E. coli as mentioned in Table 1 QDs were placed in the appropriate wells; meanwhile the ciprofloxacin for comparison 7.25 mm and DI water having 0 mm evaluation of the inhibition zone was used as a positive and negative control respectively. At the lower concentrations, bare specimens captured no inhibition zones throughout the measurements, while the Bi2O3 loaded with CS and (3, 6 wt%) g-C3N4 exhibits a considerable number of inhibition zones. The (6 wt%) g-C3N4/CS-doped Bi2O3 QDs demonstrated enhanced antibacterial efficacy (1.95–2.85) at lower and higher concentrations owing to alterations in the membrane structure of the bacteria.
| Samples | E. coli inhibition zone (mm) | Ciprofloxacin | Deionized water | |
|---|---|---|---|---|
| 0.5 mg/50 μL | 1.0 mg/50 μL | |||
| Bi2O3 | 0 | 0.60 | 7.25 | 0 |
| CS-Bi2O3 | 0.90 | 2.05 | 7.25 | 0 |
| (3 wt%) g-C3N4/CS-Bi2O3 | 1.45 | 2.25 | 7.25 | 0 |
| (6 wt%) g-C3N4/CS-Bi2O3 | 1.95 | 2.85 | 7.25 | 0 |
The interaction of the material with bacteria cells to block the transport chain and the negatively charged surface of Gram-negative bacteria with a strong affinity for positive ions facilitates electrostatic interactions between QDs and the bacterial surface. As a result, antimicrobial agent can directly cross the cell membrane and disturb cell function (Fig. S2†). The hydroperoxyl radical (*HO2) is formed when superoxide anion radicals (O2−) combine with H+ ions. The hydrogen peroxide radical (*H2O2) develops when the hydroperoxyl radical (*HO2) interacts with e− and H+. The QDs promote single and dual-wrecked breaks inside the nucleic acid base of nitrogen and sugar-phosphate link' by the production of intracellular ROS that interact with the nucleic acid inside the bacterial cell.66 This is performed by encouraging the oxidation of residual amino acids and disconnecting critical proteins, so interfering with numerous metabolic operations.67 As a result, ROS damaged nucleic acid and was thought to be responsible for DNA breakage, consequently leading to bacterial death.68 The interaction of an enormous electrostatic charge (Bi3+) and a bacterial membrane cause lysis and cell collapse. This contact eventually results in the death of the microorganisms involved. Table 1 shows that at the higher concentration of the QDs, the ability to destroy bacteria was increased.67
The capacity of computational methods, especially molecular docking studies, to permit in-depth examination of mechanisms underlying varied biological traits has garnered them substantial attention in recent decades. Using a molecular docking methodology, the suggested approach evaluated the binding capacity and inhibitory potential of synthesized QDs to identify optimal enzyme inhibitors. Antibiotic research has focused heavily on two enzymes-β-lactamase and DNA gyrase, that play critical roles in bacterial growth and survival.69 In the instance of β-lactamaseE.![[thin space (1/6-em)]](https://www.rsc.org/images/entities/i_char_2009.gif) coli, binding scores of 3.48, 3.79, and 7.01 for Bi2O3, CS-Bi2O3, and g-C3N4/CS-Bi2O3 QDs, respectively, indicated an acceptable binding propensity within the active pocket where Bi2O3 formed hydrogen bonds with Ser212 and Gly320. The H-bonding patterns of CS-Bi2O3 with Gln120, Asn152, and Asn343 are represented in Fig. 6b and c, whereas the H-bonding patterns of g-C3N4/CS-Bi2O3 with Gln120, Arg148, Ala318, and Thr316 are depicted in Fig. 6d.
coli, binding scores of 3.48, 3.79, and 7.01 for Bi2O3, CS-Bi2O3, and g-C3N4/CS-Bi2O3 QDs, respectively, indicated an acceptable binding propensity within the active pocket where Bi2O3 formed hydrogen bonds with Ser212 and Gly320. The H-bonding patterns of CS-Bi2O3 with Gln120, Asn152, and Asn343 are represented in Fig. 6b and c, whereas the H-bonding patterns of g-C3N4/CS-Bi2O3 with Gln120, Arg148, Ala318, and Thr316 are depicted in Fig. 6d.
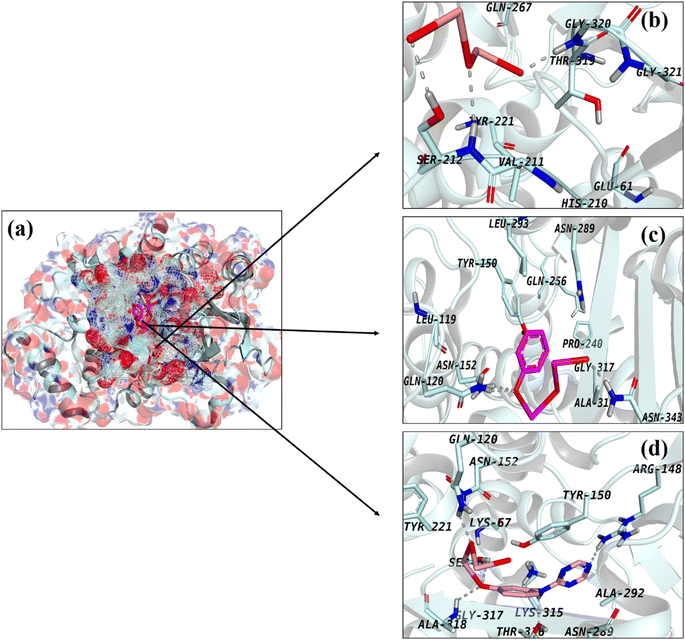 | ||
Fig. 6 Binding interaction pattern of (a) superimposed complexes, (b) Bi2O3, (c) CS-Bi2O3, and (d) g-C3N4/CS-Bi2O3 QDs inside active pocket of β-lactamaseE.![[thin space (1/6-em)]](https://www.rsc.org/images/entities/i_char_2009.gif) coli. coli. | ||
The active pocket of DNA gyrase (a common target for antibiotics) was also used to build and study docking complexes. The best binding scores (2.93 and 3.34, respectively) were found for docked complexes including Bi2O3 and CS-Bi2O3, both of which formed H-bonds with Thr165 (Fig. 7a–c). Fig. 7d shows that g-C3N4/CS-Bi2O3 showed four H-bonds, with Asn46, Asp73, Arg136, and Thr165 all having a binding score of 3.91.
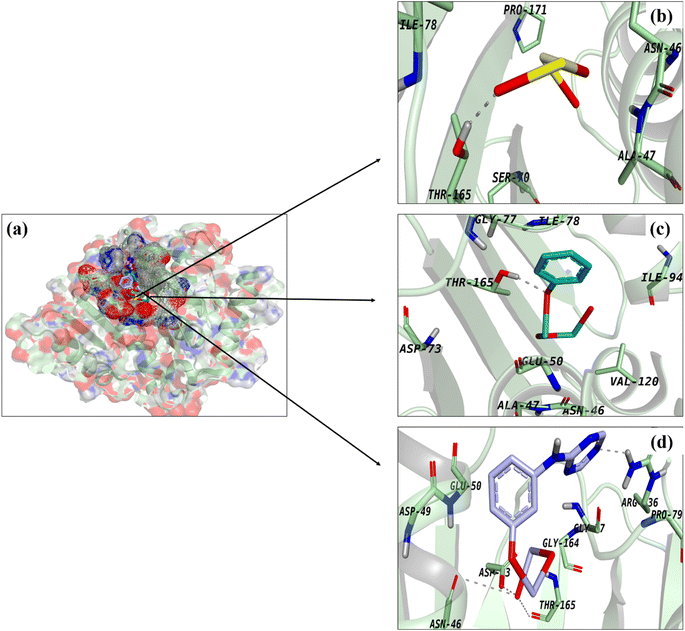 | ||
Fig. 7 Binding interaction pattern of (a) superimposed complexes, (b) Bi2O3, (c) CS-Bi2O3 and (d) g-C3N4/CS-Bi2O3 QDs inside active pocket of DNA GyraseE.![[thin space (1/6-em)]](https://www.rsc.org/images/entities/i_char_2009.gif) coli. coli. | ||
4. Conclusion
In this study, g-C3N4/CS-Bi2O3 QDs were effectively synthesized using an eco-friendly, cost-effective co-precipitation approach. The XRD pattern and sharp peaks confirmed the monoclinic structure of synthesized QDs were observed upon doping. The existence of the Bi–O–Bi stretching vibration at 540 cm−1 of the synthesized QDs confirmed by FTIR moreover, the presence of Bi2O3 was confirmed with EDS. The calculated band gap energies were found from 4.2 to 3.54 eV showing decreasing trend upon doping. Peak intensity dropped after CS and g-C3N4 doping, indicating a lower charge-to-hole recombination rate, but the higher dose of g-C3N4 indicates enhanced charge-to-hole recombination. TEM analysis exhibits the QDs morphology of Bi2O3, and agglomeration has been observed upon doping (6 wt%) g-C3N4. HRTEM images were utilized to calculate the interlayer spacing (0.272, 0.279, 0.279, and 0.276 Å), which was in satisfactory agreement with XRD data. Molecular docking verified synthesized QDs as possible inhibitors of β-lactamase and DNA gyrase enzymes, demonstrating their efficacy against Gram-negative bacteria. As research progresses, this finding will pave the way for generating binary-doped heterostructures with applications in dye degradation and a potential candidate for killing the microorganisms.Conflicts of interest
No conflict of interest.Acknowledgements
The authors extend their appreciation to the Deanship of Scientific Research at King Khalid University, Saudi Arabia, for funding this work through Large Groups Project under grant number (RGP.2/228/44).References
- A. A. Yaqoob, T. Parveen, K. Umar and M. N. Mohamad Ibrahim, Water, 2020, 12, 495 CrossRef CAS.
- Y. Hu and H. Cheng, Environ. Dev., 2013, 8, 57–73 CrossRef.
- M. Nasrollahzadeh, M. Sajjadi, S. Iravani and R. S. Varma, J. Hazard. Mater., 2021, 401, 123401 CrossRef CAS PubMed.
- P. Chowdhary, R. N. Bharagava, S. Mishra and N. Khan, in Environmental Concerns and Sustainable Development: Volume 1: Air, Water and Energy Resources, ed. V. Shukla and N. Kumar, Springer Singapore, Singapore, 2020, pp. 235–256, DOI:10.1007/978-981-13-5889-0_12.
- H. Saeed, M. Ikram, A. Haider, S. Naz, A. Ul-Hamid, W. Nabgan, J. Haider, S. M. Ibrahim, H. Ullah and S. Khan, Surf. Interfaces, 2023, 38, 102804 CrossRef CAS.
- S.-M. Hasheminya and J. Dehghannya, Part. Sci. Technol., 2020, 38, 1019–1026 CrossRef CAS.
- S. Santajit and N. Indrawattana, BioMed Res. Int., 2016, 2016, 2475067 Search PubMed.
- Y. Zhang, W. Xiu, S. Gan, J. Shan, S. Ren, L. Yuwen, L. Weng, Z. Teng and L. Wang, Front. Bioeng. Biotechnol., 2019, 7, 218 CrossRef PubMed.
- H. Kiwaan, T. Atwee, E. Azab and A. El-Bindary, J. Mol. Struct., 2020, 1200, 127115 CrossRef CAS.
- A. H. Jawad, A. S. Abdulhameed and M. S. Mastuli, J. Taibah Univ. Sci., 2020, 14, 305–313 CrossRef.
- S. Ihaddaden, D. Aberkane, A. Boukerroui and D. Robert, J. Water Process Eng., 2022, 49, 102952 CrossRef.
- L. Ayed, K. Chaieb, A. Cheref and A. Bakhrouf, Desalination, 2010, 260, 137–146 CrossRef CAS.
- J.-H. Deng, X.-R. Zhang, G.-M. Zeng, J.-L. Gong, Q.-Y. Niu and J. Liang, Chem. Eng. J., 2013, 226, 189–200 CrossRef CAS.
- S. Wang, S. Tang, H. Yang, F. Wang, C. Yu, H. Gao, L. Fang, G. Sun, Z. Yi and D. Li, J. Mater. Sci.: Mater. Electron., 2022, 33, 7172–7190 CrossRef CAS.
- M. Ikram, A. Rafiq Butt, A. Fatima, I. Shahzadi, A. Haider, A. Ul-Hamid, T. Alshahrani and W. Nabgan, J. Photochem. Photobiol., A, 2023, 443, 114835 CrossRef CAS.
- I. M. Hamouda, J. Biomed. Res., 2012, 26, 143–151 CrossRef CAS PubMed.
- Q. He, Y. Ni and S. Ye, RSC Adv., 2017, 7, 27089–27099 RSC.
- H. Sudrajat and P. Sujaridworakun, Mater. Des., 2017, 130, 501–511 CrossRef CAS.
- S. S. Raut, O. Bisen and B. R. Sankapal, Ionics, 2017, 23, 1831–1837 CrossRef CAS.
- Z. B. Shifrina, V. G. Matveeva and L. M. Bronstein, Chem. Rev., 2019, 120, 1350–1396 CrossRef PubMed.
- S. F. Bdewi, O. G. Abdullah, B. K. Aziz and A. A. R. Mutar, J. Inorg. Organomet. Polym. Mater., 2016, 26, 326–334 CrossRef CAS.
- A. Biswal, P. K. Sethy and S. K. Swain, Polym.-Plast. Technol. Mater., 2021, 60, 182–194 CAS.
- N. Rouabah, B. Boudine, R. Nazir, M. Zaabat, A. S. Alqahtani, M. S. Alqahtani and R. Syed, J. Polym. Res., 2021, 28, 1–10 CrossRef.
- T. V. Surendra, C. S. Espenti and S. V. Arunachalam, in Nanostructured, Functional, and Flexible Materials for Energy Conversion and Storage Systems, Elsevier, 2020, pp. 325–343 Search PubMed.
- N. Murugasenapathi and P. Tamilarasan, in Nanoscale Graphitic Carbon Nitride, Elsevier, 2022, pp. 515–544 Search PubMed.
- G. Fan, Z. Ma, X. Li and L. Deng, Ceram. Int., 2021, 47, 5758–5766 CrossRef CAS.
- P. Mary Rajaitha, K. Shamsa, C. Murugan, K. B. Bhojanaa, S. Ravichandran, K. Jothivenkatachalam and A. Pandikumar, SN Appl. Sci., 2020, 2, 572 CrossRef CAS.
- H. Ullah, E. Viglašová and M. Galamboš, Processes, 2021, 9, 263 CrossRef CAS.
- R. Vijayan, S. Joseph and B. Mathew, Particulate Science and Technology, 2018 Search PubMed.
- C. G. Sinclair, Am. J. Trop. Med. Hyg., 1939, 1, 605–606 CrossRef.
- A. Bauer, Am. J. Clin. Pathol., 1966, 45, 493–496 CrossRef CAS PubMed.
- F. Adzitey, S. Yussif, R. Ayamga, S. Zuberu, F. Addy, G. Adu-Bonsu, N. Huda and R. Kobun, Microorganisms, 2022, 10, 1335 CrossRef CAS PubMed.
- M. A. Wikler, Performance Standards for Antimicrobial Susceptibility Testing, Sixteenth Informational Supplement, M100-S16, Clinical and Laboratory Standards Institute (CLSI), Pennsylvania, 2006, vol. 26(3) Search PubMed.
- A. Haider, M. Ijaz, S. Ali, J. Haider, M. Imran, H. Majeed, I. Shahzadi, M. M. Ali, J. A. Khan and M. Ikram, Nanoscale Res. Lett., 2020, 15, 1–11 CrossRef CAS PubMed.
- S. Barelier, O. Eidam, I. Fish, J. Hollander, F. Figaroa, R. Nachane, J. J. Irwin, B. K. Shoichet and G. Siegal, ACS Chem. Biol., 2014, 9, 1528–1535 CrossRef CAS PubMed.
- F. Ushiyama, H. Amada, T. Takeuchi, N. Tanaka-Yamamoto, H. Kanazawa, K. Nakano, M. Mima, A. Masuko, I. Takata and K. Hitaka, ACS Omega, 2020, 5, 10145–10159 CrossRef CAS PubMed.
- I. Shahzadi, M. Islam, H. Saeed, A. Shahzadi, J. Haider, A. Haider, M. Imran, H. A. Rathore, A. Ul-Hamid and W. Nabgan, Int. J. Biol. Macromol., 2023, 235, 123874 CrossRef CAS PubMed.
- I. Shahzadi, M. Islam, H. Saeed, A. Haider, A. Shahzadi, J. Haider, N. Ahmed, A. Ul-Hamid, W. Nabgan and M. Ikram, Int. J. Biol. Macromol., 2022, 220, 1277–1286 CrossRef CAS PubMed.
- P. K. Soni, A. Bhatnagar and M. A. Shaz, Int. J. Hydrogen Energy, 2023, 48, 17970–17982 CrossRef CAS.
- M. Ikram, A. Shahzadi, M. Bilal, A. Haider, A. Ul-Hamid, W. Nabgan, J. Haider, S. Ali and M. Imran, Front. Chem., 2023, 11, 1167701 CrossRef CAS PubMed.
- S. Narzary, K. Alamelu, V. Raja and B. J. Ali, J. Environ. Chem. Eng., 2020, 8, 104373 CrossRef CAS.
- Y. Astuti, A. Fauziyah, S. Nurhayati, A. Wulansari, R. Andianingrum, A. Hakim and G. Bhaduri, Mater. Sci. Eng., 2016, 107, 012006 Search PubMed.
- J. Yang, T. Xie, C. Liu and L. Xu, Materials, 2018, 11, 1359 CrossRef PubMed.
- N. Nurmalasari, Y. Yulizar and D. Apriandanu, Mater. Sci. Eng., 2020, 763, 012036 CAS.
- Y. Wang, Y. Wen, H. Ding and Y. Shan, J. Mater. Sci., 2010, 45, 1385–1392 CrossRef CAS.
- T. Xian, X. Sun, L. Di, Y. Zhou, J. Ma, H. Li and H. Yang, Catalysts, 2019, 9, 1031 CrossRef CAS.
- Z. Khazaee, A. Mahjoub, A. H. Cheshme Khavar, V. Srivastava and M. Sillanpää, Environ. Sci. Pollut. Res., 2021, 28, 50747–50766 CrossRef CAS PubMed.
- N. Motakef Kazemi and M. Yaqoubi, Iran. J. Pharm. Res., 2020, 19, 70–79 CAS.
- H. M. Zubair Arshad, M. Imran, A. Haider, I. Shahzadi, M. Mustajab, A. Ul-Hamid, W. Nabgan, F. Medina, S. Aslam and M. Ikram, Front. Environ. Sci., 2023, 11, 528 Search PubMed.
- S. Condurache-Bota, C. Constantinescu, M. Praisler and N. Tigau, Sensors, 2015, 1, 7–9 Search PubMed.
- M. Ikram, M. Saeed, J. Haider, A. Haider, A. Ul-Hamid, A. Shahzadi, W. Nabgan, A. Rafique, S. Dilpazir and S. Ali, Appl. Nanosci., 2022, 12, 2657–2670 CrossRef CAS.
- T. Chen, Q. Hao, W. Yang, C. Xie, D. Chen, C. Ma, W. Yao and Y. Zhu, Appl. Catal., B, 2018, 237, 442–448 CrossRef CAS.
- P. Hao, Z. Zhao, J. Tian, Y. Sang, G. Yu, H. Liu, S. Chen and W. Zhou, Acta Mater., 2014, 62, 258–266 CrossRef CAS.
- S. P. Adhikari, H. Dean, Z. D. Hood, R. Peng, K. L. More, I. Ivanov, Z. Wu and A. Lachgar, RSC Adv., 2015, 5, 91094–91102 RSC.
- S. S. Lee, H. Bai, Z. Liu and D. D. Sun, Water Res., 2013, 47, 4059–4073 CrossRef CAS PubMed.
- S. Lu, T. Wu, Y. Liu, H. Luo, F. Jiang, X. Nie and H. Chen, J. Alloys Compd., 2022, 911, 164980 CrossRef CAS.
- S. Munusamy, Sustainable Chem. Processes, 2013, 1, 1–8 CrossRef.
- W. Zhao, Y. Wang, Y. Yang, J. Tang and Y. Yang, Appl. Catal., B, 2012, 115, 90–99 CrossRef.
- D. Kumar, D. Banerjee, S. Sarkar, N. S. Das and K. K. Chattopadhyay, Mater. Chem. Phys., 2016, 175, 22–32 CrossRef CAS.
- S. Borthakur and L. Saikia, J. Environ. Chem. Eng., 2019, 7, 103035 CrossRef CAS.
- W. Yuan, C. Zhang, H. Wei, Q. Wang and K. Li, RSC Adv., 2017, 7, 22825–22835 RSC.
- X. Ma, H. Yuan, Q. Qiao, S. Zhang and H. Tao, Colloids Surf., A, 2023, 664, 131099 CrossRef CAS.
- Ayesha, M. Imran, A. Haider, I. Shahzadi, S. Moeen, A. Ul-Hamid, W. Nabgan, A. Shahzadi, T. Alshahrani and M. Ikram, J. Environ. Chem. Eng., 2023, 11, 110088 CrossRef CAS.
- M. Ikram, T. Inayat, A. Haider, A. Ul-Hamid, J. Haider, W. Nabgan, A. Saeed, A. Shahbaz, S. Hayat and K. Ul-Ain, Nanoscale Res. Lett., 2021, 16, 1–11 CrossRef PubMed.
- T. Shujah, A. Shahzadi, A. Haider, M. Mustajab, A. M. Haider, A. Ul-Hamid, J. Haider, W. Nabgan and M. Ikram, RSC Adv., 2022, 12, 35177–35191 RSC.
- E. Ragab, M. Shaban, A. A. Khalek and F. Mohamed, Int. J. Biol. Macromol., 2021, 181, 301–312 CrossRef CAS PubMed.
- W. J. Aziz, M. A. Abid, D. A. Kadhim and M. K. Mejbel, Mater. Sci. Eng., 2020, 881, 012099 CAS.
- Z. Mehmood, M. Ikram, M. Imran, A. Shahzadi, A. Haider, A. Ul-Hamid, W. Nabgan, J. Haider and S. Hayat, Process Biochem., 2022, 121, 635–646 CrossRef CAS.
- S. McAuley, A. Huynh, A. Howells, C. Walpole, A. Maxwell and J. R. Nodwell, Cell Chem. Biol., 2019, 26, 1274–1282 CrossRef CAS PubMed.
Footnote |
| † Electronic supplementary information (ESI) available. See DOI: https://doi.org/10.1039/d3ra04664h |
| This journal is © The Royal Society of Chemistry 2023 |

