 Open Access Article
Electrospun silk nanofiber loaded with Ag-doped TiO2 with high-reactive facet as multifunctional air filter†
Sompit Wanwong *a,
Weradesh Sangkhun
 a,
Pimsumon Jiamboonsri
 b and
Teera Butburee
 c
c
aMaterials Technology Program, School of Energy, Environment and Materials, King Mongkut's University of Technology Thonburi, 126 Pracha Uthit Road, Bang Mod, Thailand. E-mail: sompit.wan@kmutt.ac.th
bFaculty of Medicine, King Mongkut's Institute of Technology Ladkrabang, Bangkok 10520, Thailand
cNational Nanotechnology Center, National Science and Technology Development Agency, Thailand Science Park, Pathum Thani 12120, Thailand
First published on 29th August 2023
Abstract
Particulate matter (PM) and volatile organic compounds (VOCs) are air pollution that can cause high risk to public health. To protect individuals from air pollution exposure, fibrous filters have been widely employed. In this work, we develop silk nanofibers, which are loaded with Ag-doped TiO2 nanoparticles with exposed (001) (assigned as Ag-TiO2-silk), via electrospinning method and utilized them as multifunctional air filters that can efficiently reduce PM2.5, organic pollutants and microbials. The results showed that Ag-TiO2-silk with a loading of 1 wt% (1%Ag-TiO2-silk) exhibited the best performance among various different Ag-doped samples, as it performed the best as an air filter, which had the highest PM2.5 removal efficiency of 99.04 ± 1.70% with low pressure drop of 34.3 Pa, and also exhibited the highest photodegradation efficiency of formaldehyde. In addition, the Ag-TiO2-silk demonstrated antibacterial activity. These properties make silk composite nanofibers attractive for multifunctional and environmentally-friendly air filter application.
1. Introduction
Currently, air pollutants, such as PM2.5, and toxic gaseous and volatile organic compounds, are one of the most severe problems globally.1–5 These pollutants can cause many diseases such as respiratory disorders, asthma, lung failure, coronary artery disease, Alzheimers, and cancer.6–8 To protect humans from air pollution exposure, fibrous air filters have been widely employed, owing to their good efficiency, high surface to volume ratio, high porosity, and low cost. However, the conventional available fibrous air filters have micron size with multiple layers of fabrication, leading to high air flow resistance, high pressure drop and bulkiness. Moreover, the conventional air filters are mostly produced from synthetic polymers which are non-biodegradable. Thus, they could accumulate in the environment for a longer period and lead to serious environmental damage. To cope with these aforementioned problems, bio-degradable nanofibrous air filters have attracted great attention. Recently, biodegradable nanofibrous air filters with high aspect ratios with enlarged surface area high filtration efficiency have been developed.9 Among the biodegradable materials, silk has gained a particular interest. A handful of reports showing that silk can effectively capture PM2.5 via electrostatic. In addition, silk has appropriate tensile strength, high elastic properties during compression10 and unique heat dissipation,11,12 which be useful for air filter application. Moreover, silk nanofiber can be easily produced by electrospinning technique. Considering these many advantages, silk could be suitably applied as an eco-friendly air filter material. Previously, there were few reports showing that silk nanofiber can efficiently remove PM2.5 with low pressure drop. For examples, Wang et al.13 prepared silk fibroin (SF) in formic acid solution. The electrospun silk nanofibers have diameter ranges from 100 to 480 nm and can remove PM2.5 up to 98% with pressure drop of 98 Pa. In another study, Gao et al.14 prepared electrospun silk nanofibers mixed with polyethylene oxide (PEO). The PEO was added to increase viscosity of the solution for facile electrospinning. The resulting silk nanofibers show PM2.5 removal efficiency of 99% and pressure drop of 75 Pa. Furthermore, Min et al.15 spun the mixture solution of silk and PEO on the aluminum mesh (window mesh). They found that silk/PEO air filters and high efficiency particulate air (HEPA) filters have similar PM2.5 and PM10 removal efficiency, but silk/PEO filters have 50% lower pressure drop than the HEPA filter.However, air pollution does not consist of only PM2.5, but also other substances such as VOCs, toxic gaseous and microbial contaminants. Photocatalysis has been reported to be the efficient and environmentally-friendly process for degrading organic, inorganic, and biological substances. Therefore, integrating nanofiber with photocatalysts could be beneficial for nanofiber acting as a multifunctional filter. TiO2 is a well-known photocatalyst that can generate reactive oxidizing energy (ROS) to destroy pollutant compounds under UV irradiation.16–20 Especially, TiO2 nanoparticles with exposed (001) facet have been reported to enhance chemical absorption and promote high charge transfer.21 Its surface energy is higher than that of the conventional TiO2 with exposed (101) facet, resulting in a higher oxidative potential and the overall photocatalytic performance.22 The light-harvesting efficiency of TiO2 facets can be enhanced by doping with noble metal such as Pt, Au and Ag.23 However, there is no report about the effect of metal-doped TiO2 with high-reactive facets that are loaded on electrospun silk nanofibers for multipurpose air filtration.
In this work, we aim to develop a multifunctional air filter from silk nanocomposite made by electrospun of silk nanofiber loaded with Ag-doped TiO2. The TiO2 nanoparticles exposed (001) facet were synthesized by hydrothermal method, and doped by Ag nanoparticles (AgNPs) with various contents of AgNPs using photo-deposition technique (assigned as Ag-TiO2-silk). In this composite, silk nanofibers served as a matrix to capture PM2.5, Ag-TiO2 particles not only acted as photocatalytic units to destroy organic pollutants, but also performed antimicrobial function. The obtained Ag-TiO2-silk nanofibers were characterized by various techniques such as SEM, EDS, TEM, XRD, XPS, and zeta potential measurement, respectively, while their physicochemical properties such as surface morphology, surface charge, PM2.5 filtration efficiency, photocatalytic performances and antibacterial activity were carefully evaluated. The results showed that Ag-TiO2-silk with Ag load of 1 wt% (1%Ag-TiO2-silk) showed the most promising efficiency toward PM2.5 removal, formaldehyde degradation, and antibiotic activities.
2. Experimental sections
2.1 Materials
Titanium(IV) butoxide (TBOT) (reagent grade, 97%), silver nitrate (AgNO3) (reagent grade, ≥99%), sodium hydroxide (NaOH) (reagent grade ≥ 98%), and polyethylene oxide (PEO) (MW ∼ 900![[thin space (1/6-em)]](https://www.rsc.org/images/entities/char_2009.gif) 000) were purchased from Sigma Aldrich. Lithium bromide (LiBr) (99%) was purchased from Tokyo Chemical Industry (TCI). Hydrofluoric acid (HF) (reagent grade, 48%), hydrochloric acid (HCl) (reagent grade, 37%), and isopropanol (IPA) (reagent grade ≥ 98%) were purchased from Merck. Deionized (DI) water (pH 5–7) was purchased from RCI Labscan. Glycerol (AR grade) was purchased from Ajax Finechem. Phosphate buffer saline (PBS) (pH 7.4) was purchased from EMD Millipore. Silk cocoons (Bombyx mori, Saraburi yellow strain) were obtained from a local farmer in Thailand. Dialysis membrane with a molecular weight cutoff (MWCO) of 3.5 kDa (Spectra/Por) was purchased from Fischer Scientific. Aluminum mesh (square hole = 1.5 × 1.5 mm2) was purchased from a local super market.
000) were purchased from Sigma Aldrich. Lithium bromide (LiBr) (99%) was purchased from Tokyo Chemical Industry (TCI). Hydrofluoric acid (HF) (reagent grade, 48%), hydrochloric acid (HCl) (reagent grade, 37%), and isopropanol (IPA) (reagent grade ≥ 98%) were purchased from Merck. Deionized (DI) water (pH 5–7) was purchased from RCI Labscan. Glycerol (AR grade) was purchased from Ajax Finechem. Phosphate buffer saline (PBS) (pH 7.4) was purchased from EMD Millipore. Silk cocoons (Bombyx mori, Saraburi yellow strain) were obtained from a local farmer in Thailand. Dialysis membrane with a molecular weight cutoff (MWCO) of 3.5 kDa (Spectra/Por) was purchased from Fischer Scientific. Aluminum mesh (square hole = 1.5 × 1.5 mm2) was purchased from a local super market.
2.2 Synthesis of TiO2 exposed with (001) facet
Facet-controlled TiO2 nanoparticles were synthesized by adopting the method reported by Wu et al.24 A mixture of HF (2.4 mL), HCl (2.4 mL), and TBOT (20 mL) was stirred at room temperature for 10 min and then transferred to a Teflon lined stainless steel autoclave. Next, the solution was hydrothermally treated at 200 °C for 24 h. The white powder automatically settled down on the bottom of the autoclave after the reaction completed. The top aliquot was poured out to a plastic waste container. The powder left on the bottom of the Teflon container was further centrifuged and washed by using ethanol followed by water three times for each washing solvent. The obtained TiO2 powder was then dried in a vacuum oven set at 80 °C overnight. The TiO2 powder was grounded using an agate mortar pestle, and then calcined under air at 500 °C (5 °C min−1) for 3 h.2.3 Synthesis of Ag-TiO2(001) facet
The photo-deposition technique, which adapted from method reported by Wei et al.,25 was utilized to deposit AgNPs onto TiO2 surface. Firstly, the calcined powder TiO2 was added into a mixed solution, containing DI water and IPA as hole scavenger (10![[thin space (1/6-em)]](https://www.rsc.org/images/entities/char_2009.gif) :
:![[thin space (1/6-em)]](https://www.rsc.org/images/entities/char_2009.gif) 1 by volume). Then, the mixture was stirred and ultrasonicated until TiO2 nanoparticles dispersed well in solution and then placed the TiO2 solution. Next, the desired concentration (0.01, 0.1, and 1.0 mM) of AgNO3 was dropped into 0.5 g of TiO2 dispersed in solution and subsequently irradiated by UV LED (370 nm wavelength) for 60 min under vigorously stirring. The distance between the light source and surface of solution was fixed to be 30 cm. The power consumption of LED light bulb was fixed as 60 W. After 60 min of irradiation, 0.1 M of NaOH was slowly added into the solution during vigorously stirring. Then, the solid product was left to be precipitated at room temperature for 24 h. The obtained solid was centrifuged at 8000 rpm for 15 min and washed thoroughly with excess DI water. The solid was dried in vacuum oven at 60 °C for overnight and then grounded in an agate mortar. In this study, in order to deposit different loading of AgNPs on TiO2(001) facet, the concentrations of AgNO3 were varied as 0.01, 0.1 and 10 mM to achieve 0.1%Ag-TiO2, 1%Ag-TiO2, and 10%Ag-TiO2, respectively.
1 by volume). Then, the mixture was stirred and ultrasonicated until TiO2 nanoparticles dispersed well in solution and then placed the TiO2 solution. Next, the desired concentration (0.01, 0.1, and 1.0 mM) of AgNO3 was dropped into 0.5 g of TiO2 dispersed in solution and subsequently irradiated by UV LED (370 nm wavelength) for 60 min under vigorously stirring. The distance between the light source and surface of solution was fixed to be 30 cm. The power consumption of LED light bulb was fixed as 60 W. After 60 min of irradiation, 0.1 M of NaOH was slowly added into the solution during vigorously stirring. Then, the solid product was left to be precipitated at room temperature for 24 h. The obtained solid was centrifuged at 8000 rpm for 15 min and washed thoroughly with excess DI water. The solid was dried in vacuum oven at 60 °C for overnight and then grounded in an agate mortar. In this study, in order to deposit different loading of AgNPs on TiO2(001) facet, the concentrations of AgNO3 were varied as 0.01, 0.1 and 10 mM to achieve 0.1%Ag-TiO2, 1%Ag-TiO2, and 10%Ag-TiO2, respectively.
2.4 Silk fibroin extract
Silk cocoons (15 g) were cut into small pieces, and then were boiled in DI water (2 L) at 90 °C for 3 h to removes sericin. The degummed silk was washed with DI water several times, and dried in a vacuum oven set at 40 °C for 12 h. Next, the silk fibers were dissolved in 9.3 M LiBr (15 wt%) at 60 °C for 3 h, and then left at room temperature for 24 h. Then, the silk fibroin (SF) solution was dialyzed against DI water for 3 days by using dialysis membrane (3.5 kDa MWCO). During dialysis, DI water was changed every 12 h for 5 times. After that, the SF was centrifuged, and the resulting 12 wt% SF solution was stored at 4 °C before use.2.5 Electrospinning of silk, TiO2-silk and Ag-TiO2-silk nanofibers
To prepare silk nanofiber, first, 12 wt% of SF (3 mL) was mixed with 2 mL of 6 wt% PEO (0.5 mL) solution and stirred in an iced bath for 30 min. The solution was placed in a 5 mL plastic syringe. The stainless-steel needle (18G) with a needle length of 20 mm was used to inject the solution. The distance between the syringe tip and the aluminum mesh collector distance was 20 cm. The constant feed rate of 0.6 mL h−1 was utilized to inject the silk solution. The applied DC voltages were systematically varied which were 10, 15 and 20 kV to investigate the effect of applied voltage on the fiber diameter.To prepare TiO2-silk and Ag-TiO2-silk nanofibers, 0.1 g of the synthesized photocatalysts, was mixed with 3 mL of silk solution (∼12 wt%) and 2 mL of PEO solution (6 wt%). Then, the mixture was ultrasonicated and stirred until the photocatalyst was well dispersed. The distance between the syringe tip and the aluminum sheet collector distance was 20 cm. The constant feed rate of 0.6 mL h−1 and the applied voltage of 15 kV were applied during the electrospinning process. The obtained nanofibers were dried in a vacuum oven set at 60 °C and 10 mbar for overnight. Finally, the thickness of the electrospun mats was measured by using a micrometer screw gauge.
2.6 Characterization
The morphology of TiO2 and Ag-TiO2 blended with the electrospun silk nanofibers were investigated using a field-emission scanning electron microscope (FE-SEM, Versa 3D FEG) which was operated at 5 kV to 15 kV and equipped with energy dispersive X-ray spectroscope (EDS) which was used to investigate the elemental composition of the composites. Transmission electron microscopy (TEM) was performed on JEOL 2100Plus operated at 200 kV. The percentage of (001) facet of the prepared TiO2 was calculated by using Raman data26,27 which was obtained by NTEGRA Spectra (NTMDT). The light absorption properties of various photocatalysts was observed using a UV-visible spectrophotometer (Shimadzu UV3600plus). The crystal structures of the prepared TiO2 and Ag-TiO2 were investigated by using X-ray diffraction pattern (XRD) obtained by Bruker D8 Advanced X-ray diffractometer with CuKα radiation (wavelength 1.54060 Å). The chemical state information of the Ag-TiO2 was determined using X-ray photoelectron spectroscopy (XPS, Kratos, Axis Ultra DLD). The nitrogen adsorption isotherms analysis was performed using a gas adsorption instrument (Micromeritics ASAP 2020). The particle size and surface charge of the photocatalysts were evaluated by a Zeta sizer/zeta potential, measured on a HORIBA Scientific SZ-100 series analyzer.2.7 Measurement of PM2.5 removal efficiency
The PM2.5 removal efficiency of silk nanofibers were tested in a custom-built system, as reported in our previous work.28 The silk nanofiber samples with an exposed area of 7 cm2 were inserted into a filter bracket. Buddhist incense was burned at one side of the testing box to generate PM particles (at a concentration of ∼2000 μg cm−3) and dispersed in the chamber by fans (12 VDC). The amount of PM2.5 was dynamically monitored by air quality dust sensors (PM1.0/PM2.5/PM10 detector module, 2.8′′ TFT) with monitoring duration of 20 min and recording the value in real-time data every 30 s. The pressure drop (ΔP) was measured by a differential pressure meter (Testo 510 pressure manometer). The experiments were tested at room temperature with 80% relative humidity. The PM removal efficiency (η), pressure drop (ΔP), and quality factor (QF) were calculated by using eqn (1), (2), and (3), respectively.| η = C1 − C2/C1 | (1) |
| ΔP = P2 − P1 | (2) |
| QF = ln(1 − η)/ΔP | (3) |
The reusability of 1%Ag-TiO2-silk nanofiber was tested with three samples. Briefly, after each filtration cycle, the 1%Ag-TiO2-silk nanofiber was treated with compressed nitrogen gas at a pressure of 1 bar for 30 minutes to remove PM particles that attached on the nanofiber without destruction the fiber. Then the PM2.5 removal efficiency after regenerating the silk nanofiber was investigated.
2.8 Photocatalytic activity
Photocatalytic activity of Ag-TiO2-loaded in silk nanofiber towards degradation of volatile organic compound (VOC) was investigated. Formaldehyde was used as VOC source. Silk, TiO2-silk, 0.1%Ag-TiO2-silk, 1%Ag-TiO2-silk, and 10%Ag-TiO2-silk nanofiber mats (5 × 5 cm2) were placed in the photo reaction chamber containing formaldehyde (%RH ∼ 80%). After light irradiation (1.5 AM and 100 mW cm−2), formaldehyde was sampled with different time intervals and then its concentration was measured by using Shimadzu GC-2014 with thermal conductivity detector equipped with a Porapak T column. The degradation efficiency (ε) of the photocatalysts towards formaldehyde degradation was evaluated by using eqn (4), where C0 and Ct are the initial and terminal concentrations of the formaldehyde, respectively.| ε = (C0 − Ct)/C0 × 100 | (4) |
2.9 Antibacterial activity
The antibacterial activities of silk nanofibers and various Ag-TiO2-silk nanofiber samples were determined against the representative bacteria, Staphylococcus aureus ATCC25923 and Escherichia coli ATCC25922. Both bacterial strains were stored at −80 °C in 20% glycerol until use. In the typical experiments, the isolated bacterial colonies from the agar plate were cultured separately in Mueller–Hinton (MH) broth (Becton Dickinson & Co., France) at 37 °C overnight (18–24 h). The suspension turbidity was adjusted spectrophotometrically at 600 nm to obtain an optical density (OD) of 0.1 and the number of CFU mL−1 was determined before use. For Ag-TiO2-silk nanofiber samples, all mesh types were cut into a size of 1 × 1 cm2 and pre-sterilized by UV light for 30 min before test. After placing a sterile coated mesh into a 24-well plate, 10 μL of the prepared inoculum was directly dropped on each mesh, ensuring that the inoculum did not touch the wall. In each plate, a 500 μL of sterile phosphate buffer (PBS, pH 7.4) was added into the wells for one row to keep humidity during incubation. Then, the plates were incubated at 37 °C for 4 h under aerobic conditions. After incubation, 1 mL of PBS was added to each well that contained the test material. The plates were then shaken at a speed of 450 rpm, room temperature for 30 min. An aliquot (10 μL) of the samples was collected and prepared a ten-fold serial dilution in sterile PBS. Thereafter, 10 μL of each dilution was placed on the MH agar and incubated at 37 °C for 24 h. The survival bacteria were counted and recorded as the number of CFU mL−1. The blank substrate or aluminum mesh was also used as a control. The antibacterial capability was expressed as the percentage of bacterial reduction and calculated by using eqn (5).| Bacterial reduction (%) = ((N0 − N4)/N0) × 100 | (5) |
The log number of CFU mL−1 were expressed as mean ± standard deviation (SD). The statistical analyses were performed using SPSS (version 29.0, SPSS Inc., Chicago, IL, USA). An analysis of variance (ANOVA) was performed, and significant differences between means were determined using Tukey's honesty significant difference test or Dunnett's T3 test at a significance level of p < 0.05.
3. Result and discussion
3.1 Characterization of TiO2(001) facet
Fig. 1(a) and (b) are SEM and TEM images of the synthesized TiO2. The measured side length of TiO2 with (001) facet is ∼200 nm. The spot pattern of the selected area diffraction (SAED) confirms that the synthesized TiO2 was anatase phase with a single crystalline structure along (001) zone axis, as shown in Fig. 1(c). Thus, the square-faceted surface is the (001) surface.29,30 The percentage of (001) of TiO2 was calculated by using Raman spectrum, as shown in Fig. 1(d). Four vibration peaks are observed at 153 (Eg), 396 (B1g), 512 (A1g) and 634 (E1g) cm−1, indicating the characteristic Raman bands of anatase TiO2.31 The percentage of exposed (001) facet on TiO2 was 53% which calculated by measuring Raman peak intensity ratio of Eg (153 cm−1) and A1g (512 cm−1) peaks which represent symmetric stretching and antisymmetric bending vibration of O–Ti–O, respectively.27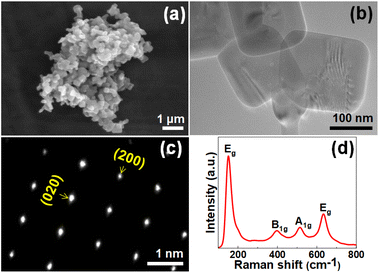 | ||
| Fig. 1 (a) SEM image, (b) TEM image, (c) SAED pattern, and (d) Raman spectrum of synthesized TiO2 with (001) facet. | ||
3.2 Characterization of AgNPs on TiO2 with (001) facet
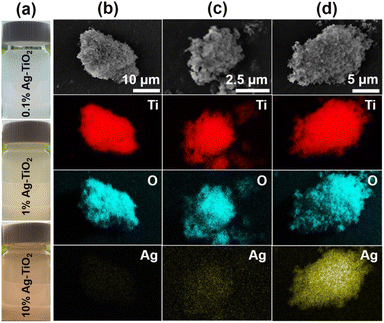
Ag-deposited TiO2 with (001) facet (Ag-TiO2) nanoparticles were synthesized using photo-deposition technique. This involved adding an aqueous solution of AgNO3 in TiO2(001) facet solution and irradiating the mixture solution with UV light. Fig. 2(a) shows the photographs of Ag-TiO2 doped with different amount of Ag (0.1, 1.0, and 10%, respectively), while Fig. 2(b)–(d) are their corresponding SEM and EDS mapping.The elemental maps reveal that the signal of Ag element (yellow color) is uniformly dispersed throughout the whole samples. In addition, the signal of Ag element becomes more intense with respect to the higher concentration of Ag loading contents, indicating successful variation of Ag in the samples.
The microstructure of AgNPs deposited on TiO2 was further characterized by TEM. As seen in Fig. 3(a), (b) and (c), which are the TEM images of 0.1%Ag-TiO2, 1%Ag-TiO2, and 10%Ag-TiO2, respectively. AgNPs are successfully deposited on the surface of TiO2 with an intimate contact between the two materials. In addition, the number of Ag deposited on TiO2 is obviously increased when increasing the concentration of Ag from 0.1 to 10%. It was found that the particle size of dopant AgNPs slightly increased with respect to an increase of AgNO3 concentration. For example, the average sizes of AgNPs in 0.1%Ag-TiO2, 1%Ag-TiO2, and 10%Ag-TiO2 are ∼8.6 nm, 10.4 nm, and 12.5 nm, respectively (Fig. S1†). The lattice fringe of AgNPs deposited TiO2(001) was also investigated, as seen in Fig. 3(d). AgNPs with large particle size was considered for measuring HRTEM to observe clear and sharp lattice fringe. The lattice fringe of AgNPs found in Ag-TiO2 was 0.23 nm which corresponds to (111) lattice spacing of face centered cubic (fcc) metallic Ag.32
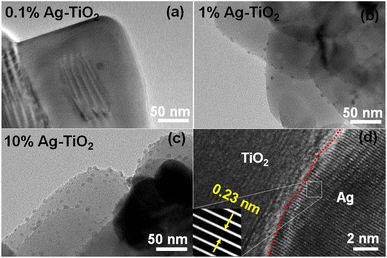 | ||
| Fig. 3 TEM images of (a) 0.1%Ag-TiO2, (b) 1%Ag-TiO2, (c) 10%Ag-TiO2, and (d) lattice fringes of 1%Ag-TiO2. | ||
Crystal phases of the catalysts were characterized by using powder X-ray diffraction (PXRD) technique. Fig. 4(a) shows the diffraction patterns of TiO2(001) and Ag-TiO2 with various Ag contents. All catalysts exhibits the diffraction peaks at 2θ of 25.4°, 37.8°, 48.1°, 54.0°, 55.1° and 62.8° which belong to the (101), (004), (200), (105), (211), and (204) lattice planes of anatase phase TiO2 (JCPDS 21-1272), respectively.33 At the low content of Ag (0.1 and 1 wt%), the peaks corresponding to metallic Ag are not detected, possibly due to the Ag doping contents in these two samples are lower than the detection limit of the XRD machine. On the other hand, when Ag content is increased to 10 wt% (10%Ag-TiO2), the corresponding diffraction peaks of Ag with face-center cubic (fcc) lattice at 2θ of 38.1°, 44.3°, and 64.5°,34 are evidently observed.
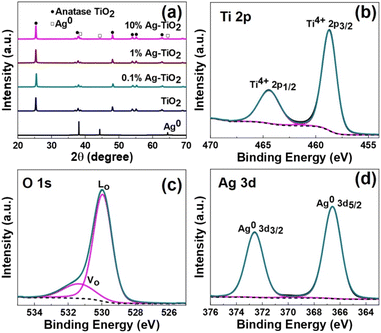 | ||
| Fig. 4 (a) XRD patterns of TiO2 and Ag-TiO2 with various loading amounts of AgNPs, XPS spectra of 1%Ag-TiO2, (b) Ti 2p, (c) O 1s, and (d) Ag 3d. | ||
Next, the surface chemical states of the elements contained in 1%Ag-TiO2 were investigated by using X-ray photoelectron spectroscopy (XPS). Fig. 4(b)–(d) show high resolution XPS spectra of Ti, O, and Ag, respectively. For XPS Ti 2p (Fig. 4(b)), the binding energy of 458.8 and 464.5 eV, which respectively assigned to Ti4+ 2p3/2 and Ti4+ 2p1/2, were observed.35 In addition, the lattice oxygen (LO) at 530.0 eV and the oxygen vacancy (VO) at 531.4 eV on the surface of TiO2 were observed in the deconvoluted O 1s XPS spectrum, as seen in Fig. 4(b).36 For XPS Ag 3d (Fig. 4(d)), the doublet binding energy at 366.6 and 372.6 eV which corresponds to Ag0 3d5/2 and Ag0 3d3/2, respectively, were observed. This confirms the zero-valence state of metallic Ag deposited on TiO2 surface.37
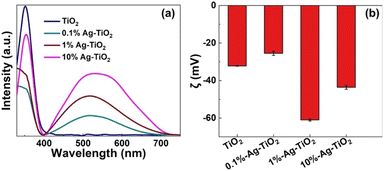
The optical properties of various Ag-TiO2(001) samples were observed by using UV-Vis spectroscopy technique. TiO2 and Ag-TiO2 samples showed intense light absorption wavelength at around 388 nm (Fig. 5(a)), representing the absorption band of anatase TiO2 (∼3.2 eV). This suggests that doping AgNPs onto TiO2(001) does not change light absorption properties of TiO2. In addition, the absorption wavelength in the range of 400 to 700 nm was also observed for all Ag-TiO2 samples, indicating the absorption band of plasmonic AgNPs. The absorption intensity significantly increased with an increase amount of deposited AgNPs. In addition, 10%Ag-TiO2 exhibited the broader and red-shifted absorption that could imply to non-uniform particle size of AgNPs.
The surface charge energy of the photocatalysts was also elucidated using zeta (ζ) potential (Fig. 5(b)). The zeta potentials of pure TiO2 and Ag-TiO2 show negative values (−25.5 to −61.0 mV), which are similar to the reported values in the previous literatures.38–40 In our case, the negative zeta potential could be caused by the use of NaOH, which activates –OH groups on the surface of TiO2 before and after photo-deposition of AgNPs. Interestingly, 1%Ag-TiO2 exhibits the most negative Zeta potential value (−61 mV), compared to those of 0.1%Ag-TiO2 (−25.5 mV) and 10%Ag-TiO2 (−43.6 mV).
3.3 Characterization of Ag-TiO2(001) silk nanofiber
First, the optimal applied voltage for electrospinning of silk nanofiber was investigated. Fig. S2† depicted that the morphology of the electrospun silk nanofibers have smooth surface. The effects of applied voltage on the size of silk are reported in Table S1.† Increasing the applied voltage from 12 kV to 15 kV, results in a decrease in fiber diameter from 311.05 ± 12.47 nm to 200.14 ± 1.73 nm. However, increasing the applied voltage to 20 kV leads to an average diameter as of 206.02 ± 3.38 nm. Thus, 15 and 20 kV were the suitable applied voltage for electrospinning of silk nanofiber because the smaller fiber diameter would lead to a higher specific surface area that beneficial to capture air pollutants. In addition, the histograms of silk nanofiber showed normal distribution with the coefficient of variation (defines as the ratio of standard deviation of the fiber diameter to the mean of the fiber diameter (SD/FD)) below 0.3,41 indicated that all of the electrospun silk was uniform nanofiber. Next, the synthesized TiO2 and Ag-TiO2 with various Ag loading contents (0.1, 1, and 10 wt%) were mixed to the silk solution and electrospinning to form Ag-TiO2-silk nanofiber. Fig. 6(a)–(d) are SEM images of the electrospun TiO2-silk and 0.1%Ag-TiO2-silk, 1%Ag-TiO2-silk, and 10%Ag-TiO2-silk, respectively. The average fiber diameters of TiO2-silk and Ag-TiO2-silk are around 129 to 194 nm (Tabel 1 and Fig. S3†). In addition, agglomeration of TiO2 and Ag-TiO2 nanoparticles could be observed on the silk fibers, which is also confirmed by EDS mapping images of Ti (blue) and Ag (purple) elements, as shown in Fig. S4.†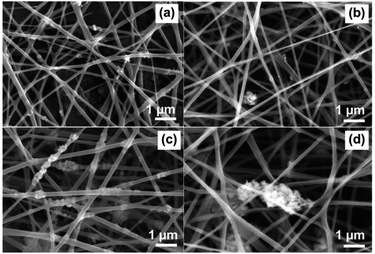 | ||
| Fig. 6 SEM images of (a) TiO2-silk, (b) 0.1%Ag-TiO2-silk, (c) 1%Ag-TiO2-silk, and (d) 10%Ag-TiO2-silk. | ||
The nitrogen adsorption isotherms analysis of silk, TiO2-silk and Ag-TiO2-silk nanofibers was investigated as shown in Fig. S5.† The specific surface areas calculated by the Brunauer–Emmett–Teller (BET) equation are reported in Table 1. Silk nanofiber has a specific surface area of 3.50 m2 g−1, while incorporating with TiO2 and Ag-TiO2 particles appears to increase the surface area (5.34–50.47 m2 g−1). The enhanced surface area could be attributed by the thinner fiber diameter and the deposited particles that increase surface roughness.42 BET results shows that 1%Ag-TiO2-silk has the highest surface area of 50.47 m2 g−1.
| Samples | Average fiber diameter (nm) | Thickness (mm) | Surface area (m2 g−1) |
|---|---|---|---|
| Silk | 200.14 ± 1.73 | 0.70 ± 0.28 | 3.50 |
| TiO2-silk | 165.00 ± 0.76 | 0.72 ± 0.09 | 5.34 |
| 0.1%Ag-TiO2-silk | 129.84 ± 0.55 | 0.84 ± 0.04 | 12.30 |
| 1%Ag-TiO2-silk | 194.18 ± 0.98 | 0.88 ± 0.15 | 50.47 |
| 10%Ag-TiO2-silk | 168.23 ± 1.62 | 0.95 ± 0.19 | 16.63 |
3.4 PM2.5 removal efficiency
PM2.5 removal efficiencies of silk nanofibers as well as the Ag-TiO2 loaded silk nanofibers were measured in a sealed-custom testing box. As shown in Fig. 7 and Table S2,† plain silk nanofiber exhibited PM2.5 removal efficiency of 77.59 ± 0.58%, while incorporation silk nanofiber with TiO2-silk and Ag-TiO2 can enhance the filtration performance to 87.03–99.04%. The highest removal efficiency of 99.04 ± 1.70% was achieved from 1%Ag-TiO2-silk nanofibers, followed by 10%Ag-TiO2-silk, 0.1%Ag-TiO2-silk and TiO2-silk, respectively. These results agree well with the BET and the zeta potential results, showing that 1%Ag-TiO2-silk nanofibers has the highest surface area and the most negative zeta potential which are beneficial for adsorption PM2.5 particles.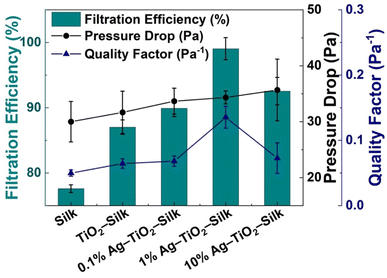 | ||
| Fig. 7 PM2.5 filtration efficiency, pressure drop and quality factor of silk, TiO2-silk, and Ag-TiO2-silk nanofibers at initial 20 min filtration. | ||
The pressure drop (ΔP) or air flow resistance of the filter is another factor affecting filtration performance. In this work, the pressure drop of silk nanofibers was 30.0 ± 3.61 Pa, whereas the pressure drop of Ag-TiO2-silk nanofibers was slightly increased to 35.67 ± 5.51 Pa. It was found that the pressure drop of our silk nanofibers is lower than the electrospun silk based air filters that reported in literatures.14,43 This could be attributed to a lower thickness as well as high porosity of the silk nanofibers. In addition, the quality factor (QF) of the best air filter, 1%Ag-TiO2-silk, was 0.14 for PM2.5 filtration.
Next, to determine reusability of 1%Ag-TiO2-silk, the nanofiber was constantly filtered incense smoke for 10 cycles. The performance of regeneration 1%Ag-TiO2-silk was depicted in Fig. S6.† After five cycles of filtration, the PM2.5 removal efficiency was slightly decreased to 97.03%. After that, the performance was obviously declined and reach 86% at ten cycles. These results demonstrate that 1%Ag-TiO2-silk can be reused up to five times with the optimal filtration performance.
3.5 Photocatalytic properties
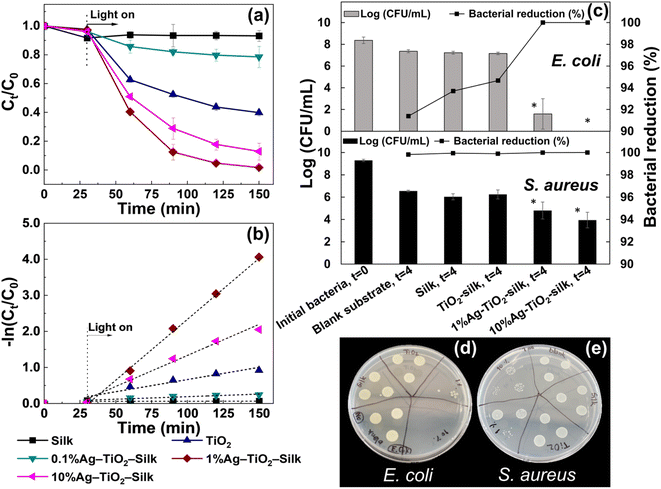
The photocatalytic activities of Ag-TiO2-silk nanofibers were accessed via decomposing of formaldehyde under solar irradiation. Fig. 8(a) and (b) show photocatalytic degradation and degradation rate of formaldehyde. The 1%Ag-TiO2-silk nanofiber exhibited the highest photocatalytic degradation of formaldehyde, as of 98.3% with the maximum degradation rate of 0.034 min−1, followed by 10%Ag-TiO2-silk and 0.1%Ag-TiO2-silk nanofibers as of 87.12% and 21.45%, respectively. The superior photocatalytic performance of 1%Ag-TiO2-silk can be ascribed to the plasmonic resonance effect of AgNPs deposited TiO2, which can improve the photocatalytic performance through extension light absorption to the visible region and depletion electron/hole pairs recombination at the TiO2 interface.44–46 On the other hand, the excessive amount of deposited AgNPs loaded on TiO2 surface could lead to the decreased the photocatalytic efficiency, as excessive AgNPs can cause a lower active sites on the surface of TiO2 or increase charge recombination, resulting in the low photodegradation performance.47,483.6 Antibacterial activity
As shown in Fig. 8(c)–(e), the survival of Gram-positive and -negative bacteria on filter meshes was affected by the coating materials. The results showed that the viable bacteria growing on the silk and TiO2-silk were not significantly different from those growing on the blank substrate, although their antibacterial capabilities were greater than 1-log10 CFU mL−1 against both bacterial strains, corresponding to greater than 90.000%. It could be noted that a decreasing number of viable bacteria on dry surfaces without any treatment was a common phenomenon, and the survival bacteria can persist on the surface for days or weeks before dying completely.49 However, the bacterial killing capacity could be increased by treatment with mesh coating with Ag.Interestingly, this mesh showed a significant decrease in a viable cell count with a concentration-dependent character. The 10%Ag-TiO2-silk demonstrated the most effective performance to inhibit S. aureus with a capability of 99.999%, followed by 1%Ag-TiO2-silk (99.993%). Moreover, the 10%Ag-TiO2-silk could significantly reduce bacterial growth by approximately 2.6-log10 CFU mL−1 reduction when compared with the blank substrate. No survival E. coli were detected after incubation on the silk loaded with 10%Ag-TiO2-silk mesh for 4 h (100% bacterial reduction), whereas the 1%Ag-TiO2-silk mesh showed an antibacterial capability of 99.999%. These results imply that AgNPs could play an important role for antibacterial property of the nanofiber meshes. In addition, Gram-negative bacteria is more susceptible to effects of AgNPs than Gram-positive bacteria. These results agreed well with the previous studies.50,51 This could be explained by the difference in bacterial membrane structure. The thin layer of peptidoglycan in Gram-negative bacteria may have higher permeability for the silver ions passing through the cells.52
Although both TiO2 and AgNPs have been reported to have antibacterial properties, this activity depended on their concentrations.53,54 The effective concentrations of AgNPs to kill Gram-positive and negative bacteria were in a range of 30–200 μg mL−1,53 whereas those of TiO2 were in a range of 10–80 μg mL−1.54 Moreover, the incorporation of Ag on the surface of TiO2 could improve the low antibacterial activity of pure metal oxide in a concentration-dependent manner. Ag-doped TiO2 at a low concentration of 10 μg mL−1, the bacterial viability was greater than 60%, while zero viability could be observed at a high concentration of 80 μg mL−1.55 Altogether, the TiO2-Ag silk composite prepared with 1% and 10% Ag could be considered as functionalized materials for air filtration with antibacterial capability greater than 99.993%.
4. Conclusions
In summary, TiO2(001) facet and Ag-TiO2(001) facet with Ag content of 0.1, 1 and 10 wt% were successfully synthesized. Then silk, TiO2-silk, 0.1%Ag-TiO2-silk, 1%Ag-TiO2-silk, and 10%Ag-TiO2-silk nanofibers have been fabricated using electrospinning method. The 1%Ag-TiO2-silk, that has the largest surface area and negative zeta potential, produced the best properties for PM2.5 (99.04 ± 1.70%), and VOC (98.3%) removal. Moreover, the Ag-TiO2-silk can also function as an antibacterial filter. These results suggested that the Ag-TiO2-silk nanofiber can be potentially utilized as a multifunctional green air filter.Conflicts of interest
There are no conflicts to declare.Acknowledgements
This work was supported by National Research Council of Thailand (NRCT), grant number NRCT5-TRG63005-03. This research was partially supported Thailand Science Research and Innovation (TSRI) Basic Research Fund: Fiscal year 2022 under project number FRB650048/0164. Technical and financial supports from National Nanotechnology Center (NANOTEC), National Science and Technology Development Agency (NSTDA) via project number P2350052 are also appreciated. This work was also supported by King Mongkut’s Institute of Technology Ladkrabang (grant number 2565-02-16-001). The authors would like to thank Prof. Santi Maensiri and Assoc. Prof. Jatuphorn Wootthikanokkhan for their mentorship.References
- H. C. Chuang, T. C. Hsiao, S. H. Wang, S. C. Tsay and N. H. Lin, Aerosol Air Qual. Res., 2016, 16, 2897–2906 CrossRef CAS.
- W. Jinsart, C. Kaewmanee, M. Inoue, K. Hara, S. Hasegawa, K. Karita, K. Tamura and E. Yano, J. Air Waste Manage. Assoc., 2012, 62, 64–71 CrossRef CAS PubMed.
- A. Brunning, Chem. Eng. News, 2019, 7, 25 Search PubMed.
- B. Brunekreef and S. T. Holgate, Lancet, 2002, 360, 1233–1242 CrossRef CAS PubMed.
- M. Kampa and E. Castanas, Environ. Pollut., 2008, 151, 362–367 CrossRef CAS PubMed.
- F. Dominici, R. D. Peng, M. L. Bell, L. Pham, A. McDermott, S. L. Zeger and J. M. Samet, JAMA, J. Am. Med. Assoc., 2006, 295, 1127–1134 CrossRef CAS PubMed.
- J. Lewtas, Mutat. Res., Rev. Mutat. Res., 2007, 636, 95–133 CrossRef CAS PubMed.
- L. Calderon-Garciduenas, W. Reed, R. R. Maronpot, C. Henriquez-Roldan, R. Delgado-Chavez, A. Calderon-Garciduenas, I. Dragustinovis, M. Franco-Lira, M. Aragon-Flores, A. C. Solt, M. Altenburg, R. Torres-Jordon and J. A. Swenberg, Toxicol. Pathol., 2004, 32, 650–658 CrossRef PubMed.
- C. Liu, P. C. Hsu, H. W. Lee, M. Ye, G. Y. Zheng, N. A. Liu, W. Y. Li and Y. Cui, Nat. Commun., 2015, 6, 6205 CrossRef CAS PubMed.
- K. DeFrates, T. Markiewicz, K. Callaway, Y. Xue, J. Stanton, D. Salas-de la Cruz and X. Hu, Int. J. Biol. Macromol., 2017, 104, 919–928 CrossRef CAS PubMed.
- W. A. Abbas, B. S. Shaheen, L. G. Ghanem, I. M. Badawy, M. M. Abodough, S. M. Abdou, S. Zada and N. K. Allam, Langmuir, 2021, 37, 7492–7502 CrossRef CAS PubMed.
- Q. Liu, F. Wang, Z. Gu, Q. Ma and X. Hu, Int. J. Mol. Sci., 2018, 19, 3309 CrossRef PubMed.
- C. Y. Wang, S. Y. Wu, M. Q. Jian, J. R. Xie, L. P. Xu, X. D. Yang, Q. S. Zheng and Y. Y. Zhang, Nano Res., 2016, 9, 2590–2597 CrossRef CAS.
- X. Gao, J. Gou, L. Zhang, S. Duan and C. Li, RSC Adv., 2018, 8, 8181 RSC.
- K. Min, S. Kim and S. Kim, Sci. Rep., 2018, 8, 1–9 Search PubMed.
- X. Chen and S. S. Mao, Chem. Rev., 2007, 107, 2891–2959 CrossRef CAS PubMed.
- K. Nakata and A. Fujishima, J. Photochem. Photobiol., C, 2012, 13, 169–189 CrossRef CAS.
- M. Pelaez, N. T. Nolan, S. C. Pillai, M. K. Seery, P. Falaras, A. G. Kontos, P. S. M. Dunlop, J. W. J. Hamilton, J. A. Byrne, K. O'Shea, M. H. Entezari and D. D. Dionysiou, Appl. Catal., B, 2012, 125, 331–349 CrossRef CAS.
- A. Baysal, H. Saygin and G. S. Ustabasi, Environ. Monit. Assess., 2018, 190(34), 1–15 CAS.
- K. Misawa, Y. Sekine, Y. Kusukubo and K. Sohara, Environ. Technol., 2020, 41, 1266–1274 CrossRef CAS PubMed.
- X. Wu, Z. Chen, G. Q. Lu and L. Wang, Adv. Funct. Mater., 2011, 21, 4167–4172 CrossRef CAS.
- P. Peerakiatkhajohn, J. H. Yun, T. Butburee, W. Nisspa and S. Thaweesak, RSC Adv., 2022, 12, 2652–2661 RSC.
- P. Wang, B. B. Huang, Y. Dai and M. H. Whangbo, Phys. Chem. Chem. Phys., 2012, 14, 9813–9825 RSC.
- X. Wu, Z. Chen, G. Q. Lu and L. Wang, Adv. Funct. Mater., 2011, 21, 4167–4172 CrossRef CAS.
- Z. Wei, L. Rosa, K. Wang, M. Endo, S. Juodkazis, B. Ohtani and E. Kowalska, Appl. Catal., B, 2017, 206, 393–405 CrossRef CAS PubMed.
- C. Phawa, S. Prayoonpokarach, K. Sinthiptharakoon, P. Chakthranont, W. Sangkhun, K. Faungnawakij and T. Butburee, ChemCatChem, 2020, 12, 2116–2124 CrossRef CAS.
- F. Tian, Y. Zhang, J. Zhang and C. Pan, J. Phys. Chem. C, 2012, 116, 7515–7519 CrossRef CAS.
- S. Wanwong, W. Sangkhun and P. Jiamboosri, Polymers, 2023, 15, 722 CrossRef CAS PubMed.
- H. G. Yang, C. H. Sun, S. Z. Qiao, J. Zou, G. Liu, S. C. Smith, H. M. Cheng and G. Q. Lu, Nature, 2008, 453, 638–641 CrossRef CAS PubMed.
- H. G. Yang, G. Liu, S. Z. Qiao, C. H. Sun, Y. G. Jin, S. C. Smith, J. Zou, H. M. Cheng and G. Q. Lu, J. Am. Chem. Soc., 2009, 131, 4078–4083 CrossRef CAS PubMed.
- C. Y. Xu, P. X. Zhang and L. Yan, J. Raman Spectrosc., 2001, 32, 862–865 CrossRef CAS.
- D. Philip, C. Unni, S. A. Aromal and V. K. Vidhu, Spectrochim. Acta, Part A, 2011, 78, 899–904 CrossRef PubMed.
- K. Hedjazi, R. Zhang, R. Cui, N. Liu and B. Chen, Appl. Petrochem. Res., 2016, 6, 89–96 CrossRef CAS.
- V. V. Strykanova, L. B. Gulina, V. P. Tolstoy, E. V. Tolstobrov, D. V. Danilov and I. Skvortsova, ACS Omega, 2020, 5, 15728–15733 CrossRef CAS PubMed.
- G. K. Mor, H. E. Prakasam, O. K. Varghese, K. Shankar and C. A. Grimes, Nano Lett., 2007, 7, 2356–2364 CrossRef CAS PubMed.
- A. Ghobadi, T. G. Ulusoy, R. Garifullin, M. O. Guler and A. K. Okyay, Sci. Rep., 2016, 6, 30587 CrossRef CAS PubMed.
- Y. Zhu, R. Zhu, G. Zhu, M. Wang, Y. Chen, J. Zhu, Y. Xi and H. He, Appl. Surf. Sci., 2018, 433, 458–467 CrossRef CAS.
- F. Azeez, E. Al-Hetlani, Y. Abdelmonem, A. A. Nazeer, M. O. Amin and M. Madkour, Sci. Rep., 2018, 8, 7104 CrossRef PubMed.
- G. Gaidau, A. Petica, M. Ignat, O. Iordache, L. Ditu and M. Ionescu, Open Chem., 2016, 14, 383–392 Search PubMed.
- I. S. Grover, S. Singh and B. Pal, Appl. Surf. Sci., 2013, 280, 366–372 CrossRef CAS.
- J. Matulevicius, L. Kliucininkas, T. Prasauskas, D. Buivydiene and D. Martuzevicius, J. Aerosol Sci., 2016, 92, 27–37 CrossRef CAS.
- H. Matsumoto and A. Tanioka, Membranes, 2011, 1, 249–264 CrossRef CAS PubMed.
- Z. Wang, Y. Cui, Y. Feng, L. Guan, M. Dong, Z. Liu and L. Liu, Chem. Eng. J., 2021, 426, 131947 CrossRef CAS.
- H. Chakhtouna, H. Benzeid, N. Zari, A. E. K. Qaiss and R. Bouhfid, Environ. Sci. Pollut. Res., 2021, 28, 44638–44666 CrossRef CAS PubMed.
- L. Santos, W. A. Machado, M. D. Franca, K. A. Borges, R. M. Paniago, A. O. T. Patrocinio and A. E. H. Machado, RSC Adv., 2015, 125, 103752–103759 RSC.
- L. Gao, W. Gan, S. Xiao, X. Zhan and J. Li, RSC Adv., 2015, 5, 52985–52992 RSC.
- R. H. Katzenberger, A. Rösel and R.-P. Vonberg, BMC Res. Notes, 2021, 14, 97 CrossRef CAS PubMed.
- N. F. Jaafar, A. A. Jalil, S. Triwahyono, J. Efendi, R. R. Mukti, R. Jusoh, N. W. C. Jusoh, A. H. Karim, N. F. M. Salleh and V. Suendo, Appl. Surf. Sci., 2015, 338, 75–84 CrossRef CAS.
- Z. Zhang, Y. Ma, X. Bu, Q. Wu, Z. Hang, Z. Dong and X. Wu, Sci. Rep., 2018, 8, 10532 CrossRef PubMed.
- Z. A. Ali, R. Yahya, S. D. Sekaran and R. Puteh, Adv. Mater. Sci. Eng., 2016, 4102196 Search PubMed.
- M. Vanaja, K. Paulkumar, G. Gnanajobitha, S. Rajeshkumar, C. Malarkodi and G. Annadurai, Int. J. Met., 2014, 692461 Search PubMed.
- A. Abbaszadegan, Y. Ghahramani, A. Gholami, B. Hemmateenejad, S. Dorostkar, M. Nabavizadeh and H. Sharghi, J. Nanomater., 2015, 720654 Search PubMed.
- T. Bruna, F. Maldonado-Bravo, P. Jara and N. Caro, Int. J. Mol. Sci., 2021, 22, 7202, DOI:10.3390/ijms22137202.
- V. Verma, M. Al-Dossari, J. Singh, M. Rawat, M. G. M. Kordy and M. Shaban, Polymers, 2022, 14, 1444 CrossRef CAS PubMed.
- G. Y. Nigussie, G. M. Tesfamariam, B. M. Tegegne, Y. A. Weldemichel, T. W. Gebreab, D. G. Gebrehiwot and G. E. Gebremichel, Int. J. Photoenergy, 2018, 5927485 Search PubMed.
Footnote |
| † Electronic supplementary information (ESI) available. See DOI: https://doi.org/10.1039/d3ra04621d |
| This journal is © The Royal Society of Chemistry 2023 |

