 Open Access Article
Creative Commons Attribution 3.0 Unported Licence
Electrochemical and X-ray structural evidence of multiple molybdenum precursor candidates from a reported non-aqueous electrodeposition of molybdenum disulfide†
Tanner George *,
Christa L. Brosseau
 and
Jason D. Masuda
 *
*
Department of Chemistry, Saint Mary's University, Halifax, Nova Scotia, Canada B3H 3C3. E-mail: Tanner.George@smu.ca; Jason.Masuda@smu.ca
First published on 1st November 2023
Abstract
A published report of electrodeposited molybdenum(IV) disulfide microflowers at 100 °C in the ionic liquid N-methyl-N-propylpiperidinium bis(trifluoromethane)sulfonimide (PP13-TFSI) from 1,4-butanedithiol and the concentrated filtrate from a reaction mixture of molybdenum(VI) trioxide and ethylene glycol could not be reproduced reliably, affording numerous uniquely coloured reaction mixtures that precipitated a variety of crystalline molybdenum coordination complexes. Further attempts to use the same two of these filtrates to electrodeposit molybdenum(IV) disulfide from 0.1 M PP13-TFSI in tetrahydrofuran with 1,4-butanedithiol at room temperature were unsuccessful. Various crude reaction mixtures grew crystals of different identity from eight attempts to synthesize the reported molybdenum-precursor. Single crystal X-ray diffraction (SC-XRD) offered insight into a wide range of structural features from four candidate paramagnetic precursor compounds, including a novel organomolybdenum cluster. Electrochemical studies of the various molybdenum-precursor filtrates, ethylene glycol, and 1,4-butanedithiol were conducted in 0.1 M PP13-TFSI in tetrahydrofuran, offering insight into differences between preparations of the molybdenum-precursor and interference between ethylene glycol and 1,4-butanedithiol on platinum working electrodes. Molybdenum(IV) disulfide electrodeposition attempts included cyclic voltammetry and chronoamperometry on platinum and glassy carbon working electrodes, which led to either no deposited material, or molybdenum, carbon, oxygen, and sulfur containing amorphous and non-homogenous deposits, as indicated by SEM-EDS analysis.
Introduction
Crystalline MoS2, either pure or as a composite involving other materials such as ZnO,2,3 FeS2,4–8 Fe3O4,9 and Au,10,11 has shown promise for an array of diverse applications including use in supercapacitors and transistors,4,12,13 catalyzing the hydrogen evolution reaction (HER) and solar energy harvesting material,1,7,8,14–20 and environmental remediation.3,9 Use of 2D-MoS2 as a substrate for Surface Enhanced Raman Spectroscopy (SERS)2,10,21–23 has recently emerged, offering the potential of widespread detection of important analytes, including pesticides, biomarkers, or drugs, for agricultural, biomedical, and forensic industries.12Molybdenum disulfide has multiple polymorphs (tetragonal (D3d) = 1T, hexagonal (D3h) = 2H, rhombohedral (C53v) = 3R) with conducting (1T) and semiconducting (2H, 3R) properties.14 The semiconducting forms of MoS2 highlight a very important property regarding the morphology of MoS2; monolayers possess a direct band gap despite the bulk material possessing an indirect band gap. This different optical response results in monolayer molybdenum disulfide (2D-MoS2) promoting the Raman scattering of incident radiation through charge transfer to the molecule upon irradiation with an estimated Raman enhancement factor of ∼3 × 10⁵ which is comparable to values reported for silver and gold.14,24,25 Techniques of preparing 2D-MoS2 include chemical vapor deposition,25,26 sonication,27 alkali metal exfoliation,17 and electro-ablation of mechanically deposited bulk MoS2.13 Electrochemical methods can produce thin films of deposited amorphous MoSx (2 < x < 3) which, after annealing under a sulfur or argon atmosphere at 500 or 550 °C, attain the desired crystallinity as MoS2.28,29
Electrochemical deposition of thin films of crystalline MoS2 with controlled thickness, without the need for annealing, is highly desired. Murugesan et al.1 reported the electrodeposition of microflowers of pure MoS2 by chronoamperometric deposition at −2.7 V at 100 °C for 5–10 minutes (highlighting the need for higher temperatures to achieve the reaction) within the ionic liquid N-methyl-N-propylpiperidinium bis(trifluoromethyl)sulfonamide (PP13-TFSI) using precursors, 1,4-butanedithiol for sulfur, and MoO3 + ethylene glycol for molybdenum.1 Underpotential deposition of thin films like that of copper suggest a lower voltage may be needed to produce uniform deposits compared to the 3D microflowers, however, since MoS2 is a metal chalcogenide rather than a pure metal, this may prevent deposition without overpotential.28,30 Other Mo/S sources including ammonium tetra thiomolybdate ((NH4)2MoS4)28,29 and ammonium thiodimolybdate ((NH4)2Mo2S12)31 have led to amorphous thin films upon electroreduction, rather than the desired thin crystalline MoS2. The report by Murugesan et al. was and remains the only reported direct electrodeposition of crystalline MoS2 to our knowledge, which is what led to the attempt to reproduce the methods. Our intention for replicating this work was for a reproducible, reliable morphology control via electrodeposition for preparing the MoS2 without post-treatment. This interest is shared by many fields, including materials technology,4,12,13 and energy generation (solar,20 hydrogen1,7,8,14–19). Our specific initial focus of trace detection of substances using MoS2 as a substrate for SERS led to this current study of the process reported by Murugesan et al.1
The synthesis provided by Murugesan et al. to prepare the MoS2 molybdenum precursor involves refluxing a mixture of MoO3 with ethylene glycol under N2 at 194 °C, and the workup states to simply extract the final brown viscous product. These instructions are not detailed enough to readily replicate the work. Ref. 32 and 33 provided by Murugesan et al. for the reaction of MoO3 and ethylene glycol provide no mention of a reaction between these two materials, and instead focus on the preparation of similar ammonium and alkali metal salts of a dioxo-molybdenum compound with various acids, such as glycolic acid in the case of Cuin et al.32 In the original preparation provided by Murugesan et al., the name “molybdenum glycolate” is given to the molybdenum precursor, despite containing no glycolic acid-based ligands such as what is used in the work by Cuin et al.32 Work by Preiss et al.33 is slightly more related to the procedure that Murugesan et al. report; however, the focus of the work in this reference is preparation of molybdenum carbide (Mo2C). This process, used to form Mo2C, involves heating molybdenum(VI) oxide (or molybdic acid, the hydrated form of MoO3 in this case) within ethylene glycol; although, a temperature of only 60 °C is used and for an unknown duration until “…the odour of ammonia could no longer be detected…” because “(the commercial molybdic acid contains ammonium molybdate)”.33 A valuable point was noted in this work; concentration of samples prior to saccharose addition was possible via heating at ∼130 °C. Concentration with heat under vacuum, followed by filtration, was treated as the means of extracting the sample, with or without use of solvents like tetrahydrofuran or dichloromethane. Multiple reactions resulted in a viscous golden liquid and concentrating the reaction mixture caused the crystallization of MoO2(OC2H4OH)2. This gave insight into an earlier literature synthesis2 and crystal structure34 related to this preparation which heats the crude MoO3 + ethylene glycol mixture to 150 °C to produce MoO2(OC2H4OH)2. A golden viscous liquid or colourless crystal was not used in the report of electrodeposition of MoS2 by Murugesan et al. and attempts to replicate their electrochemical synthesis of MoS2 were not successful, so additional syntheses were undertaken to better understand this complex reagent.
Understanding the identity of this molybdenum-precursor is necessary for understanding the irreproducible electrodeposition of crystalline MoS2, and the following work sheds light on the complex identity of the molybdenum compounds that form when molybdenum(VI) trioxide is heated in ethylene glycol and explores some of the electrochemistry of these reaction mixtures within an ionic liquid electrolyte (0.1 M PP13-TFSI ionic liquid in tetrahydrofuran (THF)). The three primary reasons for abandoning the pure ionic liquid solvent were that (i) the ethylene glycol solutions of the molybdenum precursor did not readily dissolve into the ionic liquid on the scales used without significant manual mixing (ii) the pure ionic liquid is relatively expensive, and to conserve the material, use as an electrolyte would be ideal over use as a solvent (iii) at higher temperatures, precipitation occurred when mixing the molybdenum precursor, the ionic liquid, and the dithiol.
The purpose of these initial studies can be broken down into three aspects highlighting the need for optimization and further understanding of this specific electrochemical deposition of MoS2; (i) to explore the identity of the poorly characterized yet necessary molybdenum-precursor via single crystal X-ray diffraction (SC-XRD), (ii) to characterize some electrochemical properties of the molybdenum-based precursors, 1,4-butanedithiol, ethylene glycol, and mixtures of these reagents on platinum or glassy carbon working electrodes in 0.1 M PP13-TFSI in THF along with the electrochemical window of this supporting electrolyte, and to (iii) attempt to electrochemically produce MoS2 from either pure PP13-TFSI following the work by Murugesan et al., or in a solution containing 0.1 M PP13-TFSI in THF using 1,4-butanedithiol as the sulfur source reaction mixtures of MoO3 and ethylene glycol as the source of molybdenum.
Experimental
Solvents, reagents, and materials
Nitrogen (gas (99.999%) and liquid) was supplied by Air Liquide Canada Inc. (Montreal, QC, Canada). Ethanol (95% and absolute) was purchased from Commercial Alcohols (Boucherville, QC, Canada). Toluene (99.9%), acetone (99.7%), THF (HPLC grade, anhydrous), hexanes (98.5%), dichloromethane (99.9%), and chloroform (99.8%) were purchased from Fisher Chemical or Fisher Scientific (Pittsburgh, PA, USA). Anhydrous magnesium sulfate and acetonitrile were purchased from Caledon Laboratories Ltd (Armstrong Ave, Georgetown, ON, Canada). Nitric acid (69.0–70.0%) was purchased from J.T. Baker (Phillipsburg, NJ, USA) and sulfuric acid (95.0–98.0%) was from BDH. CDCl3 (99.8%, 0.05% v/v tetramethyl silane) was purchased from Cambridge Isotope Laboratories Inc. (Tewksbury, MA, USA). Ethylene glycol (≥99%), molybdenum trioxide (99.99%), 1,4-butanedithiol (97%), N-methylpiperidine (99%), 1-bromopropane (99%), 4 Å molecular sieves, pentane (99.9%), and calcined diatomaceous earth were all purchased from MilliporeSigma (Burlington, MA, USA). Activated alumina (80–200 mesh) used for drying and filtering solvents was purchased from Thomas Scientific (Swedesboro, NJ, USA). Heating was performed using a DrySyn aluminum heating block with 50–1000 mL flasks including PTFE-sealed reaction vessels, round bottom flasks, and Schlenk flasks. Potassium hydride was purchased as a 30% mineral oil dispersion from MilliporeSigma and, within a glovebox (due to pyrophoric hazards), was washed four times with pentane then dried in vacuo to give a free-flowing powder. Alumina, calcined diatomaceous earth, and molecular sieves were pre-dried in a 140 °C oven for a minimum of one week before being dried at 300 °C in vacuo in a half-filled round-bottom flask covered in aluminum foil within an aluminum block. Solvents (toluene, pentane, THF) were purified using an Innovative Technology solvent purification system. Solvents (pentane, toluene, THF, hexanes, benzene (99.8%)) were then dried using KH for 24–78 hours and subsequently filtered through dry alumina and stored over 4 Å molecular sieves (∼1/10th the volume of solvents). The KH contaminated alumina was mixed thoroughly, allowed to dry in the glovebox until free flowing, and was then removed from the glovebox and allowed to slowly decompose in a large stainless-steel bowl over several days with water being very gradually added after a day and mixed to allow for all KH to decompose gradually and safely before disposal in solid waste.Equipment, instruments and analytical methods
The glassy carbon working electrode was cleaned by polishing with 5 μm alumina on a wet polishing pad, rinsing with water followed by acetone, and finally drying in a vacuum desiccator overnight. Ceramic screen-printed electrodes (SPE, Pt WE) were cleaned by immersion in concentrated sulfuric acid for ∼20 minutes, rinsing with ultrapure water, immersion in 10–20% HNO3 for ∼20 min, and rinsing again with ultrapure water. This was followed by immersion in a 20 mL scintillation vial in 0.5 M H2SO4 made up with ultrapure water. In all investigations the counter electrode was Pt (either wire or as part of the SPE) and the reference was an Ag/AgCl electrode for aqueous studies, while for non-aqueous studies an Ag/Ag+ RE was used. For aqueous and non-aqueous electrochemical studies, reported potentials are versus Ag/AgCl or Ag/Ag+, respectively, unless otherwise noted. The working electrode was cycled in 0.5 M H2SO4 from −0.2 V to +1.0 V at a rate of 250–300 mV s−1 until a cyclic voltammogram consistent with clean platinum was obtained (Fig. S12†). In this work, five different Pt SPEs were used for efficient experimentation. As presented in Fig. S12† each of the five Pt SPE's used have slightly varying electrochemically active surface areas but are consistent with literature.63 Pt SPE#5 has the lowest area, followed by Pt SPE #1, and Pt SPE #2–4 have relatively similar electrochemically active surface areas.
Synthesis of molybdenum-based precursors
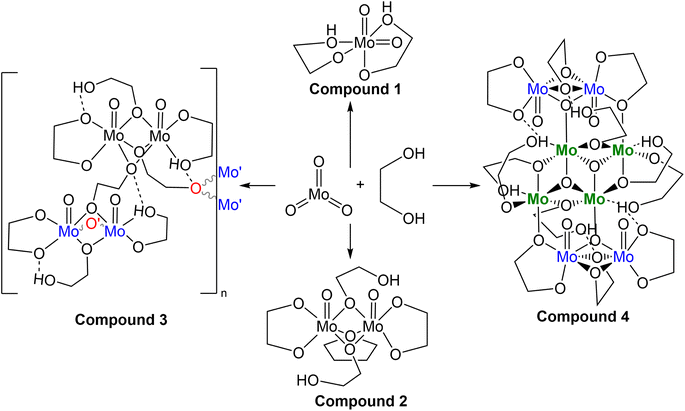
While many reproducibility issues were encountered preparing this precursor, the three most relevant solutions which were used as the molybdenum source are shown in Fig. 1, and details of syntheses for these three precursor solutions follow, with additional preparations relevant to this work included in the ESI.† Based on SC-XRD analysis, compounds 1 (MoO2(OC2H4OH)2), 3 (Mo4O20C16H36), and 4 (Mo8O32C24H54·2(C2H4(OH)2)) crystallized from the gold coloured (B3a), golden-brown coloured (B5a), and brown coloured (B6a) reaction mixtures, respectively. Details relating to reaction mixture numbering/naming are included as shown below in Tables 1, S1 and S2.† Details of the three precursor syntheses relevant to later electrochemical experiments are as follows:| Rxn. | Liquid (B#x) | Crystal (C#x) | Solid (D#x) |
|---|---|---|---|
| A1 | B1a gold viscous liquid | C1a – compound 1 | N/A |
| A2 | B2a green viscous liquid (THF) | C2a – compound 2, C2b – compound 1 | D2a – dried compound 2 |
| A3 | B3a gold viscous liquid* | C3a – compound 1, C3b – compound 5 | N/A |
| A4 | B4a blue liquid | C4a – compound 6 | D4a black solid, D4b blue solid (B4a dried) |
| A5 | B5a golden-brown viscous liquid* | C5a – compound 3 | D5a, D5b |
| B5b golden-brown viscous liquid | |||
| A6 | B6a brown viscous liquid* | C6a – compound 4 | D6a |
| A7 | B7a gold viscous liquid | N/A | N/A |
| A8 | B8a gold viscous liquid | N/A | D8a blue solid (B8b dried) |
| B8b blue liquid |
![[thin space (1/6-em)]](https://www.rsc.org/images/entities/char_2009.gif) :
:![[thin space (1/6-em)]](https://www.rsc.org/images/entities/char_2009.gif) O ratio of 1
O ratio of 1![[thin space (1/6-em)]](https://www.rsc.org/images/entities/char_2009.gif) :
:![[thin space (1/6-em)]](https://www.rsc.org/images/entities/char_2009.gif) 2.8. The combined THF washings were discarded. In 3.5 months at room temperature in a sealed 20 mL scintillation vial in the glovebox, red crystals (C6a) formed from B6a. The bulk solution was decanted, and the crystals were left to sit in ∼1 mL of the crystallization solution since rinsing with ethereal solvents was thought to potentially dissolve or alter the small amount of material. Analysis of a single red crystal by SC-XRD revealed the structure Mo8O32C24H54·2(C2H4(OH)2).
2.8. The combined THF washings were discarded. In 3.5 months at room temperature in a sealed 20 mL scintillation vial in the glovebox, red crystals (C6a) formed from B6a. The bulk solution was decanted, and the crystals were left to sit in ∼1 mL of the crystallization solution since rinsing with ethereal solvents was thought to potentially dissolve or alter the small amount of material. Analysis of a single red crystal by SC-XRD revealed the structure Mo8O32C24H54·2(C2H4(OH)2).Results and discussion
Synthesis and characterization – ionic liquid preparation
To prepare the ionic liquid solvent PP13-TFSI, Li-TFSI was used as the anion [TFSI−] precursor while the cation [PP13+] precursor PP13-Br was prepared synthetically from N-methyl piperidine and 1-bromopropane via a modified literature procedure detailed in the ESI (Scheme S1†).45The cation precursors were heated to 70 °C in acetonitrile for 24 hours with PP13-Br precipitating out as a white solid in the golden liquid upon cooling. Combining PP13-Br and Li-TFSI rapidly as aqueous solutions causes precipitation of a dense (>1 g mL−1), slightly viscous colourless liquid within an hour of mixing. Extraction with dichloromethane, washing with ultrapure water a minimum of 3 times, and drying in vacuo with heat resulted in the PP13-TFSI ionic liquid used for electrochemical experiments.1 Nuclear magnetic resonance spectra (1H, 13C, 19F) of the PP13-Br, PP13-TFSI, and the 1,4-butanedithiol can be found in the ESI (Fig. S1–S8).†
Synthesis, characterization, and discussion – molybdenum-based precursors
Multiple molybdenum-based precursors were made from MoO3 and ethylene glycol following a modified literature preparation1 that involved heating the mixture to 194 °C for 1 hour under N2 gas flow. Potential deviation from this literature report was in the process of extraction of the final product, as little information was provided to do so: “brown colour viscous final product was extracted after the reaction.”1 Generally when preparing the molybdenum-precursor, concentration via vacuum distillation between 110 and 130 °C to remove excess ethylene glycol and subsequent filtration through diatomaceous earth to remove insoluble material, with or without added solvents, constitute the primary means of extraction within this work. No attempt was made to utilize the un-altered solution post-heating without modification due to the use of the term “extracted”, which may be what is required for successful electrodeposition under conditions described later in this report. Detailed reaction conditions are outlined in Tables S1 and S2† and in the experimental section. Eight different syntheses of this molybdenum-precursor were attempted (A(1–8), A = molybdenum-precursor reaction, #1–8 = chronological order of reaction), with varied reaction conditions and work up affording three types of products (liquid, crystalline, and amorphous solid) which are listed in Table 1. For discussion, B = liquid samples of crude reaction mixtures that have been concentrated and filtered through diatomaceous earth, with or without alternate solvents for extraction. C = Crystalline samples which have grown from liquid samples. D = fine amorphous solids. These products gave insight into the complex nature of this reaction and the sensitivity of the coordination complexes from the reaction between MoO3 and ethylene glycol at high temperatures.The visual progression during these eight syntheses evolves from mint-green powder (MoO3) in colourless liquid (ethylene glycol), and upon heating, dissolution begins through a brief vivid turquoise colour change into a golden green hued solution, maintaining a completely transparent, solid-free lighter golden colour if kept below 150 °C (A8) and darkening if heat is increased to 194 °C. The darker golden-green solution occurs with trace black precipitate for A (1–3, 7), and significant amounts for A (4–6) and heating the mixture to 215 °C formed primarily black precipitate for A4. Gold (B1a, 3a, 7a, 8a), green (B2a), golden-brown (B5a, B5b) and brown viscous liquids (B6a) upon in vacuo concentration and filtration through diatomaceous earth either neat or dissolved in dichloromethane or THF. The fourth reaction was heated beyond 194 °C, affording a hard black solid rather than a viscous liquid upon concentrating in vacuo.
Naming of samples follows the form: sample type-reaction number-product, so the sample B-3-a refers to the viscous liquid sample (B) from reaction A3 and it is the major liquid product (a), while C2a and C2b refer to the major and minor crystalline products of A2 isolated from crystallization of the bulk solution (C2a), or from evaporating the water washings from the glassware after reaction (C2b), respectively.
The first, second, and third reaction mixtures A1, A2, and A3 crystallized a known molecular species, compound 1 MoO2(OC2H4OH)2 (Fig. 2), from an ethylene glycol and dichloromethane solution (C1a), ethylene glycol and water (C2b), ethylene glycol and PP13-TFSI (C1c), pure ethylene glycol (C3a), and a mix of acetonitrile and ethylene glycol (C3b). Isolating compound 1 from various mixtures and solvent systems offered insight into the original 1973 preparation46 and the 1975 X-ray crystallography study34 of this monometallic structure and the relevance of this chemical species within the MoO3 + ethylene glycol reaction. A diagram illustrating the hydrogen bonding in the asymmetric unit is shown in Fig. S9.† All crystalline products isolated via attempting this precursor synthesis are detailed in Scheme 1.
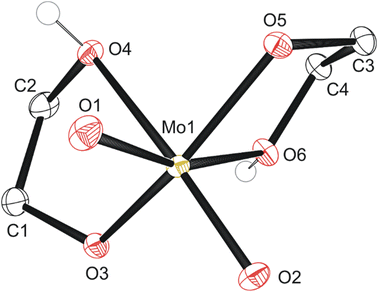 | ||
| Fig. 2 Molecular structure of compound 1 with anisotropic displacement ellipsoids projected at the 50% probability level. Hydrogen atoms have been omitted for clarity except for OH groups. | ||
Isolation of compound 1 provided insight into workup of the MoO3 + ethylene glycol reaction as work in the 1970's focused on the preparation via similar means.34,46 The seventh reaction which replicated this alternate literature preparation by heating to 150 °C open to air followed by concentration in vacuo and addition of ethanol produced a dark blue solution rather than the expected colourless compound 1. This blue colour is thought to be due to residual water in the absolute ethanol used since hydrolysis of crude reaction mixtures, the pure MoO2(OC2H4OH) crystals, and the black solid D4a all afforded equally rich blue solutions in water. A series of freezing (−18 °C) and thawing (20–25 °C) cycles every few days over the course of a few weeks enabled isolation of a single tiny blue crystal (C4a – compound 6) that indicate [M]n[Mo12O40X]n− structure by SC-XRD (X = heteroatom such as Cl, S, P, Si based on electron density where n = 1, 2, 3, 4 for each respectively). The cations and water positions cannot confidently be determined but are suspected to be common group 1–2 ions in tap water such as [Na]+ based on abundance and matching electron density at some sites. Poor data gave uncertainty regarding co-crystallized species such as the central heteroatom, cations, or water molecules; however, the general Mo12O40 structure is apparent by SC-XRD (Fig. S10†). Any reaction mixture or sample which encountered water and air for prolonged periods of time turned blue upon hydrolysis. This decomposition via exposure to air and moisture highlights the instability of the proposed molybdenum-precursor that was noted by Murugesan et al.1 An additional unexpected crystalline material was obtained (compound 5) through quenching an electrodeposition solution containing 1.5 mL 0.1 M PP13-TFSI in THF with 0.05 mL 1,4-butanedithiol and 0.05 mL B3a (details below). Addition of 0.5 mL 5% bleach afforded a biphasic solution with a blue bottom (thought to be aqueous) and colourless top layer (thought to be organic), along with the formation of a single ∼10–30 mg golden yellow prisms at the interface. Analysis by SC-XRD indicated the decomposition of the ionic liquid via anion exchange, forming [PP13]2[Mo6O19], compound 5 (Fig. S11†). Following the identification of compound 1 from this precursor reaction, work up of concentrated reaction mixtures with THF (A2, A5) revealed unexpected insights into the complexity regarding the reaction of MoO3 with ethylene glycol via SC-XRD analysis.
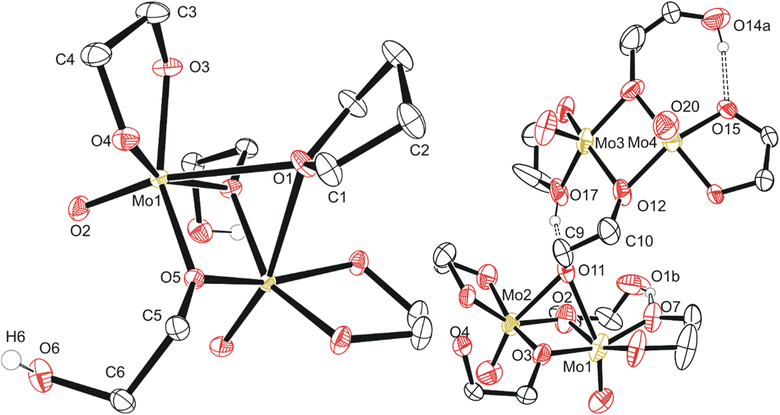
The second reaction again resulted in a golden viscous liquid upon concentration in vacuo of the crude reaction mixture, though extraction with dichloromethane, drying in vacuo again and extracting once more with THF afforded a viscous green solution upon concentration. Yellow crystals of compound 2 ((MoO(OC2H4O)(μ-OC2H4OH))2(μ-OC2H4)), identified by SC-XRD (Fig. 3), formed in the green viscous liquid, and, upon isolation and drying, the crystals became opaque. Elemental analysis of this material was inaccurate regarding the expected C/H% (∼1% above C, ∼2% below H) for the formula derived from SC-XRD. This synthesis was the first insight into dimerization, a process crucial for further clustering observed in reaction mixtures closer in colour to brown (A5 and A6).
Based on a Cambridge Structural Database (CSD, version 5.42 (September 2021)) search, compound 2 is the first report of crystalline molybdenum dimers with each molybdenum bound to a single oxo group (2−), an ethylene glycoxide ligand (2−), and a bridging ethylene hydroxy glycoxide (1−), although similar dimers with different ligands exist with similar bridging of the two Mo atoms by oxygen-based ligands.47–60 Related molybdenum dimers have had their structure reported in the CSD, specifically with each Mo atom in the dimer containing a non-bridging single oxo ligand and a bidentate O–C–C–O structured ligand. One similar non-anionic dimer features a structurally similar bidentate mono-deprotonated tetramethyl ethylene glycol and two bridging methoxide ligands; however, this dimer is a cis-dioxo rather than mono-oxo molybdenum compound like compounds 2 and 3, which is also unique in having an additional bridging THF ligand.47 Other similar dimeric examples often contain ammonium,48 phosphonium,49 alkali,49 or alkaline earth50,51 cations, co-crystallized solvents like water,51,52 ethanol,53 methanol,54 toluene55 or benzene.56 Coordinating solvents like water,51 ethanol,53 or pyridine48 along with bridging oxo,48 alkoxide,54,56 phosphate,57 hydroxide,58 oxalato,48 citrato,59 or dioxomolybdenum60 groups either between the Mo dimer atoms or bridging pairs of dimers has also observed. This is like the crystal structure observed for the polymeric compound 3, C5b (Fig. 3). Understanding the structure of small molybdenum clusters that are candidates for electrodeposition is crucial, and this literature and work highlights many unique coordination states surrounding molybdenum with respect to small multidentate oxygen-based ligands. The chemical structure of any given metal precursor could vary in number of metal atoms, oxidation states, geometry, ligands, and more – all are crucial aspects of a reagent for understanding and elucidating valid chemical mechanisms for the electrodeposition processes of these critical materials such as MoS2.
The polymeric structure of compound 3 (C5a) exhibits two unique bridging interactions with ethylene glycoxide ligands, bridging the molybdenum dimer atoms either parallel O11–(Mo1–Mo2) or perpendicular O12–(Mo3–Mo4) to the molybdenum/oxo double bond (Fig. 3). An oxalic acid bimetallic Mo-coordination complexes was observed to undergo polymerization through an oxalic acid bridging ligand; however, the presence of bridging oxo (O2−) ligands may prevent further polymerization as the oxo bridging ligand tends to directly bridge the molybdenum atoms with no spacer like the C2 backbone of ethylene glycoxides or oxalates resulting in increasingly larger clusters, rather than polymer comprised of the dimer units.48,61,62 An additional example of an oxalate polymer exists with R–MoO2–R bridging units (R = Mo dimer, (MoO(oxalato)(μ-oxo))2) and cations; however, for this polymeric structure, the bridging MoO2 unit is not directly involved in bridging the two Mo atoms in each dimer that was also observed for a phosphate bridged dimer.57,60 This is not like what is observed for compound 3 with ligands involved in the polymerization coordinating through both molybdenum atoms of the dimer (Fig. 3) rather than from one molybdenum atom to the second in another dimer molecule.
Compound 4, C6a (Fig. 4) exists as a cluster showing the octameric eight molybdenum atoms consisting of a distinctly different core of four with two Mo(V) dimers like 2 and 3 on each side of the core. Each dimer is equivalent across a symmetry element, and the dimers are held together by a μ-oxo ligand and one of the two oxygen atoms of the bidentate ethylene glycoxide that attaches the dimer to the tetrameric central core. Each dimer also has a bridging ethylene glycoxide ligand bound directly to both molybdenum atoms. The central tetrameric core with Mo 3/4 has two distinct molybdenum environments as well, forming a diamond shape. Mo3 and symmetry equivalent Mo3i exists with three μ3-oxo ligands, a neutral monodentate ethylene glycol hydroxy ligand, and two μ-ethylene glycoxide ligands.
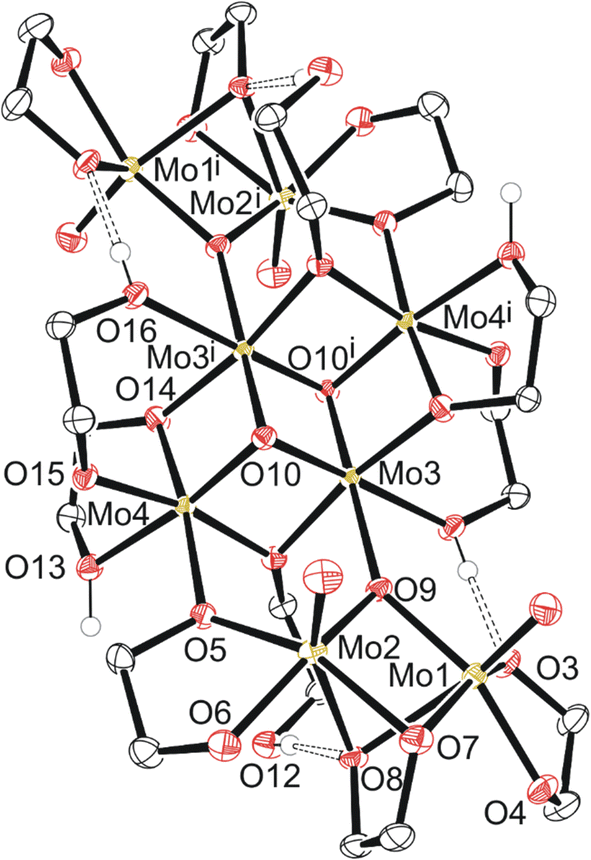 | ||
| Fig. 4 Molecular structure of compound 4 with anisotropic displacement ellipsoids projected at the 50% probability level. Methylene CH2 hydrogen atoms have been omitted for clarity. | ||
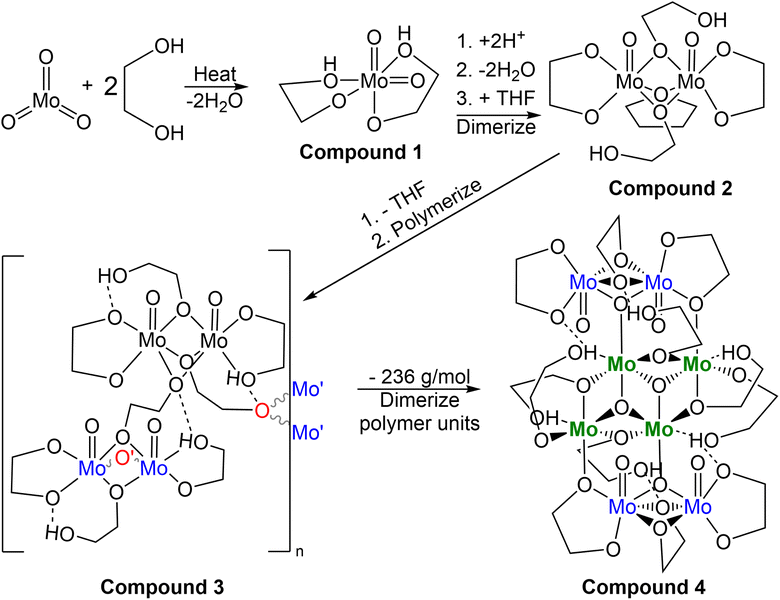
From Table S3,† the masses of 1–4 are ∼250, 538, 932, and 1766 g mol−1, respectively. Assuming 1 turns into 2, then 3, and finally 4, one pathway (Scheme 2) regarding conservation of mass would be for two molecules of 1 (2 × 250 g mol−1) to be protonated (+2 × 1 g mol−1) followed by loss of 2H2O (−2 × 18 g mol−1) while gaining the THF unit (+72 g mol−1) to equal 538 g mol−1 as 2. Subsequent loss of THF (466 g mol−1) and polymerization through ethylene glycol fragments affords 3 with discreet dimers with a mass equal to twice that of 2, ∼932 g mol−1. The final conversion from two molecules of 3 into 4 requires a shift from 932 + 932 = 1864 g mol−1 (2 × 3) into 1628 g mol−1 (excluding 2× ethylene glycol solvent molecules of 4). This is a net loss of 236 g mol−1 comprised of 8 oxygen, 8 carbon, and 18 hydrogen atoms. The central cluster contains 2 oxo groups to 4 molybdenum, implying loss of 4 oxygen atoms through loss of oxo groups between a pair of dimers is necessary for creation of the central tetrameric core of 4.
This conversion could be mediated by protonation from hydroxy groups from solvent ethylene glycol, entirely hydrogen-bound ethylene glycol molecules such as that observed in the crystal structure of 4, or through the singly deprotonated ethylene glycol mono- or bidentate ligand (2-hydroxyethyl-1-oxo) commonly observed hydrogen bonding intramolecularly such as in the crystal structures of 1 and 2 monodentate ligand (Table S4†). The complexity of this final conversion if this is the route towards formation of 4, is too great for any degree of certainty for its formation.
Based on the formula of the Mo1–Mo2 dimer, a doubly bridging bidentate ethylene glycoxide ligand is possible, meaning singly bridging mono-deprotonated ethylene glycol ligands observed in crystal structures of 2–4 could participate in proton transfer. This could result in a variety of observed intramolecular motifs such as the bidentate non-bridging ethylene glycoxide oxygen atoms and oxo groups.
The protic nature of the solvent and ligands allows for the coupling of molybdenum clusters via protonation of the bridging glycoxide, dissociation or rearrangement of the newly formed hydroxy group, insertion of the newly formed ethoxide ligand, with the intermediate cationic dimer. The presence of a bridging oxo group between molybdenum atoms of the dimer and the central tetramer of compound 4 could be the result of hydrolysis of the C–O bond of a bridging ethylene glycoxide unit, forming a bridging hydroxy group OH. If this bridging hydroxy group were to encounter a Mo–OH, loss of water and formation of the observed triply bridging oxo groups partially bonding the central tetramer with the outer dimers. Much of this is speculative; however, possible steps are presented by which interconversion from the monomeric MoO2(OC2H4OH) to larger clusters observed in this work may occur. The opposite may be true as well, with incomplete dissolution resulting in the clusters undergoing reduction and extensive hydrolysis, loss of water, and formation of ethylene glycol units. Additional crystallographic information is included in the supplemental information (Tables S3–S5†).
Electrochemistry
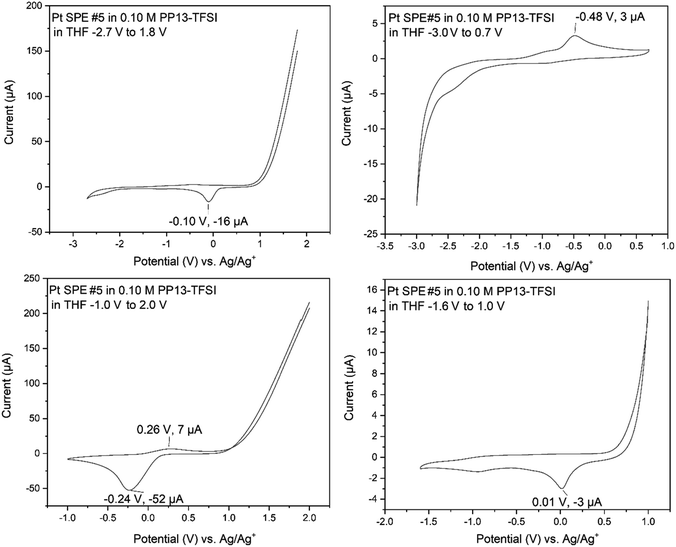
Electrochemical studies began with analysis of the relevant precursors (1,4-butanedithiol, ethylene glycol, B3a, and B6a) using a supporting electrolyte solution comprised of 0.1 M PP13-TFSI in THF. Various electrochemical techniques were employed for characterization and electrodeposition including cyclic voltammetry (CV), chronoamperometry (CA), and bulk electrolysis (BE) in either 0.1 M PP13-TFSI in THF or in the pure PP13-TFSI ionic liquid (heated to ∼100 °C to facilitate mixing).Initial exploration of the full electrochemical window of PP13-TFSI in THF on Pt (Fig. 5) highlighted oxidation above +0.5 V with subsequent reduction occurring between −0.25 V and 0 V on the cathodic scan. The first window scanned was −2.7 V to +1.8 V, resulting in significant oxidation occurring above +1.0 V and a reduction event at −0.1 V with very little further activity. When the window was reduced to −1.0 V to +2.0 V, a significant oxidation above +1.0 V was observed with a broad reduction beginning at ∼+0.2 V, peaking at −0.24 V. Changing the window to −1.6 V to +1.0 V results in a similar oxidation behavior occurring at ∼+0.5 V. The cathodic region for this electrolyte is large, with little current registered to nearly −2.7 V. When the window of −3.0 V to +0.7 V was explored, reduction occurring from −2.0 V to −3.0 V resulted in an oxidation event on the following anodic scan at −0.48 V. This work indicates that this ionic liquid is effective for depositions at the negative voltages proposed by Murugesan et al.;1 however, positive voltages above +0.5 V result in oxidation and should thus be avoided.
On a glassy carbon WE with a platinum wire CE and an Ag/Ag+ RE (0.1 M PP13-TFSI in THF), the electrochemical window (Fig. S14†) was stable between −1.25 V and +0.50 V. Reduction was observed beginning at ∼−1.6 V; however, a relatively stable electrochemical window between −2.0 V and +0.5 V was also observed. Altering the electrochemical window to −2.7 V to +0.5 V resulted in a broad reduction with two main features at roughly −2.2 and −2.7 V, respectively, causing a broad irreversible oxidation signal spanning −1.75 to −0.5 V with a peak of unknown origin at −0.9 V. The current observed in the CV of the electrolyte solution between −3.0 to 0.7 V is significantly less than is observed when analytes are included within the solution showing support that it is an ideal solution for −2.7 V necessary to produce MoS2 according to Murugesan et al.1 Following the characterization of the electrochemical window of the 0.10 M PP13-TFSI in THF, 1.5 mL of this solution had 0.05 mL of various reagents present during MoS2 electrodeposition attempts as detailed later. The reagents studied include ethylene glycol, 1,4-butanedithiol, a mixture of ethylene glycol and 1,4-butanedithiol, and molybdenum-based precursors (B3a, B6a) respectively.
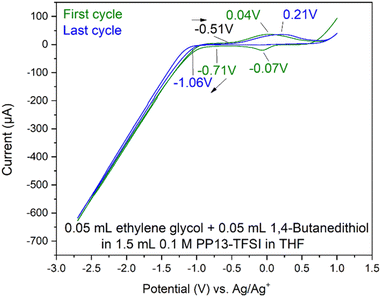
Adsorption onto the platinum surface upon cathodic reduction may occur below roughly −1.2 V, registering current that rapidly dissipates with a maximum current at roughly −2.5 V, decreasing towards −2.7 V. Beginning the anodic scan from −2.7 V to +1.0 V also occurs with a sharp increase in current. This indicates adsorption of the material to the electrode surface, and desorption is observed above roughly −0.8 V. Support is provided by SEM-EDS analysis of the electrode surface following the desorption process, where the surface is free of sulfur (Fig. S16†), while it otherwise shows sulfur and carbon by SEM-EDS if the CV finished at −2.7 V. This characterization indicates that the 1,4-butanedithiol is electrochemically active within PP13-TFSI in THF and is undergoing an electron transfer process below −1.2 V, and above −0.8 V upon the following anodic scan.
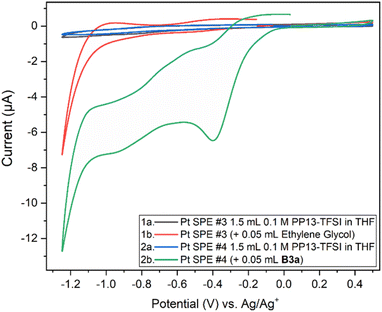
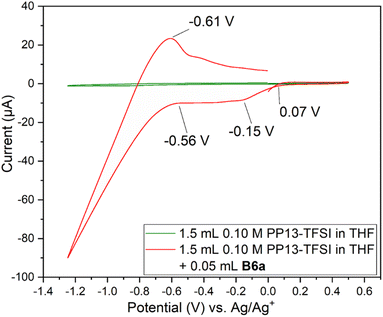
Two Pt SPE (#3 and #4) with similar electrochemically active surface areas (Fig. S12,† total current (and thus adsorbed hydrogen and relevant electrochemical surface area) are similar in 0.5 M H2SO4)64 were used for this study. Initial cycling from −1.25 V to +0.5 V in the blank electrolyte solution resulted in a clean voltammogram (Fig. 7). Subsequent addition of each species and repeat scanning at 10 mV s−1 from OCP to +0.5 V, down to −1.25 V and back to the original OCP voltage gave rise to a significant difference. The choice to scan from OCP was to avoid initial oxidation or reduction which could occur otherwise. Ethylene glycol alone maintained the same double layer current as the blank solution until roughly −0.7 V during the cathodic scan, with reduction beginning around −1.0 V. The B3a in contrast experienced an increase in the current beginning at about 0 V, with a peak at −0.4 V. An additional increase in current is observed beginning at −0.7 V with another increase below −1.1 V. The current registered with B3a is greater than that of ethylene glycol; however, the initial blank solution for each system was similar. Upon anodic scanning from −1.25 to +1.0 V, B3a gave had an increase in current between −1.25 and −1.1 V, with a very broad increase between −0.8 and −0.4 V. Though a different scan rate was used when analyzing the brown viscous liquid B6a, it is clear that B3a and B6a have very different electrochemical features upon cycling once from −1.25 V to +0.5 V (Fig. 8). The golden B3a displays reduction events at ∼−0.4 V and ∼−0.6 V, beginning with a resistive increase in current at ∼−1.0 V (Fig. 7). In contrast, the brown viscous liquid B6a has no reductive event at ∼−0.4 V which is the major distinguishing feature of the CV containing B3a. Unlike ethylene glycol or B3a, B6a is observed to begin a cathodic reduction beginning at ∼−0.6 V which does match a reduction event of B3a; however, there exists no analogous plateau in current like that observed for B3a prior to the resistive increase in current below −1.0 V observed for both pure ethylene glycol and B3a. A unique observation within the B6a sample is a broad oxidation event occurring at ∼−0.6 V during the anodic scan.
Analysis by SEM-EDS indicated the presence of molybdenum, confirming that the brown viscous liquid B6a does deposit onto the platinum working electrode following a single scan from 0 V to +0.5 V to −1.25 V and back to 0 V (Fig. S20†).
These ethylene glycol/glycoxide molybdenum compounds are amphoteric (potentially acidic and basic) and as such there exist many possible mechanistic routes to the simpler binary compound MoS2. This substantial chemical conversion from the suspected initially formed precursor candidate MoO2(C2H5O2) to MoS2 is likely to involve a combination of reductive elimination, protonation, deprotonation, loss of ethylene glycol/glycoxide ligands, loss of water (through –oxo group double protonation), and eventual coordination of thiol/thiolate ligands with subsequent breaking of S–C bonds, losing the 1,4-dibutyl fragment.
The ionic liquid was mixed with the molybdenum-precursor prior to heating in a low volume 3 electrode cell within a sand bath on a hotplate. Homogeneity of the mixture was not observed until ∼50 °C. Addition of 1,4-butanedithiol was done at ∼75 °C, which resulted in an immediate dark black precipitate forming which was not mentioned in the work by Murugesan et al.1 Prior to immersion of the electrodes, the majority of the solid was scraped from the solution surface and removed; however, this may be what resulted in crystalline MoS2 shown by Murugesan et al. The electrode was immersed at ∼80 °C, and upon reaching 100 °C, chronoamperometric deposition at −2.7 V for 600 seconds was conducted.
Following this electrodeposition, the electrode was rinsed with THF and stored in a desiccator. SEM analysis of the electrode revealed abundant debris, including fragmented material with sharp edges and sparse globular material. Analysis by SEM-EDS revealed the sharp material contains aluminum, indicating residual alumina from polishing. Analysis of the globular material revealed a signal for sulfur; however, in both instances signal intensity was mostly carbon (Fig. S19†). The crystalline MoS2 nanoflowers reported by Murugesan et al. could not be reproduced. Because of the substantial difficultly in combining these thick liquids, the desire to avoid heating 1,4-butanedithiol near its boiling point, the formation of the unexpected precipitate, and the desire to produce MoS2 under more ideal working conditions while using minimal costly ionic liquid, experiments were mostly conducted using a solution approach at room temperature.
When mixing the gold B3a (0.05 mL) with 0.1 M PP13-TFSI (1.5 mL), a pale-yellow solution colour was observed due to dilution. As a compatibility test, addition of 0.05 mL 1,4-butanedithiol to this solution caused a colour change to orange, then to red over the course of 30 minutes, with a red precipitate settling out over the course of a week. The clarified red liquid was then used for deposition onto the Pt WE via first applying −2.7 V for 600 seconds, followed by a single scan from −0.75 V to −2.7 V at a scan rate of 50 mV s−1 (Fig. S21†).
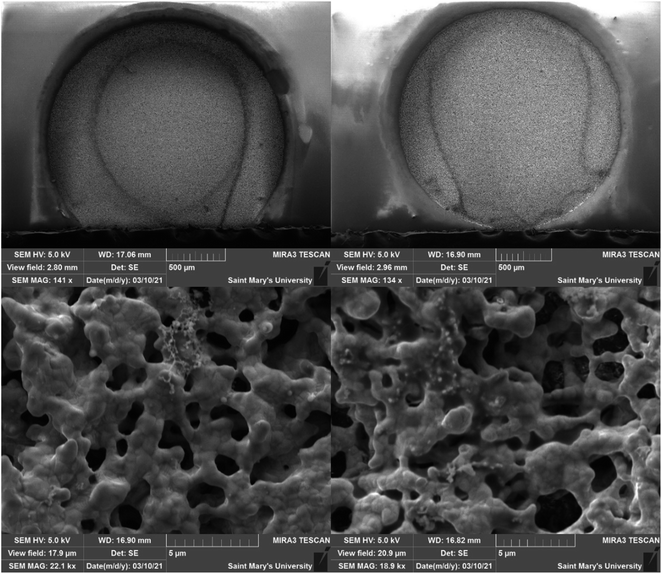
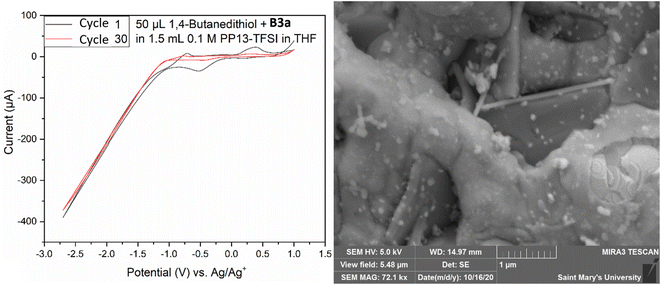
Both electrodes had a deposit as evidenced by SEM analysis (Fig. 9); however, the morphology presented as a non-homogenous ring around the electrode, existing as a globular amorphous deposit upon closer examination. Two solutions were prepared containing 50 μL 1,4-butanedithiol, B3a, and either 1.5 mL THF, or 1.5 mL 0.1 M PP13-TFSI in THF. The THF solution appeared to have an orange suspended solid, and the 0.1 M PP13-TFSI in THF initially turned orange, changing to red with a red precipitate settling out after one week. The THF solution without ionic liquid remained as a turbid orange suspension. The reddish orange solution from the 0.1 M PP13-TFSI in THF was decanted and used as electrochemical electrolyte. SEM-EDS analysis revealed the presence of sulfur and platinum, with other metal signals (Fe, Mg, Co) potentially present as artifacts or as contaminants. An additional deposition attempt was conducted in a solution of 1.5 mL 0.1 M PP13-TFSI in THF that had 0.05 mL B3a added to it, followed by 0.05 mL 1,4-butanedithiol in a low volume cell with a screen-printed platinum electrode (Pt SPE #5). CV from +1.0 V to −2.7 V for 30 cycles at a scan rate of 50 mV s−1 was run to attempt deposition. The voltammogram had a reduction peak at +0.5 V followed by a significant increase in reductive current from −1.0 V to −2.7 V. The diagonal component to the voltammogram at these negative potentials indicates a resistive component to the circuit which may be due to the viscosity of residual ethylene glycol at the electrode surface. There is an oxidation peak at ∼−0.7 V and another at ∼+0.4 V. After 30 cycles the current between −1.0 V and +1.0 V increases significantly, and the redox features are no longer observed (Fig. 10). This decrease in current may indicate the formation of a stable and thick insulating layer on the Pt surface which does not allow for current to flow as readily.
This work was not conclusive regarding the state of each deposit; however, various unique morphologies were observed by SEM analysis following electrodeposition by chronoamperometric and cyclic voltametric methods within 0.1 M PP13-TFSI in THF as a supporting electrolyte solution and 1,4-butanedithiol as a sulfur precursor and concentrated MoO3 and ethylene glycol reaction solutions. SEM-EDS analysis indicated the presence of sulfur and molybdenum.
These experiments indicate that PP13-TFSI in THF as a supporting electrolyte has a wide electrochemical window. A solution of 0.1 M PP13-TFSI in THF does display a resistive component from −1.25 V to +0.5 V, indicating higher concentrations of electrolyte may perform as a better non-aqueous electrodeposition matrix. Electrochemical analysis of ethylene glycol indicated that its presence in solution at the concentrations studied may be problematic, introducing an apparent resistive component to the electrochemical system which impedes current flow. There is difficulty associated with complete removal of ethylene glycol (b.p. 197 °C) from the molybdenum-precursor proposed by Murugesan et al. without potentially changing its composition considerably. Issues of irreversible decomposition processes including thermally induced changes (too much heat = black solid), solvent mediated chemical alterations (water reacts with the studied molybdenum-precursors to form a blue compound thought to consist of large poly-oxomolybdate clusters, and THF coordinates to Mo dimers via μ-bridging of the metal centers), or a variety of clustering processes (dimerization, polymerization, tetra-/octamerization). SEM-EDS and CV measurements indicate that material from electrodeposition attempts containing either sulfur or molybdenum has been deposited; however, the current lack of reproducibility between batches of the key molybdenum precursor prevented further characterization of these undesirable non-homogenous amorphous films.
Conclusion
A literature procedure for producing MoS2 via electrodeposition in the ionic liquid PP13-TFSI at 100 °C from 1,4-butanedithiol as the source of sulfur and crude reaction mixtures of MoO3 with ethylene glycol as the source of molybdenum was explored. Replication of this procedure using the reported −2.7 V, 300 seconds chronoamperometric electrodeposition conditions using the sixth molybdenum-precursor synthesized, which was most akin to the required “brown viscous liquid” was unsuccessful. During the attempt to replicate the published work, four crystalline materials were isolated, giving insight into the reaction's complexity. This represents monomeric (1), dimeric (2), polymeric (3), and a larger cluster containing eight molybdenum atoms (4). In addition, electrochemistry using 0.1 M PP13-TFSI in THF as a non-aqueous, polar aprotic electrolyte solution was conducted on both platinum and glassy carbon working electrodes. Electrochemical analysis of ethylene glycol, 1,4-butanedithiol, a mix of the two, and various liquid molybdenum-precursor samples was performed. Various attempts were made to electrodeposit MoS2 within this electrolyte solution, and SEM-EDS analysis indicates non-homogenous coverage of amorphous deposits containing sulfur and molybdenum from room temperature solutions, although overlap of their X-ray signals gave inconclusive results and a ratio could not be determined. Indications of the existence of [PP13]2[Mo6O19] (5) as an oxidation biproduct on quenching the precursor solution with 1![[thin space (1/6-em)]](https://www.rsc.org/images/entities/char_2009.gif) :
:![[thin space (1/6-em)]](https://www.rsc.org/images/entities/char_2009.gif) 1 v/v 5% sodium hypochlorite was observed. The variety of diversity within the MoO3 ethylene glycol reaction warrants further investigation into the active component that allowed for direct electrodeposition of MoS2 as reported by Murugesan et al. One or more of these compounds may be responsible for the successful direct electrodeposition of molybdenum disulfide by Murugesan et al., but current knowledge is very limited and further work would be needed to find a reliable mechanism for MoS2 formation, in addition to studying the previously reported monometallic (1) as a precursor, alongside synthesizing the lower oxidation state molybdenum cluster compounds (2–4) to also test as precursors.
1 v/v 5% sodium hypochlorite was observed. The variety of diversity within the MoO3 ethylene glycol reaction warrants further investigation into the active component that allowed for direct electrodeposition of MoS2 as reported by Murugesan et al. One or more of these compounds may be responsible for the successful direct electrodeposition of molybdenum disulfide by Murugesan et al., but current knowledge is very limited and further work would be needed to find a reliable mechanism for MoS2 formation, in addition to studying the previously reported monometallic (1) as a precursor, alongside synthesizing the lower oxidation state molybdenum cluster compounds (2–4) to also test as precursors.
This work ended up far more fundamental than intended resulting in incompletely characterized, yet conclusively identified molybdenum compounds in the as-yet incompletely understood brown viscous liquid. This work represents a multifaceted study into aspects surrounding the first report to our knowledge of direct electrodeposition of crystalline MoS2. The limits identified by our synthetic and electrochemical studies indicate that understanding the chemical identity of “active” intermediates is key within complex redox processes. For example, electrodeposition of binary compounds like MoS2 would take a number of steps from more complex precursors like those we have found in our attempts to create the brown viscous oil molybdenum precursor reported by Murugesan et al.1
Author contributions
Data curation, formal analysis, methodology, project administration, writing (review/editing), and conceptualization was contributed by all authors. Christa and Jason each contributed to funding acquisition, resources, and supervision. Tanner performed the investigation, validation, visualization, and original draft writing within his MSc thesis work (2021).65Conflicts of interest
No conflict of interest exists with any authors and this work.Acknowledgements
C. L. B. acknowledges support from the Canada Research Chairs program. C. L. B. and J. D. M. would like to acknowledge the Natural Science and Engineering Council of Canada (NSERC) for operating funds and Saint Mary's University for supporting the purchase of the SCXRD instrument. T. G. thanks the support of crystallographers hosting the annual Canadian Chemical Crystallography Workshops through the efforts of the Canadian National Committee for Crystallography.References
- S. Murugesan, A. Akkineni, B. P. Chou, M. S. Glaz, D. A. Vanden Bout and K. J. Stevenson, Room Temperature Electrodeposition of Molybdenum Sulfide for Catalytic and Photoluminescence Applications, ACS Nano, 2013, 7, 8199–8205 CrossRef CAS PubMed.
- Y. Quan, J. Yao, S. Yang, L. Chen, J. Li, Y. Liu, J. Lang, H. Shen, Y. Wang, Y. Wang, J. Yang and M. Gao, ZnO nanoparticles on MoS2 microflowers for ultrasensitive SERS detection of bisphenol A, Microchim. Acta, 2019, 186, 1–8 CrossRef CAS PubMed.
- U. Krishnan, M. Kaur, G. Kaur, K. Singh, A. R. Dogra, M. Kumar and A. Kumar, MoS2/ZnO nanocomposites for efficient photocatalytic degradation of industrial pollutants, Mater. Res. Bull., 2019, 111, 212–221 CrossRef CAS.
- Y. Wang and Y. Xie, Electroactive FeS2-modified MoS2 nanosheet for high-performance supercapacitor, J. Alloys Compd., 2020, 824, 153936 CrossRef CAS.
- T. Liu, I. Temprano, D. A. King, S. M. Driver and S. J. Jenkins, Epitaxial growth of few-layer MoS2(0001) on FeS2{100}, Chem. Commun., 2015, 51, 537–540 RSC.
- S. Yuvaraj, G. K. Veerasubramani, M. Park, P. Thangavel and D. Kim, Facile synthesis of FeS2/MoS2 composite intertwined on rGO nanosheets as a high-performance anode material for sodium-ion battery, J. Alloys Compd., 2020, 821, 153222 CrossRef CAS.
- Y. Chen, Z. Peng, Y. Guo, S. Guan and X. Fu, Novel self-supported MoS2/FeS2 nanocomposite as an excellent electrocatalyst for hydrogen evolution, Solid State Sci., 2020, 101, 106156 CrossRef CAS.
- X. Zhao, X. Ma, Q. Lu, Q. Li, C. Han, Z. Xing and X. Yang, FeS2-doped MoS2 nanoflower with the dominant 1T-MoS2 phase as an excellent electrocatalyst for high-performance hydrogen evolution, Electrochim. Acta, 2017, 249, 72–78 CrossRef CAS.
- Z. Wang, J. Zhang, T. Wen, X. Liu, Y. Wang, H. Yang, J. Sun, J. Feng, S. Dong and J. Sun, Highly effective remediation of Pb(II) and Hg(II) contaminated wastewater and soil by flower-like magnetic MoS2 nanohybrid, Sci. Total Environ., 2020, 699, 134341 CrossRef CAS PubMed.
- X. Zheng, Z. Guo, G. Zhang, H. Li, J. Zhang and Q. Xu, Building a lateral/vertical 1T-2H MoS2/Au heterostructure for enhanced photoelectrocatalysis and surface enhanced Raman scattering, J. Mater. Chem. A, 2019, 7, 19922–19928 RSC.
- A. G. Milekhin, M. Rahaman, E. E. Rodyakina, A. V. Latyshev, V. M. Dzhagan and D. R. T. Zahn, Giant gap-plasmon tip-enhanced Raman scattering of MoS2 monolayers on Au nanocluster arrays, Nanoscale, 2018, 10, 2755–2763 RSC.
- J. Langer, D. Jimenez de Aberasturi, J. Aizpurua, R. A. Alvarez-Puebla, B. Auguié, J. J. Baumberg, G. C. Bazan, S. E. J. Bell, A. Boisen, A. G. Brolo, J. Choo, D. Cialla-May, V. Deckert, L. Fabris, K. Faulds, F. J. García de Abajo, R. Goodacre, D. Graham, A. J. Haes, C. L. Haynes, C. Huck, T. Itoh, M. Käll, J. Kneipp, N. A. Kotov, H. Kuang, E. C. Le Ru, H. K. Lee, J. Li, X. Y. Ling, S. A. Maier, T. Mayerhöfer, M. Moskovits, K. Murakoshi, J. Nam, S. Nie, Y. Ozaki, I. Pastoriza-Santos, J. Perez-Juste, J. Popp, A. Pucci, S. Reich, B. Ren, G. C. Schatz, T. Shegai, S. Schlücker, L. Tay, K. G. Thomas, Z. Tian, R. P. Van Duyne, T. Vo-Dinh, Y. Wang, K. A. Willets, C. Xu, H. Xu, Y. Xu, Y. S. Yamamoto, B. Zhao and L. M. Liz-Marzán, Present and Future of Surface-Enhanced Raman Scattering, ACS Nano, 2020, 14, 28–117 CrossRef CAS PubMed.
- D. S. Schulman, A. Sebastian, D. Buzzell, Y. Huang, A. J. Arnold and S. Das, Facile Electrochemical Synthesis of 2D Monolayers for High-Performance Thin-Film Transistors, ACS Appl. Mater. Interfaces, 2017, 9, 44617–44624 CrossRef CAS PubMed.
- R. J. Toh, Z. Sofer, J. Luxa, D. Sedmidubský and M. Pumera, 3R phase of MoS2 and WS2 outperforms the corresponding 2H phase for hydrogen evolution, Chem. Commun., 2017, 53, 3054–3057 RSC.
- D. W. Redman, M. J. Rose and K. J. Stevenson, Electrodeposition of Amorphous Molybdenum Chalcogenides from Ionic Liquids and Their Activity for the Hydrogen Evolution Reaction, Langmuir, 2017, 33, 9354–9360 CrossRef CAS PubMed.
- M. D. Patel, J. Zhang, J. Park, N. Choudhary, J. M. Tour and W. Choi, Directly deposited porous two-dimensional MoS2 films as electrocatalysts for hydrogen evolution reactions, Mater. Lett., 2018, 225, 65–68 CrossRef CAS.
- S. Jayabal, J. Wu, J. Chen, D. Geng and X. Meng, Metallic 1T-MoS2 nanosheets and their composite materials: preparation, properties and emerging applications, Mater. Today Energy, 2018, 10, 264–279 CrossRef.
- D. Escalera-López, Z. Lou and N. V. Rees, Benchmarking the Activity, Stability, and Inherent Electrochemistry of Amorphous Molybdenum Sulfide for Hydrogen Production, Adv. Energy Mater., 2019, 9, 1802614 CrossRef.
- Z. Zhuang, J. Huang, Y. Li, L. Zhou and L. Mai, The Holy Grail in Platinum-Free Electrocatalytic Hydrogen Evolution: Molybdenum-Based Catalysts and Recent Advances, ChemElectroChem, 2019, 6, 3570–3589 CrossRef CAS.
- D. Vikraman, S. Hussain, S. A. Patil, L. Truong, A. A. Arbab, S. H. Jeong, S. Chun, J. Jung and H. Kim, Engineering MoSe2/WS2 Hybrids to Replace the Scarce Platinum Electrode for Hydrogen Evolution Reactions and Dye-Sensitized Solar Cells, ACS Appl. Mater. Interfaces, 2021, 13, 5061–5072 CrossRef CAS PubMed.
- E. Er, H. Hou, A. Criado, J. Langer, M. Möller, N. Erk, L. M. Liz-Marzán and M. Prato, High-Yield Preparation of Exfoliated 1T-MoS2 with SERS Activity, Chem. Mater., 2019, 31, 5725–5734 CrossRef CAS.
- G. Zheng, P. Zhang, S. Zhang, Y. Peng, L. Huang, L. Zhang, Y. Jin, Z. Jiao and X. Sun, SERS effect of selectively adsorbed dyes by hydrothermally-produced MoS2 nanosheets, New J. Chem., 2018, 42, 18906–18912 RSC.
- P. K. Kannan, D. J. Late, H. Morgan and C. S. Rout, Recent developments in 2D layered inorganic nanomaterials for sensing, Nanoscale, 2015, 7, 13293–13312 RSC.
- I. Yakovkin, Dirac Cones in Graphene, Interlayer Interaction in Layered Materials, and the Band Gap in MoS2, Crystals, 2016, 6, 143 CrossRef.
- C. Muehlethaler, C. R. Considine, V. Menon, W. Lin, Y. Lee and J. R. Lombardi, Ultrahigh Raman Enhancement on Monolayer MoS2, ACS Photonics, 2016, 3, 1164–1169 CrossRef CAS.
- B. Shi, D. Zhou, S. Fang, K. Djebbi, S. Feng, H. Zhao, C. Tlili and D. Wang, Facile and Controllable Synthesis of Large-Area Monolayer WS2 Flakes Based on WO3 Precursor Drop-Casted Substrates by Chemical Vapor Deposition, Nanomaterials, 2019, 9, 578–589 CrossRef CAS PubMed.
- R. G. M. da Fonseca, R. F. Albers, E. R. Leite and A. J. A. de Oliveira, Parallel magnetic anisotropy in few layers MoS2 films, J. Magn. Magn. Mater., 2020, 497, 165985–165990 CrossRef CAS.
- S. Thomas, D. E. Smith, V. K. Greenacre, Y. J. Noori, A. L. Hector, C. H. (Kees) de Groot, G. Reid and P. N. Bartlett, Electrodeposition of MoS2 from Dichloromethane, J. Electrochem. Soc., 2020, 167, 106511–106516 CrossRef CAS.
- E. A. Ponomarev, M. Neumann-Spallart, G. Hodes and C. Lévy-Clément, Electrochemical deposition of MoS2 thin films by reduction of tetrathiomolybdate, Thin Solid Films, 1996, 280, 86–89 CrossRef CAS.
- G. Staikov, Electrochemical Theory: Electrocrystallization, 2009, vol. 2, pp. 32–40 Search PubMed.
- O. Mabayoje, Y. Liu, M. Wang, A. Shoola, A. M. Ebrahim, A. I. Frenkel and C. B. Mullins, Electrodeposition of MoSx Hydrogen Evolution Catalysts from Sulfur-Rich Precursors, ACS Appl. Mater. Interfaces, 2019, 11, 32879–32886 CrossRef CAS PubMed.
- A. Cuin and A. C. Massabni, Synthesis and characterization of solid molybdenum(VI) complexes with glycolic, mandelic and tartaric acids. Photochemistry behaviour of the glycolate molybdenum complex, J. Coord. Chem., 2007, 60, 1933–1940 CrossRef CAS.
- H. Preiss, B. Meyer and C. Olschewski, Preparation of molybdenum and tungsten carbides from solution derived precursors, J. Mater. Sci., 1998, 33, 713–722 CrossRef CAS.
- F. A. Schröder, J. Scherle and R. G. Hazell, The structure of cis-dioxobis-(2-hydroxyethyl-1-oxo)molybdenum(VI), Acta Crystallogr., Sect. B: Struct. Crystallogr. Cryst. Chem., 1975, 31, 531–536 CrossRef.
- G. R. Fulmer, A. J. M. Miller, N. H. Sherden, H. E. Gottlieb, A. Nudelman, B. M. Stoltz, J. E. Bercaw and K. I. Goldberg, NMR Chemical Shifts of Trace Impurities: Common Laboratory Solvents, Organics, and Gases in Deuterated Solvents Relevant to the Organometallic Chemist, Organometallics, 2010, 29, 2176–2179 CrossRef CAS.
- APEX4, Bruker AXS Inc., Madison, Wisconsin, USA, 2021 Search PubMed.
- SAINT, Bruker AXS Inc., Madison, Wisconsin, USA, 2012 Search PubMed.
- SADABS, Bruker AXS Inc., Madison, Wisconsin, USA, 2016 Search PubMed.
- G. M. Sheldrick, SHELXT – integrated space-group and crystal-structure determination, Acta Crystallogr., Sect. A: Found. Adv., 2015, 71, 3–8 CrossRef PubMed.
- G. M. Sheldrick, Crystal structure refinement with SHELXL, Acta Crystallogr., Sect. C: Struct. Chem., 2015, 71, 3–8 Search PubMed.
- A. L. Spek, Single-crystal structure validation with the program PLATON, J. Appl. Crystallogr., 2003, 36, 7–13 CrossRef CAS.
- O. V. Dolomanov, L. J. Bourhis, R. J. Gildea, J. A. K. Howard and H. Puschmann, OLEX2: a complete structure solution, refinement and analysis program, J. Appl. Crystallogr., 2009, 42, 339–341 CrossRef CAS.
- L. J. Farrugia, ORTEP-3 for Windows – a version of ORTEP-III with a Graphical User Interface (GUI), J. Appl. Crystallogr., 1997, 30, 565 CrossRef CAS.
- P. Van Der Sluis and A. L. Spek, BYPASS: an effective method for the refinement of crystal structures containing disordered solvent regions, Acta Crystallogr., Sect. A: Found. Crystallogr., 1990, 46, 194–201 CrossRef.
- H. Sakaebe and H. Matsumoto, N-Methyl-N-propylpiperidinium bis(trifluoromethanesulfonyl)imide (PP13–TFSI) – novel electrolyte base for Li battery, Electrochem. Commun., 2003, 5, 594–598 CrossRef CAS.
- F. A. Schröder and J. Scherle, Beiträge zur Chemie von Molybdän und Wolfram. XI/Contributions to the Chemistry of Molybdenum and Tungsten. XI, Zeitschrift für Naturforschung, 1973, 28, 46–55 CrossRef.
- C. B. Knobler, B. R. Penfold, W. T. Robinson and C. J. Wilkins, Di-μ-methoxo-bis{[2,3-dimethylbutane-2,3-diolato(1-)]-cis-dioxomolybdenum (VI)}-methanol (1/2), Acta Crystallogr., Sect. B: Struct. Crystallogr. Cryst. Chem., 1981, 37, 942–944 CrossRef.
- B. Modec, J. Brenčič and J. Koller, A Series of Molybdenum(V) Complexes with the Oxalato Ligand Engaged in Different Binding Roles – An Unusual Staggered Conformation of the μ4-Oxalate in [{Mo2O4(η2-C2O4)2}2(μ4-C2O4)]6, Eur. J. Inorg. Chem., 2004, 2004, 1611–1620 CrossRef.
- B. Modec, D. Dolenc, J. V. Brenčič, J. Koller and J. Zubieta, Dinuclear Oxomolybdate(V) Species with Oxalato and Pyridine Ligands Revisited: cis/trans Isomerization of [Mo2O4(η2-C2O4)2(R-Py)2]2- (R-Py = Pyridine, Alkyl-Substituted Pyridine) in Water Evidenced by NMR Spectroscopy, Eur. J. Inorg. Chem., 2005, 2005, 3224–3237 CrossRef.
- A. Lehtonen and R. Sillanpaa, CCDC 141435: Experimental Crystal Structure Determination, 2000 Search PubMed.
- F. A. Cotton and S. M. Morehouse, The Molecular Structure of a Diamagnetic, Doubly Oxygen-Bridged, Binuclear Complex of Molybdenum(V) Containing a Metal-Metal Bond, Inorg. Chem., 1965, 4, 1377–1381 CrossRef.
- B. Sarr, A. Mbaye, C. A. K. Diop, M. Sidibe, F. Melin, P. Hellwig, F. Maury, F. Senocq, P. Guionneau, M. Giorgi and R. Gautier, One pot-synthesis of the fourth category of dinuclear molybdenum(VI) oxalate series: structure and study of thermal and redox properties, Inorg. Chim. Acta, 2019, 491, 84–92 CrossRef CAS.
- T. Shin-ichi, T. Kengo, S. Masato, M. Toshie and T. Hideko, Preparation of a Binuclear Oxo(tropolonato)molybdenum(V) Complex and Its Spectroscopic Properties and Crystal Structure, Bull. Chem. Soc. Jpn., 2004, 77, 1935–1936 CrossRef.
- A. Lehtonen and R. Sillanpää, Synthesis and crystal structures of bis(2,3-dimethyl-2,3-butanediolato) (1,2-ethanediolato)tungsten(VI) and tris(2,3-dimethyl-2,3-butanediolato)tungsten(VI), Polyhedron, 1994, 13, 2519–2524 CrossRef CAS.
- R. M. Buchanan and C. G. Pierpont, Synthesis, structure, and properties of the oxygen-deficient bis(3,5-di-tert-butylcatecholato)oxomolybdenum(VI) dimer, [MoO(O2C6H2(t-Bu)2)2]2, Inorg. Chem., 1979, 18, 1616–1620 CrossRef CAS.
- S. Shekar and S. N. Brown, Mixed amidophenolate-catecholates of molybdenum(VI), Dalton Trans., 2014, 43, 3601–3611 RSC.
- M. Lee and S. Wang, Syntheses and Characterizations of Four Organically Templated One-Dimensional Molybdenum Compounds including the First Inorganic–Organic Mixed-Anion Structures in the Mo/X/O (X = As, P) System, Chem. Mater., 1999, 11, 3588–3594 CrossRef CAS.
- D. Bayot, B. Tinant and M. Devillers, Spectroscopic and structural characterizations of ammonium peroxo–carboxylato molybdate(VI) complexes, Inorg. Chim. Acta, 2004, 357, 809–816 CrossRef CAS.
- Z. Zhou, Y. Deng, Z. Cao, R. Zhang and Y. L. Chow, Dimeric Dioxomolybdenum(VI) and Oxomolybdenum(V) Complexes with Citrate at Very Low pH and Neutral Conditions, Inorg. Chem., 2005, 44, 6912–6914 CrossRef CAS PubMed.
- D. Liu, P. Zhang, J. Xu, S. Feng and Z. Shi, Solvothermal synthesis and crystal structure of the Mo(VI)-bridged helical chain containing Mo2(V) dimers: (C4H12N2)2[(Mo(V)2O4)(Mo(VI)O4)(C2O4)2]·2H2O, Solid State Sci., 2007, 9, 16–20 CrossRef CAS.
- P. Mialane, A. Dolbecq, G. Costaz, L. Lisnard, J. Marrot and F. Sécheresse, Synthesis and structure of the first dinuclear lanthanide oxalato complexes [{Mo(V)2O4(C2O4)2(H2O)2}2{(Ln2(H2O)4)2(C2O4)}]·7H2O (Ln = La3+, Ce3+), Inorg. Chem. Commun., 2002, 5, 702–705 CrossRef CAS.
- S. Wang, W. Jin, H. Chen and Z. Zhou, Comparison of hydroxycarboxylato imidazole molybdenum(IV) complexes and nitrogenase protein structures: indirect evidence for the protonation of homocitrato FeMo-cofactors, Dalton Trans., 2018, 47, 7412–7421 RSC.
- M. Łukaszewski, Electrochemical Methods of Real Surface Area Determination of Noble Metal Electrodes – An Overview, Int. J. Electrochem. Sci., 2016, 4442–4469 CrossRef.
- J. M. Doña Rodríguez, J. A. Herrera Melián and J. Pérez Peña, Determination of the Real Surface Area of Pt Electrodes by Hydrogen Adsorption Using Cyclic Voltammetry, J. Chem. Educ., 2000, 77, 1195–1197 CrossRef.
- T. A. George, Identification of key reaction products from MoO3 and ethylene glycol mixtures used for attempted MoS2 electrodeposition and synthesis of bidentate ligands and related group 1 and 13 metal complexes, MSc thesis, Saint Mary's University Institutional Repository, 2021, vol. XXI, pp. 1–281.
Footnote |
| † Electronic supplementary information (ESI) available. CCDC 2225735–2225739. For ESI and crystallographic data in CIF or other electronic format see DOI: https://doi.org/10.1039/d3ra04605b |
| This journal is © The Royal Society of Chemistry 2023 |


