
 Open Access Article
 This Open Access Article is licensed under a Creative Commons Attribution-Non Commercial 3.0 Unported Licence
Electrochemical sensor for simultaneous determination of trifluoperazine and dopamine in human serum based on graphene oxide–carbon nanotubes/iron–nickel nanoparticles†
Yousef M. Ahmed,
Mahmoud A. Eldin,
Ahmed Galal and
Nada F. Atta*
and
Nada F. Atta*
Chemistry Department, Faculty of Science, Cairo University, 12613, Giza, Egypt. E-mail: anada@sci.cu.edu.eg
First published on 23rd August 2023
Abstract
Trifluoperazine (TFLP) is an important psychiatric medication that balances the dopamine (DA) level in the brain for patients suffering from neurological disorder diseases. An efficient electrochemical sensor is developed for detecting TFLP in real human serum samples. The sensor is fabricated by casting the GC surface with two consecutive thin layers, namely a graphene oxide-carbon nanotubes mixture (GRO-CNT), and iron–nickel nanoparticles (Fe–Ni). The diffusion-controlled oxidation process of TFLP at the composite surface includes one electron transfer process. Under optimized conditions, the sensor in human serum shows excellent catalytic effect for simultaneous determination of TFLP and dopamine (DA) in the same concentration range (0.5 μM to 18 μM) with low detection limits of 0.13 μM and 0.32 μM respectively. The combined effect of a large conductive surface area and the excellent catalytic activity of the nanocomposite improves the sensor's performance. The sensor exhibits a stable current response over four weeks, excellent reproducibility, and insignificant interference from common species present in human serum samples. The reliability test of using the sensor in serum samples shows good recovery of TFLP.
1. Introduction
Trifluoperazine (TFLP) belongs to the category of drugs called phenothiazine antipsychotics. It is a typical psychiatric medication that primarily treats schizophrenia.1,2 It is utilized for treating anxiety and controlling some psychotic disorders such as agitation, acute confusion state, depression, and psychosis.2,3 TFLP has central antiadrenergic and antidopaminergic effects. Besides, it is a dopamine (DA) antagonist, has an antipsychotic effect as it blocks DA – D1 and D2 receptors and prevents disorder illness effects such as hallucinations, delusions, disordered speech and thought resulting from DA excess in the brain.4 DA is an important neurotransmitter that belongs to the catecholamines family. DA is a substance released in the brain that helps to regulate mood, behavior, and thoughts. Thus, having the accurate amount of DA is important for both your brain and body. DA helps nerve cells to send messages to each other.5 Deficiency of DA in biological fluids can lead to various neurological disorders and diseases such as schizophrenia, bipolar disorder, tourette syndrome, and Parkinson's.6 Thus, TFLP is an important drug to balance the DA level in the brain for patients suffering from neurological disorder diseases. To the best of our knowledge only one paper is cited for the determination of TFLP and DA in the literature.4 Also, simultaneous detection of DA and ascorbic acid (AA) using polymeric materials and metal nanoparticles-based sensors is cited in the literature.7,8 Some methods are utilized for TFLP detection such as reverse phase HPLC method, liquid chromatography–tandem mass spectrometry, spectrophotometry, flow injection fluorimetry.9–12 Low cost, simple operation, sensitivity, and fast response are the advantages of electrochemical methods over other cited methods.13,14Carbon nanotubes (CNTs) are made of concentric cylinders of graphite layers. CNTs are used to improve the thermal stability, hardness, and electrical conductivity of composites. CNTs have been used in sensing applications because of their large effective surface area, and excellent electrochemical properties.13,14 Besides, organic conjugated species can interact with the CNTs through π–π interactions and hydrophobic interactions.15,16
Graphene oxide (GRO) is extensively used in chemical and biosensing applications because of its significant properties such as controllable electronic provisions, and surface defect density, hydrophilicity, and possession of various oxygen moieties.17 Furthermore, GRO can easily disperse in solvents and different matrices due to the presence of oxygen functionalities. Its mechanical and electrical properties are enhanced when combining with different structures as CNTs and different catalysts. GRO acts as a support for various catalyst materials, which assists their spreading, and the stabilization of the resulting composites. The presence of reactive sites for binding and nucleation of different materials at the surface of GRO is due to edges of the sheets and the presence of sufficient functional groups on the GRO surfaces namely C–O–C, –OH, and –COOH.18,19 This results in speeding the electron transfer process between the analyte and the surface of the modified electrode.20 Also, the homogeneous dispersion, conductivity, electrocatalytic behavior, and chemical stability can be improved by the addition of carbon material to metal oxides.21 Besides, electrochemical detection of diverse molecules was achieved at GRO derivatives-based nanocomposites.22,23
Bimetallic nanoparticles consist of two metal components. The enhancement in their catalytic capabilities gives them a significant advantage over monometallic nanoparticles. Bimetallic nanoparticles catalysts boost stability, catalytic activity, and selectivity in electrochemical applications. Bimetallic nanoparticles exhibit a wide range of intriguing size-dependent chemical, electrical, and optical characteristics.24 Besides, use of bimetallic nanoparticles in the fabricated sensors prevents catalyst poisoning. The iron–nickel alloy is considered as a promising contender for numerous applications because of its significant features such as great corrosion resistance, ferromagnetism, thermal stability, hardness, ductility, thermal expansion, and catalytic activity.25–27 The nickel–iron alloy exhibits a definite structure where the weight percentage of Ni ranges from 35% to 80%. The improvement in the catalytic activity of the Fe–Ni is due to variations in their system electron density and in the length of metal–metal bond.28,29
Also, nanostructure materials and different bimetallic nanoparticles are used for modifying the electrode composite surfaces for sensing applications.30–32
Thus, the outstanding synergism between the modifiers; CNTs, GRO and iron–nickel nanoparticles with their distinctive characteristics, enhances the electrochemical current response for TFLP. GRO sheets with large surface area act as support for Fe–Ni nanoparticles and assist their homogeneous distribution and the stabilization of the resulting composite. Besides, the presence of reactive sites for the binding and nucleation of target species at its surface is due to the presence of several functional groups. CNTs offer large effective surface area, high edge plane/basal plane ratio, high sorption capacity, penetration ability, surface adsorption and excellent electrical conductivity. Further, the incorporated CNTs can serve as an electrical conducting network between the GRO sheets, they greatly facilitate the electrochemical oxidation of TFLP. Further, the high permeability of nickel–iron alloys make them very useful materials for electronic conductions. The Fe–Ni nanoparticles with excellent catalytic activity create a conduction pathway in the modified composite, act as an electron transfer medium, and enhance the electron transfer during the electrochemical oxidation reaction.
In the present work, a novel modified sensor GC/GRO-CNT/Fe–Ni is fabricated by casting the GC surface with two consecutive thin layers from graphene oxide–carbon nanotubes mixture (GRO-CNT), and iron–nickel nanoparticles (Fe–Ni). This increases the composite surface area, the contact area with the TFLP species and improves the electrocatalytic behavior of the composite toward oxidation of TFLP. Under optimized conditions, the sensor in human serum shows excellent catalytic effect for simultaneous determination of TFLP and dopamine (DA) in the same concentration range (0.5 μM to 18 μM) with low detection limits 0.13 μM and 0.32 μM respectively. The combined effect of large conductive surface area and excellent catalytic activity of GRO-CNT/Fe–Ni nanocomposite improves the sensor's performance. The GC/GRO-CNT/Fe–Ni modified electrode offers good sensitivity and low detection limit for TFLP compared to other modified electrodes cited in the literature. Good reproducibility, repeatability and perfect storage stability are the features of the sensor. The TFLP sensor exhibits excellent selectivity, and insignificant interference from common species present in human serum samples. Acceptable recovery is obtained for practical application of the sensor in human serum samples for TFLP determination.
2. Experimental section
2.1 Chemicals
CNTs (>90% carbon basis, OD/ID × L: 10–15 nm/2–6 nm × 0.1–10 μm), graphite powder, Fe–Ni nanoparticles, H2SO4, P2O5, K2S2O8, H2O2, KMnO4, DMF, ascorbic acid (AA), uric acid (UA), paracetamol (PAR), dopamine (DA), serotonin (ST), KH2PO4, K2HPO4, H3PO4, and KOH are purchased from Sigma-Aldrich Chem. Co. (Milwaukee, WI. USA). Trifluoperazine (TFLP) and ibuprofen (IBU) are provided by the National Organization for Drug Control. ESI Table 1† summarizes the devices used in this work.2.2 Preparation of tested samples
We examined the applicability of GC/GRO-CNT/Fe–Ni modified electrode for sensing TFLP in samples of real human serum. The serum samples are prepared as mentioned elsewhere.28 Under optimal experimental conditions we studied the recovery test of TFLP using differential pulse voltammetry (DPV) mode in diluted serum samples (diluted five times with PBS). The specific concentrations of TFLP are prepared from 1.0 mM TFLP stock solution/0.1 M PBS solution (pH 7.0) and spiked in diluted serum sample.2.3 Preparation of GRO
Graphene oxide is prepared by modified Hummer's method, briefly, 5 g of high purity graphite is cured with H2SO4, P2O5 and K2S2O8 to prepare the pre-oxidized graphite. This is followed by stirring 5 g of dried pre-oxidized graphite with 115 mL of concentrated H2SO4 in an ice bath for 10 minutes. After that, 15 g of KMnO4 is gradually added and stirred for two hours. The mixture acquired a bright yellow color after dilution with water and treatment with H2O2. The bright yellow suspension is filtered and washed with 1![[thin space (1/6-em)]](https://www.rsc.org/images/entities/char_2009.gif) :10 (v/v) HCl-solution, and finally dried overnight in an oven at 80 °C.33
:10 (v/v) HCl-solution, and finally dried overnight in an oven at 80 °C.33
2.4 Preparation of the TFLP sensor
The GC/GRO-CNT/Fe–Ni sensor (Scheme 1) is prepared as follows: 10 μL from a suspension mixture of (0.5 mg GRO-0.5 mg CNT/1 mL DMF) (optimized) is cast over the GC electrode surface then the electrode is dried in oven at 50 °C for 10 min. 10.0 μL of well-dispersed Fe–Ni nanoparticles (1.5 mg of Fe–Ni/1.0 mL DMF) (optimized) is drop-cast over the previous modified surface GC/GRO-CNT. The GC/GRO-CNT/Fe–Ni electrode is left to dry in oven for 10 min at 50 °C. Optimization of the fabricated sensor is shown in ESI Fig. 1A and B.†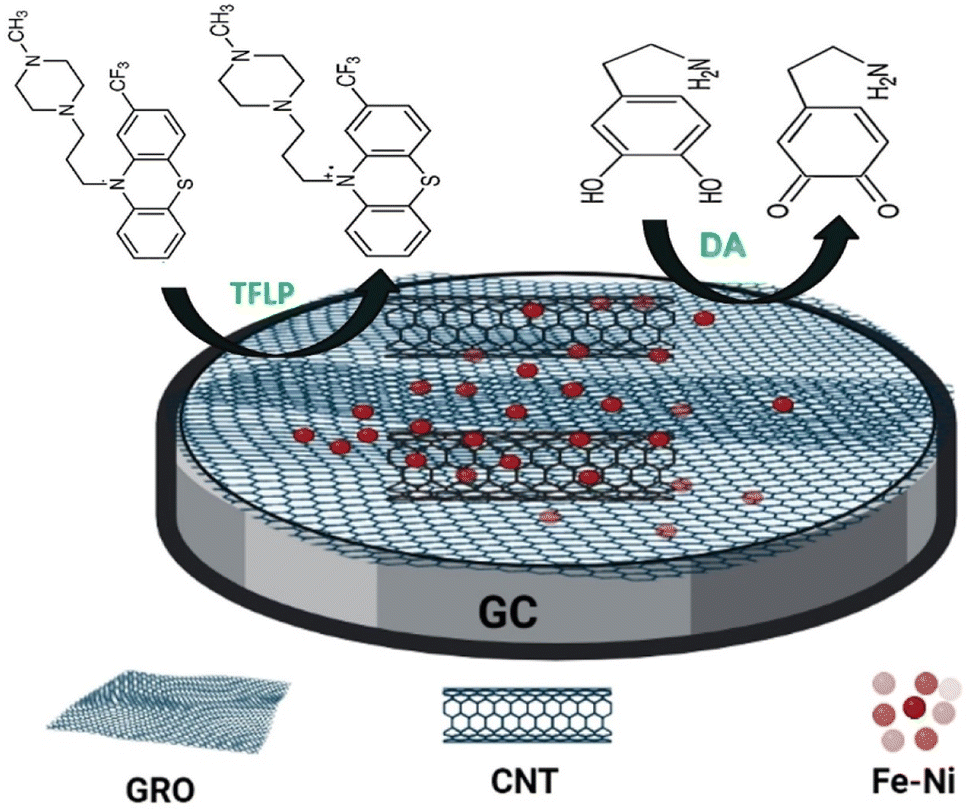 | ||
| Scheme 1 Schematic representation of GC/GRO-CNT/Fe–Ni modified electrode used for the electrochemical oxidation of TFLP. | ||
Electrochemical effective surface areas of the studied electrodes were calculated by running CV experiments in 1.0 mM K3[Fe(CN)6] system as mentioned elsewhere.14 The areas for GC/CNT, GC/GRO-CNT and GC/GRO-CNT/Fe–Ni electrodes are found to be 0.1019 cm2, 0.129 cm2 and 0.136 cm2, respectively, ESI Fig. 2A–C.†
3. Results and discussion
3.1 Surface characterization of the modified electrodes
The GC/GRO-CNT and GC/GRO-CNT/Fe–Ni are characterized using scanning electron microscopy (SEM) and transmission electron microscope (TEM). Fig. 1A shows the SEM image of GRO-CNT composite where the graphene oxide sheets are entirely mixed with CNTs. GRO sheets morphology are characterized by thick flat flake layers, rough surfaces, and irregular shapes. Disordered and unwrinkled structured were owing to the existence of oxygen atoms.34 GRO sheets are entirely wrapped by the tubular networks of CNTs via noncovalent π–π stacking interactions. Fig. 1B shows the GRO sheets are completely embedded in the CNTs matrix with good distribution of the spherical Fe–Ni nanoparticles over the GC/GRO-CNT composite surface. The incorporated CNTs can serve as an electrical conducting network for GRO sheets, which significantly facilitate the electrochemical oxidation of TFLP. Fig. 1C shows higher magnification of the sensor surface where it illustrates the morphology of the GRO-CNT/Fe-Ni composite matrix. Further, the structural morphologies of GRO-CNT and GRO-CNT/Fe–Ni composites are characterized by HR-TEM analysis, Fig. 1D illustrates the image of GRO-CNT composite where the GRO sheets are mixed with CNTs. Fig. 1E illustrates the image of GRO-CNT/Fe–Ni composite where the Fe–Ni nanoparticles, spherical-like morphology, assembled over the CNTs mixed with GRO. Fig. 1F and G show the EDX and the elemental mapping of GC/GRO-CNT/Fe–Ni, confirming the presence of all the elements included in the nanocomposite. The following elements are identified with their relative weight percentages as follows C: 34.58%; O: 2.71%; Ni: 29.67%; Fe: 33.04%. Selected area electron diffraction (SAED) patterns Fig. 1H and I are obtained from the corresponding areas in Fig. 1D and E.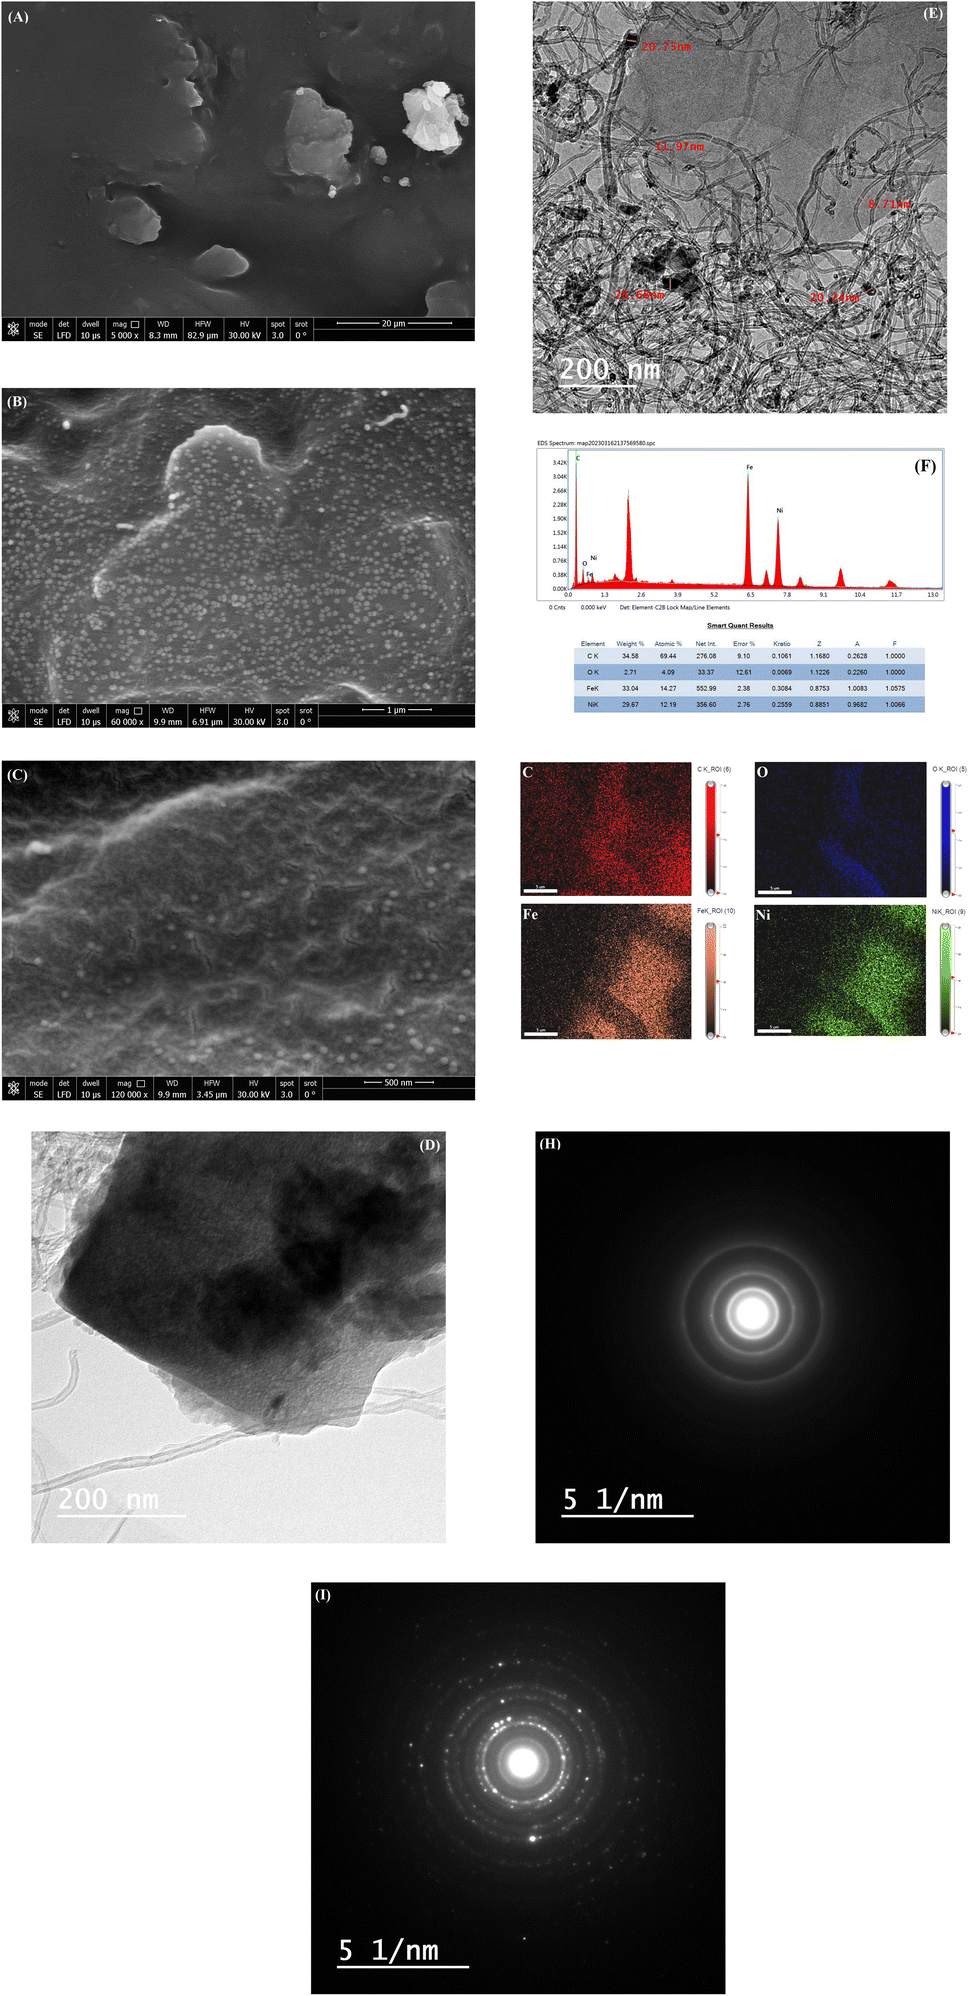 | ||
| Fig. 1 (A) SEM of GC/GRO-CNT; (B) SEM of GC/GRO-CNT/Fe–Ni; (C) SEM of GC/GRO-CNT/Fe–Ni with higher magnification. (D) TEM of GRO-CNT and (E) TEM of GRO-CNT/Fe–Ni. (F) EDX of the surface element composition of GC/GRO-CNT/Fe–Ni (G) elemental mapping of GC/GRO-CNT/Fe–Ni. (H and I) Selected area electron diffraction (SAED) patterns obtained from corresponding areas in (D) and (E). | ||
3.2 Electrochemistry of the modified electrodes
The catalytic activity of the different working electrodes towards the electrochemical oxidation of 1.0 mM TFLP/0.1 M PBS/pH 7.0 is studied. Cyclic voltammetry (CV) is performed to compare the electrochemical sensing performance of bare GC and different modified working electrodes: bare GC, GC/GRO, GC/CNT, GC/GRO-CNT, and GC/GRO-CNT/Fe–Ni (Fig. 2). The bare GC electrode and the modified electrode GC/GRO show poor current responses of oxidation peaks with the values 36.4 μA, 27.7 μA at 639 mV and 772 mV, respectively. Using GC/CNT, and GC/GRO-CNT electrodes higher current responses of oxidation peaks with the values 107.0 μA, 280 μA at 732 mV, and 771 mV, respectively are obtained. One electron is involved in the TFLP irreversible oxidation process. Further modification of the GC/GRO-CNT electrode surface with a thin film of Fe–Ni nanoparticles improves the peak sharpness and increases the oxidation peak current up to 556 μA at 845 mV. This is due to the good synergism between the components of the nanocomposite GRO-CNT/Fe–Ni. Thus, the sensor shows kinetic enhancement in the oxidation of TFLP. The observed results are summarized as follows: GRO sheets with large surface area act as support for Fe–Ni nanoparticles and assist their homogeneous distribution and the stabilization of the resulting composite. Besides, the presence of reactive sites for the binding and nucleation of target species at its surface is due to the presence of several functional groups. CNTs offer large effective surface area, and excellent electrical conductivity. Further, the incorporated CNTs can serve as an electrical conducting network between the GRO sheets, they greatly facilitate the electrochemical oxidation of TFLP. Further, the Fe–Ni nanoparticles with excellent catalytic activity create a conduction pathway in the modified composite, act as an electron transfer medium, and enhance the electron transfer during the electrochemical oxidation reaction.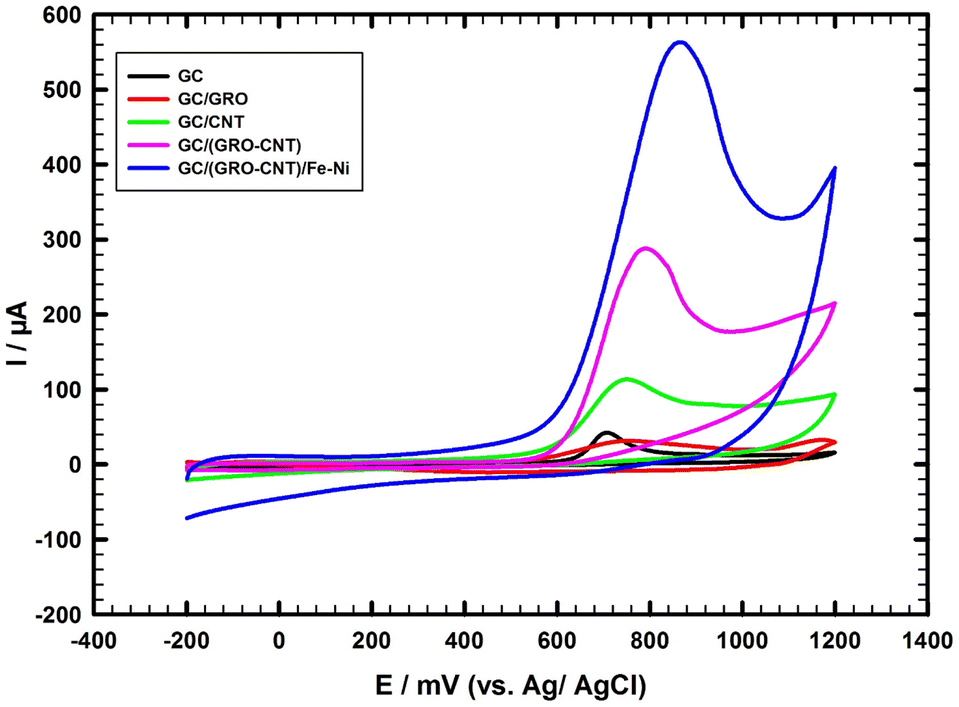 | ||
| Fig. 2 CVs of 1.0 mM TFLP/0.1 M PBS (pH 7.0), the scan rate is 50 mV s−1 using different modified electrodes. | ||
3.3 Effect of scan rate
CV is used to study the effect of applying different scan rates (10–100 mV s−1) on the oxidation peak current of 1.0 mM TFLP/0.1 M PBS/pH 7.0 using the optimized sensor as shown in ESI Fig. 3.† Scan rate is studied to examine the number of electrons transferred during the TFLP oxidation process. The oxidation current increases with increasing the scan rate with positive shift in the oxidation potential. The inset shows the linear regression relationship of peak oxidation current (Ip) vs. square root of scan rate, and can be expressed with eqn (1):| Ip (μA) = −155 + 76.4v½ (mV s−1)½ (R2 = 0.995) | (1) |
The linear relationship of Ip versus v½ indicates that the oxidation process is a diffusion-controlled electron transfer process.
3.4 Effect of pH
The pH of the buffer solution has an important effect on both the oxidation potential and current of TFLP. CV is used to study the pH-dependent behavior of 1.0 mM TFLP oxidation (Fig. 3). The oxidation peak current (Ip) increases with pH up to 7.0, then there is a decrease in current as shown in (Fig. 3; inset A). Fig. 3; inset B represents the variation of peak oxidation potential (Ep) as a function of electrolyte pH, the oxidation peak potential decreases with an increase in pH. The pKa value of TFLP compound is 8.1, it is protonated at low pH.35 In acidic media at (pH = 3, 5) two-steps oxidation of TFLP is favored36 as it appeared as two oxidation peaks but at pH = 7.0, a one-step oxidation is favored, and one oxidation peak appeared (Fig. 3).37 The TFLP contains a tertiary amine in its molecular structure, this is a basic center with the availability of non-bonding electrons as donor. So, it can be assumed that oxidation is located on the nitrogen of the piperazine ring.38 In acidic medium at (pH = 3, 5), it loses an electron to form a cation radical and this cation radical loses a proton and electron in subsequent steps to form a quaternary Schiff base.39 The quaternary Schiff base was rapidly hydrolyzed to the secondary amine and formaldehyde.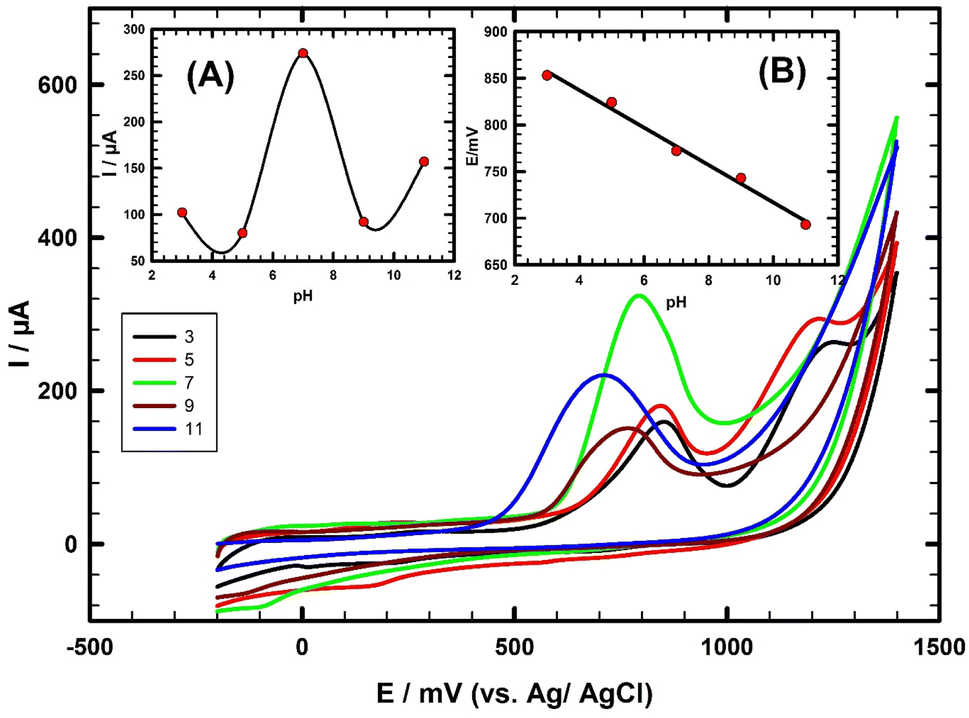 | ||
| Fig. 3 CVs of 1.0 mM TFLP/0.1 M PBS with different pH; scan rate is 50 mV s−1 using GC/GRO-CNT/Fe–Ni electrode. (Inset A) Relation between oxidation peak current and pH. (Inset B) Relation between oxidation peak potential and pH. | ||
To identify the responsible group of the oxidation steps, the oxidation of TFLP was compared with some model compounds in the literature such as trazodone, flunarizine, nefazodone, quetiapine, and sildenafil citrate.38,40–43 For all the compounds, oxidation is included in the piperazine ring which suggests an identical mechanism. For an example the oxidation steps of nefazodone are located on the piperazine moiety, which represents a typical redox system with two electron oxidation processes in acidic and basic media.38 We may postulate that when the aliphatic nitrogen of the piperazine moiety, at a relative long distance from the benzene ring of the molecule, is protonated, oxidation occurs on the nearer nitrogen. This mechanism and all the obtained results agree with reported data concerning anodic voltammetry of trazodone at glassy carbon and carbon paste electrodes.38 Nefazodone, piribedil, and trazodone are oxidized over most of the pH range in a single peak. The peak potentials shift with increasing pH to less positive potentials similarly as the potential of quetiapine, and became pH-independent at pH higher than 6.0.42 In sildenafil citrate the monoprotonated form of the piperazine ring is oxidized at pH < 6.0 with the same mechanism.41,43 At pH = 7.0, one oxidation peak is obtained because of one-step oxidation (Fig. 3). Thus, at pH = 7.0 one electron is involved in the oxidation of TFLP (the N-atom in phenothiazine ring converted to cationic radical N-atom).37 At pH > 7.0 the current decreases as the protonation degree decreases with increasing pH, TFLP becomes neutral, and its accumulation at the composite surface becomes difficult.44 Thus, PBS of pH 7.0 is used for sensing TFLP in this work.
3.5 Reproducibility and stability
The current responses of 1.0 mM TFLP/0.1 M PBS/pH 7.0 at three different electrodes prepared independently under similar construction conditions are investigated to determine the fabrication reproducibility of the sensor. Acceptable fabrication reproducibility is obtained as the value of RSD is 2.32%. CV is used to examine the current response stability of the sensor toward TFLP oxidation. The sensor shows good stability after 25 runs in 1.0 mM TFLP as shown in ESI Fig. 4,† and for long term stability of one month, the electrochemical response of the electrode maintains 95.8% of its initial current value. Thus, the current response stability of the sensor is attributed to the composite materials stability.3.6 Robustness
The robustness of this method is evaluated upon the impact of minor alterations in the experimental conditions. The studied parameters are time before running the experiment (2 minutes ± 20 s) and pH change (7.0 ± 0.2). The relative standard deviations are 1.33% and 2.46%, respectively confirm the steadiness of the current response stability.| Ip (μA) = 3.602C (μM) + 8.027, R2 = 0.998 | (2) |
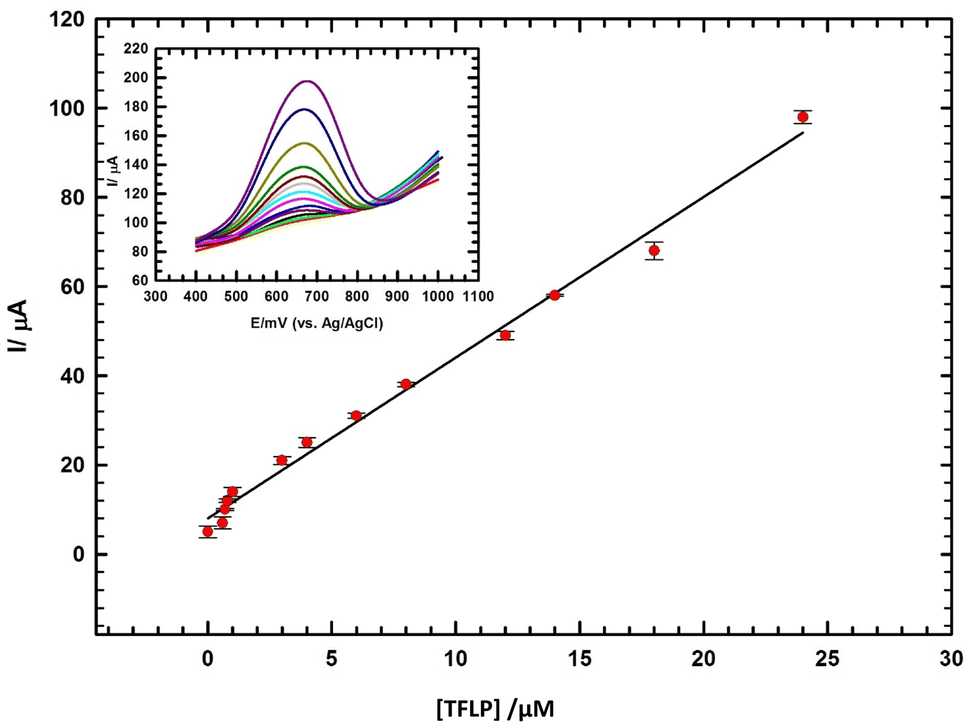 | ||
| Fig. 4 Calibration of TFLP (concentration range: 0.008 μM to 24 μM) in diluted serum/0.1 M PBS (pH 7.0); inset: the corresponding DPVs using GC/GRO-CNT/Fe-Ni electrode. | ||
The DL and QL are 1.06 nM and 3.52 nM, respectively. DL and QL are determined according to (S/N = 3).46 The performance of the sensor for TFLP detection is compared with other cited modified sensors.2,3,37,44,47–49 The sensor offers reasonable linear range for TFLP detection, DL lower than other used modified electrodes with good stability and accuracy as illustrated in ESI Table 2.† Thus, the sensor can be acceptably applied for the determination of TFLP levels in serum samples.
| Ip (μA) = 2.932CDA (μM) + 2.896, (R2 = 0.990) | (3) |
| Ip (μA) = 2.268CTFLP (μM) + 12.05, (R2 = 0.995) | (4) |
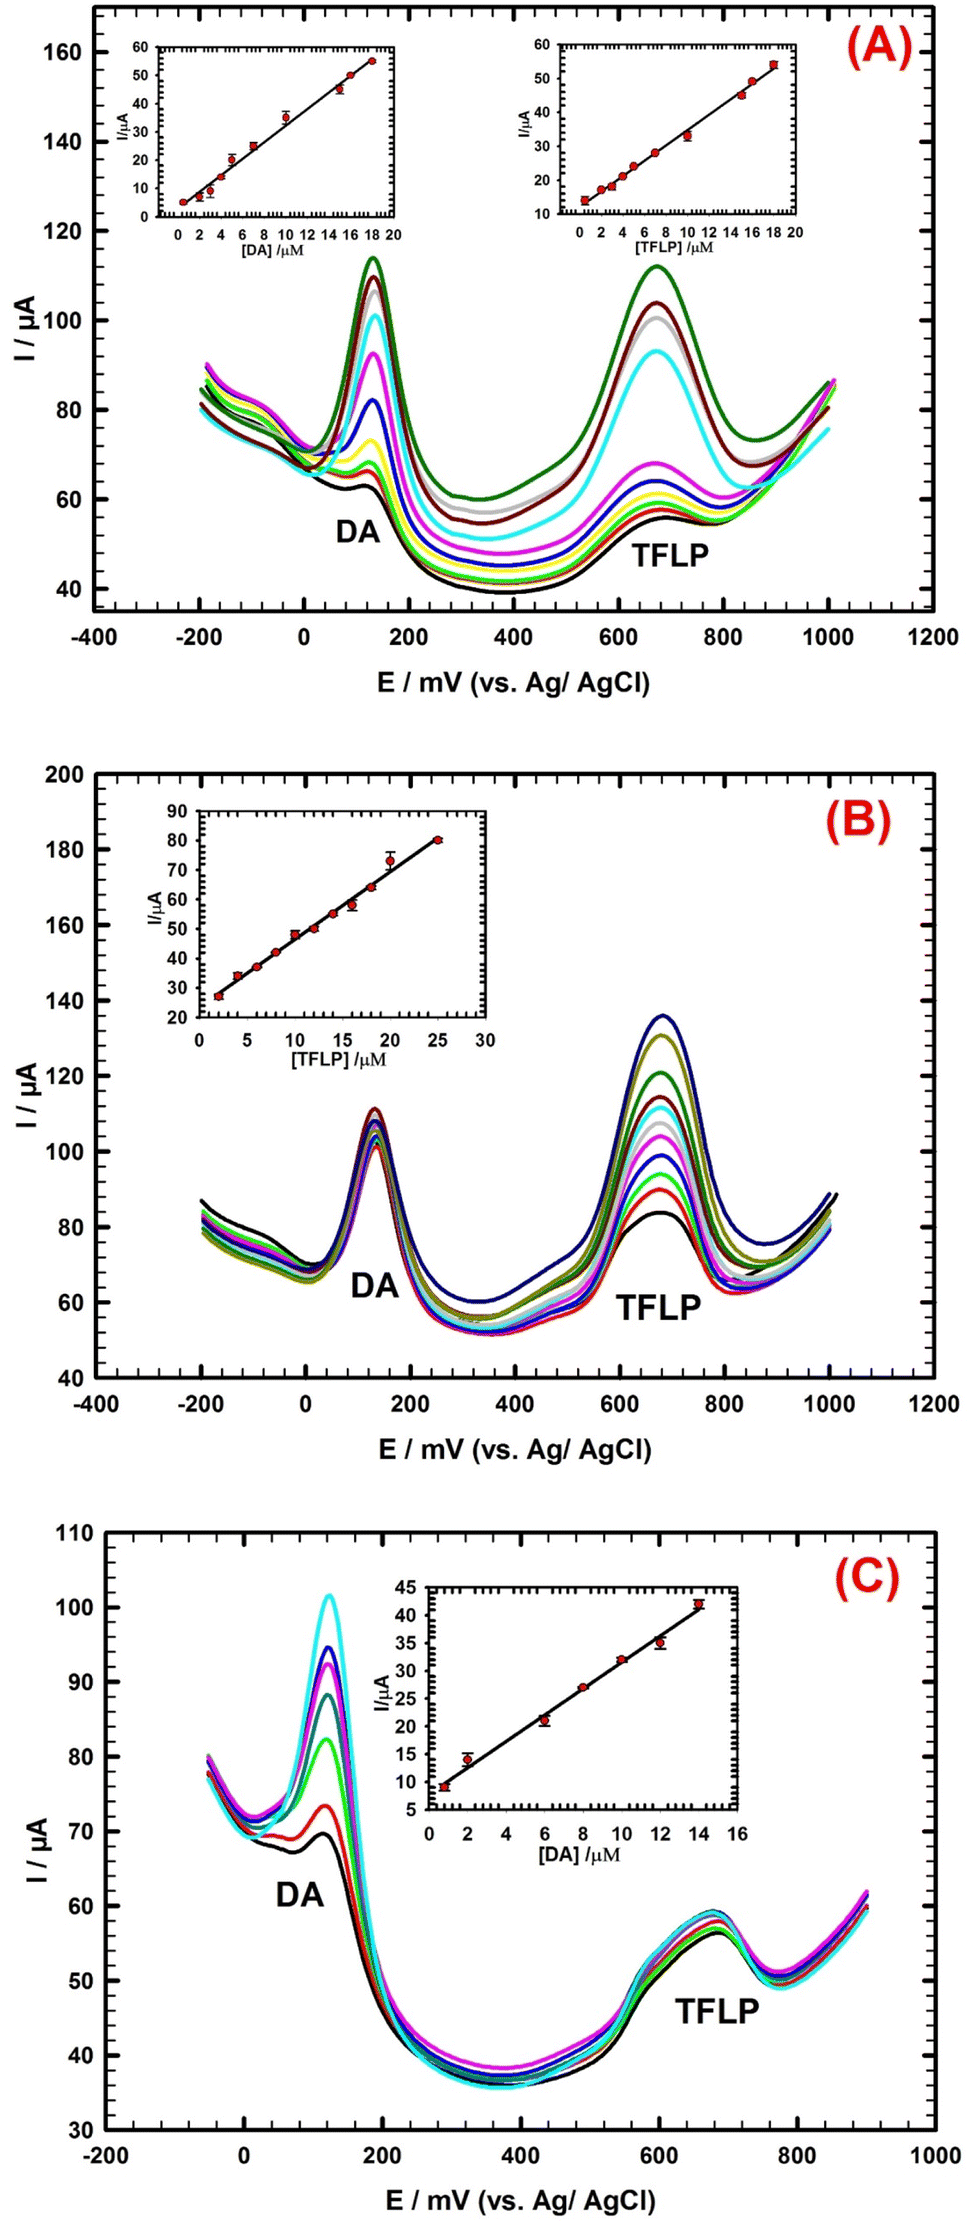 | ||
| Fig. 5 (A) DPVs of simultaneous determination of DA and TFLP in the same concentration range from 0.5 μM to 18 μM in diluted serum/0.1 M PBS pH 7.0; inset: the corresponding calibration curve for DA and TFLP. (B) DPVs of TFLP (concentration range from 2 μM to 25 μM) in presence of constant concentration 14 μM of DA in diluted serum/0.1 M PBS pH 7.0; inset: the corresponding calibration curve for TFLP. (C) DPVs of DA (concentration range from 0.8 μM to 14 μM) in presence of constant concentration 2 μM of TFLP in diluted serum/0.1 M PBS pH 7.0; inset: the corresponding calibration curve for DA. | ||
The DLs are 0.13 μM and 0.32 μM, respectively.
Another electroanalytical study is performed to evaluate the possible mutual interference from separation of a mixture of DA and TFLP. In this part we investigate whether the presence of one compound affects the detection of another compound. The concentration of TFLP compound is changed in the range (2 → 25 μM) while the concentration of DA compound is remained constant at (14 μM) as shown in Fig. 5B. The TFLP peak current responses increased linearly with the increase of its corresponding concentrations (Fig. 5B; inset). The regression eqn (5) for the linear relation of TFLP is:
| Ip (μA) = 2.297CTFLP (μM) + 23.4, (R2 = 0.992) | (5) |
Fig. 5C shows another study for TFLP and DA, the concentration of TFLP is remained constant at (2 μM) and the DA concentration is changed in the range (0.8 → 14 μM). The DA peak current responses increased linearly with the increase of its corresponding concentrations (Fig. 5C; inset). The regression eqn (6) for the linear relation of DA is:
| Ip (μA) = 2.374CDA (μM) + 7.808, (R2 = 0.995) | (6) |
3.7 Recovery
Recovery experiments are carried out by standard additions of TFLP in diluted human serum sample to study the accuracy of the proposed method. By comparing the calculated concentrations for the studied sample (from calibration curve) with the added concentrations, the recovery percentages are determined. The analysis for each added concentration in the sample is repeated three times. Table 1 lists the obtained results. The recovery and RSD values are in the range of (99.04% to 102.7%) and (0.72% to 1.6%) respectively, demonstrating a good accuracy of the used method.| Concentration added (μM) | Concentration found (μM) | Recovery (%) | Standard deviation (×10−8) | Standard error (×10−8) | Confidence level (×10−8) | RSD (%) |
|---|---|---|---|---|---|---|
| 0.2 | 0.204 | 101.79 | 0.131 | 0.075 | 0.324 | 1.609 |
| 0.4 | 0.411 | 102.71 | 0.106 | 0.061 | 0.262 | 1.214 |
| 0.8 | 0.818 | 102.27 | 0.110 | 0.063 | 0.273 | 1.110 |
| 4 | 3.961 | 99.04 | 0.142 | 0.082 | 0.352 | 0.748 |
| 10 | 9.942 | 99.42 | 0.263 | 0.152 | 0.651 | 0.724 |
3.8 Determination of TFLP in pharmaceutical samples
In this section we evaluate the proposed method for the determination of pure TFLP content in commercial capsules without interference from excipient materials. An oral capsule containing TFLP (5 mg per capsule) is ground into fine powder and then dissolved in a buffer solution (pH 7.0) with a starting concentration of 0.5 mM. The TFLP amount in the sample solution is determined by the addition method. In the electrolytic cell we inject a standard with concentration 2.0 μM by micro-syringe. Then aliquots of the TFLP capsule sample solution are prepared with concentrations ranging from 0.5 μM to 8.0 μM and injected into the electrolytic cell. We use the following equation to calculate the concentration of the sample: [standard (2 μM)] + [capsule content solution added (0.5 μM to 8.0 μM)]. DPV mode is used to estimate the percentage values of recovery. The found concentrations are calculated from the average of three repeated measurements for every added amount and are summarized in Table 2. The corresponding recovery values are in the range (97.70%–102.4%) and the RSD values are in the range (0.120%–1.917%) for quantitative determination of TFLP in commercial capsule samples, indicating that the proposed method has a good accuracy.| [Tablet] taken (μM) | [Standard] added (μM) | [Found] (μM) | Recovery (%) | RSD (%) |
|---|---|---|---|---|
| 0.5 | 2 | 2.55 | 101.8 | 0.916 |
| 0.8 | 2 | 2.87 | 102.4 | 0.332 |
| 3 | 2 | 4.92 | 98.50 | 1.917 |
| 6 | 2 | 7.82 | 97.70 | 1.799 |
| 8 | 2 | 9.90 | 99.02 | 0.120 |
3.9 Interference study
| Ip (μA) = 2.815CTFLP (μM) + 14.31, (R2 = 0.991) | (7) |
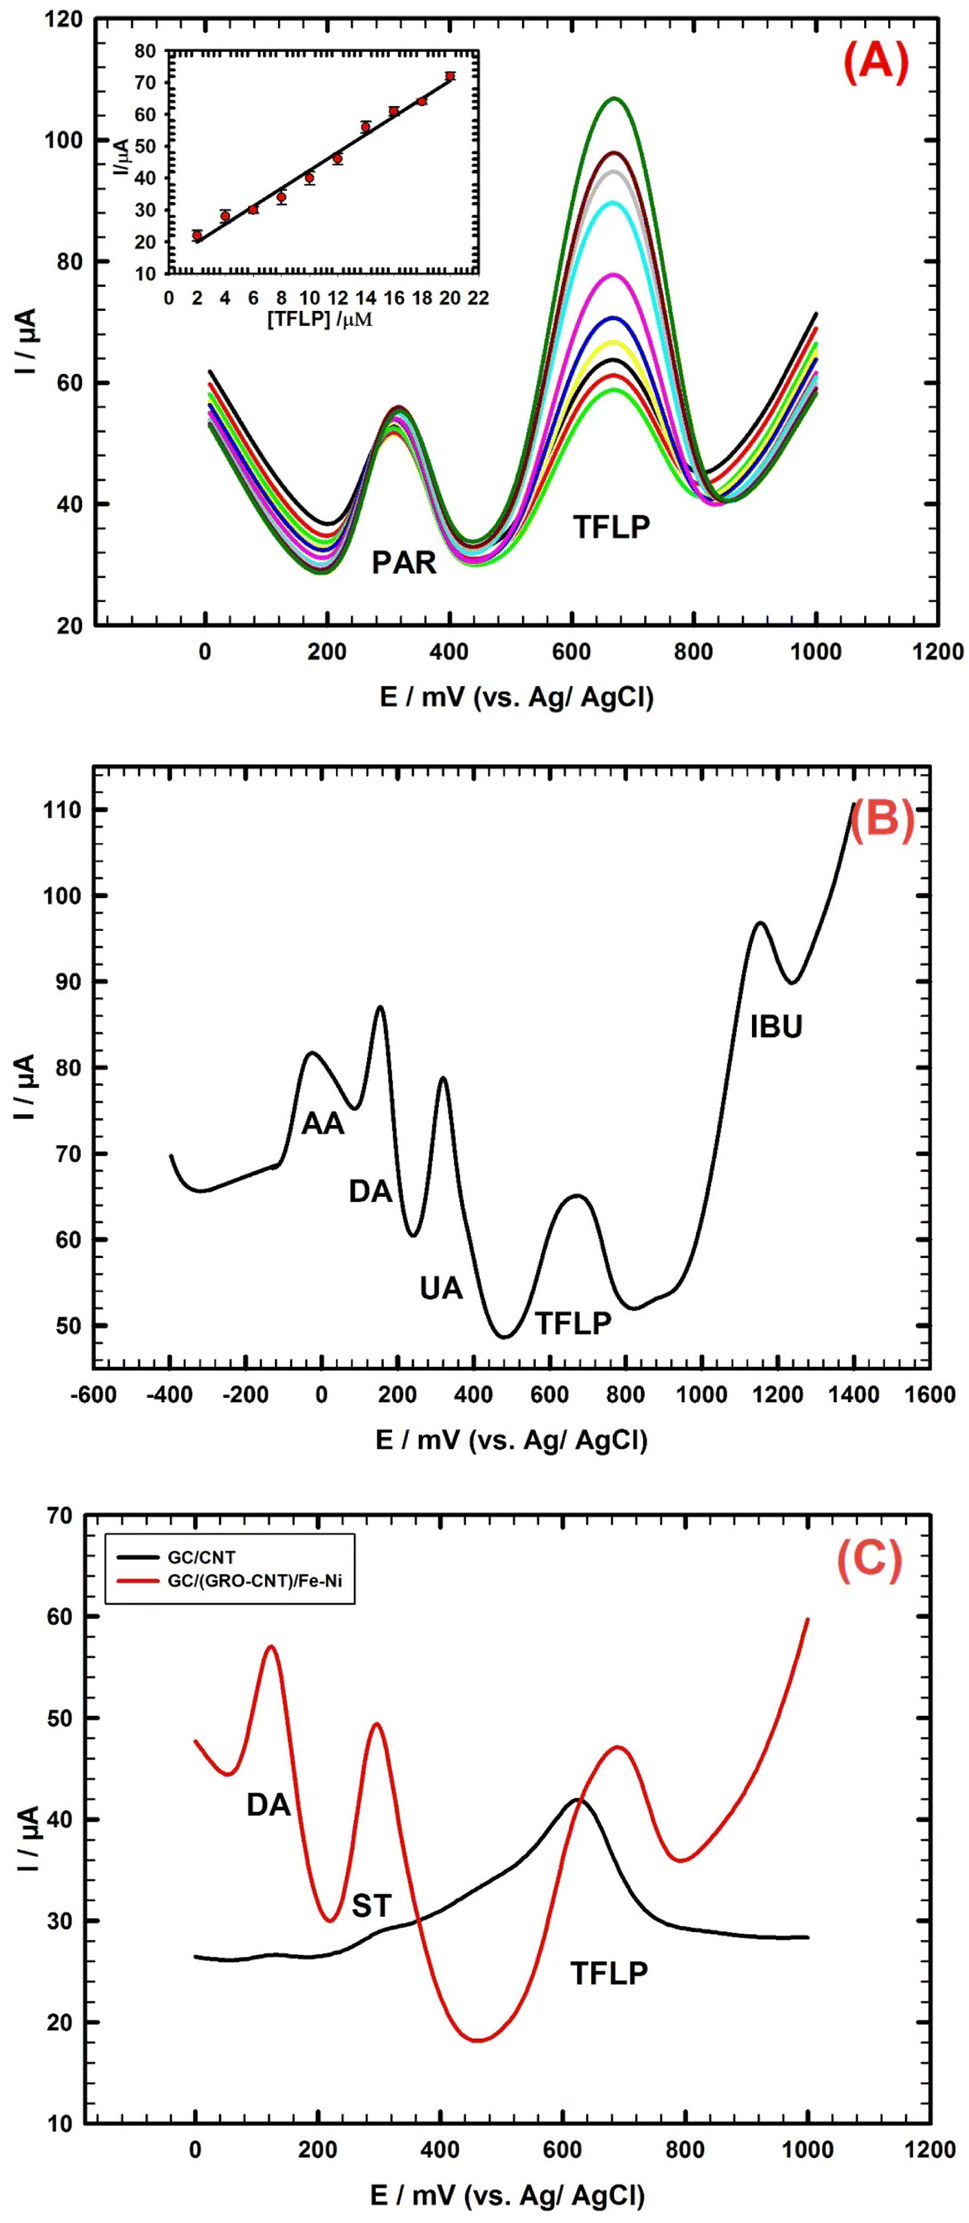 | ||
| Fig. 6 (A) DPVs of TFLP (concentration range from 2 μM to 20 μM) in presence of constant concentration 4 μM of PAR in 0.1 M PBS pH 7.0; inset: the corresponding calibration curve for TFLP. (B) DPV of quinary mixture containing AA (800 μM), DA (8 μM), UA (12 μM), TFLP (2 μM), and IBU (24 μM) at GC/GRO-CNT/Fe–Ni in 0.1 M PBS/pH 7.0. (C) DPVs of ternary mixture containing 10 μM DA, 20 μM ST and 3 μM TFLP at GC/CNT, and GC/GRO-CNT/Fe–Ni in 0.1 M PBS/pH 7.0. | ||
Ibuprofen is a nonsteroidal anti-inflammatory drug commonly used to relieve pain, reduce fever, and decrease inflammation. Fig. 6B shows five separated and clearly defined oxidation peaks for a quinary mixture of AA, DA, UA, TFLP and IBU. The concentrations are as follows: AA (800 μM), DA (8 μM), UA (12 μM), TFLP (2 μM), and IBU (24 μM). Simultaneous detection of these species is successfully achieved. Further, monitoring the level of the TFLP drug in presence of other species can aid in the diagnosis and treatment of certain medical conditions.
It is important to measure the dopamine level in the presence of TFLP. This measurement can help evaluate the effectiveness of TFLP in treating mental health conditions such as schizophrenia, which is resulted from imbalance of dopamine and other neurotransmitters such as serotonin. Therefore, using an electrochemical sensor can be a useful tool in developing an effective treatment for patients with mental health conditions such as dopamine dysregulation.
Fig. 6C indicates the DPV pattern of a ternary mixture containing 10 μM DA, 20 μM ST, and 3 μM TFLP analyzed at two different types of electrodes: GC/GRO-CNT/Fe–Ni and GC/CNT. At the GC/GRO-CNT/Fe–Ni sensor, three separated and clearly defined oxidation peaks are observed however, at the GC/CNT electrode, overlapped and undefined peaks are obtained. This demonstrates that the GC/GRO-CNT/Fe–Ni electrode is effective in separating and detecting the individual components of the ternary mixture compared to the GC/CNT electrode.
4. Conclusions
A novel electrochemical method is applied to determine TFLP and DA in real human serum samples. The sensor is constructed by casting two consecutive thin layers of GRO-CNT and Fe–Ni nanoparticles over a GC electrode surface. This increases the composite surface area, the contact area with the TFLP drug, and improves the electrocatalytic behavior of the composite. Thus, good synergism between the components of the GRO-CNT/Fe–Ni nanocomposite improves the performance of the sensor. The significant enhancement in the sensitivity of the GRO-CNT/Fe–Ni nanocomposite towards TFLP determination results in enhancement of the kinetic process and increase of the oxidation peak current up to 556 μA. The sensor in serum sample shows excellent catalytic effect for simultaneous determination of TFLP and DA in the same concentration range (0.5 → 18 μM) with low DLs 0.13 μM and 0.32 μM respectively. Moreover, the constructed sensor displays excellent reproducibility, good sensitivity, acceptable stability, and suitable recovery for TFLP in serum samples. Further, the sensor is capable of reliably detecting TFLP in clinical trial samples and pharmaceutical formulations.Conflicts of interest
The authors declare that they have no known competing financial interests or personal relationships that could have appeared to influence the work reported in this paper.Acknowledgements
The authors would like to acknowledge the research facilities provided from Cairo University.References
- A. Sangili, R. Sakthivel and S. M. Chen, Anal. Chim. Acta, 2020, 1131, 35–44 CrossRef CAS PubMed.
- B. Dogan-Topal, J. Solid State Electrochem., 2013, 17, 1059–1066 CrossRef CAS.
- M. Ognjanović, D. M. Stanković, M. Jović, M. P. Krstić, A. Lesch, H. H. Girault and B. Antić, ACS Appl. Nano Mater., 2020, 3, 4654–4662 CrossRef.
- R. Khoshraftar, M. Reza Shishehbore and A. Sheibani, J. Electroanal. Chem., 2022, 926, 116945 CrossRef CAS.
- N. nan Song, Y. zhu Wang, X. yun Yang, H. long Zong, Y. xian Chen, Z. Ma and C. xiang Chen, J. Electroanal. Chem., 2020, 873, 114352 CrossRef.
- M. Jaber, S. W. Robinson, C. Missale and M. G. Caron, Neuropharmacology, 1996, 35, 1503–1519 CrossRef CAS PubMed.
- N. F. Atta and M. F. El-Kady, Sens. Actuators, B, 2010, 145, 299–310 CrossRef CAS.
- N. F. Atta, M. F. El-Kady and A. Galal, Anal. Biochem., 2010, 400, 78–88 CrossRef CAS PubMed.
- J. M. Dhabab, S. A. H. Al-Ameri and A. H. Taufeeq, J. Assoc. Arab Univ. Basic Appl. Sci., 2013, 13, 14–18 Search PubMed.
- V. Bezawada, P. Mogili, S. Dodda, R. Gajula and S. Ponnada, Biomed. Chromatogr., 2022, 36, e5499 CrossRef CAS PubMed.
- A. M. Hussein and N. S. Othman, Israa Univ. J. Appl. Sci., 2023, 6, 56–70 CrossRef.
- T. Perez-Ruiz, C. Martinez-Lozano, V. Tomas and C. S. De Cardona, Talanta, 1993, 40, 1361–1365 CrossRef CAS PubMed.
- N. F. Atta, Y. M. Ahmed and A. Galal, J. Electroanal. Chem., 2018, 823, 296–306 CrossRef CAS.
- A. R. M. El-Gohary, A. Galal and N. F Atta, ChemistrySelect, 2023, 8(31), e202301922 CrossRef CAS.
- M. A. Mohamed, N. S. Abdelwahab and C. E. Banks, Anal. Methods, 2016, 8, 4345–4353 RSC.
- N. F. Atta, S. A. Abdel Gawad, E. H. El-Ads, A. R. M. El-Gohary and A. Galal, Sens. Actuators, B, 2017, 251, 65–73 CrossRef CAS.
- Y. Guo, B. Wu, H. Liu, Y. Ma, Y. Yang, J. Zheng, G. Yu and Y. Liu, Adv. Mater., 2011, 23, 4626–4630 CrossRef CAS PubMed.
- X. Liu, L. Y. Lin, F. Y. Tseng, Y. C. Tan, J. Li, L. Feng, L. Song, C. F. Lai, X. Li, J. H. He, R. Sakthivel and R. J. Chung, Analyst, 2021, 146, 4066–4079 RSC.
- S. Zhang, Y. Shao, H. G. Liao, J. Liu, I. A. Aksay, G. Yin and Y. Lin, Chem. Mater., 2011, 23, 1079–1081 CrossRef CAS.
- X. Liu, R. Sakthivel, Y. C. Chen, N. Chang, U. Dhawan, Y. Li, G. Zhao, C. Lin and R. J. Chung, J. Mater. Chem. B, 2020, 8, 7539–7547 RSC.
- R. Sakthivel, J. H. He and R. J. Chung, J. Hazard. Mater., 2022, 424, 127378 CrossRef CAS PubMed.
- V. Vinothkumar, R. Sakthivel, S. M. Chen, T. H. Kim, M. Abinaya, S. Kubendhiran and G. Gopu, J. Food Compos. Anal., 2022, 111, 104628 CrossRef CAS.
- X. Gao, R. Gui, H. Guo, Z. Wang and Q. Liu, Sens. Actuators, B, 2019, 285, 201–208 CrossRef CAS.
- R. Harpeness and A. Gedanken, Langmuir, 2004, 20, 3431–3434 CrossRef CAS PubMed.
- G. N. Flint, J. W. Oldfield and D. P. Dautovich, Shreir’s Corros., 2010, 1789–1801 Search PubMed.
- F. Christien, Materials, 2020, 13, 539 CrossRef CAS PubMed.
- N. Cai, H. Yang, X. Zhang, S. Xia, D. Yao, P. Bartocci, F. Fantozzi, Y. Chen, H. Chen and P. T. Williams, Waste Manage., 2020, 109, 119–126 CrossRef CAS PubMed.
- P. Acharya, Z. J. Nelson, M. Benamara, R. H. Manso, S. I. P. Bakovic, M. Abolhassani, S. Lee, B. Reinhart, J. Chen and L. F. Greenlee, ACS Omega, 2019, 4, 17209–17222 CrossRef CAS PubMed.
- E. Cottancin and M. Pellarin, Nanoalloys From Fundam. to Emergent Appl., 2013, pp. 203–245 Search PubMed.
- B. Rajeswari, B. Sravani, M. Cheffena, R. Janraj Naik, Y. Veera Manohara Reddy, G. Madhavi, K. V. N. Suresh Reddy and M. Jong Kim, Inorg. Chem. Commun., 2023, 151, 110627 CrossRef CAS.
- C. V. Raju, Y. V. Manohara Reddy, C. H. Cho, H. H. Shin, T. J. Park and J. P. Park, Food Chem., 2023, 428, 136811 CrossRef CAS PubMed.
- H. Liang, C. Chen, J. Zeng, M. Zhou, L. Wang, G. Ning, Q. Duan, R. Han, H. Liu, H. Zhao and C. P. Li, ACS Appl. Nano Mater., 2022, 5, 16774–16783 CrossRef CAS.
- A. Galal, H. K. Hassan, N. F. Atta, A. M. Abdel-Mageed and T. Jacob, Sci. Rep., 2019, 9, 1–13 CrossRef CAS PubMed.
- A. K. Mishra and S. Ramaprabhu, Desalination, 2011, 282, 39–45 CrossRef CAS.
- B. Dogan-Topal, J. Solid State Electrochem., 2013, 17, 1059–1066 CrossRef CAS.
- D. Stanković, T. Dimitrijević, D. Kuzmanović, M. P. Krstić and B. B. Petković, RSC Adv., 2015, 5, 107058–107063 RSC.
- V. Vinothkumar, C. Koventhan and S. M. Chen, J. Alloys Compd., 2021, 882, 160682 CrossRef CAS.
- J. M. Kauffmann, J. C. Vire, G. J. Patriarche, L. J. Nunez-Vergara and J. A. Squella, Electrochim. Acta, 1987, 32, 1159–1162 CrossRef CAS.
- O. M. Popa and V. C. Diculescu, Electrochim. Acta, 2013, 112, 486–492 CrossRef CAS.
- B. Uslu, N. Yilmaz, N. Erk, S. A. Özkan, Z. Sentrük and I. Biryol, J. Pharm. Belg., 1998, 53, 263 Search PubMed.
- B. Uslu and S. A. Özkan, Anal. Chim. Acta, 2002, 462, 49–57 CrossRef CAS.
- S. A. Ozkan, B. Dogan and B. Uslu, Microchim. Acta, 2006, 153, 27–35 CrossRef CAS.
- S. A. Özkan, B. Uslu and P. Zuman, Anal. Chim. Acta, 2004, 501, 227–233 CrossRef.
- G. Jin, F. Huang, W. Li, S. Yu, S. Zhang and J. Kong, Talanta, 2008, 74, 815–820 CrossRef CAS PubMed.
- Validation of Analytical Procedures: Text and Methodology, ICH Harmonised Tripartite GuidelineI, International Conference on Harmonisation of Technical Requirements for Registration of Pharmaceuticals for Human Use, IFPMA, Geneva, 2005, pp. 11–12 Search PubMed.
- N. F. Atta, A. Galal, Y. M. Ahmed and M. G. Abdelkader, Electroanalysis, 2021, 33, 1510–1519 CrossRef CAS.
- M. A. Mohamed, A. S. Saad, S. H. Koshek and M. R. El-Ghobashy, New J. Chem., 2018, 42, 9911–9919 RSC.
- D. Stanković, T. Dimitrijević, D. Kuzmanović, M. P. Krstić and B. B. Petković, RSC Adv., 2015, 5, 107058–107063 RSC.
- F. Huang, Q. P. Yan and B. Z. Zeng, Wuhan Univ. J. Nat. Sci., 2005, 10, 435–440 CrossRef CAS.
Footnote |
| † Electronic supplementary information (ESI) available. See DOI: https://doi.org/10.1039/d3ra04334g |
| This journal is © The Royal Society of Chemistry 2023 |