DOI:
10.1039/D3RA04322C
(Paper)
RSC Adv., 2023,
13, 24867-24877
A novel stilbazolium derivative crystals of 4-[2-(4-dimethyl amino-phenyl)-vinyl]-1-methyl-pyridinium+ bromide− (DMSB) single crystal: exploration of the growth, molecular structure, linear optical, and third order nonlinear properties†
Received
28th June 2023
, Accepted 4th August 2023
First published on 22nd August 2023
Abstract
A novel third-order stilbazolium derivative single crystal, 4-[2-(4-dimethyl amino-phenyl)-vinyl]-1-methyl-pyridinium bromide (DMSB), was fruitfully harvested using methanol as a medium, through a slow evaporation technique. The solubility of the prepared DMSB powder was experimentally tested at different temperatures (30 °C to 50 °C) with a methanol solvent. Single crystal X-ray diffraction analysis (SCXRD) implied that the DMSB crystal crystallized in a centrosymmetric fashion (space group P21/c) with the monoclinic crystal system. The molecular weight of the element present in DMSB was confirmed by CHN elemental analysis. Nuclear magnetic resonance (NMR) spectroscopic study confirmed the molecular structure of the DMSB crystal. All the functional group vibrations raised from the title compound were studied using Fourier transform infrared spectroscopy (FTIR). From the UV-visible spectrum, the absorbance nature and band gap of the grown DMSB crystal were determined. The photoluminescence study of the grown crystal exhibited an emission peak at 660 nm, which is attributed to the red light emission in the EM spectrum. The morphological characteristics of the crystal were characterized using atomic force microscopy (AFM). Hirshfeld surface analysis was employed to quantitatively explore the non-covalent interactions that are accountable for the crystal packing. The third-order nonlinear susceptibility was determined experimentally and it was found to be 1.6 × 10⁻⁸ esu. These favourable Z-scan analysis results indicate that the DMSB crystal is a good candidate for different applications, such as photonics devices, optical computing, optical switches, and optical limiting.
1 Introduction
Recently, nonlinear optical (NLO) materials that are capable of converting frequency are of great interest to a lot of researchers across the globe owing to their applications, such as optical memories, optical switches, optical modulation, laser sensing, image processing, photonic devices, telecommunication, and frequency conversion.1–4 Therefore, new nonlinear optical materials are required to satisfy the day-to-day technical requirements.5 Numerous efforts have been made in the past to create a novel organic material having significant nonlinear properties. The selection criteria for a novel material completely depends on the physical properties exhibited by the material.6 Many organic compounds with delocalised π conjugation systems have been identified as a potential replacement for already existing inorganic compounds.7 Organic materials have strong physical and chemical properties owing to the delocalization of the π electrons within the structure, and they also exhibit large birefringence.8 In addition, the presence of weak van der Waals contacts and hydrogen bonds also helps to boost the nonlinearity of the materials.9 Also, organic materials possess various special features, such as tunability of the structure, ultra-fast optical response, and substantial electro-optical coefficient.10 Among the various nonlinear optical crystal derivatives explored in the past, stilbazolium derivative materials have a very special place in NLO crystals owing to their higher NLO efficiency. DAST is one of the stilbazolium derivative crystals, which is an effectual material for high-speed electro-optic applications.11 Also, the DAST crystal is capable of generating and detecting THz waves. The SHG efficacy of the DAST crystal is 1000 times higher than that of the standard urea crystal.12 Recently reported research proves that many stilbazolium derivative crystals were possible by altering the structure. This can be achieved by incorporating different anions with the stilbazolium cation; consequently, new crystals with high non-linear properties can be achieved.13 Among the stilbazolium derivatives, a few of the notable crystals are: 4-N,N-dimethylamino-4-N-methyl stilbazolium p-amino benzene sulfonate (DSAS) and 4-N,N-dimethyl amino-4-N-methyl stilbazolium p-dimethyl amino benzene sulfonate (DSMAS).14,15 By incorporating p-methoxy benzene sulfonate as a counter anion, a new crystal (DSMOS) was reported and its SHG efficacy was almost equal to that of DAST.13 The above report indicated that the nonlinear behaviour of the material can be altered by the inclusion of a new counter anion. As such, researchers have carefully incorporated different sizes of counter anions with stilbazolium compounds to study the impact of counter anions.16 It has been established that altering the counter-ion results in the enhancement of crystal packing and aligns the dipole as parallel as feasible, which is a successful molecular engineering technique for creating new ionic organic crystals with high NLO efficiency.17,18 This higher nonlinearity in this derivative is primarily due to the charge transfer mechanism in the cation. The active stilbazolium chromophore in the cation leads to this mechanism through the electron donor and acceptor group (D–π–A).19 In the crystal structure, the role of the cation is to induce nonlinearity in the structure, whereas the role of the counter-anion is to regulate the packing of the crystal through coulombic interactions.20 This research work mainly focuses on the growth of a novel stilbazolium derivative 4-[2-(4-diethylamino-phenyl)-vinyl]-1-methyl-pyridinium bromide (DMSB) single crystals, which was reported for the very first time in this work. The crystal structure of the novel DMSB crystal was solved and submitted to the CCDC database. In addition to this, various properties of the title crystal were studied through different characterizations techniques such as single crystal X-ray diffraction studies (SCXRD), CHN analysis, nuclear magnetic resonance spectroscopy (NMR), Fourier transform infrared spectroscopy (FTIR), ultraviolet-visible near infrared spectroscopy (UV-VIS-near IR), photoluminescence, atomic force microscopy analysis (AFM) and Hirshfeld surface analysis. The third-order nonlinear optical susceptibility of the grown crystal was thoroughly examined with the Z-scan method and the results are discussed in the final section of the discussion part. All the outcomes suggest that the new DMSB crystal is a possible candidate for various optical and nonlinear optical (NLO) applications.
2 Experimental methods
2.1 Material and synthesis
All the required high-purity components were obtained from the Tokyo Chemical Industry. They were used as received without any further purification. The general synthesis process and reactions involved in the synthesis are shown in Fig. 1.
2.1.1. 1,4-Dimethylpyridinium bromide (1). 1,4-Dimethylpyridinium-bromide (1) was synthesized by mixing an equal amount of 4-methyl pyridine (purity 98%, 20 mmol–2 ml) and methyl bromide (purity 98%, 20 mmol–1.3 ml) in acetone (30 ml). The mixture solution was refluxed for 2 h and allowed to cool at room temperature. Then, the mixture was filtered and the settled precipitates were dried in an oven. As a result, 1,4-dimethylpyridinium bromide (1) was obtained.
2.1.2. 4-[2-(4-Dimethylamino-phenyl)-vinyl]-1-methyl-pyridinium bromide (2). 1,4-Dimethylpyridinium bromide 1 (10 mmol–2.35 g) and 4-dimethylamino benzaldehyde (10 mmol–1.49 g) were taken in a hot methanol (30 ml) medium and a few drops of piperidine catalyst (10 mmol–0.98 ml) was added. The mixture was transferred into a 250 ml round-bottom flask and refluxed for 12 h. The resulting purple precipitate was filtered using Whatman filter paper and the resultant powder was washed thrice with diethyl ether to eradicate the unreacted initial materials. Then, the obtained purple precipitate was dried in an oven. The last refined product of 4-[2-(4-dimethylamino-phenyl)-vinyl]-1-methyl-pyridinium bromide (2) was obtained. Fig. 1 represents the chemical reaction scheme of the DSMB crystal.
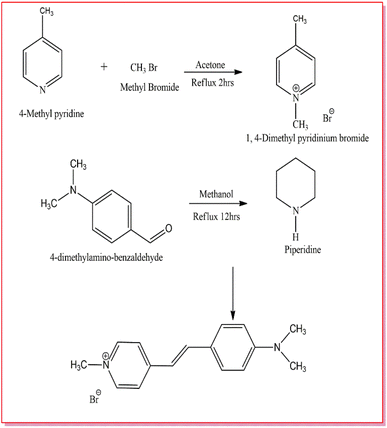 |
| | Fig. 1 Synthesis of DMSB. | |
2.2 Solubility and crystal growth
In order to grow a single crystal with good optical quality, details on the solubility of the material are a must.21 To evaluate it, solubility studies were carried out. The solubility of the synthesized DMSB powder was measured at different temperatures (30–50 °C). Initially, five different solvents were used for the analysis, among them in methanol solvent, DMSB powder showed high solubility. As such, with methanol as a solvent, a solubility study was performed for five various temperatures, starting from 30–50 °C at 5 °C intervals. With the aid of ultra-cryostat (±0.01 °C), the temperature (30 °C) was maintained constantly and the solution was stirred continuously using a magnetic stirrer. The purified DMSB salt was added to the 100 ml methanol solution, step by step until the supersaturation condition was achieved. The gravimetric estimation method was used to determine the equilibrium concentration of the solute's supernatant liquid. In this study, an analytical balance was used to weigh the solute and solvent masses (accuracy ± 0.0001 g). For the remaining four temperatures (35–50 °C), the same process was repeated. The solubility curve of the DMSB powder with respect to different temperatures is portrayed in Fig. 2. It is obvious from the graph that the solubility of DMSB increases dramatically with the rise in temperature.22 A slow evaporation method was used for the growth of DMSB crystals in a methanol solvent. After 25 days of the growth period, good quality single crystal of dimension 2.3 × 0.2 × 0.1 cm3 was grown. The images of the grown DMSB crystal are shown in Fig. 3.
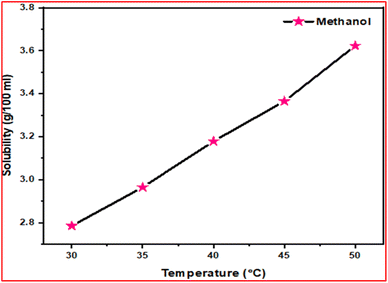 |
| | Fig. 2 Solubility curve of DMSB crystal. | |
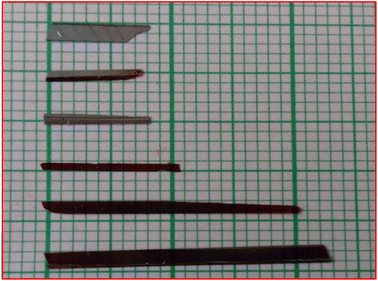 |
| | Fig. 3 Image of the grown DMSB crystals. | |
3 Results and discussion
3.1 Structural studies
3.1.1 Single crystal XRD. The structure of the novel DMSB crystal was confirmed through single-crystal XRD analysis. The acquired raw crystal data of the DMSB crystal was resolved with the aid of Apex 4 software. The SHELXL function was used to position the atoms other than the hydrogen atom in the structure through the full-matrix least-squares refinement method.23 The calculated lattice parameter values of the grown DMSB crystal are a = 6.3288(5) Å, b = 7.7010(6) Å, c = 32.103(3) Å, α = 90°, β = 90.396(2)°, γ = 90°, V = 1564.6(2) Å3. The grown DMSB single crystal belongs to the centrosymmetry space group P21/c and is crystalized in a monoclinic crystal system. The refined crystallographic data for 4-[2-(4-dimethyl amino-phenyl)-vinyl]-1-methyl-pyridinium bromide (DMSB) crystal is tabulated in Table 1. Selected bond lengths and bond angles are given in Tables 2 and 3, respectively. The ORTEP diagram and packing image of the DMSB crystal are illustrated in Fig. 4 and 5, respectively. The CIF file for the same structure was generated and deposited at the Cambridge Crystallographic Data Centre (CCDC 2184029). The Cambridge Crystallographic Data system offers free copies of the deposited data, which can be accessed on the following website (https://www.ccdc.cam.ac.uk/data).
Table 1 Refined structural data of 4-[2-(4-dimethyl amino-phenyl)-vinyl]-1-methyl-pyridinium bromide crystal
| Empirical formula |
C16H19N2Br |
| CCDC |
2184029 |
| Formula weight |
319.24 g mol−1 |
| Temperature |
301(2) K |
| Radiation type |
MoKα |
| Wavelength |
0.71073 Å |
| Crystal system, space group |
Monoclinic, P21/c |
| Unit cell dimensions |
a = 6.3288(5) Å, α = 90°, b = 7.7010(6) Å, β = 90.396(2)°, c = 32.103(3) Å, γ = 90° |
| Volume |
1564.6(2) Å3 |
| Z and density |
4 and 1.355 g cm−3 |
| Absorption coefficient |
2.617 mm−1 |
| F (0 0 0) |
656 |
| Crystal size |
0.080 × 0.200 × 0.250 mm |
| Theta range for data collection |
28.31° |
| Completeness to theta |
99.8% |
| Max. and min. transmission f |
0.5610 and 0.8180 |
| Refinement method |
Full-matrix least-squares on F2 |
| Goodness-of-fit on F2 |
1.066 |
| Final R indices [I > 2sigma(I)] |
R1 = 0.0674, wR2 = 0.2068 |
| R indices (all data) |
R1 = 0.0837, wR2 = 0.2231 |
| Largest diff. peak and hole |
0.875 e− Å−3 and −0.627 e− Å−3 |
Table 2 Bond lengths [Å]
| Bond lengths [Å] |
| N1–C3 |
1.356(9) |
| N1–C14 |
1.479(9) |
| N2–C15 |
1.433(9) |
| C1–C2 |
1.389(10) |
| C1–C6 |
1.459(10) |
| C4–C5 |
1.348(11) |
| C7–C8 |
1.454(9) |
| C8–C13 |
1.399(9) |
| C10–C11 |
1.382(9) |
| C12–C13 |
1.386(9) |
| N1–C4 |
1.356(9) |
| N2–C11 |
1.387(8) |
| N2–C16 |
1.436(9) |
| C1–C5 |
1.409(10) |
| C2–C3 |
1.374(10) |
| C6–C7 |
1.308(10) |
| C8–C9 |
1.395(9) |
| C9–C10 |
1.389(10) |
| C11–C12 |
1.403(8) |
Table 3 Bond angles [°] of DMSB
| Bond angles [°] |
| C3–N1–C4 |
118.2(6) |
| C4–N1–C14 |
121.3(6) |
| C11–N2–C16 |
120.4(6) |
| C2–C1–C5 |
116.4(7) |
| C5–C1–C6 |
120.2(6) |
| N1–C3–C2 |
122.1(7) |
| C4–C5–C1 |
121.2(7) |
| C6–C7–C8 |
126.7(6) |
| C9–C8–C7 |
123.1(6) |
| C10–C9–C8 |
122.2(6) |
| C10–C11–N2 |
121.0(6) |
| N2–C11–C12 |
121.1(6) |
| C12–C13–C8 |
121.3(6) |
| C3–N1–C14 |
120.4(6) |
| C15–N2–C16 |
118.4(6) |
| C2–C1–C6 |
123.5(7) |
| C5–C4–N1 |
121.9(7) |
| C7–C6–C1 |
125.2(7) |
| C9–C8–C13 |
116.8(6) |
| C13–C8–C7 |
120.1(6) |
| C11–C10–C9 |
120.7(6) |
| C10–C11–C12 |
117.9(6) |
| C13–C12–C11 |
121.1(6) |
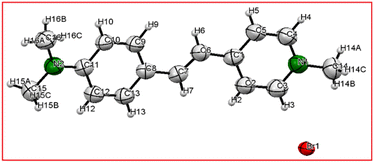 |
| | Fig. 4 An ORTEP diagram of DMSB crystal with thermal ellipsoids is shown at a 50% probability level. | |
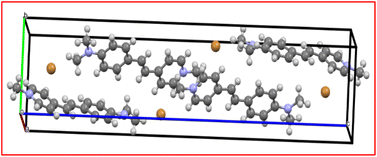 |
| | Fig. 5 Molecular packing of the DMSB crystal. | |
3.1.2 Crystal morphology. Information on the growth planes of the novel DMSB crystal was analysed via morphology analysis. In order to generate the morphology of the sample, the obtained CIF file of the DMSB crystal was loaded into the WinXmorph software.24 Fig. 6 displays the growth morphology of the DMSB crystal. The different growth faces involved in the DMSB crystal are (10−1), (100), (00−1), (001), (−100), (101), (010), (0−11), (011), (0−10), (0−11), (011), (110), (−1−10), (1−10), and (110). From the result, it was clear that the rate of growth of the DMSB crystal is predominant along the crystallographic ‘a’ axis compared to the ‘b’ and ‘c’ axis.
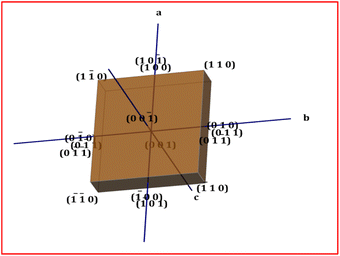 |
| | Fig. 6 Morphology of the DMSB crystal. | |
3.2 CHN elemental analysis
CHN analysis was used to verify the empirical formula of the grown crystal by the mass of the constituent atoms present in the compound.25 The powder sample of DMSB was subjected to this analysis using a PerkinElmer 2400 series II instrument.26,27 The theoretically calculated CHN values of DMSB are (C16H19N2Br): C-60.20%; H-6.00%; and N-8.78%. The experimental CHN values of DMSB powder were found to be C-60.13%, H-5.93, and N-8.63%. Thus, the experimental value is approximately equal to the theoretical value. Hence, the elemental composition of DMSB was confirmed by the mass of the elements (CHN) present in the compound.
3.3 NMR spectral studies
3.3.1. 1H NMR spectral studies. Nuclear magnetic resonance (NMR) examination was employed to detect the existence of specific nuclei in the material.28 It can also identify molecules and investigate their electronic structures. This technique exactly points out all the hydrogen atoms present in the molecule. In order to carry out the analysis, finely ground DMSB powder was dissolved in DMSO-d6 solvent. The 1H NMR spectrum of the DMSB crystal was obtained using BRUKER 400 MHz FT-NMR analyser. The obtained 1H NMR spectrum is depicted in Fig. 7. In the DMSB crystal, a total of 19 hydrogen atoms were present. The singlet peak that emerged at 2.507 ppm is due to the solvent (DMSO-d6), and the corresponding water peak raised due to the solvent is attributed at 3.332 ppm.29 The singlet peak observed at 3.026 ppm belongs to six protons of the two methyl groups (A) attached to the amino group. The three protons of the methyl group (B) connected with the pyridinium ring show its characteristics peak at 4.179 ppm. The doublet peaks (C) observed at 6.782 and 6.803 ppm indicate the presence of hydrogen atoms in the 2nd and 6th position in the aromatic ring attached to the nitrogen atom of the amino group. The two doublet peaks (D) at (7.152 and 7.192) and (7.888 and 7.928) are due to the 3rd and 5th position protons in the same aromatic ring. Doublet peaks (E) raised at 7.590 and 7.611 ppm are attributed to the vinyl group hydrogen atoms (CH![[double bond, length as m-dash]](https://www.rsc.org/images/entities/char_e001.gif) CH), which proves the formation of the DMSB compound. Peak F (doublet 8.039–8.055 ppm) and peak G (doublet 8.675–8.691 ppm) represent the 2nd and 6th, and 3rd and 5th position protons of the pyridinium ring.30 All the observed peaks affirm the formation of the title ionic DMSB crystal (Table 4).
CH), which proves the formation of the DMSB compound. Peak F (doublet 8.039–8.055 ppm) and peak G (doublet 8.675–8.691 ppm) represent the 2nd and 6th, and 3rd and 5th position protons of the pyridinium ring.30 All the observed peaks affirm the formation of the title ionic DMSB crystal (Table 4).
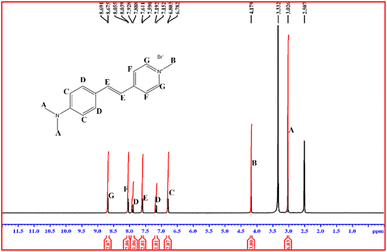 |
| | Fig. 7 1H NMR spectrum of DMSB. | |
Table 4 Chemical shift values for 1H NMR
| Proton position |
Chemical shift (ppm) |
| DMSO-d6 (solvent) |
2.507 |
| Water in DMSO-d6 |
3.332 |
| N–CH3 (methyl group) |
3.026 |
| Methyl group of the pyridinium ring |
4.179 |
| C–H (pyridine ring) |
8.039, 8.675, 8.691 & 8.055 |
CH![[double bond, length as m-dash]](https://www.rsc.org/images/entities/char_e001.gif) CH (vinyl group) CH (vinyl group) |
7.590 & 7.6111 |
| C–H (aromatic ring) |
6.782, 7.152, 7.192, 7.888, 7.928 & 6.803 |
3.3.2. 13C NMR spectral studies. The recorded 13C NMR spectrum of DMSB is shown in Fig. 8. The peaks at 15.08 ppm, 46.48 ppm, and 56.26 ppm are attributed to the carbon atoms of the methyl group. The carbon atoms present in the pyridinium ring exhibit their characteristic peaks at 115.18 ppm, 124.19 ppm, 146.29 ppm, 149.58 ppm, and 153.27 ppm. The peaks appearing at 143.90 ppm and 144.41 ppm are due to the vinyl group carbons. The peaks at 64.34 ppm, 111.18 ppm, 112.92 ppm, 124.89 ppm, 128.08 ppm, and 151.19 ppm correspond to the aromatic ring carbon atoms. The total number of carbon atoms (16) observed in the C NMR is in good agreement with the DMSB crystal structure (Table 5). The results from 1H NMR and 13C NMR imply the formation of the title DMSB crystal.
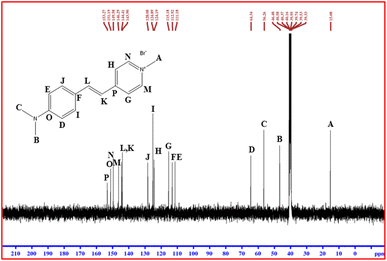 |
| | Fig. 8 13C NMR spectrum of DMSB. | |
Table 5 Chemical shift values for 13C NMR
| Position of carbon |
Chemical shift (ppm) |
| CH3 (methyl group) |
15.08, 46.48, 56.26 |
| C–H (pyridine ring) |
115.18, 124.19, 146.29, 149.58, 153.27 |
CH![[double bond, length as m-dash]](https://www.rsc.org/images/entities/char_e001.gif) CH (vinyl group) CH (vinyl group) |
143.90, 144.41 |
| C–H (aromatic ring) |
64.34, 111.18, 112.92, 124.89, 128.08, 151.19 |
3.4 FTIR analysis
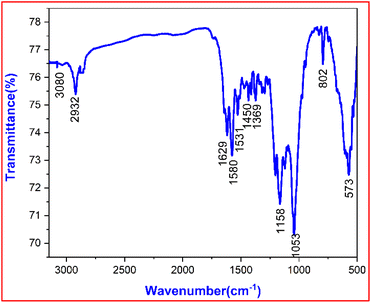
Functional groups and their associated vibrations can be used to structurally validate the title ionic crystal using an FTIR study. The sample was mixed with KBr to form a pellet to acquire the raised vibrations in the region of 3250 cm−1 to 400 cm−1 by using a SHIMADZU IR Affinity-1 spectrophotometer. The vibration spectrum raised due to the DMSB crystal is shown in Fig. 9. The DMSB crystal comprises stilbazolium cation and bromide anion. Assignments of the various functional groups were made from standard references.
 |
| | Fig. 9 FTIR spectrum of the grown DMSB crystal. | |
A peak observed at 3080 cm−1, corresponds to the aromatic and alkene group C–H vibrations.31 In the DMSB crystal structure, the hydrogen atoms are attached diagonally across each other in the vinyl group (C![[double bond, length as m-dash]](https://www.rsc.org/images/entities/char_e001.gif) C). This implies the trans configuration in the crystal structure.32 The vibrational peak that emerged at 2932 cm−1 is because of the alkyl C–H stretching in the DMSB material. The peak at 1629 cm−1 represents the vinyl C
C). This implies the trans configuration in the crystal structure.32 The vibrational peak that emerged at 2932 cm−1 is because of the alkyl C–H stretching in the DMSB material. The peak at 1629 cm−1 represents the vinyl C![[double bond, length as m-dash]](https://www.rsc.org/images/entities/char_e001.gif) C stretching of the ethylenic bridge in the DMSB compound.33 The peak emerged due to the presence of an aromatic ring was detected at 1580 cm−1. The absorption peak at 1450 cm−1 is ascribed to the asymmetrical bending vibrations of the CH3 group. The peak at 1369 cm−1 specifies the symmetrical bending vibration of the CH3 group. The sharp peak at 1158 cm−1 stands for the ring C
C stretching of the ethylenic bridge in the DMSB compound.33 The peak emerged due to the presence of an aromatic ring was detected at 1580 cm−1. The absorption peak at 1450 cm−1 is ascribed to the asymmetrical bending vibrations of the CH3 group. The peak at 1369 cm−1 specifies the symmetrical bending vibration of the CH3 group. The sharp peak at 1158 cm−1 stands for the ring C![[double bond, length as m-dash]](https://www.rsc.org/images/entities/char_e001.gif) C vibrations. In the DMSB crystal, the peak located at 1053 cm−1 represents the CH3 rocking mode.34 The peak centred at 802 cm−1 corresponds to the para-substituted aromatic ring. The characteristic peak of the C–Br stretching is observed at 573 cm−1, which is determined to be the bromide anion in the DMSB crystal.35 Identification of all the observed functional groups concluded that the DMSB compound was formed. The summary of the FTIR peaks and their assignments are tabulated in Table 6.
C vibrations. In the DMSB crystal, the peak located at 1053 cm−1 represents the CH3 rocking mode.34 The peak centred at 802 cm−1 corresponds to the para-substituted aromatic ring. The characteristic peak of the C–Br stretching is observed at 573 cm−1, which is determined to be the bromide anion in the DMSB crystal.35 Identification of all the observed functional groups concluded that the DMSB compound was formed. The summary of the FTIR peaks and their assignments are tabulated in Table 6.
Table 6 Assignments of IR band frequencies of DMSB material
| Wavenumber (cm−1) |
Assignments |
| 3080 |
Aromatic and alkene group C–H vibrations |
| 2932 |
Alkyl C–H stretching |
| 1629 |
Vinyl C![[double bond, length as m-dash]](https://www.rsc.org/images/entities/char_e001.gif) C stretching C stretching |
| 1580 |
Aromatic ring vibrations |
| 1531 |
C![[double bond, length as m-dash]](https://www.rsc.org/images/entities/char_e001.gif) C stretching vibrations C stretching vibrations |
| 1450 |
Asymmetrical bending vibrations of the methyl group |
| 1369 |
Symmetrical bending vibrations of the methyl group |
| 1158 |
C![[double bond, length as m-dash]](https://www.rsc.org/images/entities/char_e001.gif) C vibrations C vibrations |
| 1053 |
CH3 rocking mode |
| 802 |
Para substituted aromatic ring |
| 573 |
C–Br stretching |
3.5 Linear optical studies
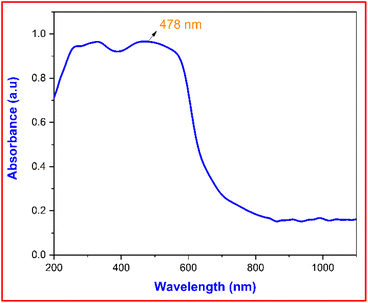
3.5.1 UV-Vis-NIR spectroscopy analysis. The absorbance behaviour of the DMSB crystal was analysed through UV-Vis-NIR spectroscopy and it also revealed the orbital transitions involved in the sample.36 The optical absorbance spectrum of the DMSB crystal was measured using Analytik Jena Specord Plus UV-Vis-NIR spectroscopy in the wavelength range of 200–1100 nm. The absorbance spectrum of the DMSB crystal is shown in Fig. 10. The drop in the absorbance observed at 478 nm corresponded to the cut-off wavelength (λmax), which is attributed to the presence of an extended conjugated system (donor-dimethylamino to acceptor-pyridinium) in the structure. The absorbance peak that emerged in the visible regime (478 nm) confirmed the π–π* transition.37,38 The absence of any other absorbance peak over a wide range (478–1100 nm) suggested that DMSB crystal is an ideal candidate for optoelectronics applications.
 |
| | Fig. 10 Absorbance spectrum of the grown DMSB crystal. | |
3.5.2 Tauc's plot. The material's optical behaviour is very essential from the device fabrication point of view, to evaluate it, the optical constants of the DMSB crystal were determined. The recorded absorbance data was used to calculate the optical absorption coefficient using the following relation,| |
 | (1) |
where t is the thickness of the crystal and T is the transmittance.With the coefficient of absorption value, the DMSB crystals optical band gap was calculated from Tauc's equation,
in this equation,
hυ is the photon energy,
α is the absorption coefficient,
A is a constant,
Eg stands for the optical band gap of DMSB crystal and
m represents the index that gives the details about the electronic transition involved in the absorption process.
39,40 Theoretically,
m is 1/2 for directly allowed transition,
m is 2 for indirectly allowed transition, if the
m value is 3, it means that it represents direct forbidden transition and if it is 3/2 means it implies indirect forbidden transition. To estimate the material band gap from Tauc plot, a graph between (
αhυ)
2 and is plotted (
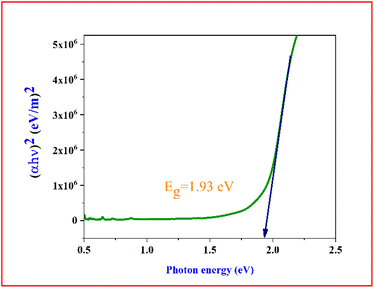
Fig. 11). Extrapolating the linear part of the Tauc' plot graph to (
αhυ)
2 = 0 provided information on the optical band gap of the DMSB crystal and it was found to be 1.93 eV. The well-established relation between the bandgap and refractive index was used to determine the refractive index of the grown crystal
41 by using the following equation,
| |
 | (3) |
 |
| | Fig. 11 Tauc plot of the grown DMSB crystal. | |
3.6 Photoluminescence studies
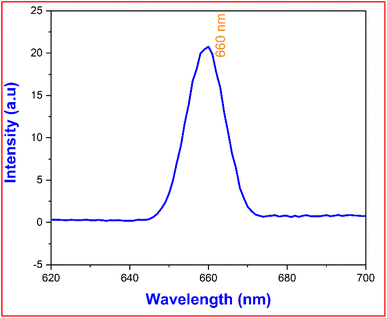
The structural characteristics of the title crystal and its luminescence behaviour were comprehensively studied using photoluminescence emission spectroscopy. Fig. 12 illustrates the PL spectrum of the DMSB crystal, which was measured using an F-7000 FL spectrophotometer with methanol as the solvent. The DMSB sample was activated at 478 nm, and a spectrum of the matching emission was recorded between 620 and 700 nm. The excitation and emission wavelengths were attained by altering the excitation wavelength while maintaining the emission wavelength constant, and vice versa. The obtained peak was closely examined and it was found to have an emission maximum at =660 nm, which indicated the prominent red emission (visible range). The emission of photons in the red colour spectrum is due to the presence of the stilbazolium chromophore and electron donor and acceptor groups in the cation part. Also, the electronic transitions in the cation's aromatic ring and the presence of van der Waals force also contribute to the red emission.42 The wide red peak raised in the PL spectrum ratifies that the synthesized DMSB crystal is a strong performer for a variety of applications, namely, bandpass filters, optical switches that can be used in the near IR range, and solid-state lasers.9,43
 |
| | Fig. 12 Photoluminescence spectrum of the grown DMSB crystal. | |
3.7 Surface analysis
3.7.1 Atomic force microscopy analysis (AFM). To understand the surface of the developed ionic material, a quantitative analysis of the surface topography is necessary. Therefore, the novel DMSB crystal's surface is evaluated with the help of AFM analysis. The height parameter is one of the most important parameters, it provides vital information about the material's surface topography.44 The grown DMSB crystal 3D surface and 2D surface images are shown in Fig. 13a and b. The measured average roughness (Sa) and root mean surface roughness (Sq) values were 32.982 nm and 26.848 nm, respectively. The separation between the average of five maximum peaks and the average of five minimum peaks is known as the ten-point height (Sz), it was found to be 140.100 nm. The dominance of valleys or peaks in the sample surface can be analysed through the surface skewness (Ssk) moment. The positive value ratifies (0.0022) that the peaks are more predominant in the subjected surfaces than valleys. The surface kurtosis (Sku) parameter suggests that the examined surface was flat. The condition for a surface to be flat is that Sku should be lesser than 3.32 In this instance, the value of Sku was 2.423, which indicated the flatness of the DMSB crystal. Through the AFM technique, it was concluded that the grown DMSB crystal possesses a flatter surface. The calculated values are summarized in Table 7.
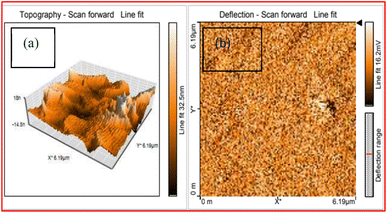 |
| | Fig. 13 AFM image of the grown DMSB crystal (a) 3D image (b) 2D image. | |
Table 7 Roughness parameters
| Roughness parameters |
Values |
| Root mean surface roughness (Sq) |
32.982 nm |
| Average roughness (Sa) |
26.848 nm |
| Ten-point height (Sz) |
140.100 nm |
| Surface skewness (Ssk) |
0.0022 |
| Surface kurtosis (Sku) |
2.423 |
3.7.2 Hirshfeld surface analysis. Hirshfeld surface analysis is one of the effective ways to assess the various intermolecular interactions occurring in the crystal structure. The description normalized contact distance (dnorm) is a ratio between di and de. Where di and de are the distances in atomic units of van der Waals, between any location on the Hirshfeld surface and most nearby atoms that are either within or outside of the surface. The Hirshfeld surface for the DMSB crystal structure was generated with the help of the Crystal Explorer 3.1 tool (Fig. 14).45,46 The normalized contact distance (dnorm) for the generated Hirshfeld surfaces was mapped and calculated using the following equation.| |
 | (4) |
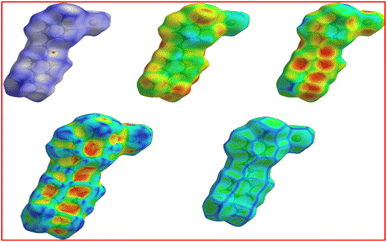 |
| | Fig. 14 View of the three-dimensional Hirshfeld surface. | |
On the Hirshfeld surface, the colours white, red, and blue correspondingly represents the intermolecular interactions at distances that are equal to, less than, and higher than the van der Waals radius added together. The generated two-dimensional fingerprint plots (FP) were used to the obtain percentage of various intermolecular interactions occurring within the crystal structure. According to de and di distances, the FP plots for the DMSB crystal structure were anticipated, which are shown in Fig. 15. The FP plot revealed that the majority percentage of the contribution (50.4%) towards interatomic interactions were raised from H/H interactions, which played a crucial role in maintaining the stability of the crystal structure. Furthermore, the stability of the crystal structure was also aided by the inter-molecular interactions between the molecules; Br/H, Br/C, Br/N, H/Br, C/H, N/C, N/H, and N/N. The inter-molecular interactions percentage between the molecules are C–H (15.7%), Br–H (12.6%), H–C (11.5%), and H–Br (6.5%). This analysis implied that apart from the coloumbic interactions, the anion bromide also plays a crucial impact in the crystal packing.47
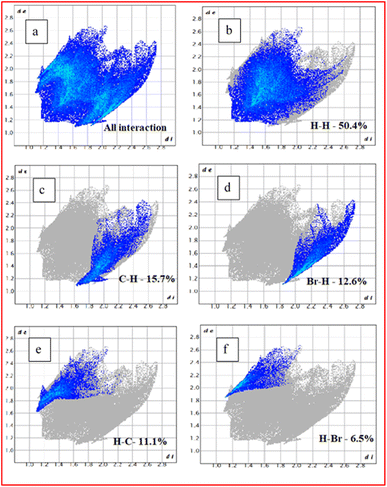 |
| | Fig. 15 (a) All interaction (b) H–H intermolecular interaction (IMI), (c) C–H IMI, (d) Br–H IMI, (e) H–C IMI and (f) H–Br IMI. | |
3.8 Nonlinear optical studies
3.8.1 Z-scan technique. The Z-scan method is a precise method for analysing the material's optical nonlinearities. There are four basic parameters that can be directly deduced from the Z-scan experiment, namely; third-order nonlinear susceptibility (χ(3)), second-order hyperpolarizability (γ), nonlinear refractive index (n2) and nonlinear absorption coefficient (β).48 In this method, a computerized translation setup was used to move the sample from −Z to +Z along the focussed Gaussian beam's propagation axis (Z-axis). The transmitted output intensity for each and every Z position was recorded with the help of a digital power meter. The sample performed as a thin lens with an adjustable focal length. The results from SCXRD studies confirmed that the grown DMSB belonged to the centrosymmetric space group P21/c. The centrosymmetric pattern in the crystal specifies the presence of inversion symmetry in the structure, which implied the presence of the (χ(3)) effect and the absence of the (χ(2)) effect. The sign and magnitude of the nonlinear refractive index (n2) of the title compound were ascertained by using the closed aperture (CA) mode. Fig. 16 displays the CA profile of the DMSB crystal.
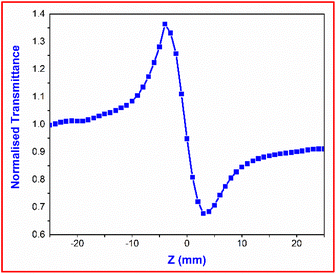 |
| | Fig. 16 Closed aperture trace of DMSB crystal. | |
The transmittance curve's peak-to-valley configuration indicated the negative nonlinear refractive index (n2) and also demonstrated that the DMSB crystal had a self-defocusing effect. The following eqn (5) can be used to determine the difference between pre-focus and post-valley (ΔTP-V) as a function of an axis phase shift |ΔΦo|
| | |
ΔTP-V = 0.406(1 − S)0.25|ΔΦo|
| (5) |
with the help of axis phase shift,
n2 of the DMSB crystal was calculated using the following expression.
| |
 | (6) |
K in the above relation implies the wave number (
K = 9.924 × 10
6 m
−1), where
Io is the incident laser beam light intensity at the focus (
Io = 15.61 MW m
−2), and
Leff represents the effective thickness of the subjected sample, it can be estimated from the following equation,
| |
 | (7) |
where
L is the thickness of the crystal used.
Fig. 17 displays the nonlinear absorption characteristic of the title crystal. The OA graph confirmed the reverse saturation absorption (RSA) behavior of the DMSB crystal.49 Here, it is necessary to remember that the excited state of the molecule has greater absorption than its ground state, which has important applications in various technological and biological fields. To determine the nonlinear absorption coefficient (β), the below-mentioned formula was used,
| |
 | (8) |
where Δ
T is the drop in transmittance value (valley) at focus as indicated in the OA curve. According to these calculations, the DMSB crystal has a nonlinear absorption coefficient (
β) and nonlinear refractive index (
n2) of 4.7566 × 10
−5 mW
−1 and 3.432 × 10
−11 m
2 W
−1, respectively.
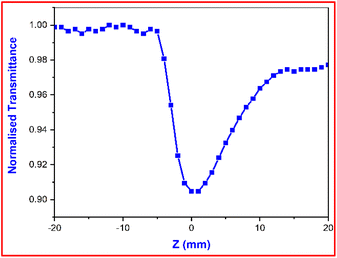 |
| | Fig. 17 Open aperture trace of DMSB crystal. | |
The resulting nonlinear refractive index (n2) and effective nonlinear absorption coefficient (β) were used to compute the real and imaginary components of third-order nonlinear susceptibility. Using the real and imaginary values, the absolute value of third-order nonlinear optical susceptibility (χ(3)) can be calculated by using the following expressions,
| |
 | (9) |
| |
 | (10) |
| |
 | (11) |
Table 8 displays the experimental data and the calculated results of the Z-scan method for DMSB.
Table 8 Non-linear parameters obtained from the Z-scan method
| Laser beam wavelength (λ) |
632.8 nm |
| Lens focal length (f) |
30 mm |
| Beam radius of the aperture (wa) |
9 mm |
| Aperture radius (ra) |
2 mm |
| Sample thickness (L) |
0.4 mm |
| Effective thickness of the sample (Leff) |
0.3261 × 10⁻³ m |
| Nonlinear refractive index (n2) |
3.432 × 10⁻¹¹ m2 W−1 |
| Nonlinear absorption coefficient (β) |
4.7566 × 10⁻⁵ m W−1 |
| Real part of the third-order susceptibility [Re(χ(3))] |
2.285 × 10⁻⁹ esu |
| Imaginary part of the third-order susceptibility [Im(χ(3))] |
1.5955 × 10⁻⁸ esu |
| Third-order nonlinear optical susceptibility (χ(3)) |
1.6 × 10⁻⁸ esu |
The absolute third-order nonlinear susceptibility (χ(3)) value of the DMSB crystal is compared with a few of the other NLO crystals and the comparison is depicted in Table 9.
Table 9 Comparison of DMSB χ(3) value with other NLO crystals
| Crystal name |
χ(3) value (esu) |
| DMSB (present work) |
1.6 × 10⁻⁸ |
| KDP50 |
2.04 × 10⁻¹⁴ |
| VMST51 |
9.696 × 10⁻¹² |
| 4MBS52,53 |
11.04 × 10⁻⁸ |
| DSMOS13 |
5.05 × 10⁻⁸ |
The overall characterization results implied that the synthesized DMSB material showed superior NLO response and it can be utilized for all-optical switching and optical limiting applications.
4 Conclusion
A slow evaporation technique was used to grow a good quality third-order nonlinear optical single crystal of DSMB by incorporating a new anion into the existing stilbazolium derivatives. The SCXRD analysis confirmed that DMSB crystallised in a monoclinic crystal system with centrosymmetric space group P21/c (CCDC – 2184029). The formation of the DMSB compound was affirmed through an NMR spectroscopy study. The cut-off edge and band gap of the DMSB crystal was evaluated through UV-Vis-NIR spectroscopy and it was found to be 478 nm and 1.93 eV, respectively. The red light emission (660 nm) of the DMSB crystal was confirmed from the PL spectrum. The experimentally determined third-order nonlinear susceptibility from the Z-scan method was 1.6 × 10⁻⁸ esu. The self-defocusing effect (negative n2 value) and the reverse saturation absorption (RSA) property of the grown DMSB crystal specified that the newly developed crystal can be used for a variety of applications; namely photonic devices, optical limiting, and optical switching. All the characterization results indicate that the DMSB crystal is an ideal material for diverse NLO applications.
Author contributions
Muthurakku Usha Rani: conceptualization, visualization, supervision, review, and editing. Raji Vinayagamoorthy: methodology, formal analysis, investigation, writing – original draft, and visualization. Sivaperuman Kalainathan: conceptualization, review, and editing. Sekar Anand: conceptualization, review, and editing.
Conflicts of interest
The authors declare that they have no known competing financial interests or personal relationships that could have appeared to influence the work reported in this paper.
Acknowledgements
The authors would like to acknowledge the Vellore Institute of Technology (VIT), Vellore, for providing the single crystal XRD measurement.
References
- K. Senthil, S. Kalainathan and A. Ruban Kumar, CrystEngComm, 2014, 16, 9847–9856 RSC
 .
. - D. Jini, M. Aravind, S. Ajitha, C. Parvathiraja, M. Muniyappan, P. A. Vivekanand, P. Kamaraj, N. Arumugam, A. I. Almansour, R. Arulnangai, R. S. Kumar, K. Perumal and G. Gonfa, Adv. Mater. Sci. Eng., 2022, 2022, 1–9 CrossRef
 .
. - D. Nayak, N. Vijayan, M. Kumari, Kiran, P. Vashishtha, S. Das, B. Sridhar, G. Gupta and R. P. Pant, Opt. Mater., 2022, 122, 112051 CrossRef
 .
. - M. Mutailipu, J. Han, Z. Li, F. Li, J. Li, F. Zhang, X. Long, Z. Yang and S. Pan, Nat. Photonics, 2023, 12, 1–8 Search PubMed
 .
. - R. Shanmugavadivu, G. Ravi and A. Nixon Azariah, J. Phys. Chem. Solids, 2006, 67, 1858–1861 CrossRef CAS
 .
. - M. K. Gupta, N. Sinha and B. Kumar, Phys. B, 2011, 406, 63–67 CrossRef CAS
 .
. - C. M. Ashcroft, J. M. Cole, T. C. Lin, S. C. Lee, L. A. Malaspina and O. P. Kwon, Phys. Rev. Mater., 2020, 4(11), 115203 CrossRef CAS
 .
. - J. Guo, A. Tudi, S. Han, Z. Yang and S. Pan, Angew. Chem., Int. Ed., 2019, 58, 17675–17678 CrossRef CAS PubMed
 .
. - P. Antony, S. J. Sundaram, J. V. Ramaclus, S. Antony Inglebert, A. Antony Raj, S. Dominique, T. A. Hegde, G. Vinitha and P. Sagayaraj, J. Mol. Struct., 2019, 1196, 699–706 CrossRef CAS
 .
. - M. Rajeshirke and N. Sekar, Dyes Pigm., 2019, 163, 675–683 CrossRef CAS
 .
. - J. Liu, F. You, C. Hu, Y. Ma, F. Teng, T. Wang, J. Tang, L. Cao and B. Teng, Optik, 2019, 178, 999–1009 CrossRef CAS
 .
. - R. Chen, K. Xu, G. Wang, Z. Zhang, L. Cao and B. Teng, Optik, 2022, 257, 168830 CrossRef
 .
. - Z. Yang, S. Aravazhi, A. Schneider, P. Seiler, M. Jazbinsek and P. Günter, Adv. Funct. Mater., 2005, 15, 1072–1076 CrossRef CAS
 .
. - R. Gunaseelan, R. J. Vijay, G. Ramalingam and P. Sagayaraj, in AIP Conference Proceedings, 2011, vol. 1349, pp. 206–207 Search PubMed
 .
. - R. Gunaseelan and P. Sagayaraj, Mater. Chem. Phys., 2012, 136, 379–385 CrossRef CAS
 .
. - N. Arunadevi, P. Kanchana, M. Mehala and S. Shanmuga Sundari, in Materials Today: Proceedings, Elsevier Ltd, 2019, vol. 33, pp. 2244–2250 Search PubMed
 .
. - J. Salaam, I. N’Dala-Louika, C. Balogh, I. Suleimanov, G. Pilet, L. Veyre, C. Camp, C. Thieuleux, F. Riobé and O. Maury, Eur. J. Inorg. Chem., 2022, 31, e202200412 CrossRef
 .
. - Z. Yang, L. Mutter, M. Stillhart, B. Ruiz, S. Aravazhi, M. Jazbinsek, A. Schneider, V. Gramlich and P. Günter, Adv. Funct. Mater., 2007, 17, 2018–2023 CrossRef CAS
 .
. - A. A. Kalinin, S. M. Sharipova, A. I. Levitskaya, Y. B. Dudkina, T. I. Burganov, O. D. Fominykh, S. A. Katsyuba, Y. H. Budnikova and M. Y. Balakina, J. Photochem. Photobiol., A, 2021, 407, 113042 CrossRef CAS
 .
. - S. Boomadevi, A. Kundu, S. P. Anthony, K. Pandiyan, D. Sastikumar, S. Saxena, S. Bagchi and J. A. Chakera, J. Mol. Struct., 2021, 1245, 131099 CrossRef CAS
 .
. - R. Kaliammal, S. Sudhahar, G. Parvathy, K. Velsankar and K. Sankaranarayanan, J. Mol. Struct., 2020, 1212, 128069 CrossRef CAS
 .
. - S. John Sundaram, J. V. Ramaclus, M. Panneerselvam, M. Jaccob, P. Antony, L. Anandaraj, S. Muthupandi, A. J. P. Paul Winston and P. Sagayaraj, Opt Laser. Technol., 2020, 121, 105831 CrossRef
 .
. - G. M. Sheldrick, Acta Crystallogr., Sect. C: Struct. Chem., 2015, 71, 3–8 Search PubMed
 .
. - W. Kaminsky, J. Appl. Crystallogr., 2005, 38, 566–567 CrossRef CAS
 .
. - S. P. Rathee, D. S. Ahlawat, S. A. Martin Britto Dhas, K. K. Maurya, B. Singh and I. Bdikin, Mater. Sci. Eng. B: Solid-State Mater. Adv. Technol., 2021, 264, 114927 CrossRef CAS
 .
. - V. P. Fadeeva, V. D. Tikhova and O. N. Nikulicheva, J. Anal. Chem., 2008, 63, 1094–1106 CrossRef CAS
 .
. - L. Poornima, R. S. Babu and S. Kalainathan, J. Mol. Struct., 2023, 1280, 134976 CrossRef CAS
 .
. - I. P. Gerothanassis, A. Troganis, V. Exarchou and K. Barbarossou, Nuclear Magnetic Resonance (NMR) Spectroscopy: Basic Principles and Phenomena, and Their Applications to Chemistry, Biology and Medicine, 2002, vol. 3 Search PubMed
 .
. - Q. Cui, R. Li, D. Zhong, F. You, K. Xu, H. Xu, T. Wang, J. Liu, L. Cao, J. Tang, W. Huang and B. Teng, J. Cryst. Growth, 2020, 547, 125802 CrossRef CAS
 .
. - K. Senthil, S. Kalainathan and A. Ruban Kumar, Spectrochim. Acta, Part A, 2014, 125, 335–344 CrossRef CAS PubMed
 .
. - A. U. Rani, N. Sundaraganesan, M. Kurt, M. Cinar and M. Karabacak, Spectrochim. Acta, Part A, 2010, 75, 1523–1529 CrossRef PubMed
 .
. - K. Nivetha, S. Kalainathan, M. Yamada, Y. Kondo and F. Hamada, J. Mater. Sci.: Mater. Electron., 2017, 28, 5180–5191 CrossRef CAS
 .
. - S. Anand, M. U. Rani, S. Kalainathan and R. S. Babu, RSC Adv., 2022, 12, 29022–29033 RSC
 .
. - E. Jaziri, H. Louis, C. Gharbi, F. Lefebvre, W. Kaminsky, E. C. Agwamba, T. G. C. Egemonye, T. O. Unimuke, O. J. Ikenyirimba, G. E. Mathias, C. Ben Nasr and L. Khedhiri, J. Mol. Struct., 2023, 1278, 134937 CrossRef CAS
 .
. - C. S. Juliet Brintha, S. E. Joema and V. K. Suma, J. Mol. Struct., 2022, 1250, 131725 CrossRef CAS
 .
. - R. Durgadevi, A. Suvitha and T. Arumanayagam, J. Cryst. Growth, 2022, 582, 126512 CrossRef CAS
 .
. - M. Manivannan, S. A. M. B. Dhas, M. Balakrishnan and M. Jose, Appl. Phys. B: Lasers Opt., 2018, 124(8), 166 CrossRef
 .
. - F. Nunzi, S. Fantacci, E. Cariati, E. Tordin, N. Casati and P. MacChi, J. Mater. Chem., 2010, 20, 7652–7660 RSC
 .
. - P. Karuppasamy, T. Kamalesh, V. Mohankumar, S. Abdul Kalam, M. Senthil Pandian, P. Ramasamy, S. Verma and S. Venugopal Rao, J. Mol. Struct., 2019, 1176, 254–265 CrossRef CAS
 .
. - T. A. Hegde, A. Dutta, R. O. M. Jauhar, P. Karuppasamy, M. S. Pandian, M. Abith, T. C. S. Girisun and G. Vinitha, Opt. Mater., 2020, 107, 110033 CrossRef CAS
 .
. - A. Goktas, F. Aslan, B. Yeşilata and I. Boz, Mater. Sci. Semicond. Process., 2018, 75, 221–233 CrossRef CAS
 .
. - K. Senthil, S. Kalainathan, F. Hamada, M. Yamada and P. G. Aravindan, Opt. Mater., 2015, 46, 565–577 CrossRef CAS
 .
. - K. Nivetha, K. Aravinth, K. Senthil and S. Kalainathan, J. Mol. Struct., 2021, 1225, 129082 CrossRef CAS
 .
. - B. N. Reddy, M. Deepa, A. G. Joshi and A. K. Srivastava, J. Phys. Chem. C, 2011, 115, 18354–18365 CrossRef CAS
 .
. - P. R. Spackman, M. J. Turner, J. J. McKinnon, S. K. Wolff, D. J. Grimwood, D. Jayatilaka and M. A. Spackman, J. Appl. Crystallogr., 2021, 54, 1006–1011 CrossRef CAS PubMed
 .
. - C. F. Mackenzie, P. R. Spackman, D. Jayatilaka and M. A. Spackman, IUCrJ, 2017, 4, 575–587 CrossRef CAS PubMed
 .
. - K. Chulvi, A. Costero, L. E. Ochando and P. Gaviña, Acta Crystallogr., Sect. E: Crystallogr. Commun., 2015, 71, o1069–o1070 CrossRef CAS PubMed
 .
. - R. M. Jauhar, S. Kalainathan and P. Murugakoothan, J. Cryst. Growth, 2015, 424, 42–48 CrossRef CAS
 .
. - M. I. Baig, M. Anis, S. Kalainathan, B. Babu and G. G. Muley, Mater. Technol., 2017, 32, 560–568 CrossRef CAS
 .
. - X. Wang, Y. Du, S. Ding, Q. Wang, G. Xiong, M. Xie, X. Shen and D. Pang, J. Phys. Chem. B, 2006, 110, 1566–1570 CrossRef CAS PubMed
 .
. - M. K. Kumar, S. Sudhahar and R. M. Kumar, in AIP Conference Proceedings, 2013, vol. 1536, pp. 903–904 Search PubMed
 .
. - B. Thirumalaiselvam, R. Kanagadurai, D. Jayaraman and V. Natarajan, Opt. Mater., 2014, 37, 74–79 CrossRef CAS
 .
. - K. Senthil, S. Kalainathan, Y. Kondo, F. Hamada and M. Yamada, Opt Laser. Technol., 2017, 90, 242–251 CrossRef CAS
 .
.
|
| This journal is © The Royal Society of Chemistry 2023 |
Click here to see how this site uses Cookies. View our privacy policy here.  Open Access Article
 *a,
Sivaperuman Kalainathan
 b and
Sekar Ananda

![[double bond, length as m-dash]](https://www.rsc.org/images/entities/char_e001.gif) CH), which proves the formation of the DMSB compound. Peak F (doublet 8.039–8.055 ppm) and peak G (doublet 8.675–8.691 ppm) represent the 2nd and 6th, and 3rd and 5th position protons of the pyridinium ring.30 All the observed peaks affirm the formation of the title ionic DMSB crystal (Table 4).
CH), which proves the formation of the DMSB compound. Peak F (doublet 8.039–8.055 ppm) and peak G (doublet 8.675–8.691 ppm) represent the 2nd and 6th, and 3rd and 5th position protons of the pyridinium ring.30 All the observed peaks affirm the formation of the title ionic DMSB crystal (Table 4).
![[double bond, length as m-dash]](https://www.rsc.org/images/entities/char_e001.gif) CH (vinyl group)
CH (vinyl group)![[double bond, length as m-dash]](https://www.rsc.org/images/entities/char_e001.gif) CH (vinyl group)
CH (vinyl group)![[double bond, length as m-dash]](https://www.rsc.org/images/entities/char_e001.gif) C). This implies the trans configuration in the crystal structure.32 The vibrational peak that emerged at 2932 cm−1 is because of the alkyl C–H stretching in the DMSB material. The peak at 1629 cm−1 represents the vinyl C
C). This implies the trans configuration in the crystal structure.32 The vibrational peak that emerged at 2932 cm−1 is because of the alkyl C–H stretching in the DMSB material. The peak at 1629 cm−1 represents the vinyl C![[double bond, length as m-dash]](https://www.rsc.org/images/entities/char_e001.gif) C stretching of the ethylenic bridge in the DMSB compound.33 The peak emerged due to the presence of an aromatic ring was detected at 1580 cm−1. The absorption peak at 1450 cm−1 is ascribed to the asymmetrical bending vibrations of the CH3 group. The peak at 1369 cm−1 specifies the symmetrical bending vibration of the CH3 group. The sharp peak at 1158 cm−1 stands for the ring C
C stretching of the ethylenic bridge in the DMSB compound.33 The peak emerged due to the presence of an aromatic ring was detected at 1580 cm−1. The absorption peak at 1450 cm−1 is ascribed to the asymmetrical bending vibrations of the CH3 group. The peak at 1369 cm−1 specifies the symmetrical bending vibration of the CH3 group. The sharp peak at 1158 cm−1 stands for the ring C![[double bond, length as m-dash]](https://www.rsc.org/images/entities/char_e001.gif) C vibrations. In the DMSB crystal, the peak located at 1053 cm−1 represents the CH3 rocking mode.34 The peak centred at 802 cm−1 corresponds to the para-substituted aromatic ring. The characteristic peak of the C–Br stretching is observed at 573 cm−1, which is determined to be the bromide anion in the DMSB crystal.35 Identification of all the observed functional groups concluded that the DMSB compound was formed. The summary of the FTIR peaks and their assignments are tabulated in Table 6.
C vibrations. In the DMSB crystal, the peak located at 1053 cm−1 represents the CH3 rocking mode.34 The peak centred at 802 cm−1 corresponds to the para-substituted aromatic ring. The characteristic peak of the C–Br stretching is observed at 573 cm−1, which is determined to be the bromide anion in the DMSB crystal.35 Identification of all the observed functional groups concluded that the DMSB compound was formed. The summary of the FTIR peaks and their assignments are tabulated in Table 6.![[double bond, length as m-dash]](https://www.rsc.org/images/entities/char_e001.gif) C stretching
C stretching![[double bond, length as m-dash]](https://www.rsc.org/images/entities/char_e001.gif) C stretching vibrations
C stretching vibrations![[double bond, length as m-dash]](https://www.rsc.org/images/entities/char_e001.gif) C vibrations
C vibrations


.
.
.
.
.
.
.
.
.
.
.
.
.
.
.
.
.
.
.
.
.
.
.
.
.
.
.
.
.
.
.
.
.
.
.
.
.
.
.
.
.
.
.
.
.
.
.
.
.
.
.
.
.


