 Open Access Article
Reversible and irreversible stimuli-responsive chromism of a square-planar platinum(II) salt†
Depeng Li,
Qingqing Guan ,
Xiaoyun Hu,
Yuhong Su* and
Zhen Su
 *
*
Key Laboratory of Oil and Gas Fine Chemicals Ministry of Education, College of Chemical Engineering, Xinjiang University, Urumqi 830017, China. E-mail: zhensu@xju.edu.cn
First published on 22nd August 2023
Abstract
A new simple Pt(II) terpyridyl salt that shows reversible response towards acetonitrile and irreversible response towards methanol has been reported, accompanied with the colorimetric/luminescent changing from red to yellow. Experimentally and theoretically, the spectroscopic change derives from the hydrogen bonds between crystal water in the Pt(II) terpyridyl salt and external organic molecules, and the different strength of hydrogen bond leads either reversible or irreversible stimuli-response. Furthermore, this Pt(II) terpyridyl salt has been on one hand applied as a probe for sensing acetonitrile in water solution, with high selectivity, good reversibility, proper sensitivity and fast response rate, and on the other hand as advanced anticounterfeiting materials. The current study provides a new approach to acquire and design either reversible or irreversible stimuli-responsive luminescent materials.
1 Introduction
Luminescent materials that can undergo reversible or irreversible changes in color/emission upon exposure to certain volatile organic compounds, have recently received increasing attention because of their wide range of applications1 in, e.g., chemical sensors, light-emitting diodes, and environmental monitors.2–6 Among numerous luminescent materials, platinum(II) complexes of square-planar geometry are attractive for the design of stimuli-responsive materials.7–11 This is because, on one hand, Pt(II) complexes in solid-state have shown intriguing colorimetric and luminescent properties, deriving from noncovalent Pt–Pt and π–π interactions between neighboring molecules.12–15 On the other hand, the Pt–Pt and π–π interactions in the crystal lattice can be easily perturbed by external small molecules, thus causing significant spectroscopic change.16 At present, many solvochromic or vapochromic Pt(II) complexes have been exploited,17 exhibiting either reversible18–20 or irreversible stimuli-response.21,22 Nevertheless, there is still high demand for developing new systems with stimuli-responsive Pt(II) complexes in order to further promote their wide applications.23In general, the stimuli-responsive Pt(II) complexes towards small organic molecules are attributed to changes in the stacking arrangement within the crystal, leading to a change in the Pt–Pt interaction.24–26 For instance, ethanol molecules can penetrate into the dehydrated amphiphilic Pt(II) complexes through the formation of hydrogen bonds and thus result in the close Pt–Pt distance with the red-shifted color change from yellow to pink.9 Similarly, methanol molecules are able to replace crystal water within the hydrated Pt(II) complex due to the stronger hydrogen bond for methanol as compared to water, also strengthening the Pt–Pt interaction and resulting in an obvious color variation from red to blue.18 In the above cases, small molecules actually directly interact with the Pt(II) complex to impact the extent of Pt–Pt interaction, thus realizing the spectroscopic change under certain stimuli.27 It is reasonable to suppose that through indirect interaction, such as the interaction between crystal water within the Pt(II) complex and organic molecules, can also antennally disturb Pt–Pt interaction and achieve the likewise stimuli-response, but with few reports. Besides, endowing the reversible and irreversible behavior into a single stimuli-responsive chromism is also highly desired.
Herein, as proof of concept, through the weak interaction between crystal water and certain organic molecules to affect the packing style, a new stimuli-responsive Pt(II) terpyridyl complex [Pt(tpy)OCN]·OTf·H2O (1OCN·OTf·H2O, tpy = 2,2′:6′,2′-terpyridine) for acetonitrile (MeCN) and methanol (MeOH) has been reported, with the color/luminescence change from red to yellow. Notably, the response stimulated by MeCN is reversible, while by MeOH it is irreversible, probably attributed to different strength of formed hydrogen bonds between 1OCN·OTf·H2O and MeCN/MeOH. Finally, by taking advantage of the reversibility of 1OCN·OTf·H2O for MeCN, it has been applied as an economical sensing material which shows high selectivity, good reversibility, proper sensitivity, and fast response rate. Moreover, by taking advantage of the reversibility and irreversibility of the chromism, advanced anticounterfeiting application has also been found.
2 Experimental section
2.1 Reagents and materials
All chemicals were of analytical-reagent grade and used as received. Potassium tetrachloroplatinate(II) (K2PtCl4), 1,5-cyclooctadiene, 2,2′:6′,2′′-terpyridine, ethyl acetate, acetaldehyde, propional, benzaldehyde, acetone, dichloroformaldehyde, cyclohexane, n-hexane, ether, tetrahydrofuran, methanol, ethanol, acetonitrile, sodium cyanate (NaOCN), sodium trifluoromethanesulfonate (NaOTf), sodium chloride (NaCl), dimethyl sulfoxide (DMSO) and tetrahydrofuran (THF) were purchased from Aladdin (Shanghai China). Ultrapure deionized water (18.2 MΩ) was used to prepare all solutions.2.2 General characterizations
1H NMR spectra of Pt(II) complexes were obtained on a Varian 400-MR spectrometer. The chemical shifts δ were given in ppm (parts per million) relative to tetramethylsilane (TMS) and DMSO-d6 was used as deuterated solvent. TMS served as the internal standard (δ = 0.00 ppm) for 1H NMR. The elemental analyses were performed by Elementar Vario MICRO cube. The electrospray ionization mass spectra (ESI-TOF-MS) was acquired on an Agilent 6210 ESI/TOF mass spectrometer in positive ion mode using CH3CN. The X-ray powder diffraction (XRPD) data were collected on a Bruker AXS D8-Advance diffractometer with Cu Kα radiation of λ = 1.5418 Å at 40 kV and 40 mA (scanning from 2θ = 5 to 50° with step of 0.01° and speed of 1° min−1). The single-crystal X-ray diffraction (SXRD) data were collected at 100 K on a Rigaku Oxford Diffraction Supernova Dual Source, Cu at Zero equipped with an Atlas S2 CCD using Cu Kα radiation. The structures were solved by direct methods using Olex2 software, and the non-hydrogen atoms were located from the trial structure and then refined anisotropically with SHELXL-2014 using a full-matrix least squares procedure based on F2. The weighted R factor, wR and goodness-of-fit S values were obtained based on F2. The hydrogen atom positions were fixed geometrically at the calculated distances and allowed to ride on their parent atoms. Diamond software was used for structural visualization. UV-vis spectra were recorded on a Shimadzu UV-2600 UV-vis spectrophotometer using 1 cm quartz cuvettes. Emission spectra were obtained on a Shimadzu RF-5301 photoluminescence spectrometer. Field-emission scanning electron microscopy (FE-SEM, SU8010, 0.1–30 kV) was used to characterize the morphology and the detailed structure of the samples. The optical micrographs were recorded by a Huawei Mate 40 Pro mobile phone.2.3 Synthesis of 1OCN·OTf·H2O
The starting materials [Pt(tpy)OCN]·OCN (1OCN·OCN) of red color was prepared by adding excess NaOCN into 20 mL 3–5 mM 1Cl·Cl aqueous solution that prepared according to previously published procedure.28–30 The 1OCN·OTf·H2O complex (red color) was prepared as precipitate by adding 3–5 g NaOTf into 20 mL 3–5 mM 1OCN·OCN aqueous solution.31,32 For 1OCN·OTf·H2O: elemental analysis results (%): calcd for C17H11N4O4F3SPt·H2O: C 32.03; H 1.73; N 8.79. Found: C 32.11; H 1.72; N 8.80. 1H NMR (400 MHz, DMSO-d6) δ (ppm): 1H NMR (400 MHz, DMSO-d6) δ 8.65 (t, J = 6.5 Hz, 4H), 8.60 (s, 3H), 8.55–8.50 (m, 2H), 7.96 (t, J = 6.6 Hz, 2H). ESI-MS: m/z calcd for 1OCN+: 470.02, found: 470.01.2.4 Computational method
Geometries of 1OCN·OTf·H2O complex were fully optimized using the PBE0 (ref. 33) exchange–correlation functional with Grimme's DFT-D3(BJ)34,35 empirical dispersion correction abbreviated as PBE0-D3(BJ) with the def2-SVP36,37 basis set. A further frequency calculation at the same level of theory was also performed at the optimized geometries to ensure that located stationary points do not have any imaginary frequency. The def2-TZVP basis set was adapted to calculate single-point energy and the interaction energy. All above-mentioned computations were carried out using Gaussian 16 revision A.03. All wave function analyses including IGMH38 (independent gradient model analysis based on Hirshfeld) and molecular orbitals were performed by Multiwfn39 software. Some isosurface maps were rendered by means of the VMD40 visualization program based on the files exported by Multiwfn.2.5 Emission measurements for constructing a calibration curve
In order to construct a calibration curve for sensitivity measurements, powder of 1OCN·OTf·H2O was initially placed in a glass cell on a slide and 2.5 mL of water was added to the cell. The emission spectrum of 1OCN·OTf·H2O was recorded. Subsequently, a desired volume of MeCN was titrated in, the resultant solution mixture was carefully homogenized making sure not to disturb the crystals, and the system was allowed to equilibrate for 20 min. The emission spectrum was then recorded, and this process was repeated until a spectral change was observed. When a spectral change was detected, the system was allowed to equilibrate for a further 20 more minutes after which another spectrum was recorded. The process was continued until the spectra stopped changing. Subsequently, a further volume of MeCN was titrated in and the entire process was repeated. This entire process was followed for several different MeCN additions.2.6 Preparation of anti-counterfeiting patterns
Complex 1OCN·OCN of 0.1 g was dissolved in 5 mL water and complex NaCF3SO3 of 1 g was added to form a more evenly dispersed 1OCN·OTf·H2O suspension. A custom 350 mesh screen (73 μm aperture) print pattern is then overlaid on the mock banknote. The 1OCN·OTf·H2O suspension is dropped on the corresponding area of the template, and the ink is printed on the substrate through the mesh under the pressure of the scraper. After 20 minutes, the solvent is entirely volatilized and the counterfeit pattern can be obtained by removing the template. Switch the mold into a butterfly shape and repeat the above operations to get the corresponding butterfly safety pattern.3 Results and discussion
3.1 Reversible and irreversible stimuli-response of 1OCN·OTf·H2O
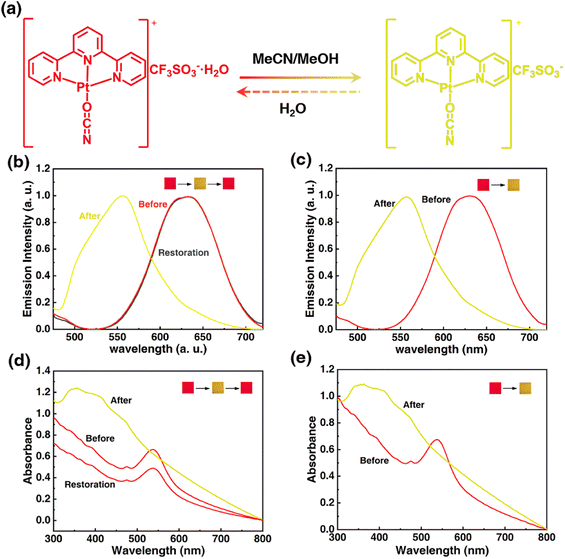
Solid Pt(II) complex in hydrated form is the premise to realize the stimuli-response through indirect interaction of stimuli molecule with crystal water. To acquire a steady hydrated terpyridyl Pt(II) salt, an ancillary ligand of high electronegativity and a counteranion of high hydration enthalpy should be adopted. Following this line, the electronegative OCN− group was tentatively chosen as the co-ligand and the hygroscopic OTf− anion was chosen as the counteranion, thus a hydrated 1OCN·OTf·H2O complex of red color was successfully synthesized (the specific structure has been analyzed in the following part). The obtained red 1OCN·OTf·H2O complex shows rapid stimuli-response towards MeCN and MeOH within 1 min, with the color and luminescence changed from red to yellow. Notably, the stimuli-response for MeCN is reversible since the yellow form can easily return to red after encountering water, while the response for MeOH is irreversible as no obvious change under other external stimulus (Fig. 1a). Actually, the emissive processes for 1OCN·OTf in either red form or yellow form all derive from the triplet excited states.16 Spectroscopically, the hydrated 1OCN·OTf·H2O (λex = 365 nm) shows a characteristic asymmetric emission band with a maximum at 635 nm (Fig. 1b and S1†). The 635 nm emission band is tentatively attributed to a triplet metal–metal–ligand-charge-transfer of 3MMLCT [dσ*(Pt)–π*(tpy)] transition, in which the dσ* arises from the overlap of the dz2(Pt) orbitals of stacked [Pt(tpy)OCN]+ complexes. This 3MMLCT suggests stabilization of the lowest 3[dσ*(Pt)–π*(tpy)] states, which is expected to be the result of the presence of Pt–Pt interaction in the sterically permitting square-planar Pt(II) centers. The emission band peaked at 556 nm after exposure to MeCN is attributed to the triplet 3MLCT transition, since the Pt–Pt interactions in the yellow-from salt is relatively weak.31 After the treatment of H2O, the original band at 635 nm recovered immediately, thus demonstrating the fine reversibility. In addition, the emission spectrum of 1OCN·OTf·H2O for MeOH is shown in Fig. 1c and S2.† Similarly, MeOH can also lead the blue-shifted spectrum from 635 nm to 556 nm, however, this transformation is irreversible. The corresponding CIE color coordinates for the luminescence color change have been illustrated in Fig. S5.† Moreover, 1OCN·OTf·H2O showed strong and wide absorption bands in the visible light region before and after MeCN/MeOH stimulation, accompanied by a significant wavelength shift in the lowest energy absorption according to the observed color changes. The maximum absorption value of 1OCN·OTf·H2O after MeCN/MeOH stimulation shifted from blue at 538 nm to 360 nm (Fig. 1d and e). Consequently, based on the special structure and properties of 1OCN·OTf·H2O, a reversible colorimetric/luminescent response for MeCN and an irreversible response for MeOH are realized.3.2 Structural origin and theoretical study for the stimuli-response
To interrogate the structural origin of the stimuli-response of prepared Pt(II) complex, we cultured the single crystal structures before and after contacting with MeCN by liquid phase diffusion method. In the single crystal structure of red form, the Pt(tpy)OCN+ cations pack as dimer aggregates arranged in head-to-tail manner with alternating short intradimer and long interdimer Pt–Pt distances of 3.3838 Å and 3.5058 Å between the nearest Pt(II) units, respectively (Fig. 2a and b). And it has been revealed that the red form Pt(II) complex does contain a crystal water, exactly formulated as hydrated 1OCN·OTf·H2O. While from the crystal structure of the yellow form (Fig. 2c and d), it can be clearly seen no crystal water is contained, thus defined as dehydrated 1OCN·OTf. The individual Pt(tpy)OCN+ unit in the yellow form stacks in head-to-tail manner as an extended continuous, quasi one-dimensional chain with a common separation of 3.5142 Å between the nearest Pt(II) neighbors. This suggests that exposure of 1OCN·OTf·H2O to MeCN causes the loss of crystal water within the lattice to form 1OCN·OTf, which induces significant reorganization in the packing manner, causes the average Pt–Pt separation to grow, and finally weakens the Pt–Pt interaction (Scheme 1). The weakened Pt–Pt interaction results in the stabilization of the lowest triplet dσ*(Pt)–π*(tpy) states, and consequently makes a transition from red to yellow color. Indeed, it has been experimentally proved that guest MeCN molecules able to withdraw the crystal water from the crystal through hydrogen bonding and van der Waals interactions. This demonstrates that the indirect interaction of external molecule with crystal water also able to achieve desired stimuli-response.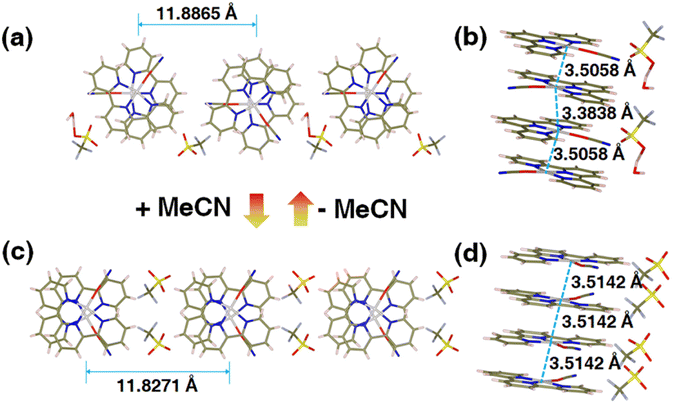 | ||
| Fig. 2 Crystal structures of 1OCN·OTf·H2O (a and b, Table S2†) and 1OCN·OTf·H2O upon MeCN exposure (c and d, Table S2†). | ||
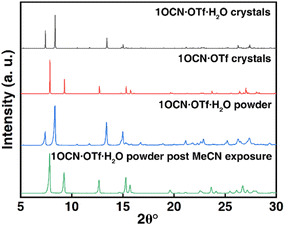
In addition, we have studied the X-ray diffraction patterns of 1OCN·OTf·H2O and 1OCN·OTf (Fig. 3 and XRD of 1OCN·OTf·H2O after exposure to MeOH). The study of the crystal structure of 1OCN·OTf shows an increase in the Pt–Pt distance compared to the red 1OCN·OTf·H2O, which conversely indicates a decrease in the Pt–Pt interaction. By comparing the XRD spectra of the simulated single crystal 1OCN·OTf with powder one, it is found that the two are completely consistent, which proves that our inference is reasonable.
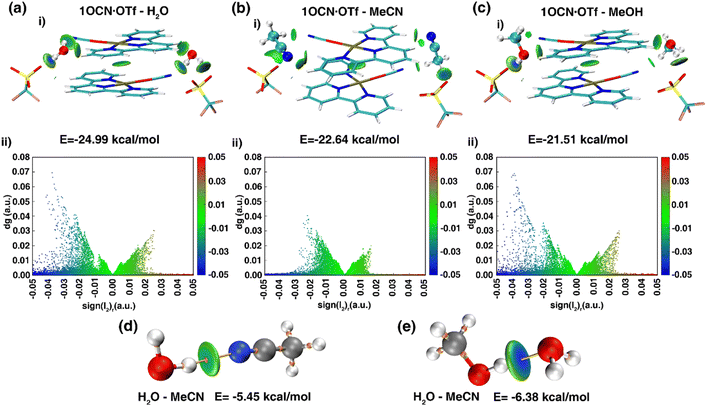
To deeply clarify the stimuli-responsive behavior of mode of 1OCN·OTf with H2O, MeCN and MeOH, and the root cause of reversible and irreversible phenomena, theoretical calculation was carried out.41 We obtained the dimer from the crystal structure and performed a more realistic simulation. The interaction between molecules of 21OCN·OTf and 2H2O/MeCN/MeOH can be calculated by formula EBind = (2 × E1OCN·OTf·H2O − 2 × E1OCN·OTf − 2 × EH2O)/2 (take 1OCN·OTf and H2O as an example). The binding ability of 1OCN·OTf for small molecules is H2O (−24.99 kcal mol−1) > MeCN (−22.64 kcal mol−1) > MeOH (−21.51 kcal mol−1). Then, we use IGMH analysis to visualize the weak interaction between dimer. The IGMH analysis as shown in Fig. 4 was aimed to deeply understand the difference in binding energy of 1OCN·OTf towards H2O, MeCN and MeOH. Upon observation of the scatter plots of dg (density gradient) versus sign(l2)r, a real space function sign(l2)r related to l2 (the second largest eigenvalue of the Hessian matrix of electron density) and r (the electron density in the corresponding region) could be defined. Negative value of sign(l2)r represents attractive interactions such as H-bonding, which actually makes the essential contribution to the binding ability towards small molecules (positive value of sign(l2)r represents repulsive interaction such as steric effect). As shown in Fig. 4a(i) and (ii), it can be found that there are an obvious attractive interactions between H2O molecule and 1OCN·OTf, which are considered to be H-bond since the IGMH isosurface centers of high negative value tend to own denser electrons. Comparatively, the IGMH isosurface centers for the systems of 1OCN·OTf–MeCN and 1OCN·OTf–MeOH are less negative and have low electron density, indicating the weaker attractive binding effect (Fig. 4b and c). In conclusion, the strongest binding ability of 1OCN·OTf with H2O molecules means that MeCN and MeOH are unable to enter the crystal lattice, the variation in crystal packing and spectral shift derive from the indirect interaction of MeCN/MeOH with crystal water molecule. As shown in the Fig. 4d and e, the blue color in the center of O–H⋯O(H2O–MeOH) isosurface is darker than that of O–H⋯N(H2O–MeCN), which means that hydrogen bonds are stronger in the former, and the calculated value shows this more intuitively: the hydrogen bond between MeOH and H2O (−6.38 kcal mol−1) is greater than the hydrogen bond between MeCN and H2O (−5.45 kcal mol−1). This different hydrogen bond strength can explain the reversible behavior of 1OCN·OTf·H2O for MeCN and the irreversible pathway for MeOH.
3.3 Sensing properties for MeCN
Selectivity being a key consideration for sensing applications, it was in our interest to probe the response selectivity. The 1OCN·OTf·H2O powders were exposed to a range of different organics, namely, acetonitrile, methanol, acetone, petroleum ether, n-hexane, carbon tetrachloride, carbon dichloride, cyclohexane, ethyl ether, ethyl acetate, tetrahydrofuran, ethanol, acetaldehyde, butyronitrile, valeronitrile, DMF or DMSO. Since practical matrices can be expected to contain an overwhelming excess of interfering species compared to the target species (as well as limited miscibility of some of the chosen organics with water), pure organics were compared with 30% MeCN in deionized water (v/v). The “red” to “yellow” form was observed to be selective for MeCN/MeOH, and the salt had no colorimetric and Luminescent response to other organic matter (Fig. 5a and the spectra is shown in Fig. S3†). It is worth noting that the 1OCN·OTf·H2O salt was soluble in the solvents DMF and DMSO; a more comprehensive list of the colorimetric and phosphorescence response of the 1OCN·OTf·H2O powders to 18 solvents is tabulated in (Table S1†). The tabulated results demonstrate that the colorimetric/luminescent response of the 1OCN·OTf·H2O salt shows size selectivity to MeCN. Subsequently, in order to study the electron selectivity of 1OCN·OTf·H2O to MeCN, increasing the carbon chain length from acetonitrile to butyronitrile or valeronitrile makes the salt completely nonresponsive them.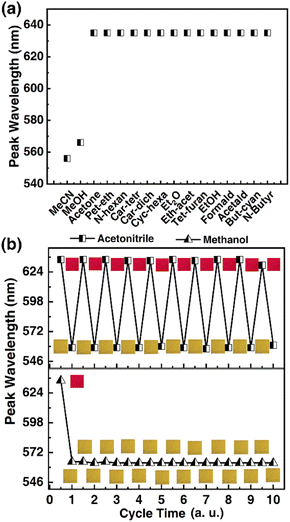 | ||
| Fig. 5 (a) Emission selectivity of 1OCN·OTf·H2O to MeCN. (b) Cyclic diagram of 1OCN·OTf·H2O response to MeCN and MeOH. | ||
Subsequently, the reversibility of the MeCN/MeOH response of 1OCN·OTf·H2O was investigated experimentally. The spectrum was blue-shifted from 635 nm to 556 nm after exposure to MeCN with 1OCN·OTf·H2O and then recovered by removing MeCN. Moreover, after repeating the above operations of adding and erasing MeCN aqueous solution ten times, there was no significant change in the position of the phosphorescence emission peak, proving the excellent reversibility of 1OCN·OTf·H2O nanostructures Fig. 5b. This process is irreversible with MeOH, which is consistent with our previous theoretical calculations.
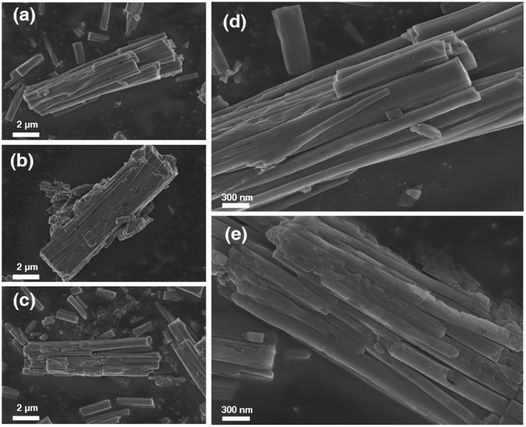
The morphological changes of 1OCN·OTf·H2O resulting from multiple cycles of MeCN were examined by scanning electron microscopy, as shown in Fig. 6. Microscopic images of the 1OCN·OTf·H2O prior to MeCN exposure demonstrated neat crystals with surfaces free of blemishes (Fig. 6a and d). Representative images recorded after the first cycle of MeCN action show tiny debris traces. The images recorded after 1 cycle of MeCN showed significant stress within the crystal, and the smooth crystal was broken along the original crystal (Fig. 6b). With each cycle, more surface stresses are induced in the crystals that results in their progressive fragmentations, which also results in an increase in their active surface area. It is worth mentioning that, by characterizing the micromorphology of 1OCN·OTf·H2O before and after reacting with MeCN aqueous solution Fig. 6a and c, it can be observed that even after 10 times, the surface of 1OCN·OTf·H2O nanorods only becomes slightly rough (Fig. 6e), which also reflects the excellent reversibility of 1OCN·OTf·H2O in the sensing process of MeCN solution.
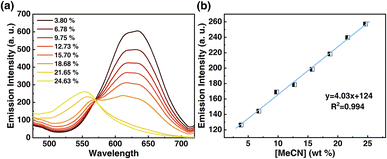
Motivated by the desire to determine the sensitivity of this method to MeCN detection, a calibration curve was constructed, where changes in emission spectra of 1OCN·OTf·H2O were recorded upon exposure to progressively incremental percentages of MeCN in water using a method described in the Experimental section. The emission spectrum of microcrystalline powder of 1OCN·OTf·H2O suspended in a contact solution of deionized water showed a characteristic asymmetric emission band with a maximum at 556 nm. The changes in the emission intensity per unit volume of contact solutions, upon the introduction and subsequent progressive increment in the percentage of MeCN in the contact solution are overlaid in Fig. 7a. It is observed that as the concentration of MeCN is increased from 0 up to 37.5% of total volume, the emission intensity (normalized per volume) of the 635 nm band progressively decreases. A low energy band is simultaneously observed to grow in intensity at 556 nm, that is attributed to the dσ*(Pt)–π*(tpy) 3MLCT band as described earlier. Further increasing the MeCN concentration results in a progressive blue shift of the 635 nm band, which is also accompanied with a consistent growth in the MLCT band at 556 nm. The progressively increasing emission intensity at 556 nm as a function of increasing MeCN concentration was used to construct a calibration curve, as shown in Fig. 7b. The plot of the emission intensity plotted against the percentage of MeCN in water shows a linear correlation within an MeCN content of 2.56–27.60%. At higher MeCN content, it plateaus off suggesting the tendency of the MLCT transition intensity to reach saturation. From the plot, a limit of quantification of 2.56% MeCN is obtained. Further, a detection limit can also be obtained using on the IUPAC recommended equation  reported by Long et al.42 Here, DL is the detection limit, k is a numerical constant, m is the slope of the linear region of the plot, and Sb is the standard error for the blank measurements, respectively. In accord with IUPAC recommendations, a k value of 3 was applied, which corresponds to a 99.87% confidence level. Based on this, a detection limit of 1% is obtained. Therefore, 1OCN·OTf·H2O has a good detection effect on MeCN.
3.4 Anticounterfeiting application
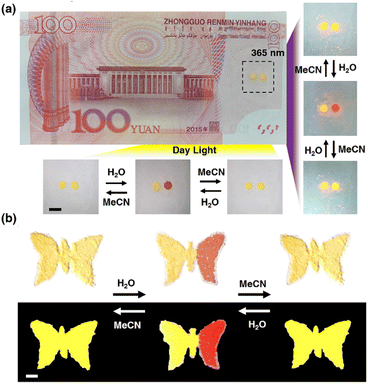
Discussed the practical application of anti-counterfeiting. This unique Pt(II) salt is very attractive for anti-counterfeiting labels, as its proven ability to achieve both reversible and irreversible color/luminescence is very rare and difficult to replicate. As shown in Fig. 8a, there are two anti-counterfeiting yellow “dot” patterns on the banknote. In the initial state, the left point is treated with MeOH, and the right point is treated with MeCN. Both appear yellow at the same time. The point on the right can be converted to red through H2O, and then to yellow through MeCN. Reversible conversion is also feasible by returning red to the original yellow through H2O treatment and further MeCN treatment. The spots treated with MeOH remained unchanged in color and were irreversible. At the same time, 1OCN·OTf·H2O can also be made into various trademark patterns such as butterfly patterns, enriching application forms, as shown in Fig. 8b. These observations indicate that combining the reversible and irreversible properties of 1OCN·OTf·H2O can create more complex anti-counterfeiting information, which has the potential to become an advanced anti-counterfeiting material and has enormous application potential in anti-counterfeiting.4 Conclusion
In conclusion, we report a novel stimulation-responsive Pt(II) tripyridine complex by affecting the packing style through weak interactions between crystal water and external organic molecules. The technique relies on the interaction of the complex 1OCN·OTf·H2O with MeCN and MeOH, accompanied by a change in color and luminescence from red to yellow. It is important to note that the MeCN reaction is reversible, whereas the MeOH reaction is irreversible, probably because of the difference in the strength of the hydrogen bonds formed. Finally, 1OCN·OTf·H2O was used as an economical sensing material for MeCN, and its sensing properties of high selectivity, good reversibility, appropriate sensitivity, and fast response speed were systematically studied. Moreover, by taking advantage of the reversibility and irreversibility of the chromism, advanced anticounterfeiting application has also been conducted.Author contributions
Conceptualization, data curation, visualization, writing – original draft, Depeng Li; writing – review & editing, funding acquisition, project administration, Zhen Su; writing – review & editing, Xiaoyun Hu; writing – review & editing, methodology, Yuhong Su; methodology, data curation, validation, Qingqing Guan.Conflicts of interest
The authors declare that they have no known competing financial interests or personal relationships that could have appeared to influence the work reported in this paper.Acknowledgements
The acknowledgements come at the end of an article after the conclusions and before the notes and references. We gratefully acknowledge financial support from the Youth Science Foundation of Xinjiang (2022D01C69), Major Science and Technology Project of Xinjiang (2022A01006-3), Science Foundation for Outstanding Young People of Xinjiang (2022D01E40), Tianchi Doctoral Program (TCBS202130, 51052300573).Notes and references
- F. Sara, M. Lorenzo, M. Ignacio, V. Silvia, A. Irene, T. Daniel, J. B. Henk and S. Violeta, J. Mater. Chem. C, 2022, 10, 15491–15500 RSC.
- H.-Q. Zheng, Y. Yang, Z. Wang, D. Yang, G. Qian and Y. Cui, Adv. Mater., 2023, 23, 2300177 CrossRef PubMed.
- X. He, J. Zhang, X. Liu, Z. Jin, J. W. Y. Lam and B. Z. Tang, Angew. Chem., Int. Ed., 2023, 62, e202300353 CrossRef CAS PubMed.
- M. H.-Y. Chan and V. W.-W. Yam, J. Am. Chem. Soc., 2022, 144, 22805–22825 CrossRef CAS PubMed.
- B. Jiang, J. Zhang, J.-Q. Ma, W. Zheng, L.-J. Chen, B. Sun, C. Li, B.-W. Hu, H. Tan, X. Li and H.-B. Yang, J. Am. Chem. Soc., 2016, 138, 738–741 CrossRef CAS PubMed.
- I. Ritacco, G. Mazzone, N. Russo and E. Sicilia, Inorg. Chem., 2016, 55, 1580–1586 CrossRef CAS PubMed.
- L.-Y. Liu, H. Fang, Q. Chen, M. H.-Y. Chan, M. Ng, K.-N. Wang, W. Liu, Z. Tian, J. Diao, Z.-W. Mao and V. W.-W. Yam, Angew. Chem., Int. Ed., 2020, 59, 19229–19236 CrossRef CAS PubMed.
- M. H.-Y. Chan, S. Y.-L. Leung and V. W.-W. Yam, J. Am. Chem. Soc., 2019, 141, 12312–12321 CrossRef CAS PubMed.
- Y. Li, L. Chen, Y. Ai, E. Y.-H. Hong, A. K.-W. Chan and V. W.-W. Yam, J. Am. Chem. Soc., 2017, 139, 13858–13866 CrossRef CAS PubMed.
- H. L.-K. Fu, C. Po, S. Y.-L. Leung and V. W.-W. Yam, ACS Appl. Mater. Interfaces, 2017, 9, 2786–2795 CrossRef CAS PubMed.
- P. Pinter, J. Soellner and T. Strassner, Organometallics, 2021, 40, 557–563 CrossRef CAS.
- Z. Su, Y. Li, J. Li, K. Li and X. Dou, J. Mater. Chem. A, 2022, 10, 8195–8207 RSC.
- Z. Su, Y. Li, J. Li and X. Dou, Sens. Actuators, B, 2021, 336, 129728 CrossRef CAS.
- S. Kromer, S. Roy, J. E. Yarnell, C. M. Taliaferro and F. N. Castellano, Dalton Trans., 2023, 52, 4008–4016 RSC.
- A. W. Mills, A. J. S. Valentine, K. Hoang, S. Roy, F. N. Castellano, L. X. Chen and X. Li, J. Phys. Chem. A, 2021, 125, 9438–9449 CrossRef CAS PubMed.
- A. E. Norton, M. K. Abdolmaleki, J. M. Ringo, V. M. Shingade, C. Cashen, M. Sharma, W. B. Connick and S. Chatterjee, Sens. Actuators, B, 2020, 329, 129207 CrossRef.
- J. Soellner and T. Strassner, Chem.–Eur. J., 2018, 24, 5584–5590 CrossRef CAS PubMed.
- M. J. Bryant, J. M. Skelton, L. E. Hatcher, C. Stubbs, E. Madrid, A. R. Pallipurath, L. H. Thomas, C. H. Woodall, J. Christensen, S. Fuertes, T. P. Robinson, C. M. Beavers, S. J. Teat, M. R. Warren, F. Pradaux-Caggiano, A. Walsh, F. Marken, D. R. Carbery, S. C. Parker, N. B. McKeown, R. Malpass-Evans, M. Carta and P. R. Raithby, Nat. Commun., 2017, 8, 1800 CrossRef CAS PubMed.
- M. Martínez-Junquera, E. Lalinde and M. T. Moreno, Inorg. Chem., 2022, 61, 108998–110914 CrossRef PubMed.
- E. N. Amie, K. A. Mahmood, Z. Daoli, D. T. Stephen, R. K. Steven, D. B. Trevor, O. B. Mark, B. C. William and C. Sayandev, Sens. Actuators, B, 2022, 359, 131502 CrossRef.
- J. Ni, G. Liu, M. Su, W. Zheng and J. Zhang, Dyes Pigm., 2020, 180, 108451 CrossRef CAS.
- J. S. Field, C. D. Grimmer, O. Q. Munro and B. P. Waldron, Dalton Trans., 2009, 39, 1558–1567 RSC.
- S.-J. Choi, S.-J. Kim, J.-S. Jang, J.-H. Lee and I.-D. Kim, Small, 2016, 12, 5781 CrossRef CAS.
- S. H. Liu, M.-S. Lin, L. Y. Chen, Y.-H. Hong, C. H. Tsai, C. C. Wu, A. Poloek, Y. Chi, C. A. Chen and S. H. Chen, Org. Electron., 2010, 12, 15–21 CrossRef.
- G. Cheng, W. Lu, Y. Chen and C. M. Che, Opt. Lett., 2012, 37, 1109–1111 CrossRef CAS PubMed.
- K. C. Tong, P. K. Wan, C. N. Lok and C. M. Che, Chem. Sci., 2021, 12, 15229–15238 RSC.
- V. Sicilia, L. Arnal, D. Escudero, S. Fuertes and A. Martin, Inorg. Chem., 2021, 60, 12274–12284 CrossRef CAS PubMed.
- S. D. Taylor, W. Howard, N. Kaval, R. Hart, J. A. Krause and W. B. Connick, Chem. Commun., 2010, 46, 1070–1072 RSC.
- R. Zhang, Z. Liang, A. Han, H. Wu, P. Du, W. Lai and R. Cao, CrystEngComm, 2014, 16, 5531–5542 RSC.
- A. E. Norton, M. K. Abdolmaleki, J. Liang, M. Sharma, R. Golsby, A. Zoller, J. A. Krause, W. B. Connick and S. Chatterjee, Chem. Commun., 2020, 56, 10175–10178 RSC.
- H.-K. Yip, L.-K. Cheng, K.-K. Cheung and C.-M. Che, J. Chem. Soc., Dalton Trans., 1993, 1, 2933–2938 RSC.
- V. M. Shingade, L. J. Grove and W. B. Connick, Dalton Trans., 2020, 49, 9651–9661 RSC.
- C. Adamo and V. Barone, J. Chem. Phys., 1999, 110, 6158–6170 CrossRef CAS.
- S. Grimme, S. Ehrlich and L. Goerigk, J. Comput. Chem., 2011, 32, 1456–1465 CrossRef CAS PubMed.
- S. Grimme, WIREs Computational Molecular Science, 2011, 1, 211–228 CrossRef CAS.
- F. Weigend, Phys. Chem. Chem. Phys., 2006, 8, 1057–1065 RSC.
- F. Weigend and R. Ahlrichs, Phys. Chem. Chem. Phys., 2005, 7, 3297–3305 RSC.
- T. Lu and Q. Chen, J. Comput. Chem., 2022, 43, 539–555 CrossRef CAS PubMed.
- T. Lu and F. Chen, J. Comput. Chem., 2012, 33, 580–592 CrossRef CAS PubMed.
- W. Humphrey, A. Dalke and K. Schulten, J. Mol. Graphics, 1996, 14(33–38), 27–38 Search PubMed.
- T. Lu and Q. Chen, J. Comput. Chem., 2022, 34, 3736–3743 Search PubMed.
- G. L. Long and J. D. Winefordner, Anal. Chem., 1983, 63, 255–261 Search PubMed.
Footnote |
| † Electronic supplementary information (ESI) available. CCDC 2263879 and 2263889. For ESI and crystallographic data in CIF or other electronic format see DOI: https://doi.org/10.1039/d3ra03554a |
| This journal is © The Royal Society of Chemistry 2023 |

