 Open Access Article
Spherical Ni/NiO nanoparticles decorated on nanoporous carbon (NNC) as an active electrode material for urea and water oxidation reactions†
Parag P. Chavan‡
ab,
Pratiksha D. Tanwade‡a,
Vijay S. Sapner ac and
Bhaskar R. Sathe
 *ad
*ad
aDepartment of Chemistry, Dr Babasaheb Ambedkar Marathwada University, Aurangabad 431004, MS, India. E-mail: bhaskarsathe@gmail.com; Tel: +91-8275306471
bDepartment of Chemistry, School of Science, Sandip University, Nashik, MS, India
cDepartment of Chemistry, Shri Mathuradas Mohota Collage of Science, Nagpur-440024, MS, India
dDepartment of Nanotechnology, Dr Babasaheb Ambedkar Marathwada University, Aurangabad 431004, MS, India
First published on 8th September 2023
Abstract
Herein, we report a chemical method for scalable synthesis of spherical Ni/NiO nanoparticle-decorated nanoporous carbon (NNC) based electrocatalytic system using a simple and easy chemical method with ultra-high activity towards urea electrooxidation. Morphological analysis by scanning electron microscopy (SEM) and high-resolution transmission electron microscopy (HR-TEM) confirms the formation of Ni/NiO NPs on highly nanoporous carbon with an average size of ∼50 nm. X-ray diffraction (XRD) confirms NNC with a face-centred cubic (FCC) crystal structure. Ni/NiO NPs intercalated with nanoporous carbon exhibited the best electrocatalytic performance towards urea oxidation with an ultra-low onset potential of ∼0.33 V vs. SCE, and faster electrokinetic mechanism confirmed from Tafel slope (∼45 mV dec−1), EIS Rct (∼6.98 Ω), and long term durability for 7 h at 10 mA cm−2 with high CO poisoning tolerance. This work affords noble metal-free electrocatalysts for novel appliances and remarkable potential for urea determination, hydrogen generation, real-time water remediation, and energy conversion.
1. Introduction
One of the most vital tasks is finding an eco-friendly electrocatalyst and an efficient way to create H2. Electrocatalytic water splitting is considered to be the most appropriate technology.1 Although there are many advantages to OER, it is limited by the intrinsically slow kinetics of the process (which involves four electron-transfer processes and 1.23 V vs. RHE).2,3 This increases the cost as well as energy waste due to the use of noble metal-based electrocatalysts, which severely limits their use on a large scale. To overcome this obstacle, finding alternative strategies to fabricate high-performance OER electrocatalysts is desirable. In recent years, it has been shown that anodic OER can be replaced with electrocatalytic oxidation of small molecules, such as urea,4 benzyl alcohol,5 and hydrazine,6 which can considerably reduce the overpotential required for H2 production.Denitrification in sewage treatment is currently a major concern since high nitrogen pollution contributes to odorous odours, aquatic bio-toxicity, and even dangerously eutrophic diseases. As a result, available urea decomposition is in great demand for wastewater treatment plants and the overall environment. However, conventional technologies, such as biological means, reverse osmosis, electrochemical, and photochemical methods, are still limited by the disadvantages of traditional management, and most importantly, they should easily convert urea to ammonia or nitrate instead of harmless N2, resulting in terrible energy consumption and nitrogen recontamination. To this end, it is very urgent to propose a new method to directly and completely degrade urea to N2 and CO2.
Noble metals such as Pt,7 Ir,8 Ru,9 and others are expensive; hence, non-noble metal catalysts that are affordable are being studied for the oxidation of small organic molecules in alkaline media. Ni and Ni-based hybrid electrodes are widely employed as electrocatalysts in the oxidation and determination of organics such as methanol, ethanol, glucose, cyclohexanol, and aspirin. Aladeemy et al.10 successfully demonstrated the electrolysis of urea to produce H2 using Ni electrodes in an alkaline medium. Several recent experiments and theoretical investigations have been conducted to uncover urea hydrolysis in the presence of urease (containing Ni active sites).11 However, there has been little research into the electrochemical oxidation mechanism of urea on Ni-based systems in alkaline media.3,12 Daramola et al.13 studied the dissociation rates of urea in the presence of nickel oxyhydroxide (NiOOH) using density functional theory (DFT) and reported the desorption of CO2 from urea as the rate-limiting step. They also demonstrated that the NiOOH catalyst surface could be deactivated by surface blockage due to CO groups.14 The aforementioned catalyst shows poor H2 production activity, low selectivity for complete CO2 and N2 formation, with high CO poisoning which makes our catalyst more feasible toward UOR due to the highly porous nanostructure that allows CO incorporation into it. Ni/NiO formation, which is stabilized by the NC backbone due to synergetic interactions between Ni and NiO with NC, helps increase the rate of charge transfer during electrocatalysis.
Herein, in consideration of the above discussion, this work represents that the doping of Ni triggers a structural transition with electronic structure changes at the surface and lowers the onset potential required for Ni/NiOOH, which strongly enhances urea electrolysis activity. Impressively, through the potential conditioning procedure, the optimized NNC electrocatalyst manifests an excellent electrocatalytic performance for urea electrolysis in 0.5 M urea in 1 M KOH solution, presenting a low onset potential of 0.32 V vs. SCE for urea oxidation.
2. Experimental
2.1 Materials and reagents
Nickel chloride (NiCl2·6H2O), ammonium hydroxide (NH4OH), potassium hydroxide (KOH 85% assay), and urea (99% assay) were purchased from Merck India. All these chemicals were used without further purification. Deionized (DI) water (Merck Millipore) was used as a solvent in the synthesis of the materials as well as for electrochemical and electrocatalytic studies.2.2 Synthesis of nanoporous carbon (NC)
The synthesis of nanoporous carbon (NC) with a few layers of graphene was achieved by a two-step processing approach, i.e., chemical followed by physical treatment. The chemical process involves multiple chemical treatment steps followed by physical activation carried with thermal decomposition using a muffle furnace. First, Tulasi leaves were collected from the botanical garden, washed thoroughly several times with distilled water to remove dust and other surface-adsorbed species, and allowed to dry naturally, followed by crushing to improve the surface area. To further improve chemical active sites (–OH) on the carbon nanostructures, the fine powder was soaked overnight in 0.5 M KOH solution. This socked powder was filtered and washed with distilled water thrice, followed by natural drying overnight. This dried powder is utilized further for the synthesis of nanoporous carbon (NC) with few-layer graphene. In the second step, a sample is allowed to calcinate at 700 °C (1 h) in a muffle furnace in an N2 atmosphere and allowed to cool down naturally. Further, the obtained product was washed with distilled water to remove excess KOH until the pH of the filtrate reached 7, followed by washing with alcohol to remove trapped water and any other impurities. Further, this product was dried in the oven at 120 °C for 30 min to remove the moisture and other volatile impurities.2.3 Synthesis of nickel doped nanoporous carbon (NNC)
0.05 M of NiCl2 solution and 0.5 M of KOH solution were prepared separately in distilled water. 100 mg of NC (Scheme 1) was taken in 50 mL of NiCl2 solution and heated till the temperature reached 80 °C. Further, 50 mL of 0.5 M KOH solution and 5 mL of ammonia were added dropwise with constant stirring until milky white colour was obtained in the reaction mixture and stirred for 2 h with reflux. This solution was filtered through a membrane filter paper. Ni nanoparticles were transferred in a silica crucible and heated at 500 °C in a muffle furnace for 2 h, followed by cooling naturally. This as-synthesized product is further used for structural and morphological characterizations, followed by electrochemical and electrocatalytic studies of urea oxidation reactions. Synthesis of NiO-NPS was done according to one of our group reports.15 | ||
| Scheme 1 Schematic representation of NNC formation.16,18 | ||
2.4 Fabrication of NNC electrode for urea oxidation
All the electrochemical measurements were investigated on a 660D electrochemical workstation CHI-660E (CH-Instrument USA) with the traditional three-electrode arrangement at 25 °C. Platinum wire, Hg/HgO, and modified glassy carbon electrode (GCE 3 mm diameter) were used as the counter, reference, and working electrodes, respectively. Alumina powder was used to polish GC electrodes of 0.1, 0.3, and 0.05 μm and then washed with deionized water, followed by ethanol. The calculated amount, i.e., 3 mg of electrocatalyst, was dispersed in 1 mL of isopropanol and sonicated to make the homogeneous ink. The NNC ink was applied on the active area of the GC surface and was dried in air at RT. The electrocatalytic performance of NNC towards UOR is evaluated in 0.5 M KOH. Electrochemical studies were performed using cyclic voltammetry (CV), linear sweep voltammetry (LSV), electrochemical impedance spectroscopy (EIS), and current–potential stability using chronoamperometric studies.2.5 Characterization
X-ray diffraction (XRD) patterns of the materials were obtained using a Rigaku-Ultima IV fully automatic high-resolution X-ray diffractometer equipped with an X-ray generator operating at 40 kV and 40 mA. The measurements were performed in a step of 0.01° (2θ) at room temperature. The as-prepared electrocatalysts were characterized by FE-SEM (JEOL-Japan) equipped with an energy dispersive X-ray analysis (EDAX) attachment. High-resolution transmission electron microscopy (HR-TEM) was performed using a JEOL JEM 2100 instrument. Fourier transform infrared (FTIR) spectroscopy was recorded in the range of 4000–500 cm−1 on a PerkinElmer Spectrum-I spectrometer. Field emission scanning electron microscopy and Raman spectroscopy were performed using a Raman spectrometer with a microscope (Seki Technotron Corp., Tokyo) with a 532 nm laser. UV-visible spectroscopy of the samples was done using a Jasco V-750 spectrometer. X-ray photoelectron spectroscopy (XPS) was analyzed by a Thermo Fischer Scientific ESCALAB Xi+ instrument. All electrochemical studies were performed using a CHI-660E potentiostat (CH-instrument, USA) and a three-electrode cell comprising a saturated calomel (SCE) reference electrode, a Pt wire counter electrode, and a working electrode.3. Results and discussion
3.1 Scanning electron microscopy (SEM) analysis
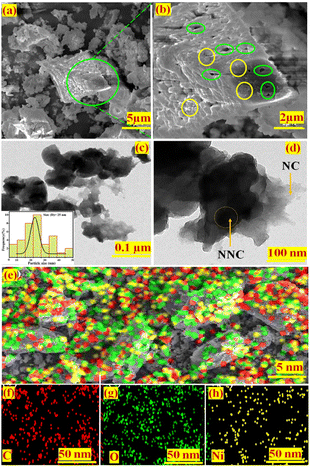
Scanning electron microscopy (SEM) is used to characterize the morphology of NiO-NPs decorated on nanoporous carbon, i.e. (NNC) (Fig. 1(a) and (b)). The nanoporous carbon has a well-defined and interlinked 3D network, as well as a uniform distribution of Ni and NiO nanoparticles (yellow circle) ranging in size from 10 to 50 nm. This is consistent with the tiny size of the pores (green circle) depicted in Fig. 1(b), with pore sizes ranging from 50 to 70 nm. It is obvious from the images that NiO-NPs are uniformly dispersed over a mesh-like structure of carbon, i.e., nanoporous carbon.3.2 Transmission electron microscopy (TEM) analysis
Furthermore, the morphology of the NNC material is scanned using transmission electron microscopy (TEM) and shown in Fig. 1(c) and (d). This demonstrates that the NNC catalyst has a highly porous carbon structure and well-distributed Ni/NiO spherical NPs, with an average particle size of ∼25 nm, resulting in good functionalization of nano-porous carbon. Ni core–shell and surface are covered with O and are uniformly spread across the nanoporous carbon sheets.3.3 Energy dispersive analysis of X-ray analysis
The elemental analysis of NNC is performed by SEM using energy dispersive spectral analysis of X-ray (EDAX), which evaluates the energy and intensity distribution of X-ray signals from the surface. Fig. 1(e) depicts the uniform distribution of Ni and NiO NPs over nanoporous carbon. While Fig. 1(f)–(h) depicts elemental analysis by EDAX containing C, O, and Ni, with corresponding elemental compositions of 48%, 35%, and 17% for NNC.3.4 X-ray diffraction (XRD)
XRD pattern used to identify the crystal phases and crystallinity of NNC electrocatalysts. From Fig. 2(a) the planes of (111), (200) and (101) match with metallic Ni [JCPDS card no. 04-0850]. While intense planes of (002), and (111) with some weaker signals for (200) and (220) matching NiO formation JCPDS card no. 45-1027 forming a Face Centered Cubic Structure for NNC material. Accordingly, NC material exhibits peaks at the plane of (002) and (102) matching with [JCPDS card no. 00-041-1487]. Overall data is support to literature and conforming the formation of Ni/NiO NPs on NC support.16–18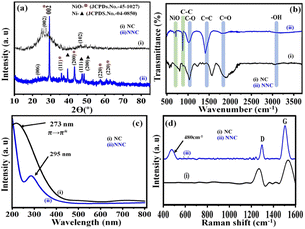 | ||
| Fig. 2 Superimposed (a) X-Ray Diffraction (XRD), (b) FTIR spectra, (c) UV visible spectra and (d) Raman spectra of (i) NC and (ii) NNC, respectively. | ||
3.5 FTIR analysis
FTIR analysis validated the different functional groups of NC and changes after Ni/NiO decoration, i.e., of NNC, as shown in Fig. 2(b). As a result, the overlaid FTIR spectra of NC and NNC demonstrated that C–H, C–C, C![[double bond, length as m-dash]](https://www.rsc.org/images/entities/char_e001.gif) O (carbonyl), and C
O (carbonyl), and C![[double bond, length as m-dash]](https://www.rsc.org/images/entities/char_e001.gif) C have similar intense and well-defined distinctive peaks at 1030 cm−1, 1400 cm−1, 1750 cm−1, and 2200 cm−1, respectively. The additional stretching frequencies 710 cm−1 and 875 cm−1 correspond to Ni–O–C and Ni–O, respectively, in NNC and are in good agreement with literature.15,19
C have similar intense and well-defined distinctive peaks at 1030 cm−1, 1400 cm−1, 1750 cm−1, and 2200 cm−1, respectively. The additional stretching frequencies 710 cm−1 and 875 cm−1 correspond to Ni–O–C and Ni–O, respectively, in NNC and are in good agreement with literature.15,19
3.6 UV-visible spectral analysis
It indicates that the decoration of NiO-NPs onto a nano-porous carbon material is successfully achieved. One of the most important approaches for estimating the energy structures and optical properties of nanoparticles is UV-visible absorption spectroscopy. Accordingly, Fig. 2(c) depicts the absorbance by Ni/NiO nanoparticles as a function of wavelength at 302 nm. A faint band at 520 nm and 725 nm was attributed to the charge transfer due to the nanoporous carbon structures. These findings are supported by the physicochemical characterizations and similar systems from the literature.203.7 Raman spectroscopy
In addition to this, the structural changes in the carbon framework were investigated by superimposed Raman spectra and shown in Fig. 2(d), monitoring sp3 (defective) and sp2 (graphitic) carbons before and after doping with Ni/NiO NPs. The peak at 480 cm−1 indicates the extent of Ni decoration on the surface of nonporous carbon. Accordingly, in the case of NC, signals appeared at 1305 cm−1 and 1530 cm−1, corresponding to D and G bands, respectively, and their associated intensity ratios, i.e., ID/IG are 0.64 and 1.03 for NC and NNC, respectively. The enhancement of the ID/IG ratio by more than double could be due to an increase in the disorders in NC after the decoration of Ni/NiO NPs and is also in good agreement with similar reports from the literature.21Thermogravimetric (TG & DT) analysis is shown in (Fig. S1†). In brief, the TGA curve (i) shows two weight losses, i.e., at 120 °C and 460 °C, whereas sharp DTA peaks are associated with weight losses at 450 °C and 560 °C (ii). The first weight loss observed at 100 °C could correspond to the removal of hygroscopic and volatile physically adsorbed species. The second weight loss is caused by the thermal decomposition of supported carbon from NC and the remaining weight of Ni/NiO particles.
3.8 X-ray photoelectron spectral analysis
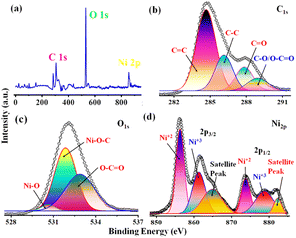
The qualitative and elemental surface analysis of the NNC composite has been evaluated by using XPS and shown in Fig. 3. Accordingly, Fig. 3(a) shows the full survey having prominent signals corresponding to O 1s, C 1s, and Ni 2p, confirming the NNC formation. Moreover, Fig. 3(b) demonstrates the deconvoluted data for C 1s signal appeared at 284.8 eV, 286.8 eV, 287.5, and 288.2 eV, corresponding to C–C, C![[double bond, length as m-dash]](https://www.rsc.org/images/entities/char_e001.gif) C, C–O, C
C, C–O, C![[double bond, length as m-dash]](https://www.rsc.org/images/entities/char_e001.gif) O, and O–C
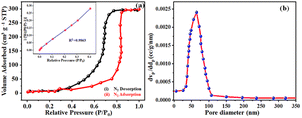
O, and O–C![[double bond, length as m-dash]](https://www.rsc.org/images/entities/char_e001.gif) O bands respectively. Further, Fig. 3(c) represents the O 1s spectra having intense signals at 529, 530.2, 531.9, and 533.5 eV correspond to Ni–O, C–O–Ni, CO, and C–OH, confirming the oxygen environment presented on the nanoporous carbon surface.17,22 Finally, Fig. 3(d) indicates that Ni 2P peaks appearing at 856.07 and 873.9 eV are Ni 2P3/2 and peaks at 861.3 and 878.8 correspond to Ni 2P1/2, confirming the Ni is in +2 and +3 oxidation states, respectively, and the additional informal peaks at 860.7 eV and 880.2 eV correspond to the satellite peaks arising from surface oxidation. The peak at 860.3 is broad due to surface adsorbed oxygen and also locally available oxygen of the nanoporous carbon surface and Ni atoms of nanoparticles and these findings are in good agreement with the literature.4 The surface area is one of the most important quantities for characterizing porous materials. The BET analysis is the standard method for defining surface areas from N2-adsorption isotherms and was originally derived for multilayer gas adsorption onto flat surfaces. NNC shows type-IV adsorption isotherm with a high BET (Brunauer–Emmett–Teller) specific surface area of 340 m2 g−1, and as shown in Fig. 4(a) inset with isotherm of multiple times BET at low pressure provide linear slope with R2 = 0.9863. Fig. 4(b) shows that the pore diameter of NNC is ∼70 nm. The presence of the H1 hysteresis loop suggests the existence of the mesoporous feature in the NNC due to the porous nature of rGO.
O bands respectively. Further, Fig. 3(c) represents the O 1s spectra having intense signals at 529, 530.2, 531.9, and 533.5 eV correspond to Ni–O, C–O–Ni, CO, and C–OH, confirming the oxygen environment presented on the nanoporous carbon surface.17,22 Finally, Fig. 3(d) indicates that Ni 2P peaks appearing at 856.07 and 873.9 eV are Ni 2P3/2 and peaks at 861.3 and 878.8 correspond to Ni 2P1/2, confirming the Ni is in +2 and +3 oxidation states, respectively, and the additional informal peaks at 860.7 eV and 880.2 eV correspond to the satellite peaks arising from surface oxidation. The peak at 860.3 is broad due to surface adsorbed oxygen and also locally available oxygen of the nanoporous carbon surface and Ni atoms of nanoparticles and these findings are in good agreement with the literature.4 The surface area is one of the most important quantities for characterizing porous materials. The BET analysis is the standard method for defining surface areas from N2-adsorption isotherms and was originally derived for multilayer gas adsorption onto flat surfaces. NNC shows type-IV adsorption isotherm with a high BET (Brunauer–Emmett–Teller) specific surface area of 340 m2 g−1, and as shown in Fig. 4(a) inset with isotherm of multiple times BET at low pressure provide linear slope with R2 = 0.9863. Fig. 4(b) shows that the pore diameter of NNC is ∼70 nm. The presence of the H1 hysteresis loop suggests the existence of the mesoporous feature in the NNC due to the porous nature of rGO.
4. Electrochemical studies
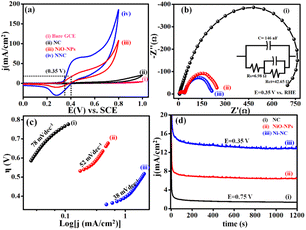
Electrochemical features of NNC towards UOR in comparison with NiO-NPs benchmark catalyst were examined from cyclic voltammetry (CV), EIS, Tafel slope, and chronoamperometry (i–t) under different operational conditions. Accordingly, Fig. 5(a) displays LSVs at 50 mV s−1 for NNC, and the ultrahigh current density is of 10 mA cm−2 at an ultralow onset potential of 0.32 V vs. SCE than NiO-NPs (0.45 V vs. SCE). Moreover, for NNC, the oxidation peak for distinctive activation of Ni to Ni–OOH occurred with no back peak for COx adsorption in CV (Fig. S2†) and EIS, as shown in Fig. 5(b) for NNC having lower semicircle as compared with NiO-NPs and NC at 0.35 V vs. SCE. Low-frequency region semicircle represents solution resistance called Warburg impedance (W) caused by ion diffusion from the NNC-electrolyte interface. NNC exhibits the smallest Rct value (∼6.98 Ω) and provides active electrode surface interactions. As illustrated in Fig. 5(c), the Tafel slopes for NNC, NiO-NPs, and NC are 38, 52, and 78 mV dec−1, respectively, indicating that NCC demonstrates superior UOR performance and kinetic activity over other systems.In addition, NC nanocomposite stabilizes Ni NP's structural, functional as well as electrochemical stability even in harsh conditions, as displayed in Fig. 5(d) and inhibits structural damage from the continuous redox processes of electrolyte ions during chronoamperometric (i–t) stability test at 0.34 V of NNC in 0.5 M KOH with 0.3 M urea, as shown in Fig. S3.† NNC remains stable at 0.34 V for 10 mA cm−2 for 7 h. Interestingly, the current density increases without drop due to surface activation during electrochemical studies, indicating NNC has a strong ability to inhibit CO poisoning or surface deactivation during UOR. The enhancement in the electrocatalytic performance of NNC towards UOR is mainly attributed to the strong electronic coupling between NC and NiO-NPs and also could be due to the surface modification with NiO-NPs, which provides more exposure of active sites and increases specific surface area ESCA (Fig. S6†). Higher ESCA (42.89 cm2), enhancement factor (3040), and roughness factor (142.89) for NNC demonstrate high electron transport ability over NC. This suggests that a low diffusion coefficient for NNC during UOR, owing to enhanced charge transfer rate and rapid kinetics. The synergetic interactions between Ni and NiO with NC help to increase the rate of charge transfer during electrocatalysis.
4.1 Effect of urea concentration
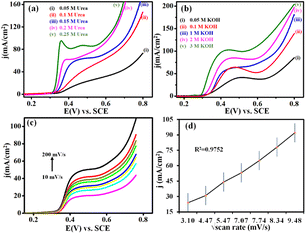
Interestingly, from Fig. 6(a), it is observed that the peak current of urea oxidation linearly increases while increasing the concentration of urea. This could be due to the diffusion of oxidized species on NNC increasing with increasing urea concentration. These observations can be co-related in (Fig. S4†), which shows a linear increment of anodic peak vs. concentration of urea. Hence, calibration data obtained from (Fig. S4b†) proved that the NNC revealed an excellent electrocatalytic activity toward UOR, and it can be used as a novel electrode active material for future applications in the sensitive and selective electrochemical UOR.4.2 Effect of KOH concentration
When the concentration of KOH increases, the current density increases and this may be caused due to the availability of OH− ions at the interface, resulting in the formation of an active intermediate Ni–OOH layer. It has also been discovered that hydroxide ions protect the NCC surface from CO2 poisoning during urea oxidation. Accordingly, UOR must have a skin/layer on NNC. Fig. 6(b) shows a linear calibration curve, and these findings demonstrate that UOR at greater OH− ion concentrations is more thermodynamically progressive and shows a linear deterioration plot in Fig. S5(a) and (b).† More intriguingly, at higher OH− concentrations, cathodic current diminishes and this could be due to the surface covering of adsorbed OH− ions, which limits the interaction of urea molecules with Ni sites.23,244.3 Effect of scan rate
Fig. 6(c) demonstrates LSVs of the scan rate-dependent studies of NNC for the electrooxidation of urea in the range of 10 to 200 mV s−1 in 0.5 M KOH. Interestingly, it has been demonstrated that with scan rate, the current density increased linearly. Remarkably, the oxidation peaks increased with an increase in the scan rate and demonstrated a linear relationship with the square root of the scan rate, as shown in Fig. 6(d), which indicates that the electrooxidation of urea is a diffusion-controlled process with first-order kinetics.4.4 Difference between UOR and OER performance
Fig. 7(a) displays the LSVs scan for NNC in the presence of 0.3 M urea and absence of urea in 0.5 M KOH. Fig. 7(b) displays the Nyquist plot of EIS comparative for UOR and OER, showing a lower semicircle for charge transfer that gives higher electrochemical activity that is diffusion-controlled for UOR as compared with OER. Hence, NNC electrocatalytic system is best for UOR over OER activity because more favourable interactions lower the activation energy. NC provides a backbone to e− delocalization due to the electronegative O-acceptor, which accepts the e− from Ni/NiO to donate to urea (via Ni/NiOOH) in an electrolyte solution with supportive OH− ions. Increasing delocalized electrons increases the d-band centre and O-binding strength, which triggers the electrocatalytic UOR kinetics.25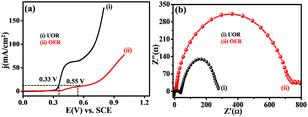 | ||
| Fig. 7 (a) Superimposed LSV and (b) EIS response for UOR (i) and OER (ii) on NNC electrocatalyst in 0.3 M urea in 0.5 M KOH. | ||
4.5 Possible mechanistic pathway of UOR on NNC
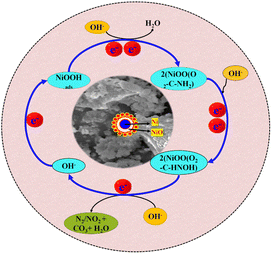
Electrocatalytic UOR at the Ni/NiO anode can be well understood by the electrocatalytic mechanism and is described as follows in Scheme 2. The overall reaction of the electrolysis process in an alkaline solution is the conversion of urea to CO2, H2O, and N2 catalysed by NNC. First, NNC interacts with OH− ions and forms Ni/NiOOH as a stable active intermediate,4,21 and to find this interaction and formation of Ni/NiOOH, we also calculate the surface active sites, as discussed in Fig. S7(a)–(d).† It is confirmed that Ni/NiO with NC provides higher active sites than NiO-NPs and NC,25 which have an important role in UOR at a specific applied potential. Herein, the urea molecules with electron-donating amino groups and electron-withdrawing carbonyl groups can be selectively adsorbed on NNC via. Ni/NiOO– carbonyl group as an intermediate step,5,26–29 followed by the corresponding nucleophilic OH− attack. As a result, cleavage of the C–N bond became more favourable, and UOR could proceed at a lower potential. In the KOH solution without urea, the electrode shows a pair of redox peaks. The redox peaks originate from redox reactions between Ni2+ and Ni3+ in an alkaline environment. Interestingly, the cathodic peak corresponds to the electrochemical reduction of Ni/NiOOH and not due to the reduction of the urea molecules, which has a faster reaction rate than the urea reduction reactions.244.6 After electrolysis product analysis test
To confirm CO2 as the by-product, we performed the precipitation test using CaCO3 after the i–t stability test.30 CaCO3 reacts with dilute HCl, evolving CO2 molecules and forms CaO (i.e., lime). CaO easily reacts with electrolyte solution and forms a white ppt of CaCO3. This indicates that the generation of CO2 is one of the reactions and is well explained by the following eqn (i)–(iv)31| 6Ni/NiOOH + CO(NH)2 + 6OH− → 6Ni/Ni(OH)2 + H2O + N2↑ + CO2↑ | (i) |
| CO2 + 2OH− → CO32− + H2O | (ii) |
| CaCO3 + HCl → CaO + CO2↑ + H2O | (iii) |
| CaO + CO32− → CaCO3↓ | (iv) |
4.7 After electrolysis UV-spectra
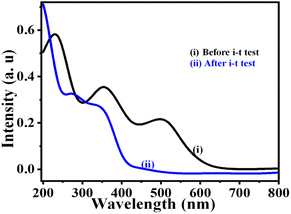
After the UOR stability test on the NNC, we performed the UV-visible spectra analysis and compared it with standard urea solution. As usual, the urea solution shows 3 main peaks observed due to π → π*, η → π*, and intramolecular transitions for urea with KOH at ∼250, 350, and 520 nm.32 After urea electrolysis, only two peaks at ∼270 and 310 nm, corresponding to CO3 and NOx species, confirm the UOR oxidation (Fig. 8) and is in good aggrement with the literature.334.8 Electrocatalytic OER performance
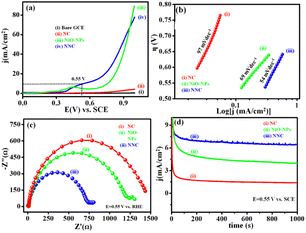
LSVs scan for NNC, NiO-NPs, and NC in 1 M KOH at a scan rate of 50 mV s−1 is depicted in Fig. 9(a). EIS studies show lower onset potential and higher current density for NNC over NiO-NPs and NC counterparts. Tafel slope is represented in Fig. 9(b), with NNC having a lower Tafel slope (54 mV dec−1) than NiO-NPs (69 mV dec−1), which represents rapid kinetics towards OER. Nyquist plot of EIS showing a lower semicircle for charge transfer gives higher electrochemical activity with diffusion-controlled electron transfer, as shown in Fig. 9(c). The comparative chronoamperometric i–t stability for NNC, NiO-NPs, and NC at 0.55 V vs. SCE for 1000 s is shown in Fig. 9(d).Moreover, comparative studies of the previously reported similar electrocatalytic systems for UOR are given in Tables S1 and S2 (ESI†). Hence, it is confirmed that the electrochemical enhancement in the activity is purely due to the decoration of NiO-NPs on the surface of NC. It can be stated that the NNC is an active system for UOR over OER.
5. Conclusion
In summary, herein, we represent a facile chemical synthesis of Ni/NiO-NPs decorated on a nanoporous carbon-based electrocatalytic system for urea and water oxidation reactions. The as-synthesized NNC was characterized via SEM, EDAX, HR-TEM, FTIR, UV-vis spectroscopy, BET analysis, TGA, and XPS spectroscopy. The analyses confirm that the NNC is spherical-shaped (∼25 nm), highly porous, with a specific surface area of 340 m2 g−1 and pore size of ∼70 nm, and Ni in +2, +3 oxidation states in the FCC structure. These findings support the electrocatalytic performance of NNC. NC not only provides a conducting backbone but also shows remarkable stability and extremely high and long-term catalytic activity on NNC. After electrolysis, UV-vis spectra and precipitation test permit the determination of the main product of the reaction, namely carbonate with high selectivity after a 7 h electrolysis. Interestingly, NC donates e− to Ni with O acceptor to form more delocalized electrons, increased d-band centre, and O-binding strength, triggering the electrocatalytic UOR kinetics, with a lower overpotential of 60 mV, and Tafel slope of 45 mV dec−1 required for achieving a current density of 10 mA cm−2, which is good enough than that of other Ni-based systems and open a new path for further application of cheap Ni-based materials in energy conversion and storage devices.Conflicts of interest
No conflicts of interest.Acknowledgements
This study was financially supported by DAE-BRNS, Mumbai (F. No. 34/20/06/2014-BRNS/21gs), HRDG-CSIR New-Delhi (01(2922)18/EMR-II), New Delhi (India), FAST-TRACK DST-SERB, New Delhi (India) (SERB/F/7963/2014-15) and DST SERB, New Delhi (India) (SERB/F/7490/2016-17). T. P. D. is especially thankful to UGC-CSIR, New Delhi (India), for providing the SRF fellowship and the Department of Chemistry, Dr Babasaheb Ambedkar Marathwada University, Aurangabad, for providing necessary research laboratory facilities.Notes and references
- C. Zequine, F. Wang, X. Li, D. Guragain, S. R. Mishra, K. Siam, P. Kahol and R. Gupta, Appl. Sci., 2019, 9, 793 CrossRef CAS.
- Y. Lum, J. E. Huang, Z. Wang, M. Luo, D. H. Nam, W. R. Leow, B. Chen, J. Wicks, Y. C. Li, Y. Wang, C. T. Dinh, J. Li, T. T. Zhuang, F. Li, T. K. Sham, D. Sinton and E. H. Sargent, Nat. Catal., 2020, 3, 14–22 CrossRef CAS.
- S. Lu, M. Hummel, Z. Gu, Y. Wang, K. Wang, R. Pathak, Y. Zhou, H. Jia, X. Qi, X. Zhao, B. Bin Xu and X. Liu, ACS Sustain. Chem. Eng., 2021, 9, 1703–1713 CrossRef CAS.
- Y. M. T. A. Putri, J. Gunlazuardi and T. A. Ivandini, Chem. Lett., 2022, 51, 135–138 CrossRef CAS.
- U. Lee, Y. N. Lee and Y. S. Yoon, Front. Chem., 2020, 8, 1–11 CrossRef PubMed.
- S. S. Narwade, S. M. Mali, P. D. Tanwade, P. P. Chavan, A. V. Munde and B. R. Sathe, New J. Chem., 2022, 46, 14004–14009 RSC.
- X. Lin, X. Zhang, Z. Wang, X. Zhu, J. Zhu, P. Chen, T. Lyu, C. Li, Z. Qun Tian and P. Kang Shen, J. Colloid Interface Sci., 2021, 601, 1–11 CrossRef CAS PubMed.
- T. Reier, M. Oezaslan and P. Strasser, ACS Catal., 2012, 2, 1765–1772 CrossRef CAS.
- P. Mirzaei, S. Bastide, A. Dassy, R. Bensimon, J. Bourgon, A. Aghajani, C. Zlotea, D. Muller-Bouvet and C. Cachet-Vivier, Electrochim. Acta, 2019, 297, 715–724 CrossRef CAS.
- S. A. Aladeemy, A. M. Al-Mayouf, M. N. Shaddad, M. S. Amer, N. K. Almutairi, M. A. Ghanem, N. H. Alotaibi and P. Arunachalam, Catalysts, 2021, 11, 1–17 CrossRef.
- K. Ye, G. Wang, D. Cao and G. Wang, Top. Curr. Chem., 2018, 376(6), 42 CrossRef PubMed.
- Y. Zhang and C. Wang, Chin. Chem. Lett., 2021, 32, 2222–2228 CrossRef CAS.
- D. A. Daramola, D. Singh and G. G. Botte, J. Phys. Chem. A, 2010, 114, 11513–11521 CrossRef CAS PubMed.
- Y. Ma, C. Ma, Y. Wang and K. Wang, Catalysts, 2022, 12, 337 CrossRef CAS.
- S. S. Narwade, S. M. Mali, R. V. Digraskar, V. S. Sapner and B. R. Sathe, Int. J. Hydrogen Energy, 2019, 44, 27001–27009 CrossRef CAS.
- C. P. Witte, Plant Sci., 2011, 180, 431–438 CrossRef CAS PubMed.
- E. L. Ratcliff, J. Meyer, K. X. Steirer, A. Garcia, J. J. Berry, D. S. Ginley, D. C. Olson, A. Kahn and N. R. Armstrong, Chem. Mater., 2011, 23, 4988–5000 CrossRef CAS.
- T. Y. Yung, L. Y. Huang, T. Y. Chan, K. S. Wang, T. Y. Liu, P. T. Chen, C. Y. Chao and L. K. Liu, Nanoscale Res. Lett., 2014, 9, 1–6 CrossRef CAS PubMed.
- A. V. Munde, B. B. Mulik, P. P. Chavan and B. R. Sathe, Electrochim. Acta, 2020, 349, 136386 CrossRef CAS.
- W. Xu, R. Lan, D. Du, J. Humphreys, M. Walker, Z. Wu, H. Wang and S. Tao, Appl. Catal., B, 2017, 218, 470–479 CrossRef CAS.
- T. Q. N. Tran, B. J. Park, W. H. Yun, T. N. Duong and H. H. Yoon, Sci. Rep., 2020, 10, 1–10 CrossRef PubMed.
- Y. Y. Peng and M. S. Wu, Electrochim. Acta, 2022, 410, 140022 CrossRef CAS.
- B. Yu, H. Zhang, W. Xu, G. Li and Z. Wu, Sci. Rep., 2014, 4, 2–7 Search PubMed.
- A. V. Munde, B. B. Mulik, R. P. Dighole and B. R. Sathe, ACS Appl. Energy Mater., 2021, 4, 13172–13182 CrossRef CAS.
- Z. Li, P. Zhou, M. Zhou, H. Jiang, H. Li, S. Liu, H. Zhang, S. Yang and Z. Zhang, Appl. Catal., B, 2023, 338, 122962 CrossRef CAS.
- D. M. Sanke, A. V. Munde, J. Bezboruah, P. T. Bhattad, B. R. Sathe and S. S. Zade, Energy Fuels, 2023, 37(6), 4616–4623 CrossRef CAS.
- A. V. Munde, B. B. Mulik, R. P. Dighole and B. R. Sathe, ACS Appl. Energy Mater., 2021, 4(11), 13172–13182 CrossRef CAS.
- S. Wang, J. Zhu, X. Wu and L. Feng, Chin. Chem. Lett., 2022, 33, 1105–1109 CrossRef CAS.
- S. B. Yang, Y. C. Tsai and M. S. Wu, J. Alloys Compd., 2020, 836, 155533 CrossRef CAS.
- D. M. Sanke, A. V. Munde, J. Bezboruah, P. T. Bhattad, B. R. Sathe and S. S. Zade, Energy Fuels, 2023, 37, 4616–4623 CrossRef CAS.
- G. Hopsort, D. P. Do Carmo, L. Latapie, K. Loubière, K. G. Serrano and T. Tzedakis, Electrochim. Acta, 2023, 442, 1–58 CrossRef.
- Y. Q. Wang, S. S. Wang, J. Zhu, L. Wang, B. H. Jiang and W. J. Zhao, J. Food Drug Anal., 2016, 24, 399–405 CrossRef CAS PubMed.
- M. M. H. Al Omari, I. S. Rashid, N. A. Qinna, A. M. Jaber and A. A. Badwan, Profiles of Drug Substances, Excipients and Related Methodology (book Series), 2016, vol. 41, pp. 31–132 Search PubMed.
Footnotes |
| † Electronic supplementary information (ESI) available: Experimental details and Fig. S1–S6, and Tables S1 and S2 as noted in the text. See DOI: https://doi.org/10.1039/d3ra04286c |
| ‡ These authors contributed equally to this work. |
| This journal is © The Royal Society of Chemistry 2023 |

