 Open Access Article
Identification of new theobromine-based derivatives as potent VEGFR-2 inhibitors: design, semi-synthesis, biological evaluation, and in silico studies†
Ibrahim H. Eissa *a,
Reda G. Yousefa,
Hazem Elkady
 a,
Eslam B. Elkaeed
 b,
Aisha A. Alsfoukc,
Dalal Z. Huseind,
Ibrahim M. Ibrahime,
Mostafa A. Elhendawyfg,
Murrell Godfreyf and
Ahmed M. Metwaly
 *hi
*hi
aPharmaceutical Medicinal Chemistry & Drug Design Department, Faculty of Pharmacy (Boys), Al-Azhar University, Cairo11884, Egypt. E-mail: Ibrahimeissa@azhar.edu.eg
bDepartment of Pharmaceutical Sciences, College of Pharmacy, AlMaarefa University, Riyadh 13713, Saudi Arabia
cDepartment of Pharmaceutical Sciences, College of Pharmacy, Princess Nourah bint Abdulrahman University, P.O. Box 84428, Riyadh 11671, Saudi Arabia
dChemistry Department, Faculty of Science, New Valley University, El-Kharja 72511, Egypt
eBiophysics Department, Faculty of Science, Cairo University, Cairo 12613, Egypt
fDepartment of Chemistry and Biochemistry, University of Mississippi, University, MS 38677, USA
gDepartment of Agriculture Chemistry, Faculty of Agriculture, Damietta University, Damietta, Egypt
hPharmacognosy and Medicinal Plants Department, Faculty of Pharmacy (Boys), Al-Azhar University, Cairo 11884, Egypt. E-mail: ametwaly@azhar.edu.eg
iBiopharmaceutical Products Research Department, Genetic Engineering and Biotechnology Research Institute, City of Scientific Research and Technological Applications (SRTA-City), Alexandria, Egypt
First published on 2nd August 2023
Abstract
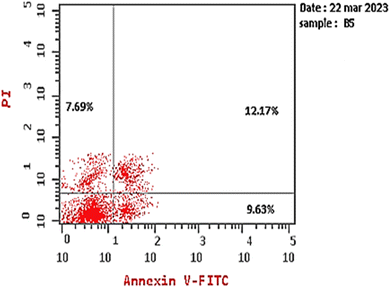
This study aimed to design anticancer theobromine derivatives inhibiting VEGFR-2. The new compounds were tested in vitro to evaluate their effectiveness against MCF-7 and HepG2 cancer cell lines. Among these compounds, 15a showed the highest cytotoxicity against HepG2, with an IC50 value of 0.76 μM, and significant anti-proliferative effects on MCF-7, with an IC50 value of 1.08 μM. Notably, the selectivity index of 15a against the two cancer cells was 98.97 and 69.64, respectively. Moreover, 15a demonstrated potent VEGFR-2 inhibitory activity (IC50 = 0.239 μM). Further investigations revealed that 15a induced apoptosis in HepG2 cells, significantly increasing early-stage and late-stage apoptosis percentages from 3.06% and 0.71% to 29.49% and 9.63%, respectively. It also upregulated caspase-3 and caspase-9 levels by 3.45-fold and 2.37-fold, respectively compared to control HepG2 cells. Additionally, 15a inhibited the migration and wound healing ability of HepG2 cells. Molecular docking confirmed the binding affinities of the semi-synthesized compounds to VEGFR-2, consistent with in vitro results. Several computational analyses (DFT, MD simulations, MM-GBSA, PLIP, and essential dynamics) supported the stability of the 15a-VEGFR-2 complex. Overall, the biological and computational findings suggest that compound 15a could be a promising lead compound for the development of a novel apoptotic anticancer agent.
1. Introduction
Despite the discovery of a vast array of anticancer drugs, cancer incidence, and prevalence continue to rise significantly.1 Developing targeted chemotherapeutic agents that can interact effectively with the molecular targets of cancer cells to inhibit their growth remains a major challenge for cancer researchers.2 This task gives hope to developing precise lead compounds that can selectively target cancer cells while minimizing harm to healthy tissues.3–5The vascular endothelial growth factor receptor-2 (VEGFR-2) is one of the most promising targets for cancer therapy. As a type of tyrosine kinase receptor, VEGFR-2 plays a crucial role in various cellular processes such as cell proliferation, adhesion, division, and angiogenesis.6 VEGFR-2 is usually expressed much more in cancer cells than in normal cells, providing an opportunity to develop drugs that selectively target angiogenesis in tumor cells while sparing normal cells.7
Throughout human history, nature has been a vital source of essential resources, including medicine, food, and cosmetics.8,9 Between the years 1981 and 2014, nearly one-third of all drugs approved by the FDA were either based on or derived from natural sources.10 The utilization of semi-synthesis techniques on natural products enables the production of diverse analogs, leading to the discovery of more potent drugs and the repurposing of existing ones.11 This approach also facilitates the investigation of the structure–activity relationship, which is often easier and more accessible in natural product-based drug discovery, providing a great opportunity for obtaining novel bioactive compounds, improving drug-likeness, and enhancing pharmacokinetic and pharmacodynamic properties.12
Theobromine, a naturally occurring alkaloid, has emerged as a promising candidate for the treatment of cancer, with evidence from both in vitro and in vivo studies suggesting its potential therapeutic value. Specifically, theobromine has been found to induce apoptosis in colorectal cancer cells,13 and to inhibit DNA synthesis and hinder the growth of glioblastoma multiform cells.14 Furthermore, theobromine has demonstrated anti-angiogenic properties by suppressing vascular endothelial growth factor (VEGF) in ovarian15 and lung16 cancers, indicating its potential to serve as a potent therapeutic agent against several malignancies.
2. Rationale
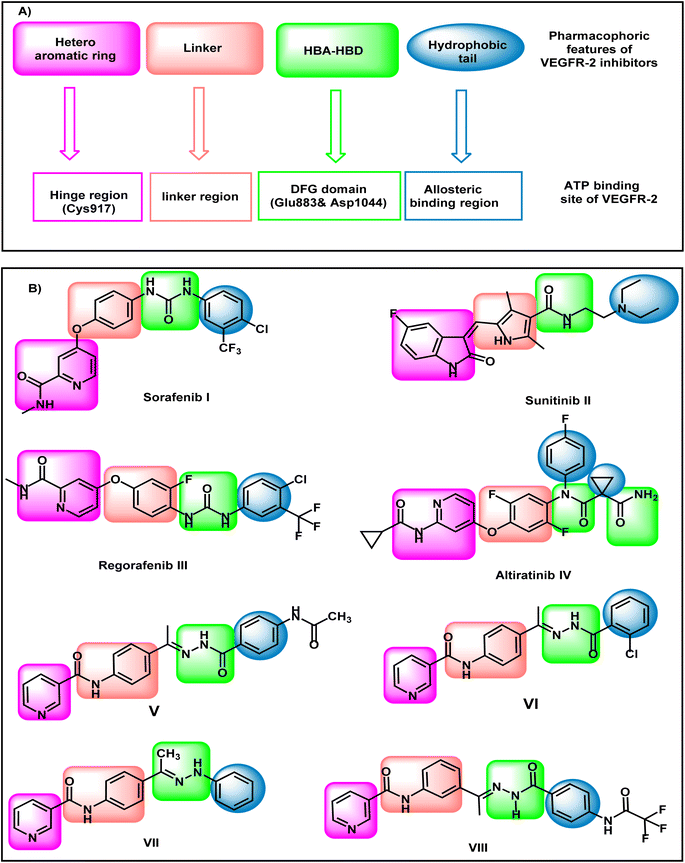
VEGFR-2 inhibitors have four pharmacophoric features that are crucial for the correct binding in the active site of VEGFR-2 (Fig. 1). Hetero aromatic system, linker group, pharmacophore moiety, and hydrophobic tail are the main required features. The hetero-aromatic system exerts high fitting in the hinge region of the active site. The linker group can occupy the gatekeeper region to enable the pharmacophore moiety to be oriented into the DFG motif region. The DFG motif region has two crucial amino acids (Asp1044 and Glu833) that should be activated via hydrogen bonding to give maximal fitting. The pharmacophore moiety should comprise at least one hydrogen bond donor and one hydrogen bond acceptor. The hydrophobic tail has a crucial role to block the allosteric pocket of the binding site.17–19Sorafenib I,20 sunitinib II,21 regorafenib III, and altiratinib IV are reported VEGFR-2 inhibitors possessing the main pharmacophoric features. Sorafenib I, regorafenib III, and altiratinib IV have a pyridine moiety as a hetero-aromatic system. On the other hand, sunitinib II has isatin moiety as a hetero-aromatic system (Fig. 1).
Our research group has discovered compounds V,22 VI,22 VII,23 and VIII24 as potential VEGFR-2 inhibitors having promising anti-proliferative activities (Fig. 1). Such compounds possess a pyridine system to occupy the hinge region VEGFR-2. Compounds V, VI, and VII have a para-di-substituted phenyl ring as a linker group while compound VIII has a meta-di-substituted ring. Compounds V, VI, and VIII have a formyl hydrazone moiety as a pharmacophore system while compound VII possesses a hydrazone moiety. Furthermore, all the discovered compounds have substituted phenyl rings as a hydrophobic tail.
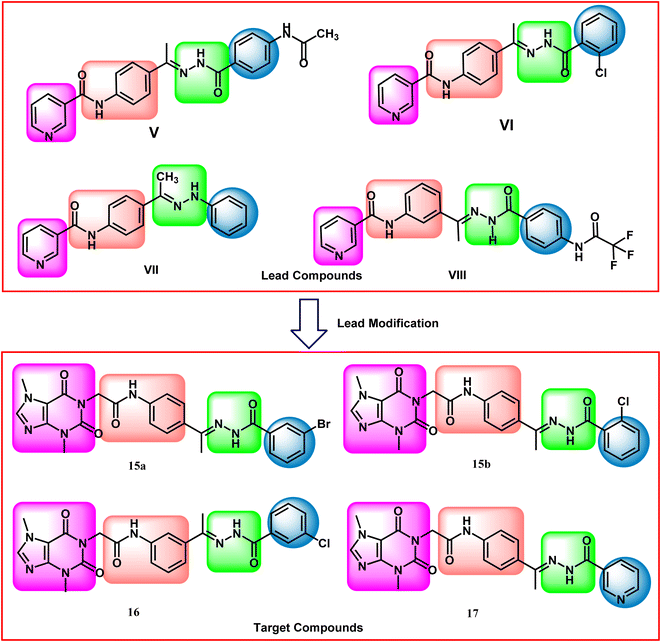
In this work, the previously synthesized compounds (V, VI, VII, and VIII) were used as lead compounds for the design and synthesis of new VEGFR-2 inhibitors. As shown in Fig. 2, the newly designed compounds have a xanthine moiety as a bioisostere for the pyridine moiety of the lead compounds. The xanthine moiety was selected for some consideration. (i) It has a large size, which is convenient for the hinge region of the VEGFR-2.25 (ii) It has many hydrogen bond acceptor atoms, which may facilitate the hydrogen bonding interaction with the biological target. (iii) Its naturally derived nucleus increases its safety margin. For the linker group, some compounds were designed to have a di-para-substituted phenyl ring (compounds 15a, 15b, and 17) and the other compound 16 has a meta di-substituted phenyl ring. For the pharmacophore moiety, all the designed compounds have a formyl hydrazone moiety as a pharmacophore system. Finally, different substituted phenyl rings were used as a hydrophobic tail to occupy the allosteric pocket.
3. Results
3.1. Chemistry
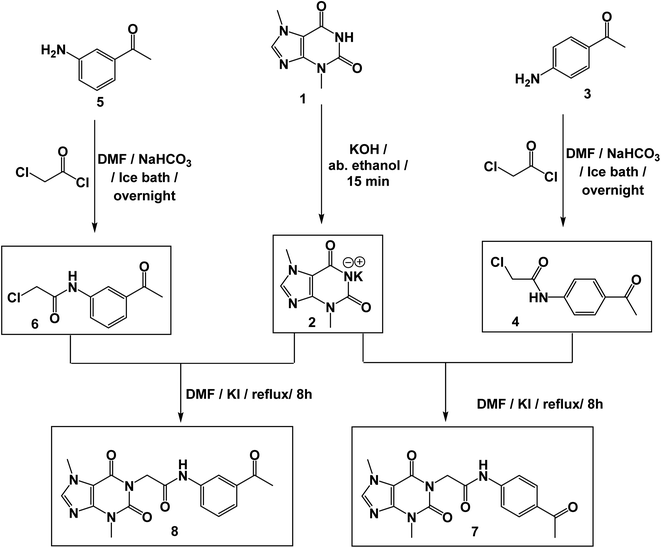
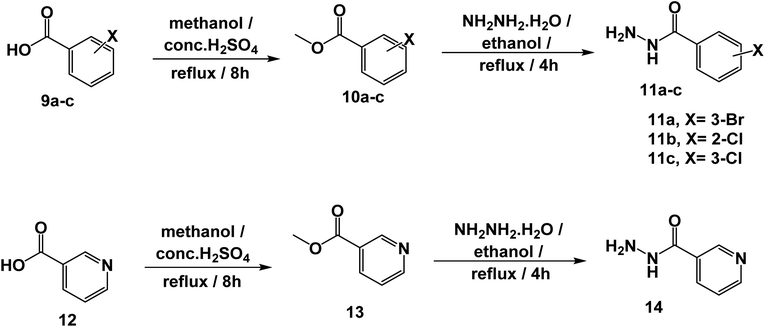
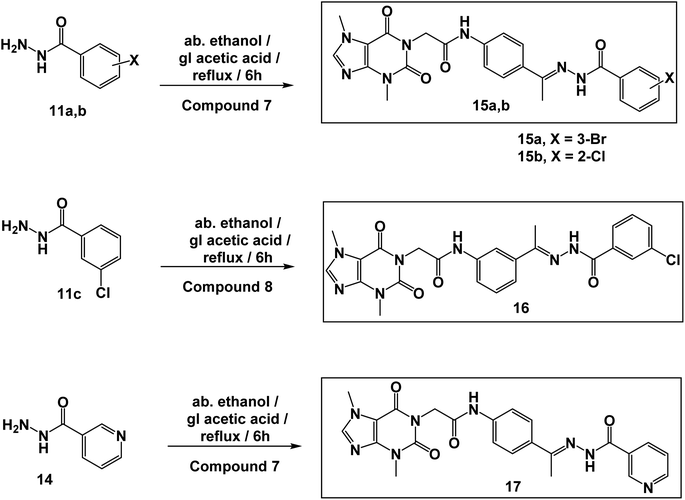
The synthetic pathways for the final target compounds 15a,b, 16, and 17 are summarized in Schemes 1, 2, and 3. Theobromine, 1, was first converted to its potassium salt 2 by refluxing it with alcoholic KOH. N-(3-Acetylphenyl)-2-chloroacetamide 4 and N-(4-acetylphenyl)-2-chloroacetamide 6 were produced by the reaction of p-aminoacetophenone 3 and m-aminoacetophenone 5, respectively with chloroacetylchloride in DMF using NaHCO3 as a base. Equimolar amounts of theobromine potassium salt 2 reacted with 4 and 6 in DMF using potassium iodide as a catalyst to afford the key intermediates compound 7 and 8, respectively (Scheme 1).Moreover, benzohydrazide derivatives 11a–d and 14 were readily prepared by refluxing the appropriate benzoate derivatives 10a–c and 13, respectively with hydrazine hydrate in absolute ethanol (Scheme 2).
Condensation of compound 7 with benzohydrazide derivatives 11a,b, afforded the final target compounds 15a,b. On the other hand, condensation of compound 8 with 11c afforded the final target derivative 16. Additionally, the condensation of compound 7 with 14 produced the final target compound 17 (Scheme 3).
The IR spectra of compounds 15a,b, 16, and 17 exhibited the appearance of absorption bands at the ranges of 3196–3265 cm−1 and 1667–1704 cm−1 attributable to the NH and C![[double bond, length as m-dash]](https://www.rsc.org/images/entities/char_e001.gif) O groups, respectively. 1H NMR spectra of compounds 15a,b, 16, and 17 showed the appearance of the two amidic protons at δ ranges of 10.89–10.93 ppm and 10.42–10.45 ppm. Moreover, their 1H NMR spectra revealed the presence of shielded singlet signals for the methyl protons at a δ range of 2.29–2.36 ppm, and singlet signals around δ 4.70 ppm for the methylene protons. In addition, 13C NMR spectra showed the presence of four shielded signals at around 43.94, 33.68, 29.93, and 14.85 ppm attributed to the methylene carbon and the three-methyl carbons, respectively. Moreover, the carbonyl carbons were displayed at their expected regions.
O groups, respectively. 1H NMR spectra of compounds 15a,b, 16, and 17 showed the appearance of the two amidic protons at δ ranges of 10.89–10.93 ppm and 10.42–10.45 ppm. Moreover, their 1H NMR spectra revealed the presence of shielded singlet signals for the methyl protons at a δ range of 2.29–2.36 ppm, and singlet signals around δ 4.70 ppm for the methylene protons. In addition, 13C NMR spectra showed the presence of four shielded signals at around 43.94, 33.68, 29.93, and 14.85 ppm attributed to the methylene carbon and the three-methyl carbons, respectively. Moreover, the carbonyl carbons were displayed at their expected regions.
3.2. Biology
Next, the safety of compound 15a against Vero cells was examined to determine its selectivity against cancer cells. Based on the IC50 value of 75.22 μM, the selectivity index values of compound 15a against HepG2 and MCF7 cell lines were calculated to be 98.97 and 69.64, respectively. Overall, our results imply that compound 15a has a promising future as a secure anticancer drug and call for additional research.
| Comp. | Apoptosis | Necrosis | ||
|---|---|---|---|---|
| Total | Early | Late | ||
| Compound 15a/HepG2 | 29.49 | 9.63 | 12.17 | 7.69 |
| Cont. HepG2 | 3.06 | 0.71 | 0.13 | 2.22 |
| Sample | Protein expression | |
|---|---|---|
| Caspase-3 | Caspase-9 | |
| Cont. HepG2 | 1 | 1 |
| Compound 15a/HepG2 | 3.451 | 2.378 |
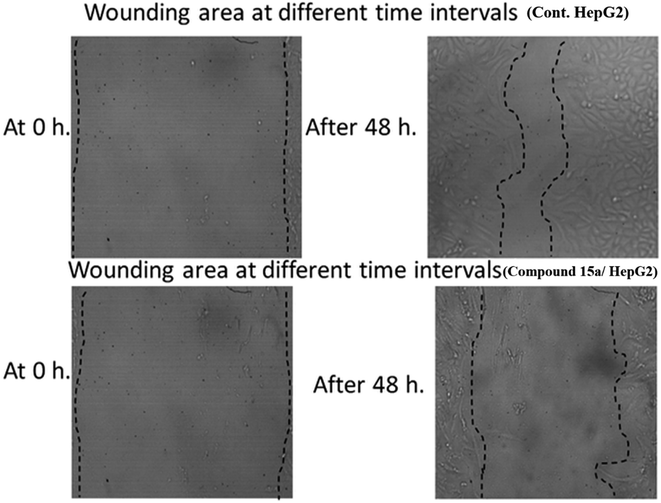
| At 0 h | At 48 h | RM (μm) | Wound closure (% μm2) | Area difference (%) | |||
|---|---|---|---|---|---|---|---|
| Area | Width | Area | Width | ||||
| Cont. HepG2 | 1000.333 | 999.3853 | 340.5 | 339.5385 | 13.74681 | 65.96135 | 659.8333 |
| Compound 15a/HepG2 | 1000.667 | 999.7462 | 658.6667 | 657.7792 | 7.124313 | 34.17722 | 342 |
3.3. Computational studies
| Comp. | 15a | 15b | 16 | 17 | Sorafenib |
|---|---|---|---|---|---|
| ΔG [kcal mol−1] | −23.29 | −24.74 | −23.09 | −23.11 | −21.20 |
At first, the validation process was carried out by docking the co-crystallized ligand in the active pocket of VEGFR-2. The co-crystallized ligand has a general name of benzimidazole-urea inhibitor. In addition it has an IUPAC name of methyl N-[5-[4-[[2-fluoro-5-(trifluoromethyl) phenyl]carbamoylamino]phenoxy]-1-methylbenzimidazol-2-yl]carbamate. The results indicated the high validity of the docking process since the RMSD value between the docked and original ligand was (1.19 Å) less than 2.00 Å (Fig. 5).
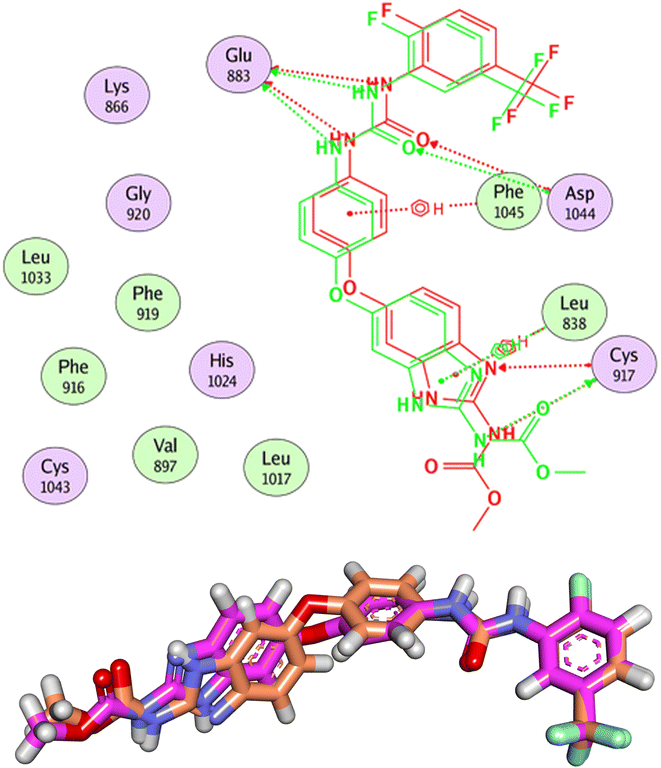 | ||
| Fig. 5 Validation of the docking process. The RMSD value between the original ligand (pink) and the docked one (orange) is 1.19 Å. | ||
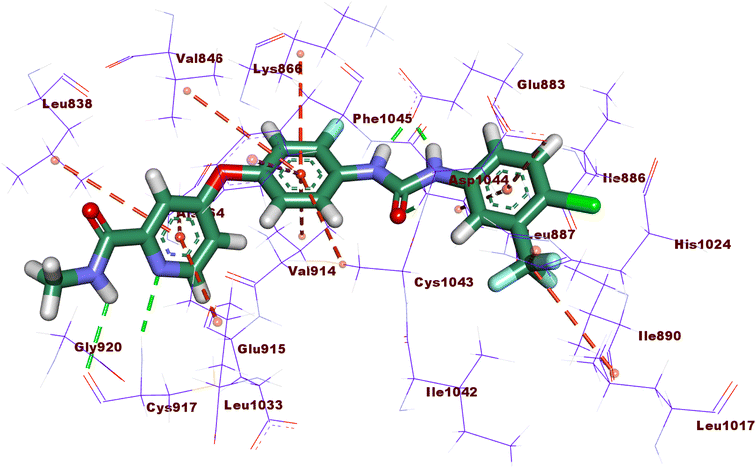
The reference molecule, sorafenib, revealed a binding mode similar to the reported results.22–24 It had an energy score of −21.20 kcal mol−1. It formed one hydrogen bond with Cys917 and three hydrophobic interactions with Leu838, Ala864, and Leu1033 at the hinge region. In addition, its linker moiety formed six hydrophobic interactions with Val914, Val846, Cys1043, and Phe1045. Furthermore, the pharmacophore moiety was engaged in three hydrogen bonds with Glu883 and Asp1044. The terminal hydrophobic tail formed five hydrophobic interactions with Leu887, Cys1043, His1024, and Leu1017. Also, it formed an electrostatic interaction with Asp104 (Fig. 6).
Compound 15a has a binding energy of −23.29 kcal mol−1. The different features occupied the different sub-pockets of the active site. The heterocyclic system (xanthine moiety) was oriented into the hinge region forming one hydrogen bond and two hydrophobic interactions with Cys917, Leu838, and Phe916. The linker (phenyl) moiety formed one hydrophobic interaction with Val914 and one electrostatic attraction with Cys1043. The N-ethylideneformohydrazide moiety occupied the DFG motif region and formed two hydrogen bonds and three hydrophobic interactions with Glu883, Asp1044, Lys866, Val914, and Leu887. The terminal hydrophobic tail (3-bromophenyl moiety) occupied the allosteric pocket forming two hydrophobic interactions with Ile886 and Ile890. In addition, it formed one electrostatic interaction with Asp1044 (Fig. 7A).
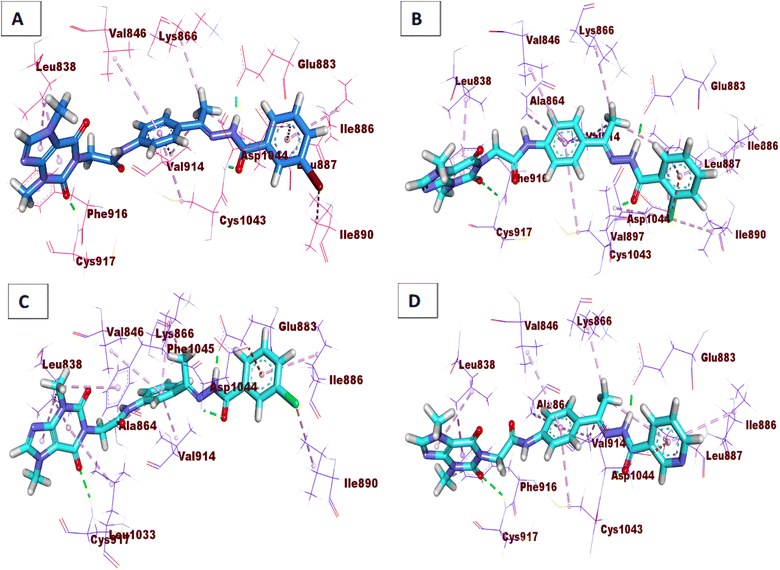 | ||
| Fig. 7 3D interactions of the synthesized compounds in the VEGFR-2 binding site. (A) Compound 15a, (B) compound 15b, (C) compound 16, (D) compound 17. | ||
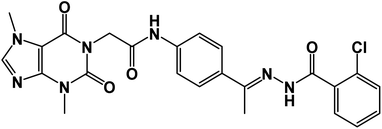
Compound 15b showed a binding score of −24.74 kcal mol−1. The xanthine moiety occupied the hinge region of VEGFR-2 forming one hydrogen bond and two hydrophobic interactions with Cys917, Leu838, and Phe916. The phenyl moiety formed three hydrophobic interactions with Val914, Ala864, and Val846. In addition, it formed one electrostatic attraction with Cys1043. The N-ethylideneformohydrazide moiety occupied the DFG motif region forming two hydrogen bonds and three hydrophobic interactions with Glu883, Asp1044, Lys866, Val914, and Leu887. The 2-chlorophenyl moiety occupied the allosteric pocket forming five hydrophobic interactions with Ile886, Val879, Leu887, and Ile890. In addition, it formed one electrostatic interaction with Asp1044 (Fig. 7B).
Compound 16 showed a binding score of −23.09 kcal mol−1. The xanthine moiety formed one hydrogen bond with Cys917 and five hydrophobic interactions with Leu838, Leu1033, and Phe1045. The central phenyl moiety formed four hydrophobic interactions with Val914, Ala864, Lys866, and Val846. The N-ethylideneformohydrazide moiety occupied the DFG motif region forming two hydrogen bonds and one hydrophobic interaction with Glu883, Asp1044, and Lys866. The 3-chlorophenyl moiety occupied the allosteric pocket forming two hydrophobic interactions with Ile886 and Ile890. In addition, it formed one electrostatic interaction with Asp1044 (Fig. 7C).
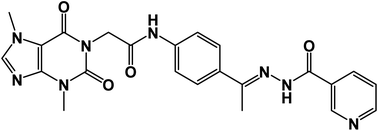
Compound 17 showed a binding score of −23.11 kcal mol−1. The xanthine moiety was engaged in one hydrogen bond and three hydrophobic interactions with Cys917, Leu838 and Phe916. The central phenyl ring occupied the central region forming three hydrophobic interactions with Val914, Ala864, and Val846. The N-ethylideneformohydrazide moiety occupied the DFG motif region forming two hydrogen bonds and three hydrophobic interactions with Glu883, Asp1044, Lys866, Val914, and Leu887. The terminal pyridine moiety occupied the allosteric pocket forming two hydrophobic interactions with Ile886 and Leu887. In addition, it formed one electrostatic interaction with Asp1044 (Fig. 7D).
On the other hand, although compound 15a has good binding mode against VEGFR-2, it showed number of hydrogen bond interactions less than that sorafenib. It formed one hydrogen bond ay the hinge region and two hydrogen bonds at the DFG motif region. Such results reflect the higher activity of sorafenib as VEGFR-2 (IC50 = 0.056 μM) than compound 15a (IC50 = 0.239 μM).
Investigating the binding modes of the four synthesized compounds indicated that all of them have the same number of hydrogen bonds at the hinge region (one bond) and the DFG motif region (two bonds).
Observing the cytotoxicity of compounds 15a and 15b against the most sensitive cells (HepG2), these two compounds have non-significant differences with IC50 values of 0.76 and 0.78 μM, respectively. Such biological results match with the docking results, as these two compounds have the same number of hydrogen bonds with non-significant difference in the binding energy (ΔG = −23.29 and −24.74 kcal mol−1, respectively).
Regarding compounds 16 and 17, although these compounds have the same binding mode as compounds 15a and 15b, both of them have less cytotoxic activity against HepG2. The reduced activity of compound 16 may be due to the change in the configuration of the linker moiety, as this compound has a meta-disubstituted phenyl linker while compounds 15a, 15b, and sorafenib have a para-disubstituted phenyl linker. Moreover, the reduced activity of compound 17 may be due to the absence of halogen atoms at the hydrophobic tail in contrast to that of compounds 15a, 15b, and sorafenib. It is well-known that halogen atoms have a high participation in hydrophobic interaction in the active site.
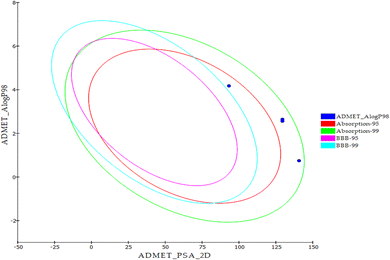
| Comp. | BBB level | Solubility level | Absorption level | Hepatotoxic prediction | CYP2D6 prediction | PPB prediction |
|---|---|---|---|---|---|---|
| 15a | Very low | Low | Moderate | Non-toxic | Non-inhibitor | <90% |
| 15b | Good | |||||
| 16 | Low | |||||
| 17 | Good | Toxic | ||||
| Sorafenib | Very low | Good | >90% |
| Comp. | Ames prediction | Rat-male-FDA | Carcinogenic potency TD50 (mouse)a | Rat oral LD50b | Rat chronic LOAELb | Skin irritancy | Ocular irritancy |
|---|---|---|---|---|---|---|---|
| a Unit: mg kg−1 body weight per day.b Unit: g kg−1 body weight. | |||||||
| 15a | Non-mutagen | Non-carcinogen | 23.973 | 1.785 | 0.046 | Non-irritant | Mild |
| 15b | 18.268 | 1.580 | 0.108 | ||||
| 16 | 24.482 | 1.305 | 0.046 | ||||
| 17 | 27.036 | 0.768 | 0.062 | ||||
| Sorafenib | 19.236 | 0.823 | 0.005 | ||||
At first, the mutagenic potential of a particular molecule can be assessed using the Ames prediction model. Depending on this model, all the synthesized molecules were predicted to be non-mutagenic. Furthermore, the FDA rodent carcinogenicity model can predict the carcinogenicity of a particular compound. This model indicated that the synthesized compounds are non-carcinogens. In addition, the carcinogenic potency TD50 values of the synthesized compounds ranged from 23.973 to 27.036 g kg−1. This range of carcinogenic potency TD50 values was higher than that of sorafenib (19.236 g kg−1) indicating the safety margin of the synthesized compounds. An additional sigh for the safety of the tested compounds was reached by the rat oral LD50 model. This model predicted that compounds 15a, 15b, and 16 have rat oral LD50 values ranging from 0.768 to 1.785 g kg−1, which were higher than that of sorafenib (0.823 g kg−1). For the rat chronic LOAEL model which predicts the rat chronic lowest observed adverse effect level value of a chemical, all compounds (0.046–0.108 g kg−1) have higher values than sorafenib (0.005 g kg−1). All compounds were predicted to be non-irritant with mild irritancy against the skin and the eyes, respectively (Table 7).
![[thin space (1/6-em)]](https://www.rsc.org/images/entities/char_2009.gif) 656 Å2, 18
656 Å2, 18![[thin space (1/6-em)]](https://www.rsc.org/images/entities/char_2009.gif) 076 Å2, and 17
076 Å2, and 17![[thin space (1/6-em)]](https://www.rsc.org/images/entities/char_2009.gif) 180 Å2, respectively. Fig. 9E showed that the average number of H-bonds formed between each compound and the VEGFR-2 protein differs across the two systems. The 15a compound (blue line) forms 1 H-bond during a low number of frames with zero H-bond as a common number. On the other hand, sorafenib compound (pale red line) shows that at least there is a constant 1 H-bond with 2 H-bonds as less common. Overall, this demonstrates that the protein structure is rather stable. A comparison between the three systems RMSF shows that no significant fluctuation is happening (Fig. 9F). The separation between the 15a and the protein centers of mass is stable with an average distance of 7 Å which is slightly smaller than the distance of sorafenib 7.8 Å, indicating a stable interaction (Fig. 9G).
180 Å2, respectively. Fig. 9E showed that the average number of H-bonds formed between each compound and the VEGFR-2 protein differs across the two systems. The 15a compound (blue line) forms 1 H-bond during a low number of frames with zero H-bond as a common number. On the other hand, sorafenib compound (pale red line) shows that at least there is a constant 1 H-bond with 2 H-bonds as less common. Overall, this demonstrates that the protein structure is rather stable. A comparison between the three systems RMSF shows that no significant fluctuation is happening (Fig. 9F). The separation between the 15a and the protein centers of mass is stable with an average distance of 7 Å which is slightly smaller than the distance of sorafenib 7.8 Å, indicating a stable interaction (Fig. 9G).
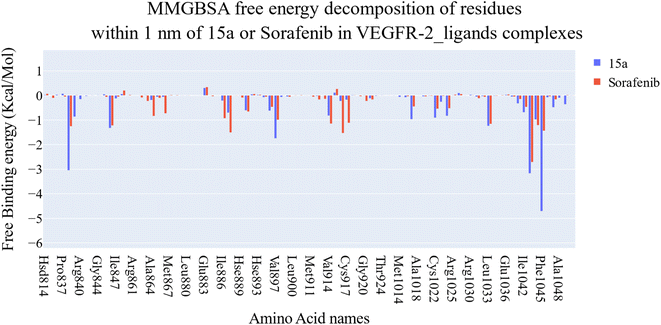 | ||
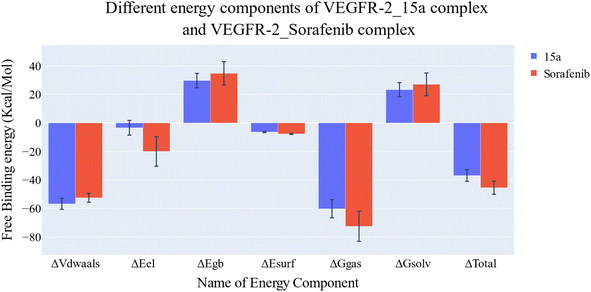
| Fig. 11 Comparison between the binding free energy decomposition of the VEGFR-2_15a complex and VEGFR-2_sorafenib complex. | ||
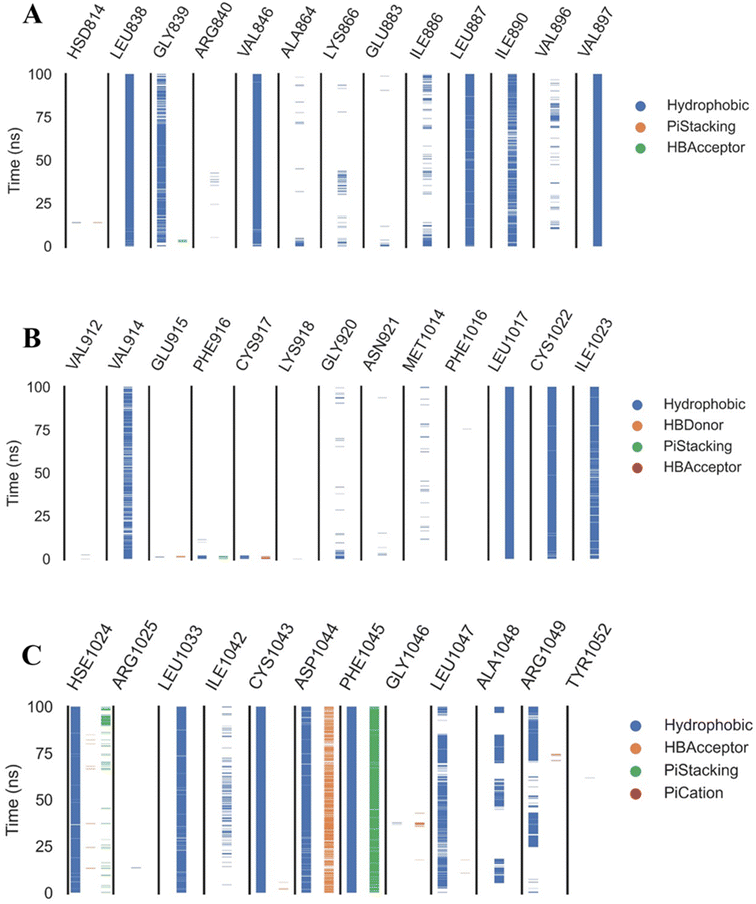
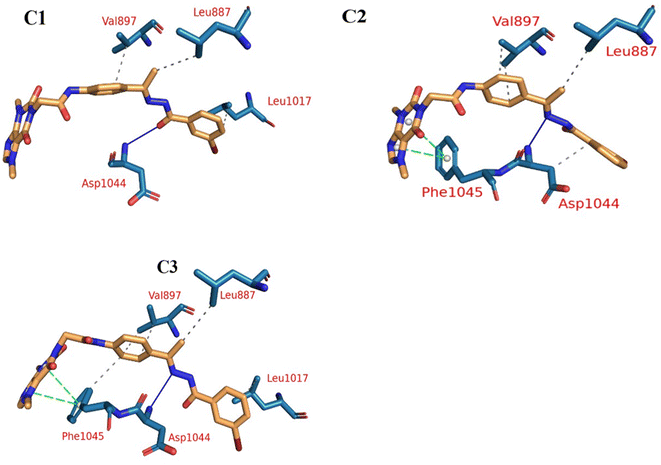
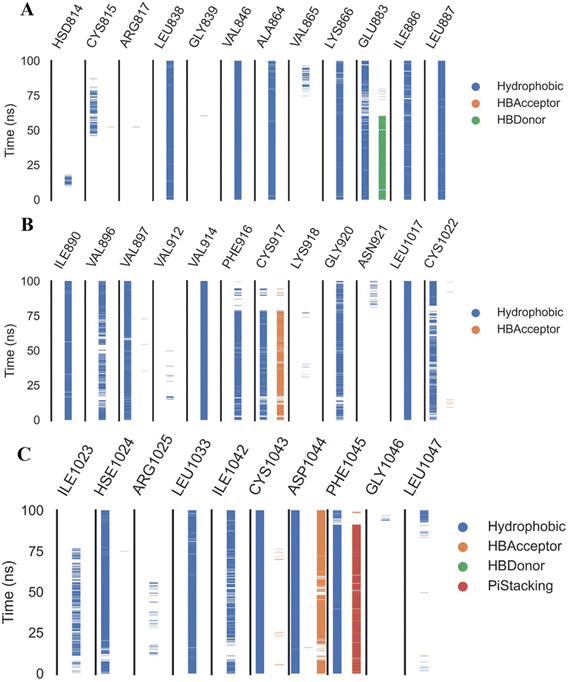
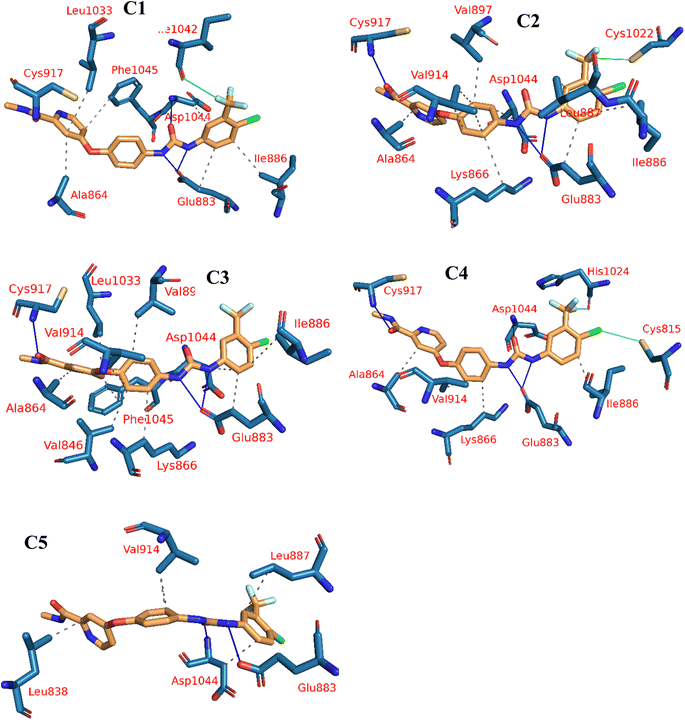
Extremely long-lasting hydrophobic interactions (90.2% occurrence or greater) are present between compound 15a and Leu838, Val846, Leu887, Val897, Leu1017, Cys1022, His1024, Leu1033, Cys1043, Asp1044, and Phe1045 amino acids (Fig. 12A–C). Phe1045 also often formed Pi-stacking, with a rate of 90.6%. Out of these amino acids, Leu838, Val846, Val897, Leu1033, Cys1043, and Phe1045 show a good contribution to the binding energy and high incidence. Comparing these amino acids with the interacting amino acids from docking, we can see that Leu838, Val846, and Cys1043 remained in contact with the 15a compound for more than 90% of the time and showed a good contribution of the binding. After clustering, PLIP was used to extract 3D binding interactions as .pse files using representative frames (Fig. 13). Similarly, the reference compound shows that there are 15 amino acids (Leu838, Val846, Ala864, Lys866, Ile886, Leu887, Ile890, Val897, Val914, Leu1017, His1024, Leu1033, Cys1043, Asp1044, and Phe1045) that interact with sorafenib compound using hydrophobic interaction with a proportion of at least 90%. In addition, Asp1044 was found to form a H-bond with a proportion of 81.3% and Phe1045 forms a Pi-stacking of 83% (Fig. 14A–C). Leu838, Val846, Leu887, Val914, Leu1033, Cys1043, Asp1044, and Phe1045 are the amino acids that show high persistence and high contribution to the binding energy. Out of the most common amino acids, Val846, Ala864, Leu887, Val914, Leu1017, Leu1033, Cys1043, and Asp1044 remained in contact with the sorafenib from docking. The representative frames obtained from clustering each trajectory were used with PLIP to identify the interactions and get the 3D binding conformation as .pse files (Fig. 15).
| IP | EA | μ (eV) | χ (eV) | η (eV) | σ (eV) | ω (eV) | Dm (Debye) | TE (eV) | ΔNmax | ΔE (eV) |
|---|---|---|---|---|---|---|---|---|---|---|
| 5.953 | −1.783 | −2.085 | 2.085 | 3.868 | 0.259 | 8.406 | 11.596 | −113923.2 | 0.539 | −8.406 |
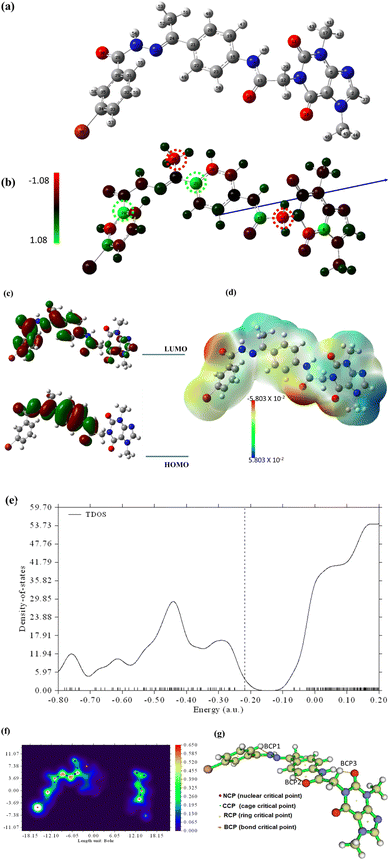
To shed more light on the reactivity of 15a, frontier molecular orbital analysis has been explored. As demonstrated in Fig. 21c, HOMO is localized all over most parts of the molecule while LUMO is localized over the middle part of the structure. The energy gap value, Egap, between HOMO and LUMO is 7.73 eV predicting a small energy is needed for electronic transition within the molecule. Such findings confirm the potential biological reactivity of 15a.
The computational indices that depend on HOMO and LUMO energies such as global softness (σ), global hardness (η), chemical potential (μ), electron affinity (EA), and electrophilicity index (ω) are calculated for further shedding light on the chemical reactivity of the designed molecule. The results in Table 8 revealed that the molecule is soft and potentially active.27
The molecular electrostatic potential estimations have been carried out to understand the electronic charge is distributed within compound 15a and hence the behavior of binding with VEGFER-2 can be predicted. The 3D potential surface map is presented in Fig. 21d. It is noticed that the negative potential areas (red) are localized over oxygen atoms and are ready for electrophilic attacks. Nucleophilic attacks will occur over a positive potential surface that is localized over hydrogen atoms (blue areas). The green zones over the resonance system are ready for hydrophobic interactions.
The total density of states (TDOS) has been carried out and the spectrum is depicted in Fig. 21e. As seen in the TDOS spectrum, the highest density is noticed for vacant orbitals over LUMO.
Topological analysis has been performed using the Multiwfn program to study the quantum theory of atoms in molecules (QTAIM) based on bond bathes, bond critical points (BCP), and QTAIM parameters. AIMALL software was also utilized to calculate the QTAIM parameters such as electron density (ρ), Laplacian (∇2ρ), and energy density H(r) as the estimated values are represented in ESI.† while the molecular graph and main generated QTAIM bonding bath with relative critical points are shown in Fig. 21f and g, while the detailed bond critical points (BCP) are resented in ESI.† The calculated (ρ), (∇2ρ), and H(r) revealed that the designed drug is stable with internal noncovalent bonding which grants the molecule its stability.
4. Conclusion
In conclusion, this study focused on the design of theobromine derivatives as potential anticancer and VEGFR-2 inhibitors. The investigation involved in vitro assessments of the new compounds' effectiveness against MCF-7 and HepG2 cancer cell lines. Compound 15a emerged as the most cytotoxic member, exhibiting strong inhibitory effects on both HepG2 and MCF-7 cancer cells, with notable selectivity indices. Moreover, compound 15a demonstrated potent VEGFR-2 inhibitory activity and induced apoptosis in HepG2 cells, as evidenced by increased caspase levels and enhanced apoptotic cell percentages. Furthermore, it significantly hindered the migration and healing abilities of HepG2 cancer cells. Molecular docking MD simulations, PLIP, ED, and DFT studies confirmed the binding affinity of the synthesized compounds to VEGFR-2. Finally, computational ADMET and toxicity assessments supported the potential for drug development of the synthesized compounds. Overall, the combination of biological findings and the CADD methodologies positions compound 15a as a promising candidate for the development of a novel anti-apoptotic lead anticancer medication.5. Experimental
5.1. Chemistry
All solvents, reagents, and devices were illustrated in ESI.†5.1.1.1. N-(4-(1-(2-(3-Bromobenzoyl)hydrazono)ethyl)phenyl)-2-(3,7-dimethyl-2,6-dioxo-2,3,6,7-tetrahydro-1H-purin-1-yl)acetamide 15a. White powder (yield = 0.38 g, 68%); mp = 210–212 °C; IR (KBr) ν cm−1: 3196 (NH), 1704, 1667, 1649 (C
![[double bond, length as m-dash]](https://www.rsc.org/images/entities/char_e001.gif) O); 1H NMR (400 MHz, DMSO-d6) δ 10.93 (s, 1H, NH), 10.45 (s, 1H, NH), 8.08 (d, J = 4.6 Hz, 1H, Ar-H), 7.83 (d, J = 8.5 Hz, 1H, Ar-H), 7.72–7.62 (m, 2H, Ar-H), 7.56–7.43 (m, 3H, Ar-H), 7.39 (m, 2H, Ar-H), 4.71 (s, 2H, CH2), 3.91 (s, 3H, CH3), 3.46 (s, 3H, CH3), 2.29 (s, 3H, CH3); 13C NMR (101 MHz, DMSO-d6) δ 170.64, 166.41, 164.22, 154.66, 151.37, 148.99, 143.73, 140.45, 139.94, 133.11, 132.35, 130.74, 129.99, 129.05, 128.03, 127.64, 126.93, 120.06, 119.04, 107.07, 43.94, 33.68, 29.93, 14.85; mass (m/z): 554 (M++2, 8.32%), 552 (M+, 22.99%), 411 (100%, base peak); Anal. calcd for C24H22BrN7O4 (552.39): C, 52.18; H, 4.01; N, 17.75; found: C, 52.42; H, 4.23; N, 17.98%.
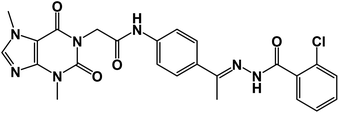
O); 1H NMR (400 MHz, DMSO-d6) δ 10.93 (s, 1H, NH), 10.45 (s, 1H, NH), 8.08 (d, J = 4.6 Hz, 1H, Ar-H), 7.83 (d, J = 8.5 Hz, 1H, Ar-H), 7.72–7.62 (m, 2H, Ar-H), 7.56–7.43 (m, 3H, Ar-H), 7.39 (m, 2H, Ar-H), 4.71 (s, 2H, CH2), 3.91 (s, 3H, CH3), 3.46 (s, 3H, CH3), 2.29 (s, 3H, CH3); 13C NMR (101 MHz, DMSO-d6) δ 170.64, 166.41, 164.22, 154.66, 151.37, 148.99, 143.73, 140.45, 139.94, 133.11, 132.35, 130.74, 129.99, 129.05, 128.03, 127.64, 126.93, 120.06, 119.04, 107.07, 43.94, 33.68, 29.93, 14.85; mass (m/z): 554 (M++2, 8.32%), 552 (M+, 22.99%), 411 (100%, base peak); Anal. calcd for C24H22BrN7O4 (552.39): C, 52.18; H, 4.01; N, 17.75; found: C, 52.42; H, 4.23; N, 17.98%.5.1.1.2. N-(4-(1-(2-(2-Chlorobenzoyl)hydrazono)ethyl)phenyl)-2-(3,7-dimethyl-2,6-dioxo-2,3,6,7-tetrahydro-1H-purin-1-yl)acetamide 15b. White powder (yield = 0.38 g, 75%); mp = 207–209 °C; IR (KBr) ν cm−1: 3265 (NH), 1745,1696, 1667 (C
![[double bond, length as m-dash]](https://www.rsc.org/images/entities/char_e001.gif) O); 1H NMR (400 MHz, DMSO-d6) δ 10.92 (s, 1H, NH), 10.43 (s, 1H, NH), 8.03 (d, 1H, Ar-H), 7.84 (d, J = 8.1 Hz, 1H, Ar-H), 7.65 (d, J = 8.1 Hz, 1H, Ar-H), 7.60–7.35 (m, 6H, Ar-H), 4.72 (s, 2H, CH2), 3.91 (s, 3H, CH3), 3.47 (s, 3H, CH3), 2.30 (s, 3H, CH3); 13C NMR (101 MHz, DMSO-d6) δ 169.98, 166.42, 163.37, 154.67, 151.49, 151.39, 149.01, 143.74, 143.27, 130.96, 130.20, 130.04, 129.28, 129.04, 127.66, 126.93, 119.07, 107.09, 43.95, 33.68, 29.93, 14.85; Anal. calcd for C24H22ClN7O4 (507.94): C, 56.75; H, 4.37; N, 19.30; found: C, 56.31; H, 4.10; N, 19.69%.
O); 1H NMR (400 MHz, DMSO-d6) δ 10.92 (s, 1H, NH), 10.43 (s, 1H, NH), 8.03 (d, 1H, Ar-H), 7.84 (d, J = 8.1 Hz, 1H, Ar-H), 7.65 (d, J = 8.1 Hz, 1H, Ar-H), 7.60–7.35 (m, 6H, Ar-H), 4.72 (s, 2H, CH2), 3.91 (s, 3H, CH3), 3.47 (s, 3H, CH3), 2.30 (s, 3H, CH3); 13C NMR (101 MHz, DMSO-d6) δ 169.98, 166.42, 163.37, 154.67, 151.49, 151.39, 149.01, 143.74, 143.27, 130.96, 130.20, 130.04, 129.28, 129.04, 127.66, 126.93, 119.07, 107.09, 43.95, 33.68, 29.93, 14.85; Anal. calcd for C24H22ClN7O4 (507.94): C, 56.75; H, 4.37; N, 19.30; found: C, 56.31; H, 4.10; N, 19.69%.5.1.1.3. N-(3-(1-(2-(3-Chlorobenzoyl)hydrazono)ethyl)phenyl)-2-(3,7-dimethyl-2,6-dioxo-2,3,6,7-tetrahydro-1H-purin-1-yl)acetamide 16. White powder (yield = 0.39 g, 77%); mp = 200–202 °C; IR (KBr) ν cm−1: 3258 (NH), 1707, 1666 (C
![[double bond, length as m-dash]](https://www.rsc.org/images/entities/char_e001.gif) O); 1H NMR (400 MHz, DMSO-d6) δ 10.89 (s, 1H, NH), 10.44 (s, 1H, NH), 8.32–8.01 (m, 2H, Ar-H), 7.89 (d, 2H, Ar-H), 7.57 (m, 5H, Ar-H), 4.70 (s, 2H, CH2), 3.89 (s, 3H, CH3), 3.46 (s, 3H, CH3), 2.36 (s, 3H, CH3); 13C NMR (101 MHz, DMSO-d6) δ 166.41, 154.65, 151.38, 148.96, 143.69, 139.34, 139.03, 136.51, 133.57, 131.78, 130.77, 129.33, 128.11, 127.15, 122.19, 120.71, 117.48, 107.06, 43.89, 33.67, 29.92, 15.22; Anal. calcd for C24H22ClN7O4 (507.94): C, 56.75; H, 4.37; N, 19.30; Found: C, 56.91; H, 4.52; N, 19.57%.
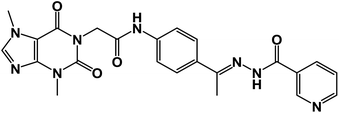
O); 1H NMR (400 MHz, DMSO-d6) δ 10.89 (s, 1H, NH), 10.44 (s, 1H, NH), 8.32–8.01 (m, 2H, Ar-H), 7.89 (d, 2H, Ar-H), 7.57 (m, 5H, Ar-H), 4.70 (s, 2H, CH2), 3.89 (s, 3H, CH3), 3.46 (s, 3H, CH3), 2.36 (s, 3H, CH3); 13C NMR (101 MHz, DMSO-d6) δ 166.41, 154.65, 151.38, 148.96, 143.69, 139.34, 139.03, 136.51, 133.57, 131.78, 130.77, 129.33, 128.11, 127.15, 122.19, 120.71, 117.48, 107.06, 43.89, 33.67, 29.92, 15.22; Anal. calcd for C24H22ClN7O4 (507.94): C, 56.75; H, 4.37; N, 19.30; Found: C, 56.91; H, 4.52; N, 19.57%.5.1.1.4. 2-(3,7-Dimethyl-2,6-dioxo-2,3,6,7-tetrahydro-1H-purin-1-yl)-N-(4-(1-(2-nicotinoylhydrazono)ethyl)phenyl)acetamide 17. White crystal (yield = 0.31 g, 65%); mp = 230–232 °C; IR (KBr) ν cm−1: 3265 (NH), 1745,1695, 1666 (C
![[double bond, length as m-dash]](https://www.rsc.org/images/entities/char_e001.gif) O); 1H NMR (400 MHz, DMSO-d6) δ 10.91 (s, 1H, NH), 10.42 (s, 1H, NH), 9.04 (s, 1H, Ar-H), 8.75 (s, 1H, Ar-H), 8.15 (d, 2H, Ar-H), 7.91 (d, 2H, Ar-H), 7.60 (d, 3H, Ar-H), 4.71 (s, 2H, CH2), 3.90 (s, 3H, CH3), 3.34 (s, 3H, CH3), 2.36 (s, 3H, CH3); 13C NMR (101 MHz, DMSO-d6) δ 166.42, 154.64, 151.36, 148.98, 143.74, 143.26, 133.21, 127.71, 123.92, 119.07, 107.06, 43.94, 33.69, 29.93, 14.95; Anal. calcd. for C23H22N8O4 (474.48): C, 58.22; H, 4.67; N, 23.62; Found: C, 58.59; H, 4.42; N, 23.91%.
O); 1H NMR (400 MHz, DMSO-d6) δ 10.91 (s, 1H, NH), 10.42 (s, 1H, NH), 9.04 (s, 1H, Ar-H), 8.75 (s, 1H, Ar-H), 8.15 (d, 2H, Ar-H), 7.91 (d, 2H, Ar-H), 7.60 (d, 3H, Ar-H), 4.71 (s, 2H, CH2), 3.90 (s, 3H, CH3), 3.34 (s, 3H, CH3), 2.36 (s, 3H, CH3); 13C NMR (101 MHz, DMSO-d6) δ 166.42, 154.64, 151.36, 148.98, 143.74, 143.26, 133.21, 127.71, 123.92, 119.07, 107.06, 43.94, 33.69, 29.93, 14.95; Anal. calcd. for C23H22N8O4 (474.48): C, 58.22; H, 4.67; N, 23.62; Found: C, 58.59; H, 4.42; N, 23.91%.5.2. Biological examinations
5.3. In silico studies
Conflicts of interest
There are no conflicts of interest to declare.Acknowledgements
This research was funded by Princess Nourah bint Abdulrahman University Researchers Supporting Project number (PNURSP2023R116), Princess Nourah bint Abdulrahman University, Riyadh, Saudi Arabia. The authors extend their appreciation to the Research Center at AlMaarefa University for funding this work.References
- F. Bray, J. Ferlay, I. Soerjomataram, R. L. Siegel, L. A. Torre and A. Jemal, Global cancer statistics 2018: GLOBOCAN estimates of incidence and mortality worldwide for 36 cancers in 185 countries, CA Cancer J Clin, 2018, 68(6), 394–424 CrossRef PubMed.
- A. Belal, N. M. Abdel Gawad, A. B. Mehany, M. A. Abourehab, H. Elkady, A. A. Al-Karmalawy and A. S. Ismael, Design, synthesis and molecular docking of new fused 1 H-pyrroles, pyrrolo [3,2-d] pyrimidines and pyrrolo [3,2-e][1,4] diazepine derivatives as potent EGFR/CDK2 inhibitors, J. Enzyme Inhib. Med. Chem., 2022, 37(1), 1884–1902 CrossRef CAS.
- M. M. Khalifa, A. A. Al-Karmalawy, E. B. Elkaeed, M. S. Nafie, M. A. Tantawy, I. H. Eissa and H. A. Mahdy, Topo II inhibition and DNA intercalation by new phthalazine-based derivatives as potent anticancer agents: design, synthesis, anti-proliferative, docking, and in vivo studies, J. Enzyme Inhib. Med. Chem., 2022, 37(1), 299–314 CrossRef CAS PubMed.
- V. T. DeVita Jr and E. Chu, A history of cancer chemotherapy, Cancer Res., 2008, 68(21), 8643–8653 CrossRef PubMed.
- I. J. Fidler and L. M. Ellis, Chemotherapeutic drugs—more really is not better, Nat. Med., 2000, 6(5), 500–502 CrossRef CAS PubMed.
- A. A. Shah, M. A. Kamal and S. Akhtar, Tumor angiogenesis and VEGFR-2: mechanism, pathways and current biological therapeutic interventions, Curr. Drug Metab., 2021, 22(1), 50–59 CAS.
- E. Z. Elrazaz, R. A. Serya, N. S. Ismail, A. Albohy, D. A. Abou El Ella and K. A. Abouzid, Discovery of potent thieno [2,3-d] pyrimidine VEGFR-2 inhibitors: Design, synthesis and enzyme inhibitory evaluation supported by molecular dynamics simulations, Bioorg. Chem., 2021, 113, 105019 CrossRef CAS PubMed.
- A. M. Metwaly, Z. Lianlian, H. Luqi and D. Deqiang, Black ginseng and its saponins: Preparation, phytochemistry and pharmacological effects, Molecules, 2019, 24(10), 1856 CrossRef CAS PubMed.
- A. M. Metwaly, M. M. Ghoneim, I. H. Eissa, I. A. Elsehemy, A. E. Mostafa, M. M. Hegazy, W. M. Afifi and D. Dou, Traditional ancient Egyptian medicine: A review, Saudi J. Biol. Sci., 2021, 28(10), 5823–5832 CrossRef PubMed.
- D. J. Newman and G. M. Cragg, Natural products as sources of new drugs from 1981 to 2014, J. Nat. Prod., 2016, 79(3), 629–661 CrossRef CAS.
- R. da Rosa, E. P. Schenkel and L. S. C. Bernardes, Semisynthetic and newly designed derivatives based on natural chemical scaffolds: moving beyond natural products to fight Trypanosoma cruzi, Phytochem. Rev., 2020, 19(1), 105–122 CrossRef CAS.
- A. Sánchez-Recillas, G. Navarrete-Vázquez, S. Hidalgo-Figueroa, M. Y. Rios, M. Ibarra-Barajas and S. Estrada-Soto, Semisynthesis, ex vivo evaluation, and SAR studies of coumarin derivatives as potential antiasthmatic drugs, Eur. J. Med. Chem., 2014, 77, 400–408 CrossRef PubMed.
- F. Carla Cadoná, A. Kolinski Machado, V. Farina Azzolin, F. Barbisan, E. Bortoluzzi Dornelles, W. Glanzner, P. D. Bayard Gonçalves, C. Elias Assmann, E. Esteves Ribeiro and I. Beatrice Mânica da Cruz, Guaraná a caffeine-rich food increases oxaliplatin sensitivity of colorectal HT-29 cells by apoptosis pathway modulation, Anti-Cancer Agents Med. Chem., 2016, 16(8), 1055–1065 CrossRef.
- N. Sugimoto, S. Miwa, M. Katakura, K. Matsuzaki, O. Shido, H. Tsuchiya and A. Yachie, Theobromine, the primary methylxanthine found in Theobroma cacao, inhibits malignant glioblastoma cell growth by negatively regulating Akt/mammalian target of rapamycin kinase (LB836), FASEB J., 2014, 28, LB836 Search PubMed.
- E. Barcz, E. Sommer, I. Sokolnicka, K. Gawrychowski, K. Roszkowska-Purska, P. Janik and E. Skopinska-Rózewska, The influence of theobromine on angiogenic activity and proangiogenic cytokines production of human ovarian cancer cells, Oncol. Rep., 1998, 5(2), 517–537 CAS.
- M. Gil, E. Skopińska-Rózewska, D. Radomska, U. Demkow, H. Skurzak, M. Rochowska, J. Beuth and K. Roszkowski, Effect of purinergic receptor antagonists suramin and theobromine on tumor-induced angiogenesis in BALB/c mice, Folia Biol., 1993, 39(2), 63–68 CAS.
- M. M. Alanazi, H. A. Mahdy, N. A. Alsaif, A. J. Obaidullah, H. M. Alkahtani, A. A. Al-Mehizia, S. M. Alsubaie, M. A. Dahab and I. H. Eissa, New bis ([1,2,4]triazolo)[4,3-a: 3′,4′-c] quinoxaline derivatives as VEGFR-2 inhibitors and apoptosis inducers: Design, synthesis, in silico studies, and anticancer evaluation, Bioorg. Chem., 2021, 112, 104949 CrossRef CAS PubMed.
- M. M. Alanazi, H. Elkady, N. A. Alsaif, A. J. Obaidullah, H. M. Alkahtani, M. M. Alanazi, M. A. Alharbi, I. H. Eissa and M. A. Dahab, New quinoxaline-based VEGFR-2 inhibitors: design, synthesis, and antiproliferative evaluation with in silico docking, ADMET, toxicity, and DFT studies, RSC Adv., 2021, 11(48), 30315–30328 RSC.
- R. G. Yousef, H. M. Sakr, I. H. Eissa, A. B. Mehany, A. M. Metwaly, M. A. Elhendawy, M. M. Radwan, M. A. ElSohly, H. S. Abulkhair and K. El-Adl, New quinoxaline-2 (1 H)-ones as potential VEGFR-2 inhibitors: Design, synthesis, molecular docking, ADMET profile and anti-proliferative evaluations, New J. Chem., 2021, 45(36), 16949–16964 RSC.
- L. Adnane, P. A. Trail, I. Taylor and S. M. Wilhelm, Sorafenib (BAY 43-9006, Nexavar®), a dual-action inhibitor that targets RAF/MEK/ERK pathway in tumor cells and tyrosine kinases VEGFR/PDGFR in tumor vasculature, Methods Enzymol., 2006, 407, 597–612 CAS.
- F.-W. Peng, D.-K. Liu, Q.-W. Zhang, Y.-G. Xu and L. Shi, VEGFR-2 inhibitors and the therapeutic applications thereof: a patent review (2012-2016), Expert Opin. Ther. Pat., 2017, 27(9), 987–1004 CrossRef CAS PubMed.
- R. G. Yousef, A. Elwan, I. M. Gobaara, A. B. Mehany, W. M. Eldehna, S. A. El-Metwally, B. A. Alsfouk, E. B. Elkaeed, A. M. Metwaly and I. H. Eissa, Anti-cancer and immunomodulatory evaluation of new nicotinamide derivatives as potential VEGFR-2 inhibitors and apoptosis inducers: in vitro and in silico studies, J. Enzyme Inhib. Med. Chem., 2022, 37(1), 2206–2222 CrossRef CAS.
- R. G. Yousef, A. Ibrahim, M. M. Khalifa, W. M. Eldehna, I. M. Gobaara, A. B. Mehany, E. B. Elkaeed, A. A. Alsfouk, A. M. Metwaly and I. H. Eissa, Discovery of new nicotinamides as apoptotic VEGFR-2 inhibitors: Virtual screening, synthesis, anti-proliferative, immunomodulatory, ADMET, toxicity, and molecular dynamic simulation studies, J. Enzyme Inhib. Med. Chem., 2022, 37(1), 1389–1403 CrossRef CAS.
- R. G. Yousef, H. Elkady, E. B. Elkaeed, I. M. Gobaara, H. A. Al-Ghulikah, D. Z. Husein, I. M. Ibrahim, A. M. Metwaly and I. H. Eissa, (E)-N-(3-(1-(2-(4-(2,2,2-Trifluoroacetamido) benzoyl) hydrazono) ethyl) phenyl) nicotinamide: A Novel Pyridine Derivative for Inhibiting Vascular Endothelial Growth Factor Receptor-2: Synthesis, Computational, and Anticancer Studies, Molecules, 2022, 27(22), 7719 CrossRef CAS PubMed.
- T. Hou, L. Zhu, L. Chen and X. Xu, Mapping the binding site of a large set of quinazoline type EGF-R inhibitors using molecular field analyses and molecular docking studies, J. Chem. Inf. Comput. Sci., 2003, 43(1), 273–287 CrossRef CAS PubMed.
- D. Z. Husein, R. Hassanien and M. Khamis, Cadmium oxide nanoparticles/graphene composite: Synthesis, theoretical insights into reactivity and adsorption study, RSC Adv., 2021, 11(43), 27027–27041 RSC.
- T. Wang and D. Z. Husein, Novel synthesis of multicomponent porous nano-hybrid composite, theoretical investigation using DFT and dye adsorption applications: Disposing of waste with waste, Environ. Sci. Pollut. Res., 2023, 30(4), 8928–8955 CrossRef CAS PubMed.
- A. Van de Loosdrecht, R. Beelen, G. Ossenkoppele, M. Broekhoven and M. Langenhuijsen, A tetrazolium-based colorimetric MTT assay to quantitate human monocyte mediated cytotoxicity against leukemic cells from cell lines and patients with acute myeloid leukemia, J. Immunol. Methods, 1994, 174(1–2), 311–320 CrossRef CAS.
- E. B. Elkaeed, R. G. Yousef, H. Elkady, A. B. Mehany, B. A. Alsfouk, D. Z. Husein, I. M. Ibrahim, A. M. Metwaly and I. H. Eissa, In silico, in vitro VEGFR-2 inhibition, and anticancer activity of a 3-(hydrazonomethyl) naphthalene-2-ol derivative, J. Biomol. Struct. Dyn., 2022, 1–16 CrossRef.
- W. M. Eldehna, M. A. El Hassab, Z. M. Elsayed, T. Al-Warhi, H. Elkady, M. F. Abo-Ashour, M. A. Abourehab, I. H. Eissa and H. A. Abdel-Aziz, Design, synthesis, in vitro biological assessment and molecular modeling insights for novel 3-(naphthalen-1-yl)-4,5-dihydropyrazoles as anticancer agents with potential EGFR inhibitory activity, Sci. Rep., 2022, 12(1), 12821 CrossRef CAS PubMed.
- M. S. Taghour, H. Elkady, W. M. Eldehna, N. M. El-Deeb, A. M. Kenawy, E. B. Elkaeed, A. A. Alsfouk, M. S. Alesawy, A. M. Metwaly and I. H. Eissa, Design and synthesis of thiazolidine-2,4-diones hybrids with 1,2-dihydroquinolones and 2-oxindoles as potential VEGFR-2 inhibitors: In-vitro anticancer evaluation and in-silico studies, J. Enzyme Inhib. Med. Chem., 2022, 37(1), 1903–1917 CrossRef CAS.
- E. B. Elkaeed, R. G. Yousef, H. Elkady, I. M. Gobaara, A. A. Alsfouk, D. Z. Husein, I. M. Ibrahim, A. M. Metwaly and I. H. Eissa, The assessment of anticancer and VEGFR-2 inhibitory activities of a new 1 H-indole derivative: In silico and in vitro approaches, Processes, 2022, 10(7), 1391 CrossRef CAS.
- C. Ma, M. S. Taghour, A. Belal, A. B. Mehany, N. Mostafa, A. Nabeeh, I. H. Eissa and A. A. Al-Karmalawy, Design and synthesis of new quinoxaline derivatives as potential histone deacetylase inhibitors targeting hepatocellular carcinoma: in silico, in vitro, and SAR studies, Front. Chem., 2021, 9, 725135 CrossRef CAS.
- E. B. Elkaeed, R. G. Yousef, M. M. Khalifa, A. Ibrahim, A. B. Mehany, I. M. Gobaara, B. A. Alsfouk, W. M. Eldehna, A. M. Metwaly and I. H. Eissa, Discovery of New VEGFR-2 Inhibitors: Design, Synthesis, Anti-Proliferative Evaluation, Docking, and MD Simulation Studies, Molecules, 2022, 27(19), 6203 CrossRef CAS PubMed.
- M. S. Alesawy, A. E. Abdallah, M. S. Taghour, E. B. Elkaeed, I. H. Eissa and A. M. Metwaly, In silico studies of some isoflavonoids as potential candidates against COVID-19 targeting human ACE2 (hACE2) and viral main protease (Mpro), Molecules, 2021, 26(9), 2806 CrossRef CAS PubMed.
- H. Elkady, A. Elwan, H. A. El-Mahdy, A. S. Doghish, A. Ismail, M. S. Taghour, E. B. Elkaeed, I. H. Eissa, M. A. Dahab and H. A. Mahdy, New benzoxazole derivatives as potential VEGFR-2 inhibitors and apoptosis inducers: Design, synthesis, anti-proliferative evaluation, flowcytometric analysis, and in silico studies, J. Enzyme Inhib. Med. Chem., 2022, 37(1), 403–416 CrossRef CAS PubMed.
- I. H. Eissa, M. M. Khalifa, E. B. Elkaeed, E. E. Hafez, A. A. Alsfouk and A. M. Metwaly, In silico exploration of potential natural inhibitors against SARS-CoV-2 nsp10, Molecules, 2021, 26(20), 6151 CrossRef CAS.
- I. H. Eissa, M. A. Dahab, M. K. Ibrahim, N. A. Alsaif, A. Alanazi, S. I. Eissa, A. B. Mehany and A. M. Beauchemin, Design and discovery of new antiproliferative 1,2,4-triazin-3 (2H)-ones as tubulin polymerization inhibitors targeting colchicine binding site, Bioorg. Chem., 2021, 112, 104965 CrossRef CAS PubMed.
- M. J. Abraham, T. Murtola, R. Schulz, S. Páll, J. C. Smith, B. Hess and E. Lindahl, GROMACS: High performance molecular simulations through multi-level parallelism from laptops to supercomputers, SoftwareX, 2015, 1, 19–25 CrossRef.
- S. Jo, X. Cheng, S. M. Islam, L. Huang, H. Rui, A. Zhu, H. S. Lee, Y. Qi, W. Han and K. Vanommeslaeghe, CHARMM-GUI PDB manipulator for advanced modeling and simulations of proteins containing nonstandard residues, Adv. Protein Chem. Struct. Biol., 2014, 96, 235–265 CAS.
- J. Lee, X. Cheng, S. Jo, A. D. MacKerell, J. B. Klauda and W. Im, CHARMM-GUI input generator for NAMD, GROMACS, AMBER, OpenMM, and CHARMM/OpenMM simulations using the CHARMM36 additive force field, Biophys. J., 2016, 110(3), 641a CrossRef.
- T. Tuccinardi, What is the current value of MM/PBSA and MM/GBSA methods in drug discovery?, Expert Opin. Drug Discovery, 2021, 16(11), 1233–1237 CrossRef CAS PubMed.
- M. S. Valdés-Tresanco, M. E. Valdés-Tresanco, P. A. Valiente and E. Moreno, gmx_MMPBSA: a new tool to perform end-state free energy calculations with GROMACS, J. Chem. Theory Comput., 2021, 17(10), 6281–6291 CrossRef.
- C. Bouysset and S. Fiorucci, ProLIF: a library to encode molecular interactions as fingerprints, J. Cheminf., 2021, 13, 1–9 Search PubMed.
- S. Salentin, S. Schreiber, V. J. Haupt, M. F. Adasme and M. Schroeder, PLIP: fully automated protein–ligand interaction profiler, Nucleic Acids Res., 2015, 43(W1), W443–W447 CrossRef CAS PubMed.
- T. Tubiana, J.-C. Carvaillo, Y. Boulard and S. Bressanelli, TTClust: a versatile molecular simulation trajectory clustering program with graphical summaries, J. Chem. Inf. Model., 2018, 58(11), 2178–2182 CrossRef CAS PubMed.
- A. Amadei, A. B. Linssen and H. J. Berendsen, Essential dynamics of proteins, Proteins: Struct., Funct., Bioinf., 1993, 17(4), 412–425 CrossRef CAS PubMed.
- E. Papaleo, P. Mereghetti, P. Fantucci, R. Grandori and L. De Gioia, Free-energy landscape, principal component analysis, and structural clustering to identify representative conformations from molecular dynamics simulations: the myoglobin case, J. Mol. Graphics Modell., 2009, 27(8), 889–899 CrossRef CAS.
- G. G. Maisuradze and D. M. Leitner, Free energy landscape of a biomolecule in dihedral principal component space: Sampling convergence and correspondence between structures and minima, Proteins: Struct., Funct., Bioinf., 2007, 67(3), 569–578 CrossRef CAS.
- B. Hess, Similarities between principal components of protein dynamics and random diffusion, Phys. Rev. E: Stat. Phys., Plasmas, Fluids, Relat. Interdiscip. Top., 2000, 62(6), 8438 CrossRef CAS.
- E. B. Elkaeed, R. G. Yousef, H. Elkady, I. M. Gobaara, B. A. Alsfouk, D. Z. Husein, I. M. Ibrahim, A. M. Metwaly and I. H. Eissa, Design, synthesis, docking, DFT, MD simulation studies of a new nicotinamide-based derivative: In vitro anticancer and VEGFR-2 inhibitory effects, Molecules, 2022, 27(14), 4606 CrossRef CAS PubMed.
- E. B. Elkaeed, I. H. Eissa, H. Elkady, A. Abdelalim, A. M. Alqaisi, A. A. Alsfouk, A. Elwan and A. M. Metwaly, A multistage in silico study of natural potential inhibitors targeting SARS-CoV-2 main protease, Int. J. Mol. Sci., 2022, 23(15), 8407 CrossRef CAS PubMed.
Footnote |
| † Electronic supplementary information (ESI) available. See DOI: https://doi.org/10.1039/d3ra04007k |
| This journal is © The Royal Society of Chemistry 2023 |

