DOI:
10.1039/D3RA03949H
(Paper)
RSC Adv., 2023,
13, 26418-26429
End group modulation of A–D–A type small donor molecules for DTP based organic photovoltaic solar cells: a DFT approach†
Received
13th June 2023
, Accepted 28th August 2023
First published on 4th September 2023
Abstract
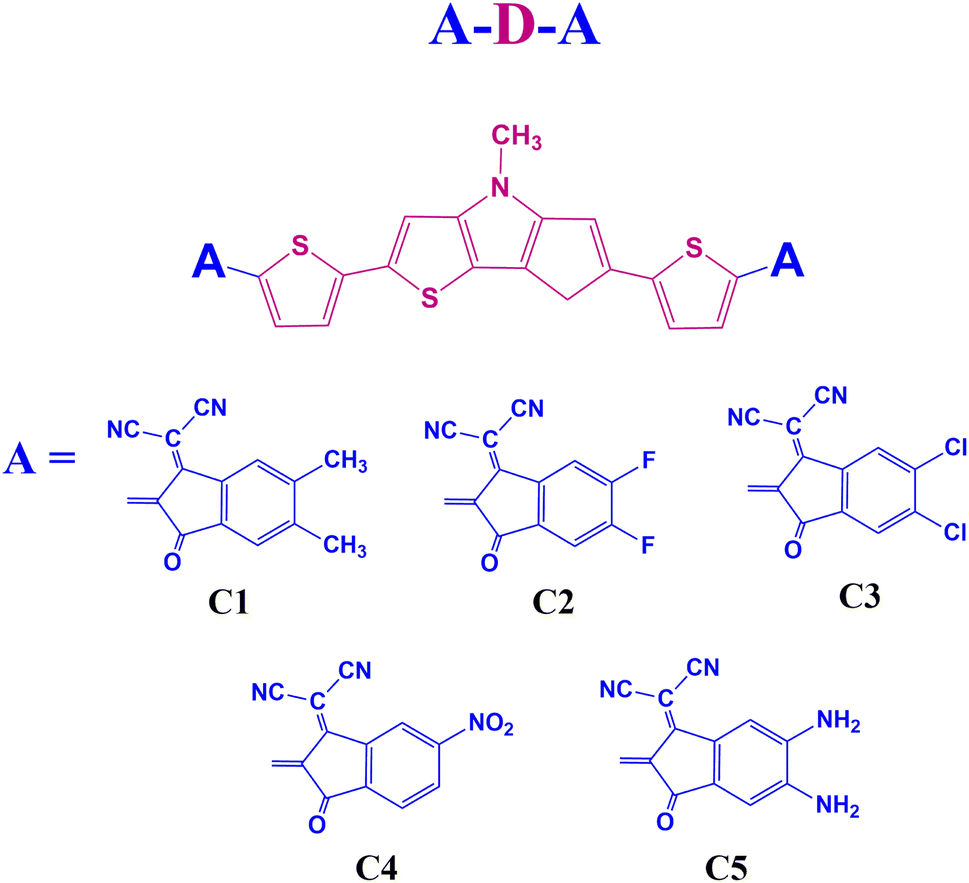
Here, five new acceptor–donor–acceptor (A–D–A) type small donor molecules C1–C5, have been designed based on the central D unit, dithieno[3,2-b:2′,3′-d]pyrrole (DTP). Besides, five different A units, viz. 1,1-dicyano-methylene-5,6-dimethyl-3-indanone, 1,1-dicyano-methylene-5,6-difluoro-3-indanone, 1,1-dicyano-methylene-5,6-dichloro-3-indanone, 1,1-dicyano-methylene-5-nitro-3-indanone, and 1,1-dicyano-methylene-5,6-diamino-3-indanone are selected for these designed compounds C1–C5, respectively. Density functional theory (DFT) and time-dependent density functional theory (TD-DFT) methods have been employed to study the influence of different A units on the geometric, electronic, optical, charge transport and photovoltaic properties of the designed donor molecules. The results reveal that the performance of the designed donor molecules have been improved on attachment of the strong electron withdrawing A units. The observed reorganization energy (λ) values infer the electron donating nature of the designed compounds. Moreover, the absorption properties of the designed compounds manifest that compound C4 possesses the high values of maximum wavelength (λmax) in both gas and solvent phases. The properties of the D/A blends reveal that all designed blends C1–C5/C60–CN, have the capacity to promote charge carrier separation at the D/A interface. Further, the photovoltaic performance of the D/A complexes also reveal that complex C4/C60–CN, with a theoretical PCE of 18%, can be considered as the most promising candidate for application in OSCs.
1 Introduction
Developing clean and renewable energy based technology is the main goal of 21st century. Some high-potential renewable sources include solar energy, tidal energy, wind energy, bio gas energy and hydro power energy.1 In this context, solar energy is considered as a suitable candidate because it is renewable and safe for the environment.2 The constant rise in energy demand brought on by the growth of environmental concerns has facilitated an intensification of research on solar energy conversion. The photo emission phenomena used by the photovoltaic systems and solar cells convert sunlight into electrical energy.1 Photovoltaic solar cells can be broadly categorized into three categories, viz., inorganic solar cells with silicon semiconducting materials, organic solar cells with polymers and small acceptor moieties, and hybrid solar cells (mixed organic and inorganic materials).3 A photovoltaic solar cell mainly consists of three key components, viz., donor, acceptor and π-bridge. In order for the acceptor to absorb sunlight and produce electricity, the donor transfers electrons to it. On the other hand, the π-bridge acts as a spacer between the donor and acceptor parts.4
Now-a-days numerous novel organic solar cells (OSCs) are being developed and tested for better power conversion efficiency (PCE).5 OSCs have drawn a lot of interest over the past decades owing to their superior cost-effectiveness, mechanical flexibility, solution processability, light weight, and aesthetic qualities.6 A variety of methods have been used to increase the PCE of OSCs. One such method involves designing and synthesizing new electron donor and electron acceptor materials with high photon mobility and broad photon absorption.2 Narrow-band gap organic conjugated materials, which are employed as the donor component in OSCs, have been the focus of substantial research due to their ease of purification and well-defined molecular structure.5 So far, the PCE of single-junction OSCs has risen above 15%.7
In OSCs, small molecule donors have recently attracted a lot of attention as they avoid changes in molecular weight, polydispersity, and purity of polymeric donors due to their uniform and distinct molecular structures.8 Designing of high performance small molecule donors and exploring them with appropriate acceptor materials serve as a crucial step for achieving high performance in OSCs. As per literature, a significant factor that helps in determining the photovoltaic performance of the designed devices include the electrical, structural, and optical characteristics of both donor and acceptor materials.9
Various researches have been carried out to design and synthesize some acceptor–donor–acceptor (A–D–A) type photovoltaic materials.10 One such effective method for designing these materials is by alteration between electron-rich (donor) and electron-poor (acceptor) units, which results in a material with a low-energy absorption band.11 In order to design an A–D–A type small organic molecule (SOM), proper combination of the electron-withdrawing group (EWG) and electron-donating group (EDG) has become common for improved molecular interaction, favorable charge transfer, widen absorption spectra, and tunable molecular energy gap.10
Dithieno[3,2-b:2′, 3′-d]pyrrole (DTP) has attracted many researchers due to the capacity of electron-rich N atom to boost its oxidized state's stability and further to reduce the band gap.12 DTP units have been developed for organic photovoltaics (OPVs) and organic field-effect transistors (OFETs) as they function as donor building blocks (due to presence of 2,2′-bithiophene with N as the bridge) for the functional π-conjugated systems across the fused ring. DTP along with the alkyl chain attached to its N-position, can serve as an effectual component to enhance its solubility. The bridging DTP structure can therefore be expected to serve as a donor block so as to enhance the semiconducting and hole-transport properties of the materials.13,14 In order to achieve high performance in OSCs, an appropriate modification of the end-capped groups can result in efficient tuning of the absorption maximum and energy levels.15 The suitable end-capped acceptor groups used include 3,9-bis(2-methylene-(3-(1,1-dicyanomethylene)-indanone))-5,5,11,11-tetrakis(4-hexylphenyl)-dithieno[2,3-d:2′, 3′-d′]-s-indaceno[1,2-b:5,6-b′]dithiophene (ITIC) derivatives.16,17 It is possible to efficiently tailor the molecular energy levels and absorption spectra of ITIC derivatives by adjusting the intramolecular electron push–pull effects, while maintaining their essential properties to behave as effective acceptor materials.17 For solution processed OSCs, for instance, Zhang's team reported a PCE of 2.75% using a donor polymer holding DTP as a donor entity.14 Moreover, Lu's team reported a PCE of 5.6% based on D–A–A configuration holding DTP as a donor moiety.18
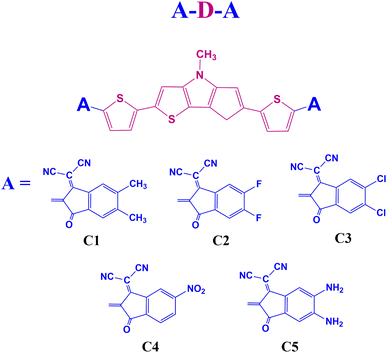
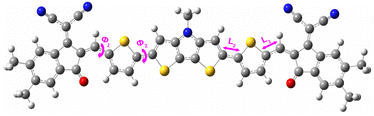
End group modulation is a good way to design novel OSC materials with excellent photovoltaic properties.19 Our work suggests that building small donor molecules with end-group modulation and electron rich DTP unit is viable for performant and economical OSCs. We also shed light on the molecular design behind simple efficient electron donors. In this regard, we have designed five A–D–A type small donor molecules, C1–C5, using DTP as the central donor (D) unit. Besides, 1,1-dicyano-methylene-5,6-dimethyl-3-indanone, 1,1-dicyano-methylene-5,6-difluoro-3-indanone, 1,1-dicyano-methylene-5,6-dichloro-3-indanone, 1,1-dicyano-methylene-5-nitro-3-indanone, and 1,1-dicyano-methylene-5,6-diamino-3-indanone are the end-group acceptor (A) units selected for the designed compounds C1–C5, respectively. We have presented the sketches of the designed molecules in Fig. 1.
 |
| | Fig. 1 Sketches of the designed molecules. | |
Herein, our goal is two-fold. To boost the OSCs' ability to absorb solar energy, we will first try to tune the structure of the small molecule donors. Secondly, we will examine the role of the designed small molecule donors in the charge transfer processes occurring at the donor/acceptor (D/A) interface. To attain this goal, quantum chemical techniques have been used for investigating the geometric structures, electronic properties, optical characteristics, and charge transfer processes. Furthermore, we have studied the charge transport process and photovoltaic properties of the designed small donor molecules, C1–C5, using C60–CN as the standard acceptor.20 To the best of our knowledge, theoretical study based on DTP containing A–D–A type small molecule donors have been less explored.
2 Computational details
The Gaussian 09 program package has been utilized for all of the calculations. To optimize the ground-state geometries of the designed molecules, C1–C5, we have employed the density functional theory (DFT) approach. Table S1 (in the ESI†) contains the detail coordinates of the designed structures that have been optimized. Besides, the vibrational analysis confirms that the optimized structures are at the minimum-energy points. In order to validate the functionals employed in our calculations, we have conducted a test calculation with the compound DPP–DTPC8 reported in the literature since it resembles structurally with our designed compounds.14 To carry out both the ground state and excited state calculations, we have employed six different functionals, viz., B3LYP/6-31G(d), B3LYP-D3/6-31G(d), CAM-B3LYP/6-31G(d), B3PW91/6-31G(d), HSEH1PBE/6-31G(d), and wB97XD/6-31G(d) using the DFT and time dependent-DFT (TD-DFT) approaches. The respective results are reported in Table S2 (in the ESI†) and are further correlated with the experimental results. Table S2† shows that for the ground state calculations, the results obtained using the functional HSEH1PBE/6-31G(d) agree well with the experimentally reported results. On the other hand, for the excited state calculations, the results obtained using the functional B3PW91/6-31G(d) match well with the experimental results. The conductor-like polarizable continuum model (CPCM) has been employed to perform the solvent phase calculations employing the chloroform solvent.14 Calculations related to the neutral, cationic and anionic energy, ionization potential (IP), electron affinity (EA), and reorganization energy (λ) are also carried out at the same level of theory. To calculate the electronic coupling matrix element (V) values, we have used the M06-2X-D3/6-31G(d) level of theory as it involves the dispersion correction and can be used to investigate the charge transfer properties.21 However, HSEH1PBE/6-31G(d) level of theory has been used to calculate the exciton binding energy (Eb) and the Gibbs free energy change (ΔG).
3 Theoretical methodology
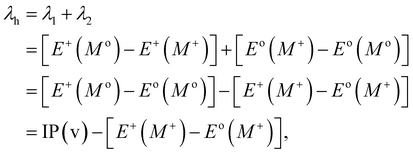
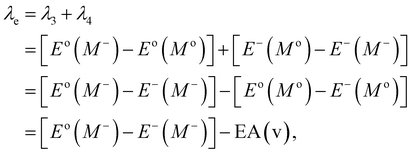
It is generally recognized that the stability of holes and electrons along with the energy barrier of the charge injection process are two important parameters that have significant impacts on the performance of the photovoltaic device. Various studies have been conducted to determine the impact of the highest occupied molecular orbital and lowest unoccupied molecular orbitals (i.e., HOMO and LUMO) energies, and ionization potential and electron affinity (i.e., IP and EA) of the molecule on its charge injection ability. Besides, λ plays a crucial role in determining the energy barrier required for the charge injection process of organic molecules. The IP and EA values of the designed molecules can be calculated by using the following equations:22| | |
IP(v) = E+(Mo) − Eo(Mo),
| (1) |
| | |
IP(a) = E+(M+) − Eo(Mo),
| (2) |
| | |
EA(v) = Eo(Mo) − E−(Mo),
| (3) |
| | |
EA(a) = Eo(Mo) − E−(M−),
| (4) |
where, the energies of molecules in their neutral, anionic, and cationic states are denoted as Eo, E−, and E+, respectively. Likewise, the neutral, anionic, and cationic geometries of the molecules are denoted by Mo, M−, and M+, respectively. Here, v and a stands for vertical and adiabatic respectively.
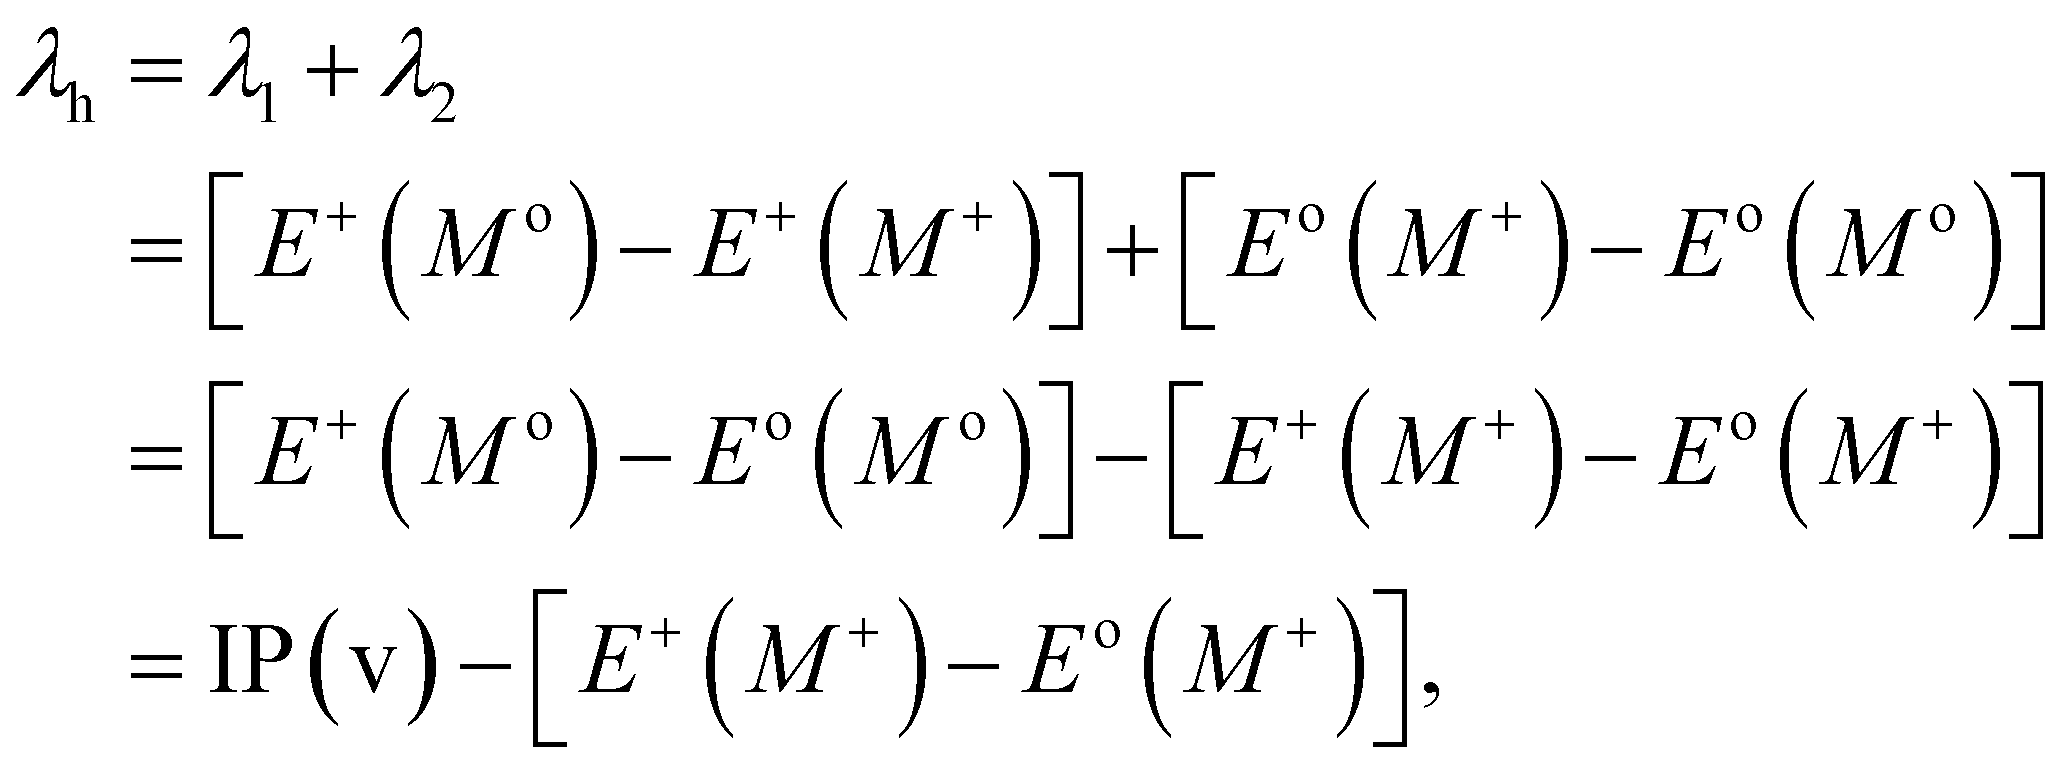
Typically, λ is described as the change in energy that results from the structural reorganization of the molecule to reduce the impact of its excess charge. In general, both the inner and the outer spheres contribute to λ. It is to be noted that the inner sphere portion results from the geometric relaxation process linked to the charge taken or released by the molecule. On the other hand, the outer sphere portion results from the polarization of the surrounding medium or from the relaxation process of the electrons/nuclei. For our work, we have considered only the contribution from the inner sphere. The following equations have been used to determine the λ values for holes and electrons (i.e., λh and λe):22,23
| |
 | (5) |
| |
 | (6) |
In most cases, either the coherent band theory or the incoherent hopping model is used to explain the charge transfer mechanisms. Band theory is mainly applicable for highly ordered systems where the charge carrier is delocalized over the entire system. On the other hand, the hopping model is applicable for the less ordered systems. According to the hopping model, the charge carrier is viewed as confined and hopping between two nearby molecules. Thus, from the practical point of view, we have taken into consideration the hopping mechanism. In this context, the Marcus theory can be used to express the charge transfer rate (kCT) between two nearby molecules. The following expression is used to calculate the kCT values which is associated to λ:22–24
| |
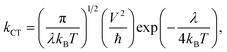 | (7) |
where,
kB,
T,
V, and ℏ represent the Boltzmann constant, the absolute temperature, the electronic coupling matrix element between two molecules and the reduced Planck's constant, respectively.
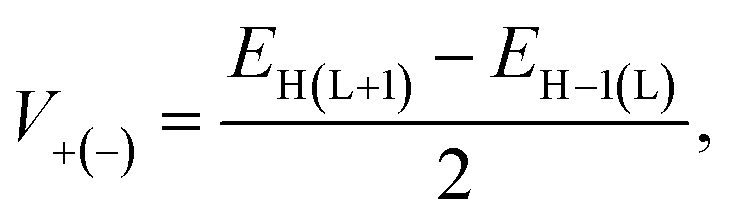
Besides, eqn (8) can be used to determine the parameter V, commonly known as the charge transfer integral, for holes (V+) and electrons (V−) between two nearby molecules.22
| |
 | (8) |
where, the energies of the HOMO, LUMO, HOMO−1 and LUMO+1 of the closed-shell configuration of the molecule's neutral state are represented by
EH,
EL,
EH−1, and
EL+1, respectively. In order to transfer the charge effectively,
V must have a higher value.
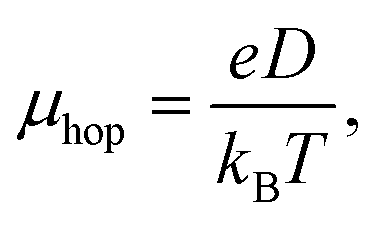
Hopping mobility (μhop) is another important parameter which helps in determining the capability of a molecule towards electron or hole transportation. Using Einstein's equation (eqn (9)), it is possible to calculate the value of μhop from the kCT value.22
| |
 | (9) |
where,
e and
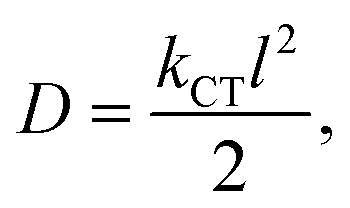
D represent the electronic charge and diffusion coefficient. Besides,
eqn (10) provides a correlation between
D and
kCT in one-dimensional charge transfer mechanism.
| |
 | (10) |
where, the distance between two interacting molecules is represented by the letter
l.
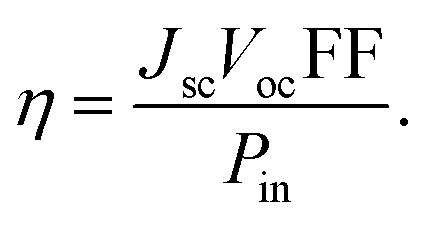
Generally, the power conversion efficiency (η) of a photovoltaic device can be calculated using the following equation:25
| |
 | (11) |
In this equation, the fill factor, open-circuit voltage, short-circuit current density, and input power of incident sunlight are each denoted by the letters FF, Voc, Jsc, and Pin. For solar spectrum, the standard value of Pin is considered as 100 mW cm−2 under AM 1.5G illumination.26
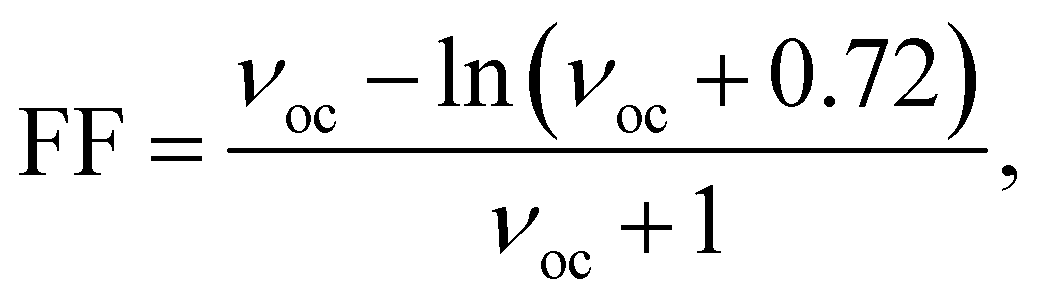
One of the key parameters affecting the η value is the FF, which may be determined as follows:27,28
| |
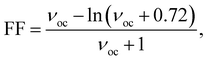 | (12) |
where, the dimensionless voltage is denoted by the letter
νoc and can be calculated using
eqn (13):
27,28| |
 | (13) |
Here, the elementary charge, Boltzmann constant, and absolute temperature are each denoted by the letters
e,
kB, and
T. Further,
eqn (14) is used to calculate the
eVoc value.
29| | |
eVoc = (|EdonorHOMO − EacceptorLUMO|) − 0.3 eV,
| (14) |
where, the HOMO energy of the donor molecule and LUMO energy of the acceptor molecule are each denoted by
EdonorHOMO and
EacceptorLUMO. In
eqn (14), the empirical factor of 0.3 is used to reflect the typical energy loss in bulk heterojunction organic solar cells.
27
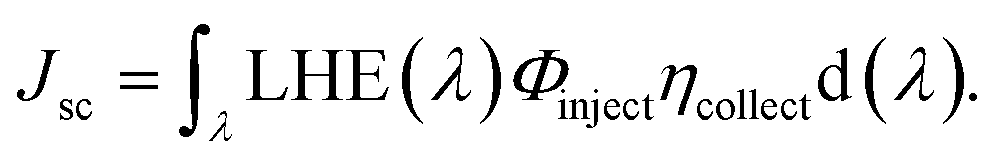
It is noteworthy to mention that the Jsc value of a particular device depends upon its intensity and spectral range of solar absorption. Jsc can be defined as:30,31
| |
 | (15) |
In this equation, LHE(λ) is the light harvesting efficiency, Φinject is the electron injection efficiency, and ηcollect is the charge collection efficiency.32
LHE(λ) can be correlated to the oscillator strength (fosc) as follows:31
| | |
LHE(λ) = 1 − 10−fosc.
| (16) |
4 Results and discussion
4.1 Geometrical and structural properties
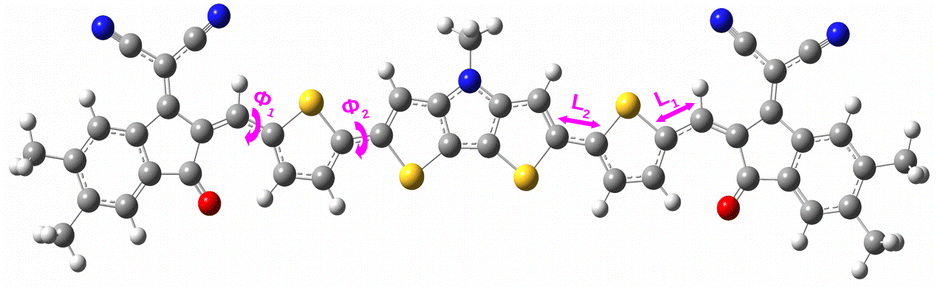
4.1.1 Dihedral angle (ϕ). Dihedral angle is one of the key parameters that regulates the compound's planarity. We have calculated the dihedral angles (ϕ1 and ϕ2) between different parts of the designed compounds by taking into account their ground state geometries in both gas and solvent phases. Fig. 2 shows a representation of the dihedral angle (ϕ1 and ϕ2) in a compound. Besides, the obtained values of ϕ1 and ϕ2 of the designed compounds have been reported in Table 1.
 |
| | Fig. 2 Representation of the dihedral angles and inter-ring bridge bond distances in a compound. | |
Table 1 Dihedral angles between different parts of the studied compounds in both gas and solvent phase
| Compounds |
Phase |
ϕ1 (°) |
ϕ2 (°) |
| C1 |
Gas |
2.08 |
−1.94 |
| Solvent |
5.03 |
−1.74 |
| C2 |
Gas |
0.20 |
−0.30 |
| Solvent |
4.57 |
−0.38 |
| C3 |
Gas |
1.19 |
−1.06 |
| Solvent |
4.90 |
−1.05 |
| C4 |
Gas |
1.72 |
−1.68 |
| Solvent |
4.95 |
−1.63 |
| C5 |
Gas |
2.10 |
−2.14 |
| Solvent |
5.13 |
−2.02 |
From Table 1, the dihedral angle values of all studied compounds are observed to be in the range of 0–6° indicating planar structures of the designed compounds. Moreover, it is evident that the attachment of different A units on both side of the central D unit alters the dihedral angles values. Among all studied compounds, the dihedral angle values are found to be comparatively lower for compound C2 in both phases. This is apparent due to incorporation of the electron withdrawing F-atoms into the A units which minimizes the dihedral angles ϕ1 and ϕ2. On the other hand, compound C5 where the electron donating NH2-group is incorporated into the A units, possesses the comparatively higher values of dihedral angles in both phases.
4.1.2 Inter-ring bridge bond distance (L). Inter-ring bridge bond distance is a prominent parameter that determines the presence of conjugation in a compound. For all studied compounds, we have evaluated the inter-ring bridge bond distance (i.e., L1 and L2 values) and reported the obtained values in Table 2. We have also provided the representation of the inter-ring bridge bond distance in a compound in Fig. 2.
Table 2 Inter-ring bridge bond distance (L) of the studied compounds in both gas and solvent phase
| Compounds |
Phase |
L1 (Å) |
L2 (Å) |
| C1 |
Gas |
1.41882 |
1.43114 |
| Solvent |
1.41587 |
1.42976 |
| C2 |
Gas |
1.41657 |
1.43039 |
| Solvent |
1.41306 |
1.42875 |
| C3 |
Gas |
1.41560 |
1.43005 |
| Solvent |
1.41147 |
1.42810 |
| C4 |
Gas |
1.41439 |
1.42966 |
| Solvent |
1.40988 |
1.42752 |
| C5 |
Gas |
1.42110 |
1.43175 |
| Solvent |
1.41995 |
1.43102 |
It is observed from Table 2 that for all studied compounds, the inter-ring bridge bond distances (i.e., L1 and L2 values) lie within the range 1.40987–1.43176 Å in both phases. This suggests that the obtained values of L1 and L2, are longer than the C![[double bond, length as m-dash]](https://www.rsc.org/images/entities/char_e001.gif) C double bond distance (1.33 Å) and shorter than the C–C single bond distance (1.54 Å) in both phases. Thus, it clearly manifests the presence of conjugation in all studied compounds.
C double bond distance (1.33 Å) and shorter than the C–C single bond distance (1.54 Å) in both phases. Thus, it clearly manifests the presence of conjugation in all studied compounds.
4.1.3 Distortion energy (ΔEdis). Distortion energy (ΔEdis) is an important parameter that affects the planarity of the compound. It is defined as the amount of energy required to transform a compound from a torsional state to its planar state. In this regard, we have adjusted the dihedral angles of the studied compounds to zero to planarize them, and further carried out the single-point energy calculations on the constrained geometries to determine the ΔEdis values. The difference in energy between the planarized and the neutral geometries give the ΔEdis value.33 The calculated values of ΔEdis for the studied compounds have been reported in Table 3. According to this table, the ΔEdis values of all studied compounds exhibit the similar trend in both gas and solvent phases. Moreover, the ΔEdis values are observed to be comparatively lower for almost all studied compounds except compound C5 in both phases. At this point, compounds C2 and C5 possess the lowest and highest ΔEdis values respectively in both phases. These values also complies with the observed ϕ values reported in Table 1.
Table 3 Distortion energy (ΔEdis) values of the studied compounds
| Compounds |
Phase |
ΔEdis (kcal mol−1) |
| C1 |
Gas |
0.0067 |
| Solvent |
0.0452 |
| C2 |
Gas |
0.0003 |
| Solvent |
0.0048 |
| C3 |
Gas |
0.0091 |
| Solvent |
0.0455 |
| C4 |
Gas |
0.0020 |
| Solvent |
0.0577 |
| C5 |
Gas |
0.0169 |
| Solvent |
0.0592 |
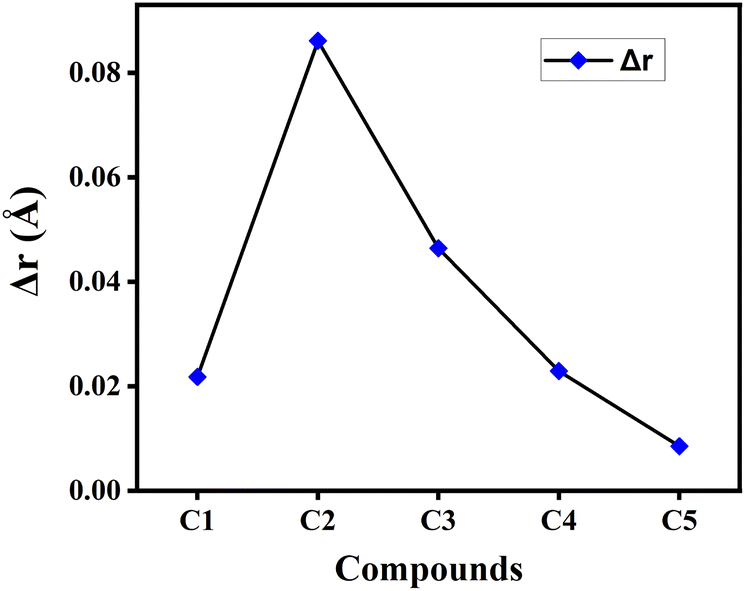
4.1.4 Bond length alteration (BLA) parameter (Δr). Δr is another essential geometric parameter that contributes to initiate the correlation between the geometric structure and electronic properties of a particular compound. The HOMO–LUMO gap, photon absorption characteristics, transport properties, linear–nonlinear polarizabilities, etc. of the compound are all connected to the Δr value. It can be described as the difference between the CC double bonds and C–C single bonds present in a π-conjugated system. Besides, the lower value of Δr reflects greater extent of conjugation in the compound.22 The calculated Δr values of the studied compounds in gas phase have been plotted graphically in Fig. 3. From this figure it has been observed that compound C5 possesses the lowest Δr value, while compound C2 has the highest Δr value among all studied compounds. This clearly illustrates the presence of comparatively greater extent of conjugation in compound C5 and smaller extent of conjugation in compound C2. It is also observed that the Δr value got increased by incorporating electron-withdrawing F-atoms into the A units (compound C2), while it decreases upon incorporation of the electron-donating NH2-groups into the A units (compound C5).
 |
| | Fig. 3 Plot of Δr values of the studied compounds in gas phase. | |
4.2 Electronic properties
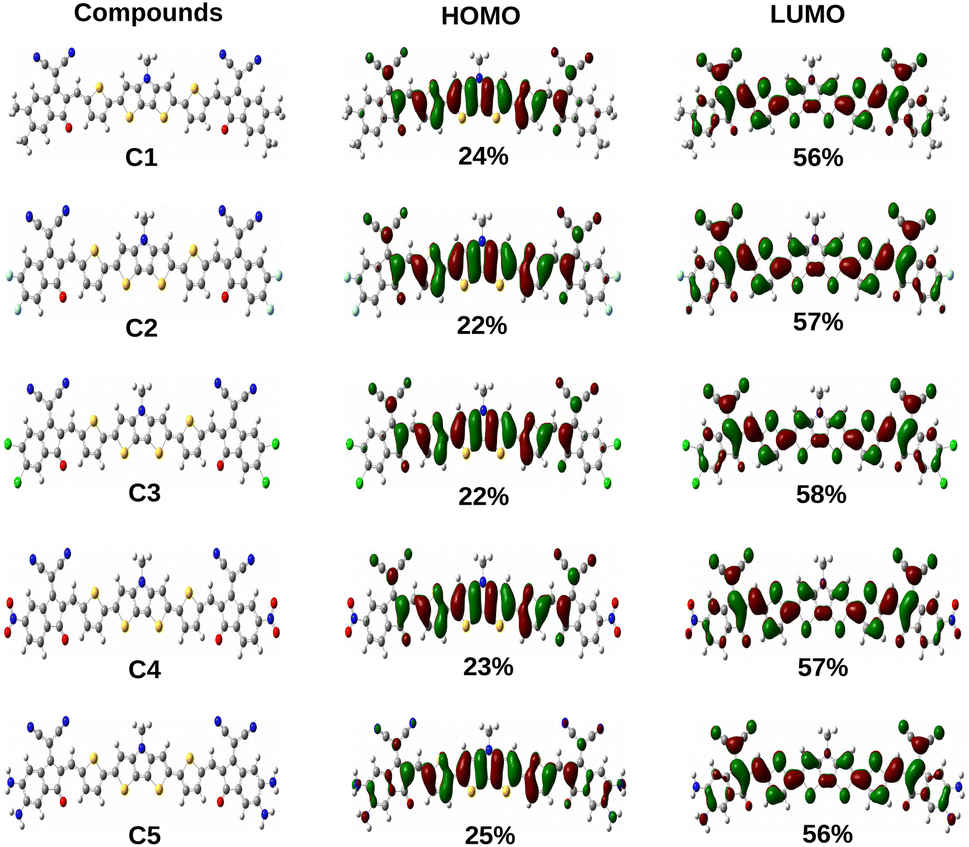
4.2.1 Frontier molecular orbital (FMO) analysis. FMO (represented as the HOMO and LUMO) analysis is very crucial to gather information about the electronic properties, carrier transport properties and optical absorption of OSCs. Based on ground state calculations, we have reported the energy values of HOMO, LUMO, and ΔH−L of each of the studied compounds in Table 4 for both gas and solvent phases.
Table 4 Energies of HOMO, LUMO and ΔH−L values of the studied compounds in both gas and solvent phases
| Compounds |
Phase |
HOMO (eV) |
LUMO (eV) |
ΔH−L (eV) |
| C1 |
Gas |
−5.255 |
−3.635 |
1.620 |
| Solvent |
−5.173 |
−3.638 |
1.535 |
| C2 |
Gas |
−5.501 |
−3.925 |
1.576 |
| Solvent |
−5.284 |
−3.795 |
1.489 |
| C3 |
Gas |
−5.559 |
−4.006 |
1.553 |
| Solvent |
−5.328 |
−3.871 |
1.457 |
| C4 |
Gas |
−5.687 |
−4.145 |
1.542 |
| Solvent |
−5.389 |
−3.945 |
1.444 |
| C5 |
Gas |
−5.028 |
−3.391 |
1.637 |
| Solvent |
−4.993 |
−3.433 |
1.560 |
It has been observed from Table 4 that all the studied compounds exhibit excellent ΔH−L values to serve as OSCs.22 In both phases, the ΔH−L values are observed to be the lowest and highest for compounds C4 and C5 respectively. The observed lowest ΔH−L value for compound C4 arises due to the highest destabilization of the HOMO energy level. On the other hand, the highest value of ΔH−L in compound C5 arises due to the highest destabilization of the LUMO energy level.
Additionally, the ΔH−L values of the studied compounds are also observed to be dependent on the groups attached to the A units. It has been noted that the ΔH−L values increase when EDGs are attached to the A units (as in compounds C1 and C5). On the other hand, when the EWGs are attached to the A units (as in compounds C2, C3 and C4), the ΔH−L values get decreased in both phases. These findings can be attributed to the fact that appropriate attachment of the EDGs and EWGs at the A units result into a remarkable change in the electron density of the molecular backbone. This observation can be supported by the plot of FMOs of the studied compounds C1–C5 presented in Fig. 4.
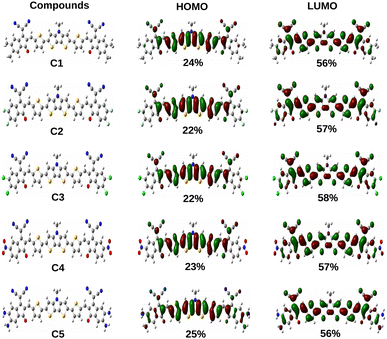 |
| | Fig. 4 Plot of FMOs of the studied compounds C1–C5 along with the contribution of the A units. | |
From Fig. 4 it has been observed that attachment of the EDGs at the A units of compounds C1 and C5 increase the electron density at the HOMO. Conversely, the electron density of LUMO gets increased on attachment of the EWGs at the A units of compounds C2, C3, and C4.
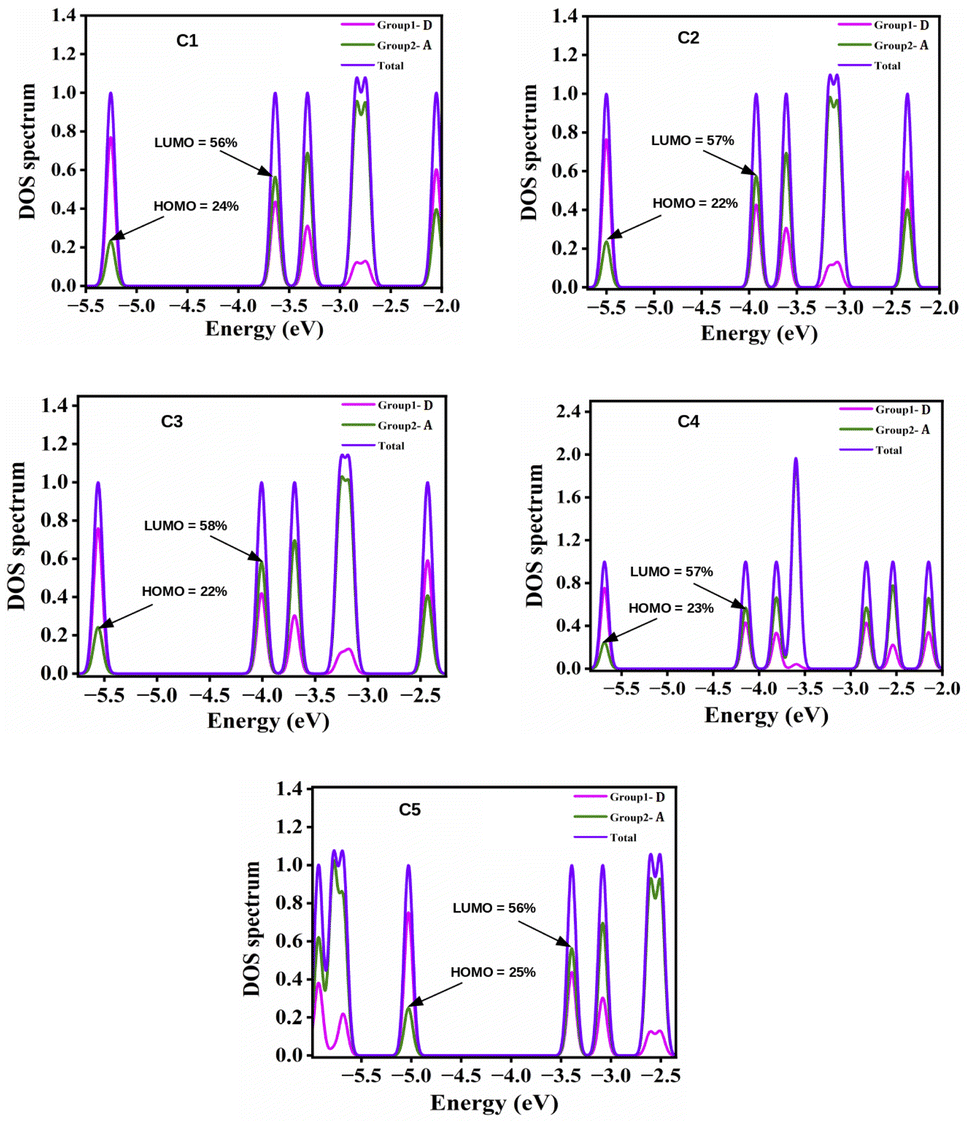
4.2.2 Density of states (DOS) calculations. DOS can be defined as the number of possible states that electrons can occupy at a given energy level. With the help of DOS, we can accumulate knowledge about the electron density across the molecule. The partial DOS (PDOS) denotes the relative contribution of a specific orbital or atom to the total DOS. The spectra related to PDOS can provide a comprehensive understanding towards the nature of the HOMO and LUMO energy levels. To correlate the electronic structures with the FMOs, we have plotted the PDOS of the studied compounds, C1–C5 along with the HOMO–LUMO contributions of the A units in Fig. 5. From this figure it is apparent that the variation in the A units of the studied compounds result into a significant change in contribution towards the HOMO and LUMO energy levels of these compounds while keeping the central D unit constant. In all compounds, the A units offer maximum contribution to the LUMOs and the central D unit offers maximum contribution to the HOMOs.
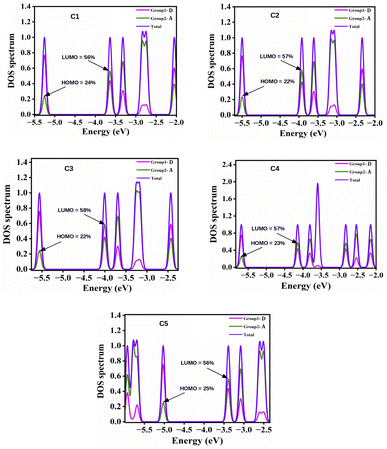 |
| | Fig. 5 Plot of PDOS of the studied compounds (C1–C5) along with the HOMO–LUMO contributions of the A units. | |
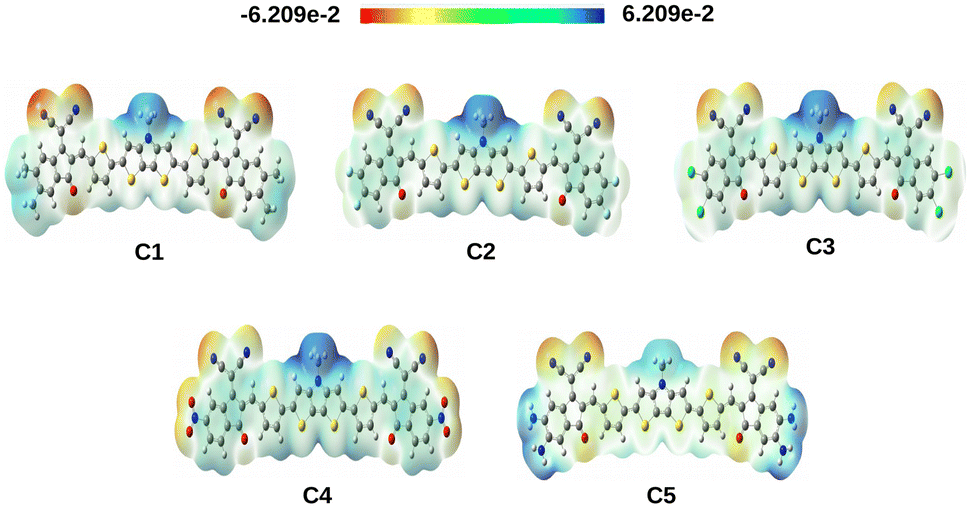
4.2.3 Molecular electrostatic potential surface (MEPS) of the compounds. The MEPS analysis typically presents the charge distribution of molecules in three dimensions. Using the MEPS analysis, we can visualize the variably charged regions of a molecule. It can also be used to create a map showing the electron rich and deficient areas.34 To achieve a qualitative understanding of the charge transfer process, we have computed the MEPS contour plots of the studied compounds and presented the same in Fig. 6.
 |
| | Fig. 6 MEPS contour plots of the studied compounds. These plots have been extracted from the total self-consistent field (SCF) density [isovalue = 0.0004 a.u.; mapped with electrostatic potential surface]. | |
The positive potential decreases in the following color trend: blue > green > yellow > orange > red. At this point, the blue color represents the electron deficient region whereas, the red color represents the electron rich region. From Fig. 6, it is observed that the studied compounds have noticeable charge distribution. It has been observed that when the EWGs i.e., –F, –Cl and –NO2 are attached to the A units of compounds C2, C3 and C4 respectively, the electrons are pulled by these groups making the center of the compounds more positive (blue in color). On the other hand, due to attachment of the EDGs i.e., –CH3 and –NH2 in compounds C1 and C5, respectively, a significant positive charge is spread over the A units.
4.2.4 Effect of solvent on dipole moment (μ). For all compounds, we have calculated the μ values in both gas and solvent phase and reported the same in Table 5. From this table, the μ values are observed to be comparatively higher in the solvent phase than the gas phase. Moreover, the excited state dipole moment (μe) values of the studied compounds are found to be lower than those of their corresponding ground states dipole moment (μg) values. This observed fact indicates that the compounds are more polar in their ground states and are stabilized by the polar environment.
Table 5 Calculated dipole moment (μ) values of the studied compounds
| Compounds |
Phase |
μg (D) |
μe (D) |
| C1 |
Gas |
8.433 |
8.417 |
| Solvent |
10.576 |
10.559 |
| C2 |
Gas |
5.290 |
5.288 |
| Solvent |
6.682 |
6.676 |
| C3 |
Gas |
4.820 |
4.817 |
| Solvent |
6.006 |
5.988 |
| C4 |
Gas |
6.762 |
6.737 |
| Solvent |
8.721 |
8.687 |
| C5 |
Gas |
10.656 |
10.658 |
| Solvent |
14.252 |
14.257 |
4.2.5 Ionization potential (IP) and electron affinity (EA). Both IP and EA have wider significance for evaluation of the charge carrier transfer properties in a molecule. During the electron/hole injection process, the energy barrier is often determined using IP and EA, which describe the ability to lose and gain electrons, respectively. Generally, donor materials (i.e., hole transporting materials) often have lower values of IP and EA.35 The calculated values of IP(v), IP(a), EA(v) and EA(a) of the studied compounds in both phases have been reported in Table 6. From this table it has been observed that the IP and EA values of the studied compounds get increased on attachment of the EWGs at the A units (as in compounds C2, C3 and C4). On the other hand, the EDGs attached to the A units show the opposite trend. Specifically, attachment of the EDGs at the A units lead to the lowest EA in both phases. In contrast, attachment of the EWGs at the A units lead to the highest EA in both phases. As donor molecules are known to have lower EA values, this suggests that the attachment of more electro positive functional groups transform the molecule into a better donor.
Table 6 Calculated values of IP(v), IP(a), EA(v) and EA(a) of the studied compounds in both phases
| Compounds |
Phase |
IP(v) (eV) |
IP(a) (eV) |
EA(v) (eV) |
EA(a) (eV) |
| C1 |
Gas |
6.298 |
5.297 |
2.674 |
2.762 |
| Solvent |
5.402 |
5.325 |
3.426 |
3.503 |
| C2 |
Gas |
6.552 |
6.469 |
2.950 |
3.035 |
| Solvent |
5.511 |
5.435 |
3.582 |
3.654 |
| C3 |
Gas |
6.589 |
6.508 |
3.056 |
3.135 |
| Solvent |
5.551 |
5.475 |
3.665 |
3.732 |
| C4 |
Gas |
6.724 |
6.644 |
3.186 |
3.267 |
| Solvent |
5.611 |
5.536 |
3.739 |
3.806 |
| C5 |
Gas |
6.041 |
5.949 |
2.436 |
2.546 |
| Solvent |
5.216 |
5.138 |
3.221 |
3.313 |
4.2.6 Intermolecular charge transport properties of the donors. Reorganization energy (λ) is considered as a unique parameter in quantum chemistry which can be used to examine the effectiveness of a solar cell by calculating the rate at which charge carriers (holes/electrons) move between molecules. We have evaluated the values of λ+ and λ− by using eqn (5) and (6). The calculated values of λ+ and λ− for the studied compounds have been reported in Table 7. From this table it is evident that for all studied compounds, the λ+ values are smaller than the λ− values. This in turn indicates that the hole transfer process requires less energy than the electron transfer process. Thus, it is confirmed that the studied compounds have the ability to donate electrons.
Table 7 Calculated λ+, λ−, V+, k+CT and μ+hop values of the studied compounds
| Compounds |
λ+ (eV) |
λ− (eV) |
V+ (eV) |
k+CT × 1014 (s−1) |
l (Å) |
μ+hop (cm2 V−1 s−1) |
| C1 |
0.1635 |
0.1857 |
0.154 |
2.020 |
3.45 |
4.463 |
| C2 |
0.1667 |
0.1789 |
0.150 |
1.471 |
3.43 |
3.347 |
| C3 |
0.1631 |
0.1682 |
0.038 |
0.126 |
3.34 |
0.272 |
| C4 |
0.1615 |
0.1691 |
0.161 |
2.120 |
3.38 |
4.684 |
| C5 |
0.1846 |
0.2246 |
0.031 |
0.082 |
3.48 |
0.192 |
In order to compute the values of V for holes (i.e., V+), we have examined the π-stacking orientation of the studied compounds. In this regard, we have provided the optimized structures of the compounds in the π-stacked orientation in Fig. S1 (in the ESI†). Moreover, the calculated values of V+ of the studied compounds have been reported in Table 7. We have further estimated the values of kCT for holes (i.e., k+CT) using the V+ values (applying eqn (7)), and the results are reported in Table 7. From this table it has been observed that among all studied compounds, compounds C4 and C5 possess the highest and lowest values of k+CT respectively. At this point, the highest k+CT value of compound C4 arises due to the observed lowest and highest values of λ+ and V+, respectively. Conversely, in case of compound C5, the lowest k+CT value arises due to the observed highest and lowest values of λ+ and V+, respectively.
Furthermore, we have computed the μhop values for holes (i.e., μ+hop) and reported the same in Table 7. In this regard, we have provided the representative structure showing the spacing (l) between two donor molecules in a π-stacked orientation in Fig. S2 (in the ESI†). It is to be noted that the increase in the μ+hop value mainly corresponds to the increased charge carrier mobility.22 From Table 7, it has been observed that among all studied compounds, compound C4 possesses the highest value of μ+hop which arises owing to its observed highest k+CT value. Conversely, in case of compound C5, the observed lowest μ+hop value arises owing to its lowest k+CT value. Therefore, Table 7 summarizes that compound C4 may serve as an excellent candidate for OSCs.
4.3 Spectral absorption properties of the donors
We have investigated the vertical excitation properties of 30 excited states of the designed donor molecules using the TD-DFT method at the B3PW91/6-31G(d) level of theory to explore their optical properties. Table 8 lists the calculated values of maximum wavelength (λmax), oscillator strength (fosc), excitation energy (Eg), and TD-DFT configurations for different electronic transitions of the studied donor compounds in gas phase.
Table 8 Absorption properties of the studied donor compounds in gas phase
| Compounds |
Transitions |
λmax (nm) |
fosc |
Eg (eV) |
Configuration |
| C1 |
S0 → S1 |
681.03 |
2.882 |
1.820 |
H → L |
| S0 → S3 |
499.40 |
0.268 |
2.483 |
H → L+2 |
| S0 → S7 |
433.12 |
0.199 |
2.863 |
H−1 → L+1 |
| C2 |
S0 → S1 |
691.21 |
2.780 |
1.794 |
H → L |
| S0 → S3 |
513.36 |
0.270 |
2.415 |
H → L+2 |
| S0 → S7 |
440.99 |
0.168 |
2.811 |
H−1 → L+1 |
| C3 |
S0 → S1 |
702.15 |
2.925 |
1.766 |
H → L |
| S0 → S3 |
521.39 |
0.275 |
2.378 |
H → L+2 |
| S0 → S7 |
445.85 |
0.171 |
2.781 |
H−1 → L+1 |
| C4 |
S0 → S1 |
702.16 |
2.968 |
1.765 |
H → L |
| S0 → S7 |
447.07 |
0.226 |
2.773 |
H−1 → L+1 |
| S0 → S8 |
426.11 |
0.139 |
2.910 |
H−2 → L+1 |
| C5 |
S0 → S1 |
680.57 |
2.971 |
1.822 |
H → L |
| S0 → S4 |
504.88 |
0.286 |
2.456 |
H → L+2 |
| S0 → S8 |
449.48 |
0.200 |
2.758 |
H−1 → L+1 |
From Table 8 it has been observed that the nature of the attached substituents have significantly affected the absorption spectra of the donor compounds. The results manifest that the EDGs attached to the A units lead to blue-shift of the absorption spectra of compounds C1 and C5. On the other hand, the EWGs attached to the A units lead to red-shift of the absorption spectra of compounds C2, C3 and C4. Among all studied compounds, compounds C3 and C4 exhibit comparatively higher λmax values, i.e. 702.15 nm and 702.16 nm respectively. This fact arises due to their small ΔH−L values (i.e., 1.553 eV and 1.542 eV respectively). On the other hand, compound C5 exhibit lower λmax value (680.57 nm) which arises due to its high ΔH−L value. Thus, donor compounds undergoing red-shifted absorption are preferable candidates for fabrication of OSCs. Fig. 7 depicts the plot of absorption spectra of the studied donor compounds in gas phase.
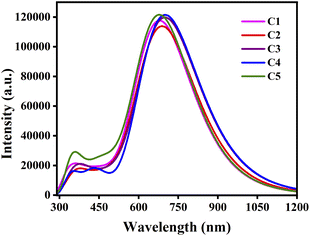 |
| | Fig. 7 Plot of the absorption spectra of the studied compounds in gas phase. | |
4.4 Solvent effect on spectral absorption properties of donors
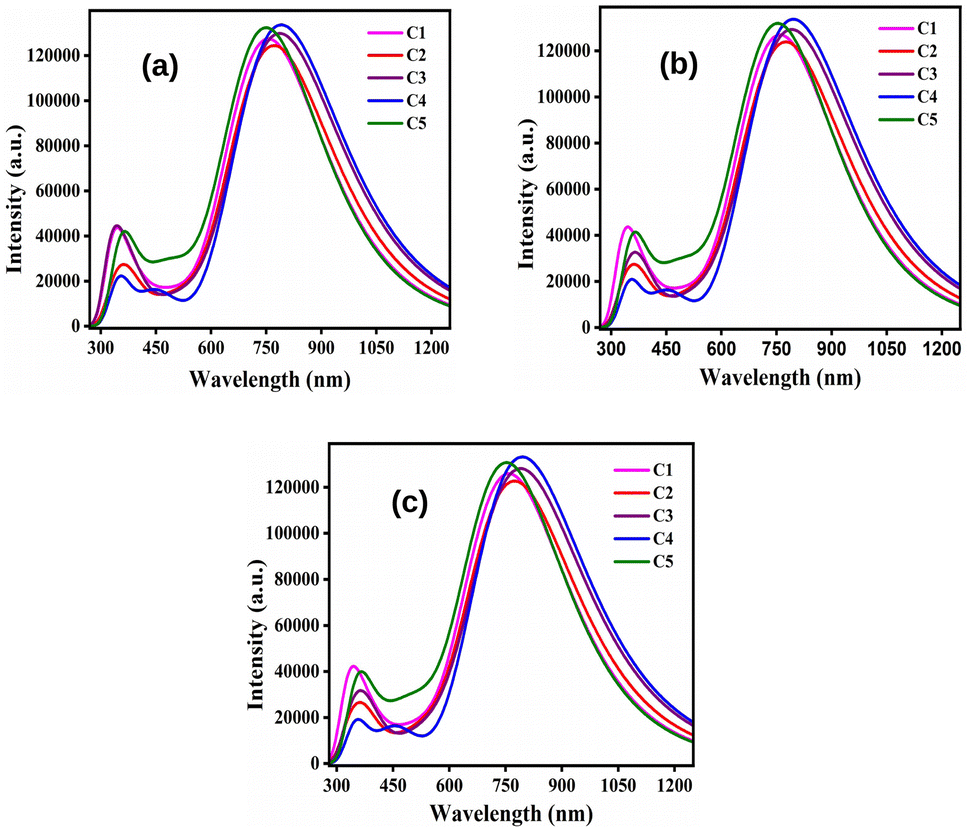
To analyze the effect of solvents on the absorption properties of the studied donor compounds, we have considered three different solvents, viz., chloroform (non-polar solvents), dichloro methane (DCM, a polar aprotic solvent) and ethanol (polar protic solvent) with diverse polarity. The calculated values of λmax, fosc, Eg, and TD-DFT configurations for different electronic transitions of the studied donor compounds have been reported in Table 9.
Table 9 Absorption properties of the studied donor compounds in different solvents
| Compounds |
Phase |
Transitions |
λmax (nm) |
fosc |
Eg (eV) |
Configuration |
| C1 |
Chloroform |
S0 → S1 |
757.67 |
3.131 |
1.636 |
H → L |
| DCM |
S0 → S1 |
761.46 |
3.117 |
1.628 |
H → L |
| Ethanol |
S0 → S1 |
760.57 |
3.089 |
1.630 |
H → L |
| C2 |
Chloroform |
S0 → S1 |
773.56 |
3.051 |
1.603 |
H → L |
| DCM |
S0 → S1 |
777.60 |
3.033 |
1.594 |
H → L |
| Ethanol |
S0 → S1 |
776.51 |
2.999 |
1.597 |
H → L |
| C3 |
Chloroform |
S0 → S1 |
789.05 |
3.182 |
1.571 |
H → L |
| DCM |
S0 → S1 |
793.80 |
3.164 |
1.562 |
H → L |
| Ethanol |
S0 → S1 |
793.17 |
3.130 |
1.563 |
H → L |
| C4 |
Chloroform |
S0 → S1 |
792.88 |
3.273 |
1.564 |
H → L |
| DCM |
S0 → S1 |
797.56 |
3.270 |
1.554 |
H → L |
| Ethanol |
S0 → S1 |
796.52 |
3.253 |
1.557 |
H → L |
| C5 |
Chloroform |
S0 → S1 |
752.52 |
3.243 |
1.647 |
H → L |
| DCM |
S0 → S1 |
756.16 |
3.227 |
1.640 |
H → L |
| Ethanol |
S0 → S1 |
755.51 |
3.193 |
1.641 |
H → L |
By comparing Table 9 with 8, it has been observed that the λmax values of all studied compounds are higher in the solvent phase as compared to those in the gas phase. Moreover, all compounds possess higher values of λmax in DCM solvent than their conforming values in chloroform and ethanol. At this point, DCM leads to more red-shifts than chloroform and ethanol. Fig. 8 depicts the plots of absorption spectra of the studied donor compounds in different solvents.
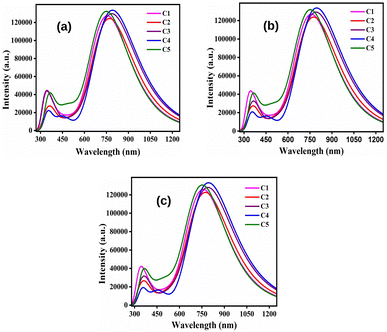 |
| | Fig. 8 Plots of the absorption spectra of the studied donor compounds in solvents: (a) chloroform, (b) DCM and (c) ethanol. | |
4.5 Effect of dimerization on spectral absorption properties
As donors form thin films in OSCs, it is important to study the spectral absorption properties of the dimers and investigate the effect of thin film formation on these properties. To study the spectral absorption properties of the dimers in gas phase, we have calculated their λmax, fosc, Eg, and TD-DFT configurations for different electronic transitions and reported the same in Table 10. From this table it is apparent that the λmax values got increased for the studied compounds upon dimerization. This in turn leads to the fact that red-shift occurs upon dimerization. Besides, the λmax values of almost all dimers follow the similar pattern as that of their monomer counterparts. Fig. 9 depicts the plot of absorption spectra of the studied dimers in gas phase.
Table 10 Absorption properties of the studied dimers
| Dimers |
Transitions |
λmax (nm) |
fosc |
Eg (eV) |
Configuration |
| C1 |
S0 → S1 |
704.34 |
4.144 |
1.760 |
H → L |
| C2 |
S0 → S1 |
717.19 |
6.073 |
1.729 |
H → L |
| C3 |
S0 → S1 |
721.97 |
6.282 |
1.717 |
H → L+1 |
| C4 |
S0 → S1 |
718.74 |
5.414 |
1.725 |
H → L+1 |
| C5 |
S0 → S1 |
806.94 |
5.471 |
1.536 |
H → L |
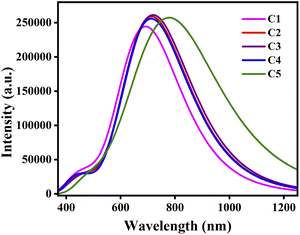 |
| | Fig. 9 Plot of absorption spectra of the studied dimers. | |
5 Properties of D/A active layers
5.1 Exciton binding energy (Eb), energetic driving force (Δ(LUMOD − LUMOA)), and Gibbs free energy change (ΔG)
It is essential to properly adjust the D/A blends which can convert light into electricity in OSCs. Here, we have considered C60–CN as a standard acceptor to study different properties of the D/A blends. In this regard, our C1–C5/C60–CN blends have been placed in a face-to-face orientation by fixing the initial distance between the centers of the donor and acceptor molecules as 3.5 Å to enable significant intermolecular electronic interaction. We have provided the optimized structures of the C1–C5/C60–CN complexes in Fig. S3 (in the ESI†).
In OSCs, photon absorption often leads to the formation of excitons, which are firmly bonded electron–hole pairs in the donor and/or acceptor materials. At this point, the Coulomb attraction that stabilizes the exciton with respect to free electron and hole carriers is known as Eb.36 It can be calculated as: Eb = ΔH−L − E1, where E1 represents the optical band gap or the energy required for the S0 → S1 transition. For organic semiconductors, the Eb value typically lies between 0.2 eV and 1 eV.37 To overcome the Eb values for exciton dissociation, Δ(LUMOD − LUMOA) is generated by the energy offset of the LUMO between the donor and acceptor molecules. For efficient exciton-dissociation at the donor/acceptor (D/A) interface, the Eb value must be small. Moreover, to achieve effective exciton dissociation and prevent energy loss, the Δ(LUMOD − LUMOA) value should lie between 0.3 and 0.8 eV.38
It should be noted that the ground state electron of a donor molecule gets excited to the acceptor when exposed to light of appropriate wavelength. As a result, the simultaneous transfer of excited electrons to the acceptor molecule yields the negative value of ΔG. Besides, at the D/A interface, the electron–hole pair also splits into free charges, which then diffused into the acceptor. At the same time, the electrons and holes get collected at the respective electrodes. To calculate the ΔG value, the following Rehm–Weller equation is used:39
| | |
ΔG = IP(D) − EA(A) − E1 − Eb,
| (17) |
where, IP(D) represents the ionization potential of the donor molecule and EA(A) represents the electron affinity of the acceptor molecule. Here, IP(D) and EA(A) are considered as the negative of HOMO and LUMO energies of the donor and acceptor molecules, respectively. In
eqn (17),
E1 represents the first excitation energy of the studied donor molecule. The calculated values of Δ
H−L,
E1,
Eb and Δ(LUMO
D − LUMO
A) have been reported in
Table 11.
Table 11 Calculated ΔH−L, E1, Eb, Δ(LUMOD − LUMOA) and ΔG values of the studied donor compounds in eV unit
| Parameters |
C1 |
C2 |
C3 |
C4 |
C5 |
| ΔH−L |
1.620 |
1.576 |
1.553 |
1.542 |
1.637 |
| E1 |
1.404 |
1.305 |
1.329 |
1.258 |
1.404 |
| Eb |
0.216 |
0.271 |
0.224 |
0.284 |
0.233 |
| Δ(LUMOD − LUMOA) |
0.585 |
0.295 |
0.214 |
0.075 |
0.729 |
| ΔG |
−2.655 |
−2.857 |
−2.892 |
−3.009 |
−2.445 |
From Table 11 it has been observed that the Eb values of the studied donor compounds lie within the reported range. Moreover, the observed Δ(LUMOD − LUMOA) values are also in accordance with the reported range. In all studied compounds, the obtained ΔG values are also observed to be negative which indicates spontaneous electron transfer from donor to the acceptor molecules.
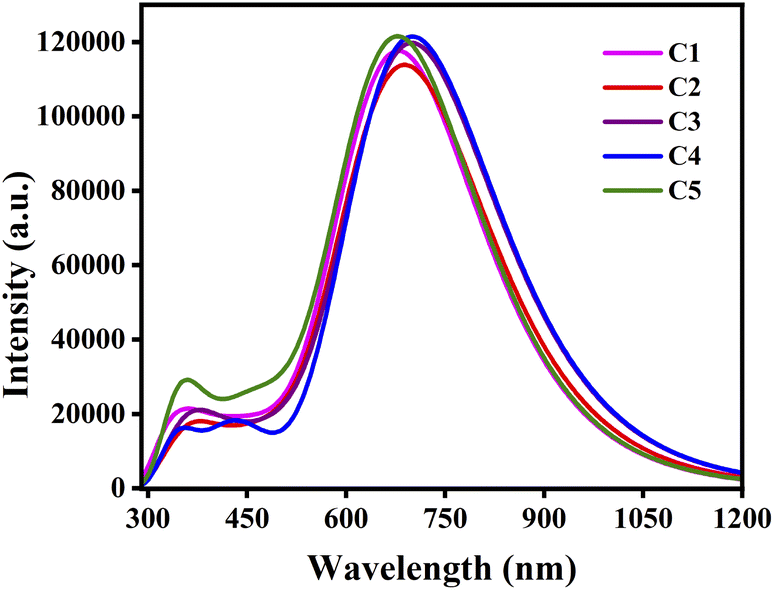
5.2 Absorption properties of the D/A blends
We have evaluated the gas phase absorption properties of the C1–C5/C60–CN complexes at the B3PW91/6-31G(d) level of theory. The respective spectral data of the standard acceptor, C60–CN and C1–C5/C60–CN complexes have been reported in Table 12.
Table 12 Absorption properties of the standard acceptor, C60–CN and C1–C5/C60–CN complexes
| Compounds |
Transitions |
λmax (nm) |
fosc |
Configuration |
| C60–CN |
S0 → S1 |
711.48 |
0.001 |
H → L |
| C1/C60–CN |
S0 → S1 |
756.55 |
3.183 |
H → L |
| C2/C60–CN |
S0 → S1 |
763.61 |
3.043 |
H → L |
| C3/C60–CN |
S0 → S1 |
794.48 |
3.074 |
H → L |
| C4/C60–CN |
S0 → S1 |
798.00 |
3.065 |
H → L |
| C5/C60–CN |
S0 → S1 |
752.41 |
3.120 |
H → L |
In comparison to Table 8, it has been observed that the λmax values of the studied C1–C5/C60–CN complexes undergo red-shift compared to the isolated donor compounds. Additionally, the λmax values of the studied C1–C5/C60–CN complexes exhibit the same pattern as that of the isolated donor compounds. These findings render us to consider that the absorption properties of the D/A active blends are directly influenced by the absorption properties of the donor compounds. Fig. 10 depicts the plot of absorption spectra of the studied C1–C5/C60–CN complexes.
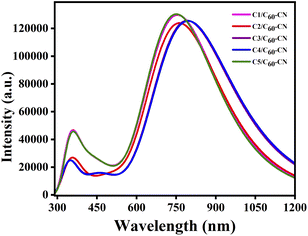 |
| | Fig. 10 Plot of absorption spectra of the studied C1–C5/C60–CN complexes. | |
5.3 Photovoltaic performance
To assess the photovoltaic performance of the studied C1–C5/C60–CN complexes, we have calculated their η, FF, νoc, eVoc and Jsc values by employing eqn (11)–(15) respectively. The respective values have been reported in Table 13. From this table it has been observed that complexes C4/C60–CN and C5/C60–CN possess the highest and lowest values of Jsc (i.e., 17.23 mA cm−2 and 14.06 mA cm−2 respectively) among all studied complexes. Besides, the η values are also observed to be the highest for complex C4/C60–CN (18.00%) and lowest for complex C5/C60–CN (5.75%). In addition, to achieve a high PCE, a photovoltaic system requires a high value of FF, which increases as eVoc increases. For our designed compounds, the values of FF and eVoc are observed to be the highest for complex C4/C60–CN (89.54% and 1.167 eV, respectively) and lowest for complex C5/C60–CN (80.56% and 0.508 eV, respectively). Thus, it is evident that complex C4/C60–CN with the highest values of Jsc and η, can be considered as the excellent candidate for fabrication of OSCs.
Table 13 Photovoltaic properties of the studied C1–C5/C60–CN complexes
| Compounds |
Jsc (mA cm−2) |
eVoc (eV) |
νoc |
FF (%) |
η (%) |
| C1/C60–CN |
14.43 |
1.035 |
40.04 |
88.53 |
13.22 |
| C2/C60–CN |
14.82 |
0.981 |
37.95 |
88.05 |
12.80 |
| C3/C60–CN |
16.88 |
1.039 |
40.19 |
88.56 |
15.53 |
| C4/C60–CN |
17.23 |
1.167 |
45.14 |
89.54 |
18.00 |
| C5/C60–CN |
14.06 |
0.508 |
19.64 |
80.56 |
5.75 |
5.4 Conclusion
In this paper, we have explored five newly designed DTP based A–D–A-type small donor molecules which can be used to fabricate OSCs. In this regard, different photovoltaic parameters (viz. η, FF, νoc, eVoc and Jsc) are calculated employing DFT and TD-DFT formalism. We have attached different EDGs and EWGs at the A units to tune the structural and electronic properties of the designed molecules. The observed ΔH−L values suggest that the attachment of –NO2 group at the A units has profound effect. According to the MEPS plots, all studied compounds exhibit excellent charge transport properties. The charge transport analysis of the studied compounds reveal that they have the ability to act as potential donors. The absorption properties manifest that compound C4 possesses the highest value of λmax in both gas and solvent phases. Besides, all compounds have higher λmax values (red-shift) in solvent phase compared to gas phase. Upon dimerization, the studied compounds also exhibit an increase in their λmax values.
Additionally, we have assessed the properties of the D/A blends through proper combination of the studied donor molecules (C1–C5) with a standard acceptor (C60–CN) and monitored the relevant electron injection from donor to acceptor. The properties of the D/A blends reveal that all compounds can facilitate charge carrier separation at the D/A interface. Moreover, the photovoltaic properties suggest that complex C4/C60–CN possesses the highest values of Jsc and η. We may therefore conclude that all the designed compounds have the potential to act as donor materials for OSCs. Besides, attachment of the –NO2 group at the A units becomes advantageous for better tuning of the optoelectronic properties of the designed donor materials. In short, our study opens the door for the researchers to develop new kind of effective donor materials in the context of OSC applications.
Conflicts of interest
There are no conflicts to declare.
Acknowledgements
The authors would like to acknowledge the Department of Science and Technology (SB/FT/CS-077/2013, CRG/2022/001313), India for the financial support. The authors would like to acknowledge the University Grants Commission for UGC-BSR Research start-up-grant (NO.F.30.-122/2015(BSR)), Gauhati University for providing the research facilities and financial support. The authors would also like to acknowledge the contribution of Mr Tanmoy Kalita for drafting the manuscript.
References
- N. S. Babu, Mater. Adv., 2022, 3, 3526–3535 RSC.
- P. Cheng and X. Zhan, Chem. Soc. Rev., 2016, 45, 2544–2582 RSC.
- M. Naeem, S. Jabeen, R. A. Khera, U. Mubashar and J. Iqbal, J. Theor. Comput. Chem., 2019, 18, 1950036 CrossRef CAS.
- M. Adnan and J. K. Lee, Sci. Rep., 2018, 8, 1–10 Search PubMed.
- J. Roncali, P. Leriche and P. Blanchard, Adv. Mater., 2014, 26, 3821–3838 CrossRef CAS PubMed.
- P. Peumans, A. Yakimov and S. R. Forrest, J. Appl. Phys., 2003, 93, 3693–3723 CrossRef CAS.
- J. Yuan, Y. Zhang, L. Zhou, G. Zhang, H.-L. Yip, T.-K. Lau, X. Lu, C. Zhu, H. Peng and P. A. Johnson, et al., J. Lumin., 2019, 3, 1140–1151 CAS.
- Y. Sun, G. C. Welch, W. L. Leong, C. J. Takacs, G. C. Bazan and A. J. Heeger, Nat. Mater., 2012, 11, 44–48 CrossRef CAS PubMed.
- O. K. Kwon, M. A. Uddin, J.-H. Park, S. K. Park, T. L. Nguyen, H. Y. Woo and S. Y. Park, Adv. Mater., 2016, 28, 910–916 CrossRef CAS PubMed.
- X. Xu and S. Zheng, Int. J. Quantum Chem., 2020, 120, e26112 CAS.
- M. Raftani, T. Abram, A. Azaid, R. Kacimi, M. Bennani and M. Bouachrine, Mater. Today: Proc., 2021, 45, 7334–7343 CrossRef CAS.
- Y. Geng, A. Tang, K. Tajima, Q. Zeng and E. Zhou, J. Mater. Chem. A, 2019, 7, 64–96 RSC.
- G. Turkoglu, M. E. Cinar and T. Ozturk, J. Sulfur Chem., 2019, 6, 79–123 Search PubMed.
- Z.-B. Zhang, J.-W. Xu, X.-Y. Zhang, S.-X. Sun and R. Xing, Funct. Mater. Lett., 2017, 10, 1750085 CrossRef CAS.
- X. Yin, Q. An, J. Yu, Z. Xu, P. Deng, Y. Geng, B. Zhou, F. Zhang and W. Tang, Dyes Pigm., 2017, 140, 512–519 CrossRef CAS.
- S. Ahmed and D. J. Kalita, Phys. Chem. Chem. Phys., 2020, 22, 23586–23596 RSC.
- J. Hou, O. Inganäs, R. H. Friend and F. Gao, Nat. Mater., 2018, 17, 119–128 CrossRef CAS PubMed.
- H.-I. Lu, C.-W. Lu, Y.-C. Lee, H.-W. Lin, L.-Y. Lin, F. Lin, J.-H. Chang, C.-I. Wu and K.-T. Wong, Chem. Mater., 2014, 26, 4361–4367 CrossRef CAS.
- M. U. Khan, F. Shafiq, S. S. Al Abbad, J. Yaqoob, R. Hussain, Z. H. Alsunaidi, G. Mustafa and S. Hussain, Molecules, 2023, 28, 3625 CrossRef CAS PubMed.
- J. Beheshtian, A. A. Peyghan and Z. Bagheri, Comput. Theor. Chem., 2012, 992, 164–167 CrossRef CAS.
- Y.-L. Wang, Q.-S. Li and Z.-S. Li, Comput. Mater. Sci., 2019, 156, 252–259 CrossRef CAS.
- H. Sahu and A. N. Panda, Phys. Chem. Chem. Phys., 2014, 16, 8563–8574 RSC.
- L.-L. Fu, H. Geng, G. Wang, Y.-A. Duan, Y. Geng, Q. Peng, R. Zhu, T.-t. Xiao, W. Wang and Y. Liao, Theor. Chem. Acc., 2018, 137, 1–11 Search PubMed.
- P. Cias, C. Slugovc and G. Gescheidt, J. Phys. Chem. A, 2011, 115, 14519–14525 CrossRef CAS PubMed.
- L. L. Estrella, M. P. Balanay and D. H. Kim, J. Phys. Chem. A, 2016, 120, 5917–5927 CrossRef CAS PubMed.
- K. A. Mazzio and C. K. Luscombe, Chem. Soc. Rev., 2015, 44, 78–90 RSC.
- R. Zaier and S. Ayachi, Mater. Today Commun., 2021, 27, 102370 CrossRef CAS.
- H. Moatassim, H. Zaari, A. El Kenz, A. Benyoussef, M. Loulidi and O. Mounkachi, RSC Adv., 2022, 12, 8945–8952 RSC.
- A. Irfan and A. Mahmood, J. Cluster Sci., 2018, 29, 359–365 CrossRef CAS.
- L. Yu and A. Zunger, Phys. Rev. Lett., 2012, 108, 068701 CrossRef PubMed.
- T. Sahdane, A. Laghrabli, H. Bougharraf, R. Benallal, B. Azize and B. Kabouchi, Int. J. Adv. Res. Comput. Commun. Eng., 2016, 1, 283–286 Search PubMed.
- C.-R. Zhang, X.-Y. Li, Y.-L. Shen, Y.-Z. Wu, Z.-J. Liu and H.-S. Chen, J. Phys. Chem. A, 2017, 121, 2655–2664 CrossRef CAS PubMed.
- H. T. Turan, O. Kucur, B. Kahraman, S. Salman and V. Aviyente, Phys. Chem. Chem. Phys., 2018, 20, 3581–3591 RSC.
- S. Lakshminarayanan, V. Jeyasingh, K. Murugesan, N. Selvapalam and G. Dass, J. Photochem. Photobiol., 2021, 6, 100022 CrossRef.
- E. Louis, E. San-Fabián, M. A. Díaz-García, G. Chiappe and J. A. Vergés, J. Phys. Chem. Lett., 2017, 8, 2445–2449 CrossRef CAS PubMed.
- L. Zhu, Y. Yi and Z. Wei, J. Phys. Chem. C, 2018, 122, 22309–22316 CrossRef CAS.
- B. P. Rand, J. Genoe, P. Heremans and J. Poortmans, Prog. Photovoltaics, 2007, 15, 659–676 CAS.
- X. Liu, C. Huang and M. Li, J. Phys. Chem. C, 2016, 120, 27148–27158 CrossRef CAS.
- Y.-L. Wang, Q.-S. Li and Z.-S. Li, Phys. Chem. Chem. Phys., 2017, 19, 23444–23453 RSC.
|
| This journal is © The Royal Society of Chemistry 2023 |
Click here to see how this site uses Cookies. View our privacy policy here. 
 Open Access Article
 This Open Access Article is licensed under a Creative Commons Attribution-Non Commercial 3.0 Unported Licence
 *
*