
 Open Access Article
 This Open Access Article is licensed under a Creative Commons Attribution-Non Commercial 3.0 Unported Licence
Highly sensitive capacitance-based nitrite sensing using polydopamine/AuNPs-modified screen-printed carbon electrode†
Faisal K. Algethami *a,
Amal Rabtibc,
Mohamed Mastourib,
Babiker Y. Abdulkhaira,
Sami Ben Aound and
Noureddine Raouafi*b
*a,
Amal Rabtibc,
Mohamed Mastourib,
Babiker Y. Abdulkhaira,
Sami Ben Aound and
Noureddine Raouafi*b
aDepartment of Chemistry, College of Science, Imam Mohammad Ibn Saud Islamic University (IMSIU), P.O. Box 90950, Riyadh 11623, Saudi Arabia. E-mail: noureddine.raouafi@fst.utm.tn falgethami@imamu.edu.sa
bSensors and Biosensors Group, Analytical Chemistry and Electrochemistry Lab (LR99ES15), Department of Chemistry, Faculty of Science, University of Tunis El Manar, Tunis El Manar, 2092 Tunis, Tunisia
cNational Institute of Research and Physicochemical Analysis (INRAP), Laboratory of Materials, Treatment, and Analysis (LMTA), Biotechpole Sidi Thabet, 2020 Sidi Thabet, Tunisia
dDepartment of Chemistry, Faculty of Science, Taibah University, P.O. Box 30002, Al-Madinah Al-Munawwarah, Saudi Arabia
First published on 17th July 2023
Abstract
Regulatory bodies play a crucial role in establishing limits for food additives to ensure food quality and safety of food products, as excessive usage poses risks to consumers. In the context of processed animal-based foodstuffs, nitrite is commonly utilized as a means to slow down bacterial degradation. In this study, we have successfully leveraged the redox activity of an electrochemically deposited polydopamine (pDA) film onto gold nanoparticle (AuNP)-modified screen-printed electrodes (SPCE) to develop a sensitive and versatile methodology for the detection of nitrite using redox capacitance spectroscopy. By exploiting the interaction of the AuNPs/pDA electroactive interface with the target nitrite ions, we observed distinct changes in the redox distribution, subsequently leading to modifications in the associated redox capacitance. This alteration enables the successful detection of nitrite, exhibiting a linear response within the concentration range of 10 to 500 μM, with a limit of detection of 1.98 μM (S/N = 3). Furthermore, we applied the developed sensor to analyze nitrite levels in processed meats, yielding good recoveries. These results demonstrate the potential of our approach as a promising method for routine detection of ions.
1 Introduction
Nitrite salts, such as potassium nitrite (KNO2, E249) and sodium nitrite (NaNO2, E250), are commonly used as food additives to preserve processed animal-based products, vegetables and other foodstuffs.1,2 Nitrite ions play a critical role in inhibiting the growth of harmful bacteria and preventing spoilage in meat. By acting as an antimicrobial agent, nitrite extends the shelf life of processed meats ensuring their safety for consumption.However, the use of nitrite in food preservation is not without concerns.3,4 One significant issue is the potential formation of nitrosamines when nitrite reacts with naturally occurring amines present in meat. Nitrosamines are known to be carcinogenic and have been linked to an increased risk of cancer.5,6 Therefore, regulatory bodies carefully monitor and impose limits on the allowable levels of nitrite in processed meats aiming to mitigate these risks and protect consumer health. Indeed, the maximum residue levels (MRLs) vary from 50 to 150 mg kg−1, which is ca. 1 to 3 μM in processed meat and cheese.3
Numerous analytical techniques have been developed for the detection of nitrite, including chemiluminescence,7 fluorescence,8,9 nanoplasmonic colorimetry,10 Raman spectroscopy11 and electrochemistry.12–14 Among these methods, electrochemical detection stands out due to its higher sensitivity, lower cost and adaptability to various applications, making it suitable for widespread use. Nevertheless, direct oxidation of nitrite at conventional electrodes poses a challenge due to its high overpotential.15 To overcome this challenge, surface modification of electrode becomes necessary. Various nanomaterials such as noble metals16 or carbonaceous17 nanomaterials, organic conducting polymers14 and 2D MXenes18 are commonly used to functionalize the electrode surface. While techniques like cyclic voltammetry (CV), differential pulse voltammetry (DPV) and square wave voltammetry (SWV), or amperometry and electrochemical impedance spectroscopy (EIS) are commonly used in the sensor design, electrochemical capacitance spectroscopy (ECS) or impedance-derived capacitance approach is considered as an interesting alternative. ECS offers improved signal sensitivity and lower detection limits in chemical19,20 and biochemical21–23 sensing applications. In ECS, the measured signal, known as redox capacitance, is a feature of electroactive nanoscale films relies solely on changes in the electrostatic environment of electroactive groups. For effective capacitance assays, nanoscale redox-active structures need to be tethered onto electrode surfaces.21 To achieve this, various ferrocene composites and derivatives such as self-assembled 11-ferrocenylundecanethiol,24 ferrocene-modified silicon nanoparticles,20 ferrocene-tagged peptides,21,25 tetraethylene glycol ferrocene derivative26 and aptamer-modified magnetic beads bearing ferrocene23 have been employed. Furthermore, MoS2 nanosheets,27 Prussian Blue nanostructured films28 and electrochemically deposited polycatechol22 have served successfully as redox capacitance transducers. Among these options, conductive polydopamine films exhibit interesting properties, including their favourable adhesion, the presence of electroactive sites able to attach biomolecules and rapid electron transfer rates. These qualities enable a rapid interface with various electrochemical signals, making conductive polydopamine films suitable for designing unique diagnostic tools.29
In this study, we introduced a novel approach for the detection of nitrite ions in processed meat samples. The methodology involved the electrochemical deposition of a conductive polydopamine (pDA) film onto a screen-printed carbon electrode that was previously modified with gold nanoparticles. The use of gold nanoparticles was justified by their advantageous properties, including a large surface area, high electrical conductivity and excellent catalytic activities.30 The redox activity of pDA and its known interaction with nitrite31,32 made it a suitable candidate for transducing the nitrite ions detection event. Notably, while the combination of AuNPs and pDA for sensing purposes has been described previously,33,34 the focus has mainly been on exploiting the direct electrochemistry of the analyte or utilizing external labels to transduce the sensing event. In contrast, our study demonstrated the application of the redox activity of the pDA film itself for label-free detection of nitrite ions.
To evaluate the levels of nitrite, we measured the variation in pDA redox capacitance using electrochemical impedance spectroscopy (EIS)-derived electrochemical capacitance spectroscopy. The developed sensor exhibited good sensitivity and selectivity for nitrite determination, showcasing its potential as a reliable detection method. Importantly, the sensor successfully detected nitrite in processed meat samples, demonstrating its applicability in real-world scenarios. The innovative combination of a conductive polydopamine film, gold nanoparticles and EIS-based capacitance measurements offers a promising approach for the sensitive and selective detection of nitrite, particularly in processed meat products.
The findings of this study make notable contributions to the field of food safety analysis and hold potential implications for quality control in the food industry. The sensor principle is depicted in Scheme 1.
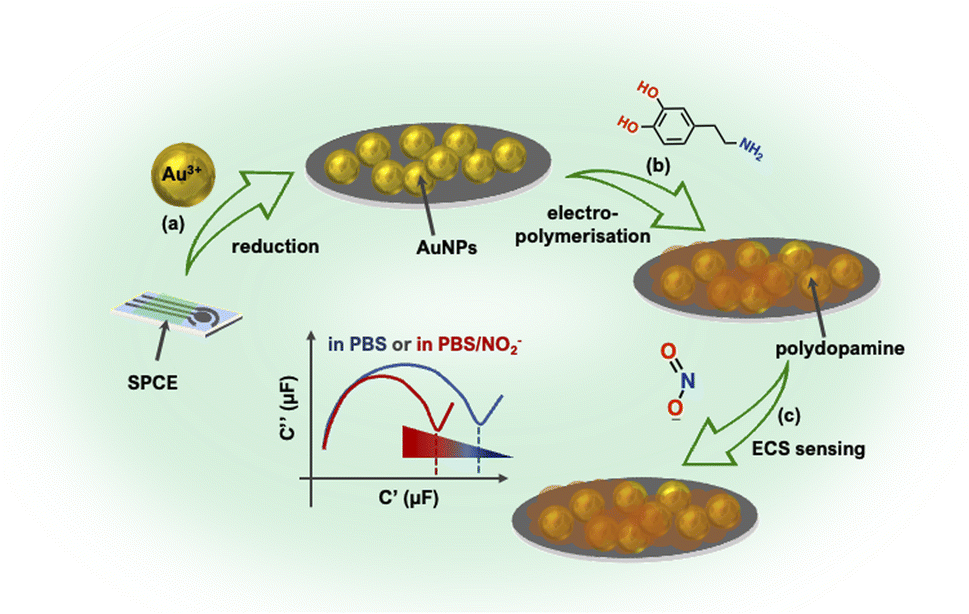 | ||
| Scheme 1 Principle of the preparation and work of pDA/AuNPs/SPCE sensor for ECS sensing of nitrite. | ||
2 Materials and methods
2.1 Chemicals
Tetrachloroauric acid trihydrate (HAuCl4·3H2O, 99.9%), dopamine hydrochloride (98%), NaNO2 (97%), H2SO4 (95%), HCl (37%), NaCl (99%), KCl (99%), NaH2PO4 (99%), K2HPO4 (99%), K4Fe(CN)6·3H2O (99%) and K3Fe(CN)6 (99%) were purchased from Sigma-Aldrich (Germany) and used as received. Phosphate-buffered saline solutions (PBS, 10 mM) were prepared by dissolving NaCl, KCl, Na2HPO4 and KH2PO4 in deionized water (>18.2 MΩ cm).All stock solutions were prepared by dissolving the desired amount of the chemical in PBS 10 mM solution unless otherwise specified.
2.2. Apparatus and electrodes
A Metrohm PGSTAT M204 potentiostat fitted with a FRA32 frequency response analyser for impedance, controlled by Nova® software (v2.1.6), was used to record all electrochemical measurements. Screen-printed carbon electrodes (SPCE, OHT-000), where carbon material is used to make the working (4 mm diameter) and counter electrodes and the pseudo-reference electrode is a silver-based electrode, were purchased from Orion Hi-Tech S.L. (Madrid, Spain).2.3. Sensor preparation
To examine the preparation protocol reproducibility, five different electrodes were prepared, and their electrochemical behaviours were compared.
2.4. Electrochemical measurements
CV and EIS were used to follow the stepwise modification of the SPCE surface. The EIS diagrams were recorded in a PBS solution containing 5 mM concentrations of K3Fe(CN)6/K4Fe(CN)6 (1![[thin space (1/6-em)]](https://www.rsc.org/images/entities/char_2009.gif) :1) as a redox probe. The frequency was swept from 0.01 Hz to 10 kHz by applying a constant potential of 0.180 V vs. Ag/AgCl and with an amplitude modulation of 0.20 V. Randles' equivalent circuit [Rs(C[RctW])]; where, Rs: the solution resistance; C: the capacitance; Rct: the charge-transfer resistance and W: the Warburg impedance; was used to fit the Nyquist plots.
:1) as a redox probe. The frequency was swept from 0.01 Hz to 10 kHz by applying a constant potential of 0.180 V vs. Ag/AgCl and with an amplitude modulation of 0.20 V. Randles' equivalent circuit [Rs(C[RctW])]; where, Rs: the solution resistance; C: the capacitance; Rct: the charge-transfer resistance and W: the Warburg impedance; was used to fit the Nyquist plots.
For the detection of nitrite, EIS measurements were carried out, in triplicate, in PBS 10 mM solution with a frequency ranging from 100 kHz to 0.1 Hz at an applied potential of 0.14 V (half-wave potential of pDA film) vs. Ag/AgCl and with an amplitude modulation of 0.20 V. The raw complex EIS data represented by Z*(ω) were converted to complex capacitance data C*(ω) using the eqn (1) and (2):
| C′ = −Z′′/ω|Z|2 | (1) |
| C′′ = Z′/ω|Z|2 | (2) |
 | (3) |
The reproducibility of the sensor was assessed by registering the % RR value of five electrodes prepared separately in presence of 1 mM NaNO2.
2.5. Nitrite extraction from processed meat samples
10 g of processed meat (salami and ham purchased from a local market) were blended using a kitchen blender for 30 seconds, then 30 mL of deionized water were added. The mixture was ultrasonicated for 30 minutes at 30 °C and left to settle down for 10 minutes before being filtered using a 0.45 μm membrane. Then, the filtrate was heated at 70 °C for 45 minutes. Afterwards, the filtrated sample were diluted 10 times with a PBS solution before being doped with different concentrations (10, 25 and 50 μM) of nitrite solution.3. Results and discussion
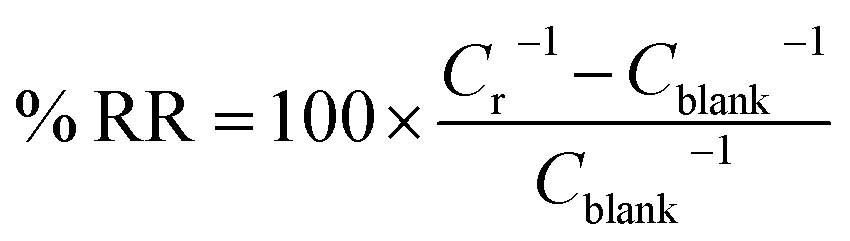
3.1. Electrochemical behaviour of the pDA/AuNPs/SPCE
 | ||
| Fig. 1 (A) Electrochemical deposition and characteristics of the polydopamine film. I–t curve of first 100 s of the pulse deposition (30 pulse cycles) of 1 mg mL−1 of dopamine in 10 mM PBS (pH 7.0) at AuNPs/SPCE. (B) CV of SPCE (a), AuNPs/SPCE (b) and pDA/AuNPs/SPCE (c) in 0.01 M PBS (pH 7.0) at 100 mV s−1. (C) CVs of pDA/AuNPs/SPCE in 0.01 M PBS (pH 7.0) at different scan rates (from inner to outer: 10–200 mV s−1); (D) plots of anodic and cathodic peak currents vs. scan rate of pDA/AuNPs/SPCE in 0.01 M PBS (pH 7.0). (E) Plots of peak potentials vs. logarithm of the scan rate for the pDA/AuNPs/SPCE in 0.01 M PBS (pH 7.0). (F) CVs of PDA/AuNPs/SPCE in 0.01 M PBS at different pH (inset: plot of the formal potential vs. pH value). | ||
To investigate the characteristics of the modified electrode surface, cyclic voltammetry measurements were performed on SPCE, AuNPs/SPCE and pDA/AuNPs/SPCE in the potential range of −0.2 to 0.4 V in 0.01 M PBS (pH 7.0) as depicted in Fig. 1B. While SPCE and AuNPs/SPCE exhibited no electrochemical activity, the cyclic voltammogram of pDA/AuNPs/SPCE displayed a pair of oxidation and reduction peaks at ∼0.08 and ∼0.20 V vs. Ag/AgCl, respectively. The peak-to-peak separation is equal to 120 mV and an ipc-to-ipa ratio is close to unity suggesting a quasi-reversible electron transfer process. These observed peaks, attributed to the oxidation and reduction of catechol and quinone units present in pDA film,42 clearly indicate the successful electrodeposition of pDA onto the AuNPs/SPCE surface.
| Ip = n2F2vAΓ/4RT | (4) |
485 C mol−1), v is the scan rate (V s−1); A denotes the effective area (cm2) calculated in ESI,† R represents the gas constant (8.314 J K−1 mol−1) and T is the room temperature (298 K). Assuming a number of electrons transferred as 2, the surface coverage (Γ) was calculated to be 7.48 × 10⁻¹¹ mol cm−2 which is comparable to that of 1.70 × 10⁻¹⁰ mol cm−2 at pDA@ERGO/GCE.45 The difference is likely attributed to the superior electrocatalytic activity of graphene compared to AuNPs.Fig. 1E illustrates that the anodic and cathodic peak potentials of the pDA film exhibited linear dependence on the logarithm of the scan rates within the range of 10–200 mV s−1. By analyzing the slope of the E vs. log(v) plot, the electron-transfer coefficient (α) can be calculated using eqn (5):46
|
Epa = [2.303 × RT/(1 − α)nαF]log(v) + K
| (5) |
Furthermore, to assess the reproducibility of the preparation protocol, five different electrodes were prepared, and their electrochemical behaviours were compared. The results showed that the anodic peak current of the pDA film exhibited a relative standard deviation of approximately 8%, indicating a controllable electrode preparation.
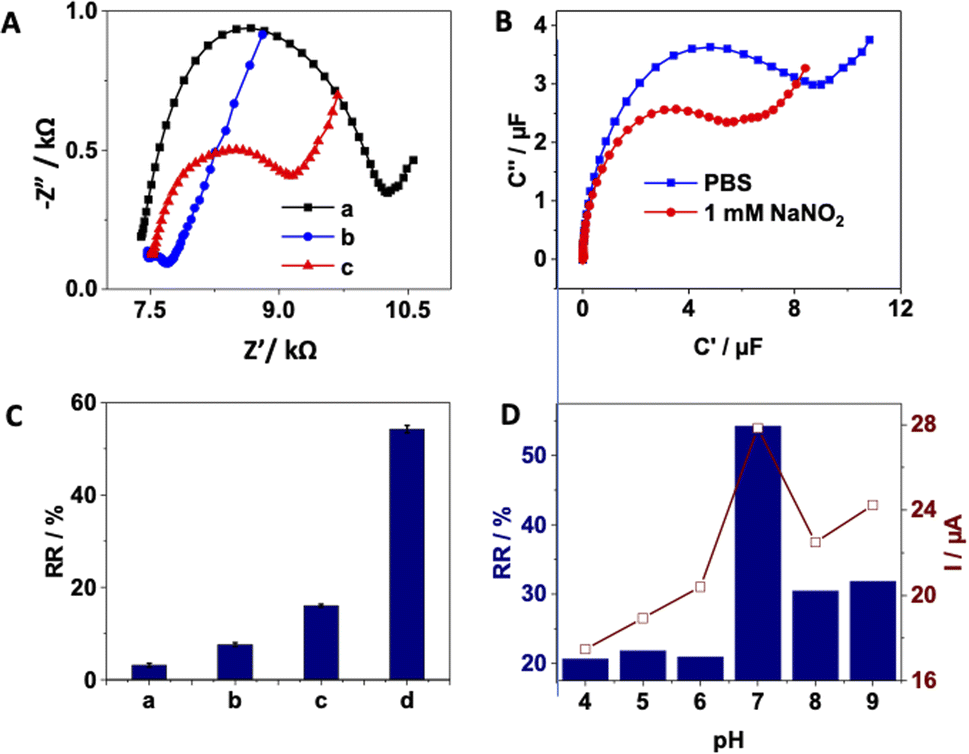 | ||
| Fig. 2 Modified electrode characterization and dependence on the solution pH. (A) Nyquist plots in 5 mM equimolar concentrations of K3Fe(CN)6/K4Fe(CN)6 of (a) bare SPCE; (b) AuNPs/SPCE; and (c) pDA/AuNPs/SPCE. (B) Capacitance Nyquist plots of pDA/AuNPs/SPCE in the absence and presence of 1 mM NaNO2 in 0.01 M PBS (pH 7.0). (C) The relative variation of redox capacitance % RR of (a) bare SPCE; (b) AuNPs/SPCE; (c) pDA/SPCE; and (d) pDA/AuNPs/SPCE after addition of 1 mM NaNO2. Error bars, SD, n = 3. (D) The % RR and the current peak intensity of the CV voltammograms of pDA/AuNPs/SPCE registered in 1 mM NaNO2 at different pH of PBS solution. | ||
3.2. Capacitive detection of nitrite
For the capacitive detection of nitrite, the applied potential was fixed at 140 mV, corresponding to the half-wave potential of the redox pDA film. Fig. 2B illustrates the ECS spectra of pDA/AuNPs/SPCE before and after the addition of 1000 μM concentration of NaNO2. It can be observed that the semicircle, associated with the complex capacitance data composed of faradaic and non-faradaic film contributions of the studied electrode,47 decreased after the addition of nitrite. Similar behaviour was observed for AuNPs/SPCE (Fig. S2 in ESI†) and pDA/SPCE (Fig. S3 in ESI†), while the capacitance of SPCE remained almost unchanged (Fig. S4 in ESI†). However, when comparing the relative capacitance response (Fig. 2C), the highest value was observed for the pDA/AuNPs/SPCE. The decrease in capacitance after the addition of nitrite for the gold-nanostructured electrode is attributed to its good electrocatalytic properties.30 In the case of pDA-modified electrodes, this behaviour is a result of the formation of hydrogen bonds between NO2− and pDA redox moieties, leading to a decrease in electronic density in the molecular receptive layer after the interaction with nitrite ions. Additionally, chemical reaction between nitrite and the reduced form of pDA can be expected. Previous studies by Lu et al. demonstrated rapid nitration and nitrosation of hydroquinone, catechol and resorcinol using HPLC/MS.32 Furthermore, the large surface area and good conductivity of gold nanoparticles allow for a higher surface coverage of the pDA films, which explains the higher relative capacitance of pDA/AuNPs/SPCE compared to pDA/SPCE. These results correlated well with the data from cyclic voltammetry recorded in presence of nitrite (Fig. S5 in ESI†), where the highest peak current in the presence of nitrite was obtained on pDA/AuNPs/SPCE.To maximize the electrode response towards nitrite, the response of pDA/AuNPs/SPCE was evaluated at different pH values ranging from 4 to 9. Fig. 2D shows an increase in the relative capacitance response as the pH increased to 7, followed by a decrease in % RR at higher pH values. This observed capacitance behaviour correlates well with the intensity of the nitrite peak current recorded by cyclic voltammetry (Fig. 2D and S6†). The lower % RR value in acidic solutions is attributed to the decomposition of nitrite to nitric oxide and nitrate,48 while the decrease in % RR value in basic solutions is related to the insufficient protons necessary for the electrocatalytic oxidation of nitrite.49 Therefore, a 0.01 M PBS (pH 7.0) buffer was used for the detection of nitrite.
3.3. Analytical performance
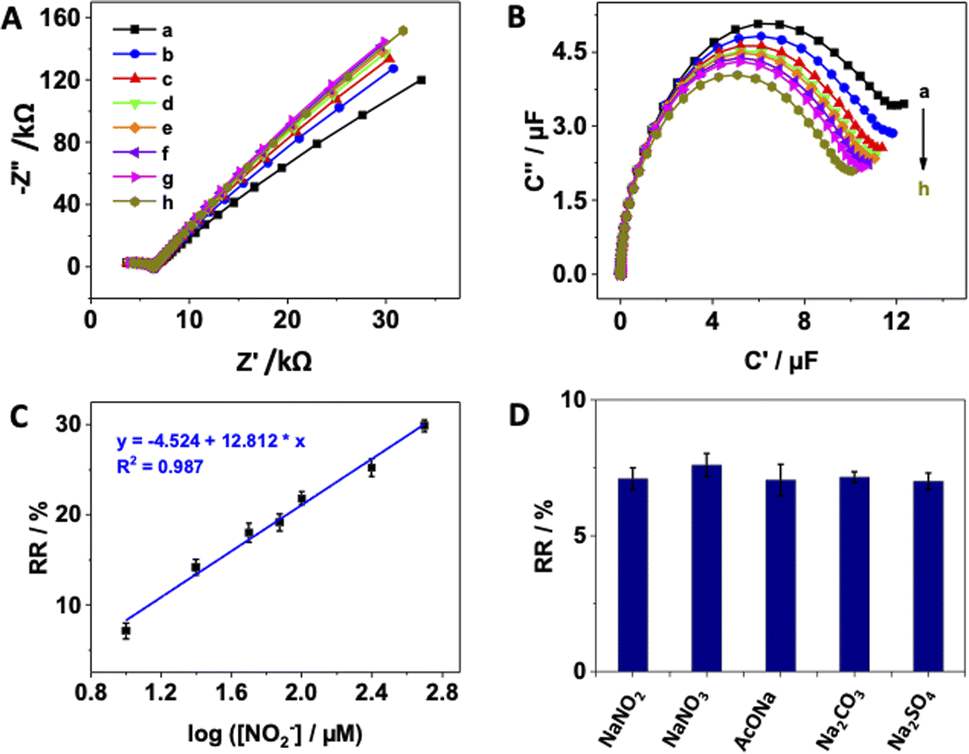 | ||
| Fig. 3 Electrochemical performance determination of the pDA/AuNPs/SPCE. (A) EIS and (B) ECS Nyquist plots registered at various NaNO2 concentrations: (a) 0 μM; (b) 10 μM; (c) 25 μM; (d) 50 μM; (e) 75 μM; (f) 100 μM; (g) 250 μM and (h) 500 μM. (C) Calibration curve of the developed sensor displaying the relative variation of redox capacitance % RR vs. log([NO2−]). (D) Histograms giving the relative variation of redox capacitance upon addition of 10 μM NaNO2 with 1 mM of different interferents. Error bars, SD, n = 3. | ||
The reproducibility of the sensor was assessed by measuring the % RR value of five separately prepared electrodes in the presence of 1 mM NaNO2. The obtained relative standard deviation of 3.6% indicates a good electrode-to-electrode reproducibility thanks to the applied electrodeposition methods that allow highly reproducible preparation of both AuNPs and pDA layers. Moreover, the stability of the prepared sensor was evaluated by preparing two electrodes on the same day and measuring the % RR value in the presence of 1 mM NaNO2 before and after four weeks of storage at 4 °C. The sensor retained approximately 95% of its initial % RR value, confirming a good stability.
3.4. Comparison with literature
In comparison with previously reported gold nanomaterial based composite sensors for the detection of nitrite ions, the analytical performance of the prepared pDA/AuNPs/SPCE was found quite comparable, as summarized in Table 1. The linear range obtained in this study was larger than that of other sensors based on gold nanoparticles50 or composites of gold nanoparticles with polymers,51,52 AuPs-decorated CNTs,53 or a mixture of polymers and carbon nanomaterials.53–55 Additionally, the designed electrode exhibited a relatively lower detection limit than that of glassy carbon electrodes (GCE) modified with gold nanoparticles56 or with a mixture of gold nanoparticles with graphene.57| Electrode | Technique | LOD (μM) | Range (μM) | Ref. |
|---|---|---|---|---|
| a AMTS: aminopropyltriethoxysilane; AuNPs: gold nanoparticles; CPE: carbon pencil electrode; CS: chitosan; CV: cyclic voltammetry; DPV: differential pulse voltammetry; I–t : amperometry; PEI: polyetherimide; LIG: laser-induced graphene; GCE: glassy carbon electrode; FTO: fluorine-doped tin oxide; GR: graphene. | ||||
| AuNPs/CPE | SWV | 0.2 | 0.2–15 | 50 |
| AMPTS-AuNPs/GCE | I–t | 1.0 | 1–12 | 51 |
| AuNPs-PEI/GSPE | CV, DPV | 1.0 | 1–10 | 52 |
| AuNPs/f-MWCNT/LIG | SWV | 0.9 | 10–140 | 53 |
| GO-CS-AuNPs/GCE | I–t | 0.3 | 0.9–18.9 | 54 |
| Au–W bimetallic/GR-CS/PGE | CV | 0.12 | 10–250 | 55 |
| AuNPs/Gr/GCE | I–t | 16.0 | 50–5100 | 57 |
| AuNPs/GCE | CV | 110.0 | 370–10000 |
56 |
| Au/PANI/CPE | I–t | 25.0 | 38–1000 | 62 |
| MoS2-MWCNTs–Au/GCE | I–t | 4.0 | 12–6500 | 63 |
| Dy2O3-AuNPs/GCE | CV | 3.3 | 0.01–1000 | 64 |
| 3D Au–rGO/FTO | CV | 12.1 | 29.9–5740 | 65 |
| AuNPs/MoS2/GN/GCE | CV | 1.0 | 5–5000 | 66 |
| Au-Dy2(WO4)3/GCE | DPV | 3.5 | 10–1000 | 67 |
| pDA/AuNPs/SPCE | ECS | 2.0 | 10–500 | This work |
While it is acknowledged that other amperometry- or voltammetry-based sensors for nitrite can achieve wider linear ranges and lower limits of detection, reaching nanomolar range, respectively,16,58 the electrochemical impedance spectroscopy was used for the detection of aqueous anions such as carbonate, bicarbonate, chloride, acetate, sulfate59 or perchlorate.60 Redox capacitance spectroscopy was applied to quantitively detect perrhenate (ReO4−),19 hydrogen sulfate, phosphate and chloride61 ions. To the best of our knowledge, this study presents the first report of a capacitive-based sensor for nitrite with practical applications in real sample analysis, showing the impact of the sample matrix and provides effective strategies to overcome it. While it is worth mentioning the method exhibits a narrower dynamic range and lower limit of detection compared to several alternatives gathered in Table 1, its capabilities remain sufficient for accurately determining the levels of nitrite in processed meat. This is particularly relevant as the method closely aligns with the maximum residue limits (MRLs) established by food control agencies, which range from 1 to 3 μmol L−1. On the other hand, the method is easy to implant since it uses low-effective screen-printed electrodes that can be modified with gold nanoparticles and dopamine-derived polymeric film, that can be achieved through an electrochemical deposition process in less 30 minutes.
3.5. Real sample analysis
The practical applicability of the pDA/AuNPs-modified electrode was evaluated by testing its performance for nitrite determination in processed meat samples, specifically ham and salami obtained from a local market. The samples were spiked with three different concentrations of nitrite (10, 25 and 50 μM), and their capacitive responses were measured (Fig. 4A/B).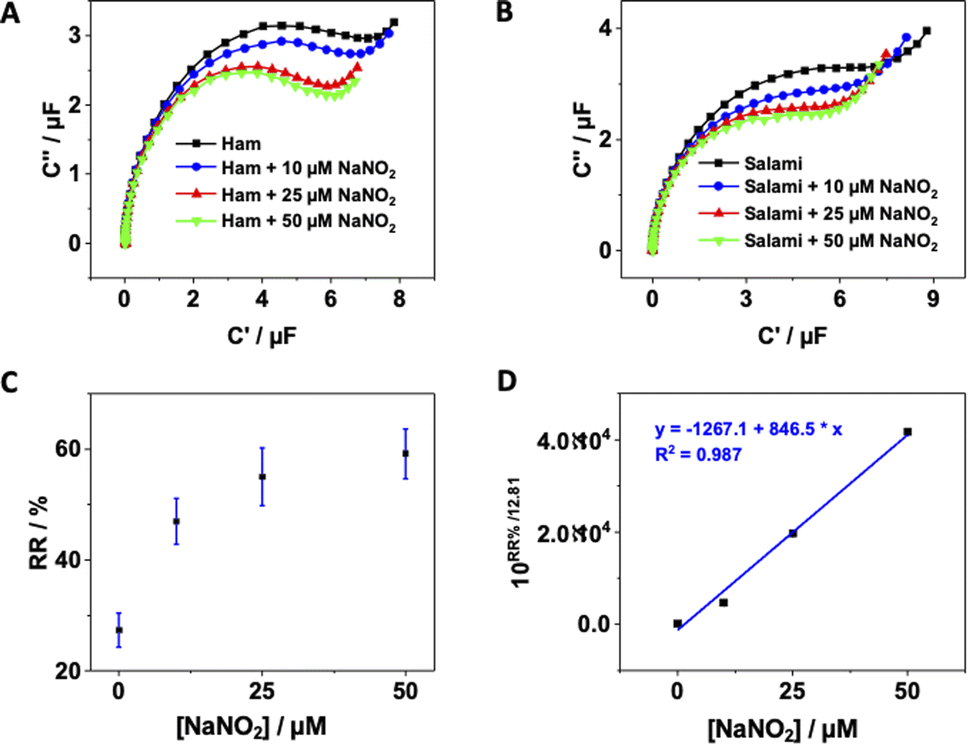 | ||
| Fig. 4 ECS Nyquist plots registered in ham (A) and salami (B) samples spiked with various NaNO2 concentrations. (C) Relative variation of redox capacitance vs. Δ[NO2−] in ham spiked samples. Error bars, SD, n = 3. (D) Graph of the proposed standard addition method application for nitrite determination in ham sample. | ||
When comparing the relative capacitance obtained from the spiked meat samples with that of the buffer solutions using the standard calibration curve, a significant deviation in the recovery results was observed, indicating the presence of a large matrix effect in these processed meat samples (Table 2). It is worth mentioning that this the first report to address this matrix effect it in the analysis of food samples using capacitance spectroscopy.
| Samples | Da (μM) | Standard calibration | Standard additions | ||||
|---|---|---|---|---|---|---|---|
| Ab (μM) | Fc (μM) | % Rd | A (μM) | F (μM) | % R (±RSD)e | ||
| a D: detected using the current method.b A: Added.c F: Found.d R: recovery (% R = 100 × (F − A)/A).e RSD of 3 measurements. | |||||||
| Ham | 3.96 | 10.0 | 3.1 × 10² | 2.2 × 10⁴ | 10.0 | 13.13 | 94.0 ± 3 |
| 25.0 | 1.0 × 10⁵ | 3.6 × 10⁵ | 25.0 | 30.05 | 103.9 ± 2 | ||
| 50.0 | 4.4 × 10⁵ | 8.2 × 10⁵ | 50.0 | 54.58 | 101.1 ± 1 | ||
| Salami | 5.00 | 10.0 | 2.2 × 10¹¹ | 1.4 × 10¹² | 10.0 | 14.86 | 99.1 ± 3 |
| 25.0 | 8.9 × 10¹¹ | 3.0 × 10¹² | 25.0 | 29.77 | 99.2 ± 5 | ||
| 50.0 | 1.7 × 10¹² | 3.0 × 10¹² | 50.0 | 46.77 | 85.0 ± 7 | ||
To account for this matrix effect, the standard additions method was alternatively examined. However, as shown in Fig. 4C and S7,† the conventional standard additions plot was still non-linear, which was expected since the relative capacitance is proportional to the logarithm of the nitrite concentrations. As solution, the obtained standard additions plot was mathematically transformed or corrected by dividing the relative capacitance by the slope of the standard calibration curve (Fig. 4D and S8†). Subsequently, nitrite concentrations were determined with acceptable recovery percentages (Table 2), demonstrating that the standard additions method provides a more accurate measurement of nitrite concentrations in the analysed samples compared to using a standard curve. This finding confirms that the prepared sensor can be practically utilized for the detection of nitrite in real samples of processed meat and potentially in vegetables and fruits as well. Furthermore, as illustrated in Table 2, the relative standard deviation obtained from three different measurements ranged between 1% and 7%. This indicates that the sensor exhibits acceptable electrode-to-electrode reproducibility in the detection of nitrite in real samples.
4. Conclusion
In summary, the study successfully prepared a polydopamine/AuNPs-modified SPCE using electrodeposition methods. This approach offered a flexible, cost-effective technique for creating modified electrode surfaces that are controllable, uniform and reproducible. The redox properties of the polydopamine film were leveraged to achieve sensitive and selective detection of nitrite ions using electrochemical capacitance spectroscopy. Moreover, the developed sensor demonstrated the capability to detect low concentrations of nitrite ions in spiked buffer solutions and processed meat samples, despite the presence of a significant matrix effect. The current research presented a promising platform for the fabrication of capacitance-based sensors for anions, paving the way for future applications in the field.Author contributions
F. K. A.: formal analysis, investigation, methodology, writing original draft, funding acquisition; A. R.: data, formal analysis, investigation, writing original draft; M. M.: formal analysis, investigation, writing original draft; S. B. A.: supervision, writing – review& editing; B. Y. A.: formal analysis, writing original draft; N. R.: conceptualization, funding acquisition, resources, supervision, writing – review & editing.Conflicts of interest
The authors declare no conflict of interest.Acknowledgements
The authors extend their appreciation to the Deanship of Scientific Research at Imam Mohammad Ibn Saud Islamic University (IMSIU) for funding and supporting this work through Research Partnership Program no. RP-21-09-69.Notes and references
- R. Cammack, C. L. Joannou, X.-Y. Cui, C. Torres Martinez, S. R. Maraj and M. N. Hughes, Biochim. Biophys. Acta, Bioenerg., 1999, 1411, 475–488 CrossRef CAS.
- M. Karwowska and A. Kononiuk, Antioxidants, 2020, 9, 241 CrossRef CAS PubMed.
- M. Correia, Â. Barroso, M. F. Barroso, D. Soares, M. B. P. P. Oliveira and C. Delerue-Matos, Food Chem., 2010, 120, 960–966 CrossRef CAS.
- C. Menard, F. Heraud, J.-L. Volatier and J.-C. Leblanc, Food Addit. Contam., Part A: Chem., Anal., Control, Exposure Risk Assess., 2008, 25, 971–988 CrossRef CAS.
- S. Y. Choi, M. J. Chung, S.-J. Lee, J. H. Shin and N. J. Sung, Food Control, 2007, 18, 485–491 CrossRef CAS.
- P. Santamaria, Nitrate in vegetables: toxicity, content, intake and EC regulation, J. Sci. Food Agric., 2006, 86, 1–10 CrossRef.
- M. M. Pelletier, P. Kleinbongard, L. Ringwood, R. Hito, C. J. Hunter, A. N. Schechter, M. T. Gladwin and A. Dejam, Free Radicals Biol. Med., 2006, 41, 541–548 CrossRef CAS PubMed.
- J. Zhang, C. Yue, Y. Ke, H. Qu and L. Zeng, Adv. Agrochem, 2023, 2(2), 127–141 CrossRef.
- Y. Guo, R. Wang, C. Wei, Y. Li, T. Fang and T. Tao, Food Chem., 2023, 415, 135749 CrossRef CAS PubMed.
- M. Sepahvand, F. Ghasemi and H. M. Seyed Hosseini, Food Chem. Toxicol., 2021, 149, 112025 CrossRef CAS.
- C. T. K. Tran, H. T. T. Tran, H. T. T. Bui, T. Q. Dang and L. Q. Nguyen, J. Sci.: Adv. Mater. Devices, 2017, 2, 172–177 Search PubMed.
- A. Rabti, S. Ben Aoun and N. Raouafi, Microchim. Acta, 2016, 183, 3111–3117 CrossRef CAS.
- A. Diarisso, M. Fall and N. Raouafi, Environ. Sci.: Water Res. Technol., 2018, 4, 1024–1034 RSC.
- M. L. Sall, B. Fall, I. Diédhiou, E. H. Dièye, M. Lo, A. K. D. Diaw, D. Gningue-Sall, N. Raouafi and M. Fall, Chem. Afr., 2020, 3, 499–512 CrossRef CAS.
- B. R. Kozub, N. V. Rees and R. G. Compton, Sens. Actuators, B, 2010, 143, 539–546 CrossRef CAS.
- Z. Yang, X. Zhou, Y. Yin and W. Fang, Anal. Lett., 2021, 54, 2826–2850 CrossRef CAS.
- X. Li, J. Ping and Y. Ying, TrAC, Trends Anal. Chem., 2019, 113, 1–12 CrossRef CAS.
- A. Rhouati, M. Berkani, Y. Vasseghian and N. Golzadeh, Chemosphere, 2022, 291, 132921 CrossRef CAS.
- P. R. Bueno, R. Hein, A. Santos and J. J. Davis, Phys. Chem. Chem. Phys., 2020, 22, 3770–3774 RSC.
- S. Ben Aissa, A. Mars, G. Catanante, J.-L. Marty and N. Raouafi, Talanta, 2019, 195, 525–532 CrossRef CAS.
- B. L. Garrote, A. Santos and P. R. Bueno, Nat. Protoc., 2020, 15, 3879–3893 CrossRef CAS.
- A. Raouafi, A. Rabti and N. Raouafi, Microchim. Acta, 2017, 184, 4351–4357 CrossRef CAS.
- F. K. Algethami, A. Rabti, M. Mastouri, S. Ben Aoun, B. Y. Abdulkhair and N. Raouafi, Talanta, 2023, 258, 124445 CrossRef CAS PubMed.
- F. C. B. Fernandes, J. R. Andrade and P. R. Bueno, Sens. Actuators, B, 2019, 291, 493–501 CrossRef CAS.
- J. Piccoli, R. Hein, A. H. El-Sagheer, T. Brown, E. M. Cilli, P. R. Bueno and J. J. Davis, Anal. Chem., 2018, 90, 3005–3008 CrossRef CAS PubMed.
- M. Hamami, A. Mars and N. Raouafi, Microchem. J., 2021, 165, 106102 CrossRef CAS.
- M. Hamami, N. Raouafi and H. Korri-Youssoufi, Appl. Sci., 2021, 11, 1382 CrossRef CAS.
- R. M. B. Oliveira, F. C. B. Fernandes and P. R. Bueno, Electrochim. Acta, 2019, 306, 175–184 CrossRef CAS.
- J. Szewczyk, D. Aguilar-Ferrer and E. Coy, Eur. Polym. J., 2022, 174, 111346 CrossRef CAS.
- R. Sanchis-Gual, M. Coronado-Puchau, T. Mallah and E. Coronado, Coord. Chem. Rev., 2023, 480, 215025 CrossRef CAS.
- N. Leibl, L. Duma, C. Gonzato and K. Haupt, Bioelectrochemistry, 2020, 135, 107541 CrossRef CAS PubMed.
- Y. Lu, Y. Dong, X. Li and Q. He, J. Food Sci., 2016, 81, C2692–C2696 CrossRef CAS PubMed.
- J. Tian, S.-Y. Deng, D.-L. Li, D. Shan, W. He, X.-J. Zhang and Y. Shi, Biosens. Bioelectron., 2013, 49, 466–471 CrossRef CAS PubMed.
- F. Li, L. Yang, C. Zhao and Z. Du, Anal. Methods, 2011, 3, 1601–1606 RSC.
- A. Rabti, R. Zayani, M. Meftah, I. Salhi and N. Raouafi, Microchim. Acta, 2020, 187, 1–9 CrossRef PubMed.
- S. Daboss, J. Lin, M. Godejohann and C. Kranz, Anal. Chem., 2020, 92, 8404–8413 CrossRef CAS PubMed.
- B. L. Garrote, A. Santos and P. R. Bueno, Nat. Protoc., 2020, 15, 3879–3893 CrossRef CAS.
- G. Xu, J. Hou, Y. Zhao, J. Bao, M. Yang, H. Fa, Y. Yang, L. Li, D. Huo and C. Hou, Sens. Actuators, B, 2019, 287, 428–436 CrossRef CAS.
- M. Amiri, E. Amali, A. Nematollahzadeh and H. Salehniya, Sens. Actuators, B, 2016, 228, 53–58 CrossRef CAS.
- J. Lin, S. Daboss, D. Blaimer and C. Kranz, Nanomaterials, 2019, 9, 242 CrossRef CAS.
- J. Kund, S. Daboss, T. M. D'Alvise, S. Harvey, C. V. Synatschke, T. Weil and C. Kranz, Nanomaterials, 2021, 11, 1964 CrossRef CAS.
- P. Kanyong, S. Rawlinson and J. Davis, Sens. Actuators, B, 2016, 233, 528–534 CrossRef CAS.
- E. Laviron, J. Electroanal. Chem. Interfacial Electrochem., 1979, 100, 263–270 CrossRef CAS.
- A. Hammami, J. Kuliček and N. Raouafi, Food Chem., 2016, 209, 274–278 CrossRef CAS PubMed.
- D. R. Kumar, S. Kesavan, T. T. Nguyen, J. Hwang, C. Lamiel and J.-J. Shim, Sens. Actuators, B, 2017, 240, 818–828 CrossRef CAS.
- E. Laviron, J. Electroanal. Chem. Interfacial Electrochem., 1979, 101, 19–28 CrossRef CAS.
- P. R. Bueno, G. Mizzon and J. J. Davis, J. Phys. Chem. B, 2012, 116, 8822–8829 CrossRef CAS PubMed.
- C. Lete, M. Chelu, M. Marin, S. Mihaiu, S. Preda, M. Anastasescu, J. M. Calderón-Moreno, S. Dinulescu, C. Moldovan and M. Gartner, Sens. Actuators, B, 2020, 316, 128102 CrossRef CAS.
- A. Adiraju, R. Munjal, C. Viehweger, A. Al-Hamry, A. Brahem, J. Hussain, S. Kommisetty, A. Jalasutram, C. Tegenkamp and O. Kanoun, Sensors, 2023, 23, 2961 CrossRef CAS PubMed.
- D. Gobelli, N. Mariano Correa, M. Fátima Barroso, F. Moyano and P. G. Molina, Electroanalysis, 2015, 27, 1883–1891 CrossRef CAS.
- G. Maduraiveeran and R. Ramaraj, J. Anal. Sci. Technol., 2017, 8, 14 CrossRef.
- M. Talbi, A. Al-Hamry, P. R. Teixeira, A. Bouhamed, S. Azzouzi, L. G. Paterno, M. B. Ali and O. Kanoun, in 2019 16th International Multi-Conference on Systems, Signals & Devices (SSD), 2019, pp. 1–4 Search PubMed.
- S. Nasraoui, A. Al-Hamry, P. R. Teixeira, S. Ameur, L. G. Paterno, M. Ben Ali and O. Kanoun, J. Electroanal. Chem., 2021, 880, 114893 CrossRef CAS.
- R. Mo, X. Wang, Q. Yuan, X. Yan, T. Su, Y. Feng, L. Lv, C. Zhou, P. Hong, S. Sun, Z. Wang and C. Li, Sensors, 2018, 18, 1986 CrossRef PubMed.
- A. L. Lavanya, K. G. B. Kumari, K. R. S. Prasad and P. K. Brahman, Electroanalysis, 2021, 33, 1096–1106 CrossRef CAS.
- S. H. Mohd Taib, K. Shameli, P. Moozarm Nia, M. Etesami, M. Miyake, R. Rasit Ali, E. Abouzari-Lotf and Z. Izadiyan, J. Taiwan Inst. Chem. Eng., 2019, 95, 616–626 CrossRef CAS.
- M. Zhang, F. Cheng and F. Gan, Int. J. Electrochem. Sci., 2015, 10, 5905–5913 CrossRef CAS.
- P. Saha, R. Akter, S. Shaheen Shah, W. Mahfoz, Md. A. Aziz and A. J. Saleh Ahammad, Chem.–Asian J., 2022, 17, e202200823 CrossRef CAS PubMed.
- D. W. Scott and Y. Alseiha, J. Anal. Sci. Technol., 2017, 8, 17 CrossRef.
- M. Braik, C. Dridi, A. Ali, M. N. Abbas, M. Ben Ali and A. Errachid, Org. Electron., 2015, 16, 77–86 CrossRef CAS.
- S. C. Patrick, R. Hein, P. D. Beer and J. J. Davis, J. Am. Chem. Soc., 2021, 143, 19199–19206 CrossRef CAS.
- M. Etesami, N. Chandran, M. H. Hussin, A. Ripin, R. Adnan, A. N. Ahmad Sujari and N. Mohamed, Int. J. Electrochem. Sci., 2016, 11, 8332–8345 CrossRef CAS.
- Y. Zhang, F. Wen, J. Tan, C. Jiang, M. Zhu, Y. Chen and H. Wang, J. Electroanal. Chem., 2017, 786, 43–49 CrossRef CAS.
- H. Huang, Y. Yue, L. Li and J.-J. Zhu, J. Electrochem. Soc., 2017, 164, H321 CrossRef CAS.
- C. Li, D. Chen, Y. Wang, X. Lai, J. Peng, X. Wang, K. Zhang and Y. Cao, Sensors, 2019, 19, 1304 CrossRef CAS PubMed.
- Y. Han, R. Zhang, C. Dong, F. Cheng and Y. Guo, Biosens. Bioelectron., 2019, 142, 111529 CrossRef CAS.
- Y.-M. Zhang, H.-P. Huang and L. Xu, Chin. J. Anal. Chem., 2020, 48, e20032–e20037 Search PubMed.
Footnote |
| † Electronic supplementary information (ESI) available. See DOI: https://doi.org/10.1039/d3ra03898j |
| This journal is © The Royal Society of Chemistry 2023 |