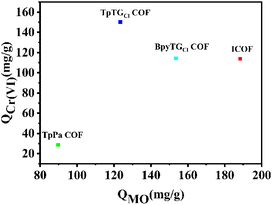
 Open Access Article
A novel cationic covalent organic framework as adsorbent for simultaneous removal of methyl orange and hexavalent chromium†
Chang Du‡
,
Xiaodi Chen‡,
Hongping Wu,
Zilu Pan,
Chunyan Chen *,
Guanqun Zhong* and
Changqun Cai
Key Laboratory for Green Organic Synthesis and Application of Hunan Province, Key Laboratory of Environmentally Friendly Chemistry and Application of Ministry of Education, College of Chemistry, Xiangtan University, Xiangtan 411105, China. E-mail: chenchunyan@xtu.edu.cn; 15616727476@163.com
First published on 11th August 2023
Abstract
The simultaneous removal of toxic, carcinogenic organic dyes and metal ions from water by one material offers significant advantages when fast, facile, and robust water purification is required. Ionic covalent organic frameworks (ICOFs) have the combined properties of COFs and ion exchange resins and are expected to achieve simultaneous capture of heavy metal ions and organic dyes from water. Herein, a novel guanidinium-based ICOF was synthesized using a solvothermal method. Benefitting from the cationic character, porosity and nanoscale pore size of ICOFs, the adsorbent exhibited high simultaneous adsorption capacities of 290 mg g−1 and 158 mg g−1 for methyl orange (MO) and Cr(VI), respectively, and retained more than 90% adsorption capacity after six adsorption–desorption cycles. In addition, based on dual control of size-exclusion and charge-selection, precisely selective adsorption is achieved towards diverse mixed anionic and cationic pollutants. This strategy offers a practical solution for COFs to confront environmental pollution issues.
1 Introduction
With the increasing industrialization of the global economy, organic dyes are frequently being used for coloring in various industries, such as textiles, dyeing, leather, and papermaking, resulting in a huge amount of dye-containing wastewater.1 This kind of effluent commonly contains potentially toxic metal ions as well.2 Thus, these effluents pose serious threats to public health and the environment, due to their complex components, high colourity, potential mutagenicity, and poor biochemical purification ability.3 As a widely used azo dye, methyl orange (MO) can lead to severe health problems like tachycardia, vomiting, cyanosis, jaundice, quadriplegia, and tissue necrosis.4 On the other hand, Cr(VI) ions can cause diarrhea, vomiting, pulmonary congestions liver and kidney damage.5 Presently, MO and Cr(VI) usually co-exist in some wastewater.6 Therefore, the simultaneous removal of MO and Cr(VI) from industry effluent is urgently needed.Various techniques have been applied for the individual removal of MO and Cr(VI).6,7 Compared to electrolytic chemical treatment,8 membrane separation,9 chemical reduction,10 and biological treatment,11 adsorption is still a preferable approach due to its simplicity, low-cost, and effectiveness.12 However, the commonly used adsorbents are mainly single MO adsorbents or Cr(VI) adsorbents. Due to their significantly different physicochemical properties,13,14 few studies have focused on the simultaneous removal of MO and Cr(VI), and those adsorbents suffer from low capacity or low efficiency.13 Therefore, the design and fabrication of efficient, stable, environment-friendly, and low-cost adsorbents for the simultaneous removal of MO and Cr(VI) is imperative.
Covalent organic frameworks (COFs) are crystalline porous materials formed by covalent bonding of organic monomers.15 Benefiting from advantages of porosity, high surface area, adjustable pore size and easy functionalization of the pore surface, COFs have shown excellent performance in removing heavy metal ions16–20 and organic dyes,21–24 but the simultaneous removal of the toxic pollutants coexisting in printing and dyeing wastewater has been little investigated.25 Ionic covalent organic frameworks (ICOFs) are an emerging class of functional materials that have the combined properties of COFs and porous ionic polymers (PiPs), and thus have the potential to effectively remove a variety of different contaminants, such as metal ions.26
Herein, a novel ICOF based on a positively charged triaminoguanidine chloride was produced to eliminate both MO and Cr(VI) from water simultaneously. The ICOF was characterized systematically. The adsorption equilibrium and binding kinetics of ICOF for MO and Cr(VI) in their single pollutant systems were studied, and its simultaneous adsorption capacity for MO and Cr(VI), as well as its reusability in binary systems, were examined. Moreover, the selective adsorption capacity of ICOF was discussed in detail. The results demonstrated excellent prospects for the development of ICOF as efficient and recyclable adsorbents for the simultaneous efficient removal of heavy metal ions and organic dyes in water treatment.
2 Experimental section
2.1. Synthesis of ICOF
ICOF was synthesized via Schiff base reaction between 5,5′-(1,4-phenylene) dipicolinaldehyde (12.97 mg, 0.045 mmol) and triaminoguanidinium chloride (TGCl, 4.22 mg, 0.03 mmol) in 1.1 mL of tetrahydrofuran (THF)/3 M HAc (1![[thin space (1/6-em)]](https://www.rsc.org/images/entities/char_2009.gif) :
:![[thin space (1/6-em)]](https://www.rsc.org/images/entities/char_2009.gif) 0.1, v/v). The mixture was placed into a Pyrex tube (10 × 8 mm2 and length 20 cm) and sonicated for 15 min. The mixture was degassed three times by freeze–pump–thaw cycles under liquid N2, then the tube was sealed and heated at 120 °C for 3 days. ICOF was obtained as red precipitates. The product was collected by centrifugation and washed with DMF, water and THF and dried at 60 °C under vacuum overnight in ca. 86% isolated yield.
0.1, v/v). The mixture was placed into a Pyrex tube (10 × 8 mm2 and length 20 cm) and sonicated for 15 min. The mixture was degassed three times by freeze–pump–thaw cycles under liquid N2, then the tube was sealed and heated at 120 °C for 3 days. ICOF was obtained as red precipitates. The product was collected by centrifugation and washed with DMF, water and THF and dried at 60 °C under vacuum overnight in ca. 86% isolated yield.
2.2. Adsorption experiments
 | (1) |
 | (2) |
3 Results and discussion
3.1. Characterization of the adsorbents
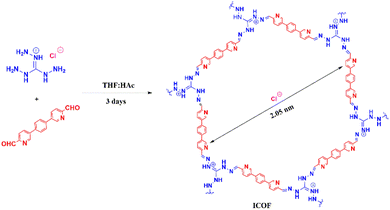
In this study, an ICOF with a positively charged backbone was produced by introducing a cationic guanidine groups into the framework. This positively charged backbone can strongly interact electrostatically with oppositely charged ionic contaminants, thus enhancing the adsorption capacity of the ICOF. The one-step synthesis scheme of the ICOF is described in Fig. 1.The newly developed ICOF were further characterized using various spectroscopy and microscopy techniques. The occurrence of Schiff base reaction during the construction of ICOF was confirmed by the Fourier transform infrared spectrum (FT-IR) (Fig. 2a). The carbonyl stretching vibration peak (C![[double bond, length as m-dash]](https://www.rsc.org/images/entities/char_e001.gif) O, 1719 cm−1) of the aldehyde monomer and the N–H stretching vibration peak (3329 cm−1, 3201 cm−1) of primary amines in the TGCl monomer disappeared in the corresponding product. Moreover, an obvious signal of C
O, 1719 cm−1) of the aldehyde monomer and the N–H stretching vibration peak (3329 cm−1, 3201 cm−1) of primary amines in the TGCl monomer disappeared in the corresponding product. Moreover, an obvious signal of C![[double bond, length as m-dash]](https://www.rsc.org/images/entities/char_e001.gif) N stretching bond (1623 cm−1) appeared in ICOF after the condensation reaction, which reveals the successful formation of new imide bonds between aldehyde and amino groups in networks.
N stretching bond (1623 cm−1) appeared in ICOF after the condensation reaction, which reveals the successful formation of new imide bonds between aldehyde and amino groups in networks.
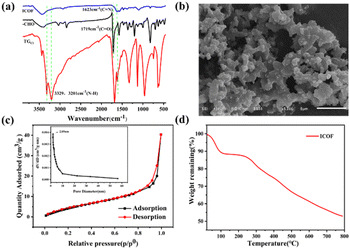 | ||
| Fig. 2 (a) FTIR spectrum of ICOF, reactants –CHO and TGCl. (b) SEM images for ICOF. (c) N2 adsorption isotherm (77 K) and pore size distribution profiles. (d) TGA curves of ICOF. | ||
The crystalline structure of ICOF was analyzed according to the powder X-ray diffraction (PXRD) pattern. As shown in Fig. S1,† there was one broad characteristic peak at 2θ = 20–27°, which suggested its crystallinity was low. Concretely, the broad peak at 20–27° revealed that the π–π stacking between layers of the crystalline structure was poor, which was affected by the charge repulsion between guanidine groups and Cl−.26
To investigate the morphology of ICOF at the nanoscale, it was characterized by scanning electron microscopy (SEM). It can be seen in Fig. 2b that the COF was an aggregate of many short nanofibers with a coral-like structure.
The porosity of the ICOF was further assessed in detail through N2 adsorption–desorption experiments at 77 K (Fig. 2c). The Brunauer–Emmett–Teller (BET) surface area was calculated to be 21.59 m2 g−1. The poor directional control of the guanidine units in the layers was likely responsible for the relatively low BET surface area of the ICOF, which was also observed in other ICOF.28 The sorption isotherm belongs to type IV, which is indicative of mesoporous materials. The pore size distribution profile obtained from adsorption branch (Fig. 2c, inset) based on NLDFT method also indicates the dominant existence of mesopores in the ICOF structure, with the pore diameter of the ICOF centered at 2.05 nm.
The thermal gravimetric analysis (TGA) (Fig. 2d) was utilized to estimate the thermal stability of the ICOF, which is thermally stable below 278 °C with a minor loss of weight. The first weight loss (below 100 °C) corresponds to the elimination of absorbed water (about 10%).
3.2. Removal of MO and Cr(VI) in single pollutant system
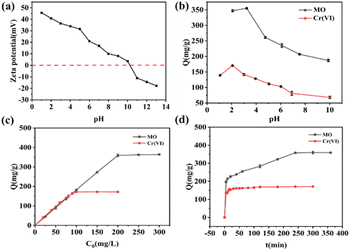
The effects of solution pH on the adsorption performance of MO and Cr(VI) on the ICOF were shown in Fig. 3b. It's clearly observed that the adsorption capacity of both MO and Cr(VI) was highly pH dependent. The adsorption capacity of both MO and Cr(VI) increased and then decreased with an increase in pH. The maximum adsorption capacity of MO was attained at pH = 3.23, while that of Cr(VI) was reached at pH = 2. For the adsorbent, the number of surface charges in ICOF decreases with an increasing solution pH due to a partial deprotonation of the guanidinium ions present in the framework, leading to a weakened electrostatic interaction and diminished adsorption capacity of negatively charged substances. For MO, it is exists mainly as an azo structure at pH > pKa (3.57) and as a hydrazone structure at pH < pKa (Fig. S2†). The adsorption capacity of MO decreased when the pH was below 3.23, which could be attributed to the steric effect of dimethyl amino groups and the electrostatic repulsion between protonated dimethyl amino groups and the adsorbent. In addition, MO was found to form a dimer under acidic conditions, and this dimer showed electroneutrality, which reduced the interaction with ICOF.Consequently, the optimal pH value for removal of MO by ICOF was chosen as 3.0. For Cr(VI), it exists in water in the form of CrO42−, HCrO4−, Cr2O72− and H2CrO4, depending on solution pH. When the pH is lower than 2.0, the neutral H2CrO4 in water increases, weakening the electrostatic interactions with the adsorbents and thus decreasing its adsorption capacity.30 Therefore, the optimal pH value appears at 2.0 which was also selected for the subsequent experiments.
 | (3) |
 | (4) |
The final fitted results are listed in Table S1.† It can be seen that the linear correlation coefficients (R2) of Langmuir model is much higher than that of Freundlich. Furthermore, the Qm of adsorbates on ICOF calculated by Langmuir model are all much closer to the experimental results. Therefore, the Langmuir model can better describe their adsorption behaviors, and the adsorption of MO and Cr on ICOF is monolayer adsorption.
To further investigate the adsorption mechanism, simulation for these kinetic data was conducted on the basis of pseudo-first-order and pseudo-second-order models,32 respectively (Fig. S4†). The models were expressed respectively by eqn (5) and (6) listed as follows.
ln(Qe − Qt) = ln![[thin space (1/6-em)]](https://www.rsc.org/images/entities/char_2009.gif) Qe − k1t Qe − k1t
| (5) |
 | (6) |
The fitted parameters are all listed in Table S2.† Considering the correlation coefficients (R2), the pseudo-second-order model can better fit the adsorption kinetics of MO and Cr(VI) by ICOF. It indicates that chemisorption is the rate controlling mechanism in the adsorption of these two pollutants, which is fully consistent with those drawn from adsorption isotherms analysis as mentioned above.
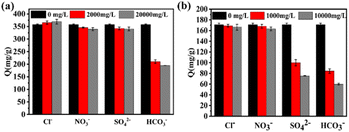
According to Fig. 4a, in the presence of competing anions, i.e., NO3−, Cl− and SO42− ions, no significant inhibition of the adsorption capacities of the ICOF for MO was observed. However, due to the alkaline nature of the aqueous solution of HCO3−, the electrostatic interaction between the adsorbate and the adsorbent is weakened, significantly decreasing the adsorption capacity of ICOF. As is shown in Fig. 4b, Cl− and NO3− had little impact on Cr(VI) adsorption owing to the non-tetrahedral structure, while SO42−, with the tetrahedral structure decreased the adsorption performance of ICOF at higher concentrations. Seipp's33 work indicated that the binding affinity of guanidinium receptors for anions depends on hydrogen bond donating capacities and coulombic stabilization. Thus, it could be explained that SO42− with stronger electronegativity exhibited a higher binding affinity for guanidinium groups, because it has higher electronic charge. As for HCO3−, the reason affecting the amount of Cr(VI) adsorbed on ICOF is the same as for MO.
3.3. Removal of MO and Cr(VI) in binary pollutant system
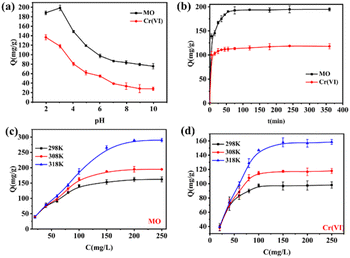
According to the regression coefficient (R2), the Langmuir model is more consistent with the adsorption behavior of MO and Cr(VI) on the ICOF than the Freundlich model (Table S4 and Fig. S5†), indicating the homogeneous adsorption sites and monolayer interaction between the ICOF and adsorbates (MO and Cr(VI)), and this is consistent with the single pollutant system. These results clearly show that the ICOF can be used to simultaneously remove MO and Cr(VI) from the mixed solution.
Thermodynamic studies can offer meritorious data, including a calculation of the thermodynamic parameters ΔG0 (kJ mol−1), ΔH0 (kJ mol−1) and ΔS0(kJ mol−1 K−1).34 These parameters were calculated by the following equations:
 | (7) |
ΔG0 = −RT![[thin space (1/6-em)]](https://www.rsc.org/images/entities/char_2009.gif) ln ln![[thin space (1/6-em)]](https://www.rsc.org/images/entities/char_2009.gif) Kc Kc
| (8) |
 | (9) |
3.4. Adsorption selectivity
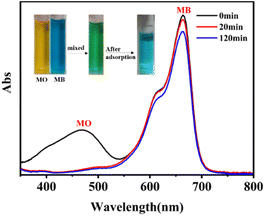 | ||
| Fig. 6 Dye selectivity of ICOF with mixed dye (MB and MO) initial concentration: 20 mg L−1; adsorbent mass: 2 mg; volume: 6 mL. | ||
The adsorption ability of the ICOF toward different target metal ions was also evaluated. As shown in Fig. S8(g) and (h),† the characteristics absorption band of Cr(VI) was completely disappeared after absorption by ICOF. But for Cu2+, it presented a smaller decline in the intensity of characteristics absorption spectra. Meanwhile, the removal rate of Cr2O72− was 98.85%, much higher than that of Cu2+ (11.88%), which is fully demonstrates the charge discrimination ability of the ICOF (Fig. S10†).
3.5. Recyclability
Reusability of adsorbent is the main factor determining its economic feasibility for application in real water treatment. In order to evaluate the recovery performance of ICOF after adsorption of MO and Cr(VI), 0.5 M NaOH solution and 1.0 M HCl solution were used to regenerate it successively. As shown in Fig. S12,† the regenerated ICOF retained a 90% removal capacity for MO and Cr(VI) in the binary pollutant system after five consecutive cycles. This confirmed that the ICOF was a reliable and reusable adsorbent.3.6. Adsorption mechanism
In order to further investigate the adsorption mechanism of MO and Cr on the ICOF, XPS analysis of ICOF before and after adsorption was provided in the revised manuscript. As shown in Fig. 8, ICOF mainly contains three elements: C, N, and O, where element O exists in the defective part of ICOF. In the full-range XPS map of ICOF after adsorption, the binding energies of the main elements were almost unchanged (Table S8†). The peak corresponding to the element S was observed at 163.4 eV, and the peak corresponding to element Cr was observed at 577 eV, indicating that MO and Cr were successfully adsorbed on the surface of ICOF.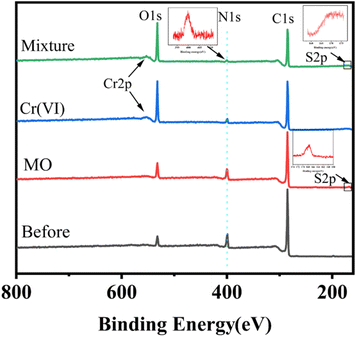 | ||
| Fig. 8 XPS spectra of ICOF before and after adsorption of Cr(VI) at pH 2.0, MO at pH 3.0, and their mixture at pH 3.0, respectively. | ||
Furthermore, the Cr 2p3/2 and Cr 2p1/2 XPS data for ICOF after adsorption of Cr(VI) are given in Fig. S13.† The high binding energy features (∼586.77 eV) and low binding energy features (∼577.27 eV) correspond to Cr(III) 2p1/2 and Cr(III) 2p3/2 orbitals, respectively. The appearance of the characteristic Cr(III) peak may be attributed to the water-insoluble Cr(III) compounds which may be generated due to the alteration of the local ambient reduction potential of the ICOF during the drying process of the samples required for the XPS measurements. In addition, as the zeta potential of ICOF becomes negative, its adsorption of MO and Cr (VI) decreases, and it can be inferred that the adsorption of MO and Cr(VI) on the ICOF mainly relies on electrostatic interactions.
4 Conclusions
In conclusion, we have synthesized a new member of the guanidinium-based ICOF family through a simple Schiff-base condensation reaction. The ICOF presented high binding ability and fast adsorption kinetics for MO and Cr(VI) in their respective single pollutant systems, and also showed excellent simultaneous adsorption ability and good reusability for MO and Cr(VI). Moreover, it presented excellent binding selectivity for anionic pollutants. This work indicates the great potential of ICOFs as excellent sorbent materials for simultaneous removal of heavy metal ions and organic dyes in environmental remediation.Conflicts of interest
There are no conflicts to declare.Acknowledgements
This work was supported by the Scientific Research Foundation of Hunan Provincial Education Department (No. 20B586), Natural Science Foundation of Hunan Province (No. 2021JJ40525), and Hunan 2011 Collaborative Innovation Center of Chemical Engineering & Technology with Environmental Benignity and Effective Resource Utilization.Notes and references
- K. Li, P. Li, J. Cai, S. Xiao, H. Yang and A. Li, Chemosphere, 2016, 154, 310–318 CrossRef CAS PubMed.
- J. Wang, W. Zhang and J. Wei, J. Mater. Chem. A, 2019, 7, 2055–2065 RSC.
- N. Velinov, J. Mitrović, M. Kostić, M. Radović, M. Petrović, D. Bojić and A. Bojić, Wood Sci. Technol., 2019, 53, 619–647 CrossRef CAS.
- J. Guo, X. Chen, Y. Shi, Y. Lan and C. Qin, PLoS One, 2015, 10, e0134298 CrossRef PubMed.
- S. Hassanpour, M. Taghizadeh and Y. Yamini, J. Polym. Environ., 2017, 26, 101–115 CrossRef.
- Y. Yang, G. Wang, Q. Deng, D. H. Ng and H. Zhao, ACS Appl. Mater. Interfaces, 2014, 6, 3008–3015 CrossRef CAS PubMed.
- Y. Lu, B. Jiang, L. Fang, F. Ling, J. Gao, F. Wu and X. Zhang, Chemosphere, 2016, 152, 415–422 CrossRef CAS PubMed.
- P. Alulema-Pullupaxi, P. J. Espinoza-Montero, C. Sigcha-Pallo, R. Vargas, L. Fernandez, J. M. Peralta-Hernandez and J. L. Paz, Chemosphere, 2021, 281, 130821 CrossRef CAS PubMed.
- J. Dasgupta, J. Sikder, S. Chakraborty, S. Curcio and E. Drioli, J. Environ. Manage., 2015, 147, 55–72 CrossRef CAS PubMed.
- R. Rakhunde, L. Deshpande and H. D. Juneja, Crit. Rev. Environ. Sci. Technol., 2012, 42, 776–810 CrossRef CAS.
- M. Herrero and D. C. Stuckey, Chemosphere, 2015, 140, 119–128 CrossRef CAS PubMed.
- T. Jiang, W. Liu, Y. Mao, L. Zhang, J. Cheng, M. Gong, H. Zhao, L. Dai, S. Zhang and Q. Zhao, Chem. Eng. J., 2015, 259, 603–610 CrossRef CAS.
- N. S. Alsaiari, A. Amari, K. M. Katubi, F. M. Alzahrani, F. B. Rebah and M. A. Tahoon, Processes, 2021, 9, 576–591 CrossRef CAS.
- S. P. Singh, K. Rathinam, R. Kasher and C. J. Arnusch, RSC Adv., 2018, 8, 27027–27036 RSC.
- A. P. Côté, A. I. Benin, I. B. Annabelle, N. W. Ockwig, M. O’Keeffe, A. J. Matzger and O. M. Yaghi, Science, 2005, 310, 1166–1170 CrossRef PubMed.
- N. Huang, L. Zhai, H. Xu and D. Jiang, J. Am. Chem. Soc., 2017, 139, 2428–2434 CrossRef CAS PubMed.
- Y. Li, C. Wang, S. Ma, H. Zhang, J. Ou, Y. Wei and M. Ye, ACS Appl. Mater. Interfaces, 2019, 11, 11706–11714 CrossRef CAS.
- Q. Lu, Y. Ma, H. Li, X. Guan, Y. Yusran, M. Xue, Q. Fang, Y. Yan, S. Qiu and V. Valtchev, Angew. Chem., Int. Ed. Engl., 2018, 57, 6042–6048 CrossRef CAS.
- X. H. Xiong, Z. W. Yu, L. L. Gong, Y. Tao, Z. Gao, L. Wang, W. H. Yin, L. X. Yang and F. Luo, Adv. Sci., 2019, 6, 1900547 CrossRef PubMed.
- L. Zhang, Y. Li, Y. Wang, S. Ma, J. Ou, Y. Shen, M. Ye and H. Uyama, J. Hazard. Mater., 2021, 407, 124390 CrossRef CAS PubMed.
- A. R. Abdellah, H. N. Abdelhamid, A.-B. A. A. M. El-Adasy, A. A. Atalla and K. I. Aly, J. Environ. Chem. Eng., 2020, 8, 104054 CrossRef CAS.
- B. Dong, W. J. Wang, S. C. Xi, D. Y. Wang and R. Wang, Chemistry, 2021, 27, 2692–2698 CrossRef CAS.
- Y. Li, C.-X. Yang, H.-L. Qian, X. Zhao and X.-P. Yan, ACS Appl. Nano Mater., 2019, 2, 7290–7298 CrossRef CAS.
- W. Tan, X. Wu, W. Liu, F. Ye and S. Zhao, ACS Appl. Mater. Interfaces, 2021, 13, 4352–4363 CrossRef CAS PubMed.
- Y. Li, T. Hu, R. Chen, R. Xiang, Q. Wang, Y. Zeng and C. He, Chem. Eng. J., 2020, 398, 125566–125573 CrossRef CAS.
- S. Jansone-Popova, A. Moinel, J. A. Schott, S. M. Mahurin, I. Popovs, G. M. Veith and B. A. Moyer, Environ. Sci. Technol., 2019, 53, 878–883 CrossRef CAS PubMed.
- A. Lace, D. Ryan, M. Bowkett and J. Cleary, Int. J. Environ. Res. Public Health, 2019, 16, 1803–1813 CrossRef CAS PubMed.
- H. J. Da, C. X. Yang and X. P. Yan, Environ. Sci. Technol., 2019, 53, 5212–5220 CrossRef CAS.
- S. Chen, Y. Huang, X. Han, Z. Wu, C. Lai, J. Wang, Q. Deng, Z. Zeng and S. Deng, Chem. Eng. J., 2018, 352, 306–315 CrossRef CAS.
- B. Saha and C. Orvig, Coord. Chem. Rev., 2010, 254, 2959–2972 CrossRef CAS.
- T. S. Khayyun and A. H. Mseer, Appl. Water Sci., 2019, 8, 170 CrossRef.
- J. Lin and L. Wang, Front. Environ. Sci. Eng. China, 2009, 3, 320–324 CrossRef CAS.
- C. A. Seipp, N. J. Williams, V. S. Bryantsev and B. A. Moyer, Sep. Sci. Technol., 2017, 53, 1864–1873 CrossRef.
- X. Zhuang, J. Hao, X. Zheng, D. Fu, P. Mo, Y. Jin, P. Chen, H. Liu, G. Liu and W. Lv, Sep. Purif. Technol., 2021, 274, 118993–118999 CrossRef CAS.
Footnotes |
| † Electronic supplementary information (ESI) available. See DOI: https://doi.org/10.1039/d3ra03726f |
| ‡ Chang Du and Xiaodi Chen should be considered as first authors. |
| This journal is © The Royal Society of Chemistry 2023 |

