 Open Access Article
Probing the structure of human tRNA3Lys in the presence of ligands using docking, MD simulations and MSM analysis†
Mallikarjunachari V. N. Uppuladinne ,
Archana Achalere,
Uddhavesh Sonavane
 * and
Rajendra Joshi
High Performance Computing – Medical and Bioinformatics Applications, Centre for Development of Advanced Computing (C-DAC), Panchavati, Pashan, Pune, India. E-mail: uddhaveshs@cdac.in
First published on 30th August 2023
Abstract
The tRNA3Lys, which acts as a primer for human immunodeficiency virus type 1 (HIV-1) reverse transcription, undergoes structural changes required for the formation of a primer–template complex. Small molecules have been targeted against tRNA3Lys to inhibit the primer–template complex formation. The present study aims to understand the kinetics of the conformational landscape spanned by tRNA3Lys in apo form using molecular dynamics simulations and Markov state modeling. The study is taken further to investigate the effect of small molecules like 1,4T and 1,5T on structural conformations and kinetics of tRNA3Lys, and comparative analysis is presented. Markov state modeling of tRNA3Lys apo resulted in three metastable states where the conformations have shown the non-canonical structures of the anticodon loop. Based on analyses of ligand–tRNA3Lys interactions, crucial ion and water mediated H-bonds and free energy calculations, it was observed that the 1,4-triazole more strongly binds to the tRNA3Lys compared to 1,5-triazole. However, the MSM analysis suggest that the 1,5-triazole binding to tRNA3Lys has brought rigidity not only in the binding pocket (TΨC arm, D–TΨC loop) but also in the whole structure of tRNA3Lys. This may affect the easy opening of primer tRNA3Lys required for HIV-1 reverse transcription.
Introduction
The human immunodeficiency virus type 1 (HIV-1) requires human tRNA3Lys for its reverse transcription process. The 3′ terminal 18 nucleotides of tRNA3Lys bind to the Primer Binding Site (PBS) of the viral genome (vRNA) in a complementary manner and form a reverse transcription primer–template complex with the help of a chaperone protein called nucleocapsid (NC).1–10 The formation of the vRNA/tRNA primer–template complex requires the unfolding of the 3D structure of the primer tRNA3Lys and opening of base-pairing in the acceptor and TΨC arms. Annealing between the tRNA and vRNA of the reverse transcription initiation complex is proposed to be achieved by the mature NC.11–15 NMR studies showed that the NC protein may not be required for the formation of the primer–template complex; instead, it may help in accelerating the process. The unwinding process could be initiated by the unpaired 3′ CCA end of the tRNA3Lys and the unpaired bases from the acceptor and TΨC stem junction.16–20As per the Isel et al., the entire reverse transcription initiation of HIV-1 using tRNA3Lys as primer takes place via multi step process. Initially the tRNA3Lys gets opened by breaking of U66-U67 interaction by the HIV-1 NC.17,21 Prior to the entire acceptor stem opening, the CCA 3′ end of tRNA3Lys gets annealed to the PBS of viral RNA. Next, antiPAS/PAS interations initiates the opening of TΨC-arm as well as D-arm.22 These findings were supported by Tisne et al. with their in tube heat-annealing experiment of tRNA3Lys and viral RNA. They have observed two weak peaks corresponding to the U66 and U67 imino protons at 15 °C. They have also reported about the PBS and anti-PBS hybridization at 25 °C. Apart from this, they have found that one crucial tertiary interaction between T54 and A58 in TΨC loop remains stable even at 60 °C.17,21,22
The zinc fingers of NC are also involved in destabilization of the tertiary interactions between the D loop and TΨC loop.16,21 The reverse transcriptase (RT) enzyme of HIV-1 binds to the primer–template complex and forms the actual reverse transcription initiation complex. The anticodon of tRNA3Lys and A-loop of viral RNA interaction are also important to build the correct functional complex.1–7 The modified bases present at the anticodon region are critical for maintaining the stability of the complex system.23–25 The studies regarding the requirement of tRNA3Lys for HIV-1 reverse transcription initiation and the detailed process have been thoroughly discussed in a review paper.22
A number of experiments and computational studies have been carried out to target tRNA3Lys to inhibit the HIV-1 reverse transcription either by small molecules, or by antisense oligomers.22,26–29 Several molecular dynamics simulations studies of tRNA molecules have been carried out to understand the effect of modified bases, folding, dynamics, binding of ligands, allostery etc.30–35
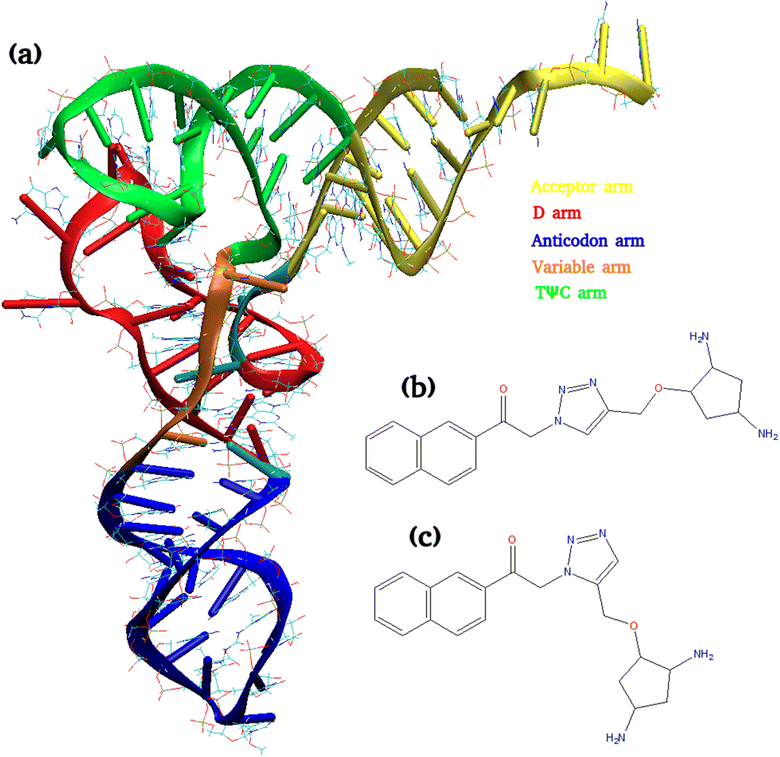
One of the established strategies in drug discovery in recent years is the fragment-based approach.36–38 The goal of this method is to build drug leads in pieces, through the identification of moderately binding fragments that are either expanded or linked together. Experimental studies have been reported to identify the small molecules targeting tRNA3Lys, the HIV-1 reverse transcription primer, in a fragment-based approach. The small molecules targeting the primer tRNA3Lys to destabilize tRNA/vRNA complex have been investigated in a therapeutic angle.39 Binding of a library of compounds to the different tRNAs like tRNA3Lys, tRNAfmet, tRNAphe, was monitored in a TROSY experiment which showed improved affinity and specificity for the D-arm region for tRNA3Lys.39 Many studies have been focused on the peptides targeted to the D arm of tRNA3Lys and their effect on initiation of reverse transcription.39–41 It has been reported that diaminocyclopentanol (DACP) and kynuramine are millimolar binders of the target tRNA3Lys.39,40 These two fragments were evolved and connected via a 1,2,3-triazole moiety leading to a second generation of compounds. The ligation of two molecules via a 1,2,3-triazole moiety is a very popular strategy in chemical biology and has been extensively used.42–44 In order to study in depth, the influence of the linker on the binding of DACP and kynuramine compounds, 1,4-triazole (1,4T) moiety is changed as its isomer 1,5-triazole (1,5T). This modification is expected to change the orientation between the two fragments without modifying the chemical nature or size of the molecule. The structures of these two ligands are shown in Fig. 1. The NMR and experimental studies have been earlier reported to understand the differences in the binding affinities of 1,4T and 1,5T towards tRNA3Lys and they show how the orientation of the two fragments can have a substantial impact on the location of the binding sites on the RNA target. The structural insight into the binding of ligands on the target RNA at atomic level using computational methods may help in understanding and designing novel molecules. The detailed information about the location of binding sites and the interactions of these ligands with the residues of target RNA may throw more light in designing fragment based novel ligands against tRNA3Lys.45
Here, an attempt has been made to explore the conformational ensemble of tRNA3Lys in the apo form as well as in the presence of ligands. The two ligands (1,4T and 1,5T) docked with tRNA3Lys have been used as a probe to gain structural insight of the tRNA3Lys using molecular simulations. Multiple simulations for ligand free and ligand bound systems of tRNA3Lys have been carried out to explore conformational space of tRNA3Lys. The trajectory analysis has been done for RMSD, RMSF, H-bond interactions, MM-GBSA free energy, tRNA–ligand interactions. It is realized that to analyse the drug molecules, only binding affinities are not important but kinetics is also a crucial factor in determining the drug efficacy.46,47 Therefore, Markov State Modeling (MSM) was performed to probe the kinetics of apo tRNA3Lys and ligand bound tRNA3Lys systems. Markov state model is a statistical model which can be built on an ensemble of short trajectories sampled from different regions of the free energy landscape of the system.48–51 MSM networks describe long-timescale dynamics and equilibrium properties. Also, MSM analysis provides deeper insights to the conformational ensemble of biomolecules at atomic resolution.52,53
The kinetically connected metastable states were obtained using Markov State modeling of MD simulation trajectories of tRNA3Lys systems. This may help to understand conformational rearrangement undergone by tRNA3Lys to adopt the ligand in the D–TΨC loop junction. Later, a comparative analysis of all the three systems apo, 1,4T and 1,5T ligand bound tRNA3Lys have been presented here.
Methods
Start structures and parameters
The X-ray crystal structure of the tRNA3Lys solved at 3.3 Å [PDB id 1FIR]54 which is available with the PDB database was used as the starting structure. The ligands 1,4-triazole and 1,5-triazole were built as reported in literature45 by using the molecular visualization and building tool Gaussview.55 The parameters for the nonstandard/modified nucleotide bases were calculated for earlier work26 based on the following methodology which was used for ligand molecules as well. The parameters for the two ligand molecules and modified bases present in tRNA3Lys were derived from AMBER force field ff12SB. Partial atomic charges were calculated by performing single point energy calculations at Hartree–Fock level using 6-311G* basis set to obtain electrostatic potential charges. Electronic structure calculations were performed with the Gaussian03 package.56Molecular docking
The crystal structure of the tRNA3Lys is considered as a receptor and the 1,4T and 1,5T molecules are considered as ligands in the docking methodology. Since, considering multiple conformations for the target structure is computationally expensive, the target tRNA3Lys is considered as a single static structure for docking and multiple conformations are considered for both the ligands. The receptor file was used to select spheres in the receptor in the process of receptor preparation by the DOCK6 program.57 Hydrogen atoms were removed and the tRNA3Lys was prepared using UCSF Chimera.58 The solvent-accessible surface of the tRNA3Lys binding site was calculated using a probe radius of 1.4 Å by using the DMS program in the DOCK6 software package. Receptor spheres were generated using the program SPHGEN. Spheres covering the hotspot were selected within 10 Å from the positions of the heavy atoms of the critical residues in the D–TΨC interacting region taken from literature.45 The grid box that enclosing the selected spheres was generated with an extra 5 Å added in each dimension. Ligand flexibility was employed during the docking process using the DOCK6 module with output presented as grid scores. Docking of both the ligands against different tRNA crystal structures and MSM representative structures of each macrostate, apart from tRNA3Lys was also carried out.Molecular dynamics simulations of docked complexes
The molecular dynamics (MD) simulations were carried out using AMBER12 (ref. 59) program with ff12SB force field.60 The highest grid score (most negative) docking conformations generated by DOCK6 were taken as initial conformations for MD simulations. The two systems (tRNA3Lys–1,4T and tRNA3Lys–1,5T) with their respective ligands having high grid score and one apo system (tRNA3Lys apo) considered as starting structures for MD simulations. The topology parameters of all systems were created by using the XLEAP module of AmberTools. All the systems were neutralized by adding Mg2+ ions and solvated with a TIP3P61 water box. Energy minimization was carried out for all the systems by using the steepest descent method for 5000 steps. Then temperature ramping was carried out at a temperature range of 50 K to 300 K for 100 ps, by using constraints of 100 kcal mol−1. Equilibration was done by gradually reducing the constraints for 500 ps. The equilibration protocol of Cheatham was followed.62 Simulations were performed under periodic boundary conditions by employing the Particle Mesh Ewald63 technique to account for long range electrostatics. MD integration was carried out using a 2.0 fs time step, employing the SHAKE algorithm64 on all the hydrogen atoms and a nonbonded cutoff of 10.0 Å. The pair list was updated every 100 steps. Constant pressure (1 atm) and temperature (300 K) was maintained throughout the production simulation run. The systems were allowed to equilibrate under production run conditions for 1 ns before collection of data over 100 ns simulation time. Three sets of simulations for each complex system were carried out for 100 ns and the total 900 ns trajectories were used for the analysis.Data analysis
All the trajectories were analyzed using the PTRAJ module of AMBER12. The trajectories were collected at every 10 ps snapshots over 100 ns of simulation data. Trajectories and structures were visualized using VMD65 and UCSF Chimera.58 PTRAJ module was used for RMSD, hydrogen bonding, ion and water mediated interactions. The criterion for hydrogen bonding was set at 3.5 Å distance between electron donor atom and hydrogen of electron acceptor atom and 120° angle cut off. The area under the curve was calculated for H-bond plots. The MMGBSA module of AMBER12 was used for calculating the free energy. The water mediated interactions were calculated for all the trajectories by the CPPTRAJ module of AMBER.MM-GBSA calculations
The Molecular Mechanics/Generalized Born Surface Area (MM/GBSA) and Molecular Mechanics/Poisson-Boltzmann Surface Area (MM/PBSA) methods calculate binding free energies for macromolecules by combining molecular mechanics calculations and continuum solvation models.| ΔGbind = ΔH − TΔS = 〈ΔEgas〉 + 〈ΔGsol〉 − T〈ΔS〉 |
| ΔΔGbind = ΔGcomplex − (ΔGlig + ΔGrec) |
MSM analysis
Main objective of MSM analysis is to obtain long time kinetic information from short trajectories of MD simulation.49,50 This way it can capture slow structural changes from the pool of conformational ensembles generated by MD trajectories. Conformational transitions are essential to the functional role of biomolecules. These are rare events which can be captured by constructing a transition probability matrix on discretised conformational state space.53,69 To investigate three dimensional conformational landscape and kinetics of the metastable states of tRNA3Lys apo and ligand bound tRNA3Lys, Markov state modeling based analysis was performed on MD trajectory data of each system independently. To build Markov state models PyEMMA2.5.4 package was used.66 First, for feature selection VAMP67 score was calculated by choosing various features which are listed in the PyEMMA featurization module. VAMP score was calculated for features like residue mean distance, minimum RMSD and phosphate atom pair distance etc. The highest VAMP score was observed for the feature set of all phosphate atom pair distances. The VAMP score calculation is shown in ESI (Fig. S1†). After selecting features, time independent component analysis (tICA)68,69 was performed on the coordinates of all phosphate atom pairs. Which gave slow linear subspace by those input coordinates and a dimension reduction was achieved by projecting all coordinates on the 10 slowest tICA components. Where 90% of total kinetic variance is retained by these 10 components. First two tICA components for all the three systems were shown in ESI Fig. S2.† Later, this ten dimensional projected data was clustered into 200 microstates using a regular space clustering method. The lag time, the time scale at which the model is Markovian, was calculated by examining the implied time scales at different lag times. At a given lag time τ the implied time scale can be calculated aswhere, ti is the implied time scale and λ is an eigenvalue of the transition matrix T(t).
Lag time is the time interval where the conformational space is optimally discretized and each discretised state space represents the microstate of the system. System progresses dynamically through these discrete states at time points separated by lag time. Lag time interval is obtained such that the collective variables or features on which the discretised conformational space is projected are uncorrelated and their auto covariance is maximum at given lag time. The Markovian property of the MSM model is identified at a certain lag time τ above which the implied time scale t remains constant for further lag time. The lag was determined to be 5 ns for tRNA3Lys apo system, 6 ns for tRNA3Lys–1,4T system and 4 ns for tRNA3Lys–1,5T system (ESI Fig. S3†). The microstates were built using this lag time. Further, Markovian property was assessed by the Chapman Kolmogorov test. Markov states or macrosates are obtained by lumping together kinetically relevant microstates. Chapman Kolmogorov (CK) test gives the optimal number of macrostates that best explains the system's dynamical process. The CK test is performed to see how best the Markovianity of the state space is achieved i.e. transition from one state to another microstate, just depends on the state at time t and not the past transition history of the states. The 200 microstates were coarse grained into 3 macro states using Perron cluster cluster analysis (PCCA).70 The number of transitions between coarse grained macrostate at an interval of a certain lag time is counted and the count matrix is then symmetrized and normalized to obtain the transition probability matrix (T). The mean first passage time (MFPT) between each pair of states in the coarse-grained model was calculated using the MFPT calculation module given in Pyemma.
MSM validation for both apo and ligand bound tRNA3Lys
The validation of the MSMs for the 300 ns of MD simulation data for the tRNA3Lys apo and 600 ns MD data of ligand bound tRNA3Lys were Markovian in nature was done by performing Chapman Kologmorov test and lag time calculation for each of the three simulated systems separately. In MSM validation, a requirement for Markovian behavior is that the Markov state model of MD trajectory data should satisfy the Chapman–Kolmogorov equation and the implied timescales remain constant at different lag times. The timescale validation was done by observing the implied timescale plot at different lag times. The implied timescales for the 200-microstate model remain unchanged after a lag time of ∼5 ns (ESI Fig. S4†), which was thus used to construct the microstate MSM. Further to validate the number of macrostates, the MSM probabilities of microstates in a given macrostate at a given lag time was compared with probabilities directly calculated by trajectory data. These Chapman Kolmogorov tests of estimated and predicted probabilities of microstates were performed for all the three systems tRNA3Lys, tRNA3Lys–1,4T and tRNA3Lys–1,5T. The test was observed to be satisfying at 3 macrostates for all the three simulated systems (ESI Fig. S5†). Then two hundred representative structures were obtained from each of the three macrostates using PCCA. The three dimensional and two dimensional structural properties of these representative conformations from each macrostate of tRNA3Lys apo system were calculated. Kinetics of transitions within the conformations of these states were obtained by mean first-passage time (MFPTs) calculations.Results
Identification of binding location and orientation of ligands
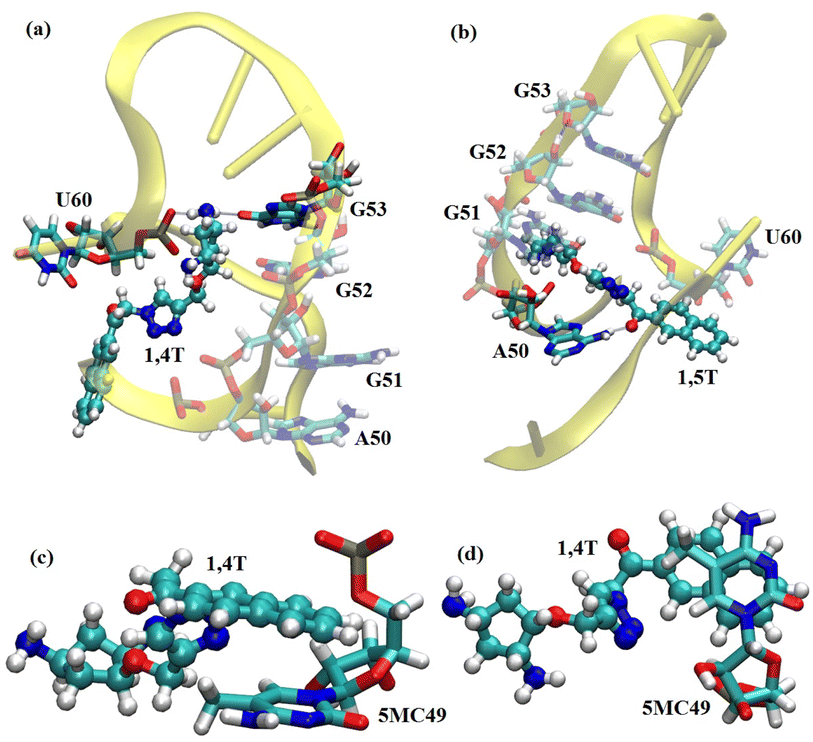
One of the objectives of the present study is to identify the binding location of the two ligands (1,4T and 1,5T) on tRNA3Lys target molecule and understand the dynamic behavior and stable interactions of ligands with tRNA3Lys. We docked these two ligands on to a tRNA3Lys by selecting the D and TΨC regions as binding pocket and sorted the ligand poses based on their grid scores. The top five best grid scores are given in Table 1 and the best pose for each complex are shown in Fig. 2. The docking results show only the static orientation of bound ligands. In order to further explore the efficiency of these ligands as effective tRNA3Lys inhibitors, molecular dynamics (MD) simulations and binding free energy calculations were carried out.| tRNA3Lys–1,4T system | tRNA3Lys–1,5T system | |
|---|---|---|
| Energy (kcal mol−1) | Energy (kcal mol−1) | |
| Rank 1 | −48.92 | −46.58 |
| Rank 2 | −47.65 | −44.91 |
| Rank 3 | −45.38 | −44.14 |
| Rank 4 | −44.76 | −42.42 |
| Rank 5 | −43.72 | −42.35 |
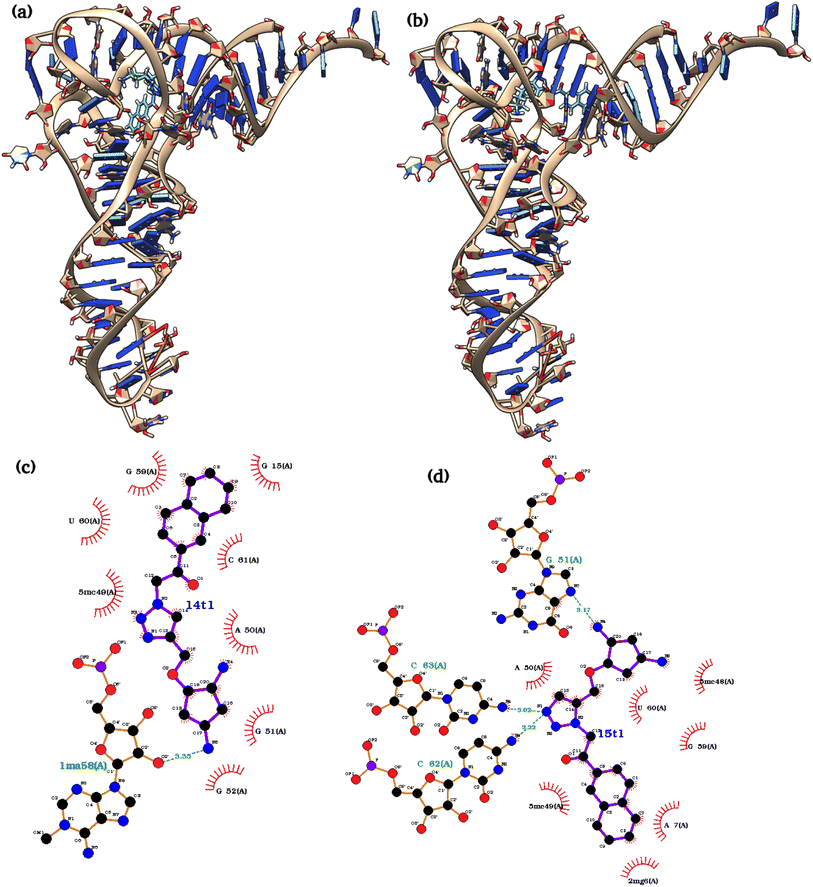 | ||
| Fig. 2 The structures of best docking poses of both ligands (a) tRNA3Lys–1,4T system (b) tRNA3Lys–1,5T system (c) ligplot of 1,4T interactions (d) ligplot of 1,5T interactions. | ||
To understand the binding specificity of these two ligands against tRNA3Lys, docking of these two ligands on different tRNAs like tRNAPhe, tRNAAsp have been carried out by considering the crystal structures. The selected tRNAs are from different sources namely, yeast, E. coli, synthetic, and their pdb ids are 1EHZ, 1VTQ, 3L0U, 4TNA and 3TRA respectively.71–75 The best docking scores of 1,4T and 1,5T ligands against selected tRNAs along with tRNA3Lys (1FIR) have been given in Table 2 and ESI Fig. S6.† Both the ligands showed best binding scores with tRNA3Lys as compared to other tRNAs.
From the docking results, the best pose for each ligand bound complex systems (tRNA3Lys–1,4T and tRNA3Lys–1,5T) along with a control system tRNA3Lys were selected for MD simulations. The aim of the MD simulations was to explore the structural dynamics of the tRNA3Lys apo as well as ligand-bound tRNA3Lys.
Intra and intermolecular interactions that affect the stability of the complexes
To find out the overall stability of the system, the hydrogen bonds were calculated for each system and compared. This stability was evaluated by calculating hydrogen bonding percentages (HB%) which is defined as the time over a hydrogen bond. A hydrogen bond is considered where the distance between donor and acceptor atoms is <3.5 Å and the angle between the donor atom, hydrogen attached to donor and the acceptor atom is <120°. These H-bonds include all intermolecular and intra-molecular interactions which satisfy the above criteria. The H-bonds are plotted here by taking the number of H-bonds on X-axis and their residence time on Y-axis as shown in Fig. 3. In case of the first trajectory set (R1) the tRNA3Lys system was showing the highest residence time for a higher number of H-bonds compared to the other two systems. But in the case of second and third trajectory sets (R2) and (R3) the tRNA3Lys–1,4T system was showing the highest residence time for a higher number of H-bonds compared to other two systems. Whereas the tRNA3Lys–1,5T system was always showing low residence time for less number of H-bonds in all the trajectory sets. These observations for tRNA3Lys–1,4T system can be attributed to greater stability of the system. The area under the curve was also calculated for these H-bond plots and given in ESI Table S7.† The values of the area under the curve for the tRNA3Lys–1,4T system was higher as compared to tRNA3Lys system and tRNA3Lys–1,5T system for two sets of trajectories.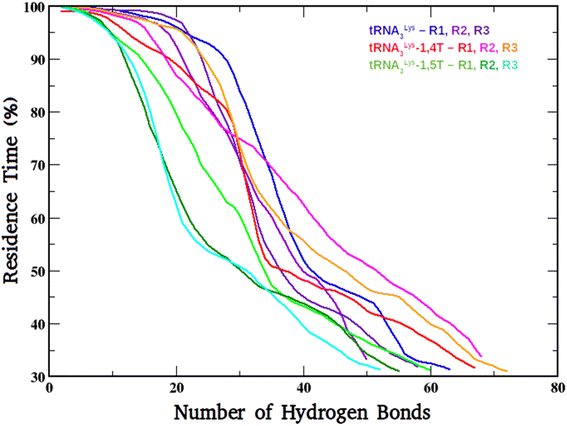 | ||
| Fig. 3 The H-bonding plot of tRNA3Lys system, tRNA3Lys–1,4T system and tRNA3Lys–1,5T systems for all the three simulation runs (R1, R2, R3). | ||
The intermolecular interactions between the ligand and tRNA3Lys were also calculated as they may also play an important role in the complex stability and functionality of the system. The detailed list of H-bond interactions between ligand and tRNA3Lys for the two complexes tRNA3Lys–1,4T system and tRNA3Lys–1,5T system were given in Table 3. In the case of tRNA3Lys–1,4T system, the 1,4T ligand interacts with G52, G53 and U60 residues of tRNA3Lys through H-bonds. The 1,4T ligand forms strong and stable H-bonds with G53 and U60 for more than 70% of simulation time (Fig. 4a). The particular H-bond interaction of the 1,4T ligand with U60 residue tRNA3Lys was observed in all the three sets of simulations indicating that it might be one of the crucial interactions. In the tRNA3Lys–1,5T system, the 1,5T ligand interacts with A50 residue of tRNA3Lys through H-bonds (Fig. 4b). The 1,5T ligand forms H-bonds with A50 which are stable for not more than 50% of simulation time as given in Table 3. It was also observed that the aromatic ring of 1,4T ligand formed stacking interactions with 5MC49 (5-methylcytosine) residue of tRNA3Lys as shown in Fig. 4c and d. Since the intermolecular interactions are found to be high for the tRNA3Lys–1,4T system as compared to tRNA3Lys–1,5T system, which may infer that the 1,4T ligand shows strong binding to the tRNA3Lys. The additional stacking interactions found for tRNA3Lys–1,4T system may also support the greater stability of the 1,4T ligand binding. The complete list of ligand interactions with the tRNA3Lys are given in ESI Table S8.†
| Residues | H-bond | tRNA3Lys–1,4T system | tRNA3Lys–1,5T system | ||||
|---|---|---|---|---|---|---|---|
| Traj1 | Traj2 | Traj3 | Traj1 | Traj2 | Traj3 | ||
| A50–Lig | N6–H62⋯O1 | — | — | — | — | 46.77% | — |
| A50–Lig | N6–H62⋯O1 | — | — | — | — | 45.98% | — |
| A50–Lig | N6–H62⋯N1 | — | — | — | — | — | 44.58% |
| G52–Lig | O6⋯H23–N5 | — | — | 54.37% | — | — | — |
| G53–Lig | O6⋯H23–N5 | 91.07% | — | — | — | — | — |
| U60–Lig | O2P⋯H22–N5 | 77.92% | 75.15% | 56.94% | — | — | — |
Identification of ion and water mediated interactions in the complexes
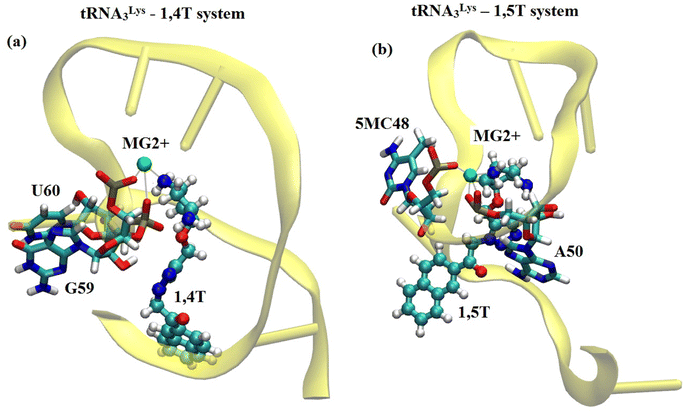
Apart from the intermolecular interactions between ligand and tRNA3Lys, the water mediated and ion mediated interactions were also identified in the systems. It has been identified from the MD simulations of tRNA3Lys–1,4T system that one of the Mg2+ ions was able to maintain stable interaction with the N5 atom of 1,4T ligand molecule with a 2 Å distance as shown in Fig. 5. The same Mg2+ ion was able to maintain H-bond interaction with residue G59 of tRNA3Lys. It also shows a weak interaction with the residue U60 of tRNA3Lys. This particular Mg2+ ion mediated interaction was in coordination with the ligand and the G59, U60 residues of TΨC arm which may strengthen the complex. In the case of tRNA3Lys–1,5T system, it has been seen that one of the Mg2+ ions was able to maintain stable interaction with the N5 atom of 1,5T ligand molecule with a 2 Å distance. It also shows a weak interaction with the residue 5MC48 (5-methylcytosine) of tRNA3Lys. The particular interactions of these two ligands (1,4T and 1,5T) with the Mg2+ ions have been found to be quite stable. The maintenance of stable interaction of Mg2+ ions with particular residues may also help the overall stability of the specific TΨC loop or whole structure. The distance of few Mg2+ ions with the bound ligand and tRNA3Lys for combined trajectories (last 50 ns of each run of respective trajectories joined together to make combined trajectory of 150 ns) have been given in ESI Fig. S9.†The water molecules which are present in proximity interact with specific residues and may play an important role in the stability or functionality of the system. According to Roh et al.76 higher density of water molecules makes the tRNA more flexible. In simulations, the number of water molecules in the lower hydration shell was determined using the criterion that the water oxygen atoms were within 3.4 Å of non-hydrogen atoms of the tRNA3Lys. The distance criteria for the upper hydration shell was 5 Å. We have also calculated lower and upper hydration shells specifically for ligands. It was observed that the tRNA3Lys–14T system showed slightly higher hydration number compared to tRNA3Lys–15T system. However, in case of hydration shell around the ligands, the 1,4T ligand show more number of water molecules compare to 1,5T ligand as shown in ESI Fig. S10.† The residues which are involved in water mediated interactions and have their residence time above 40% are given in ESI Table S11.† In the case of the tRNA3Lys apo system, the residue 2MG6 (2N-methyl guanosine) interacts with a water molecule for the highest simulation time of 60.12%. The residues of tRNA3Lys form a maximum of 12 interactions with water molecules above 40% of simulation time in a trajectory. In all the three trajectories of tRNA3Lys, five water mediated interactions above 50% of simulation time have been observed. In the case of the tRNA3Lys–1,4T system, the residue C13 interacts with the two water molecules for the highest simulation time of 77.85% and 76.13% respectively. The residues of tRNA3Lys form maximum 14 interactions with water molecules above 40% of simulation time in a trajectory for tRNA3Lys–1,4T system. In all the three trajectories of tRNA3Lys–1,4T system, six water mediated interactions above 50% of simulation time have been observed. In the case of tRNA3Lys–1,5T system, the residue PSU27 (pseudouridine) is showing interaction with the water molecule for the highest simulation time of 58.19%. The residues of tRNA3Lys form maximum 11 interactions with water molecules above 40% of simulation time in a trajectory for tRNA3Lys–1,5T system. In all the three trajectories of tRNA3Lys–1,5T system, five water mediated interactions above 50% of simulation time have been observed. The water mediated interactions for the three complex systems are shown in Fig. 6.
 | ||
| Fig. 6 The water mediated interactions of various residues of all the three complexes (a) tRNA3Lys system (b) tRNA3Lys–1,4T system (c) tRNA3Lys–1,5T system. | ||
It has been observed from the water mediated interactions that majority of the water molecules are interacting with TΨC arm residues for all the three systems as given in ESI Table S11.† In case of the tRNA3Lys apo system, out of 5 water mediated interactions three are with D-arm and one for each with TΨC arm and anticodon arm were formed. In case of tRNA3Lys–1,4T system, out of 8 water mediated interactions four for each with D-arm and TΨC arm were formed. No water mediated interactions were formed with anticodon residues for the tRNA3Lys–1,4T system. In case of tRNA3Lys–1,5T system, out of 8 water mediated interactions 2, 3 and 3 interactions formed with D-arm, TΨC arm and anticodon arm respectively.
Structural stability/binding free energy of the three complexes
The binding free energies were calculated for the two ligands with tRNA3Lys by MMGBSA method. These calculated free energy values for both the ligand bound complexes tRNA3Lys–1,4T system and tRNA3Lys–1,5T system were compared and shown in Fig. 7. In both the complexes, the tRNA3Lys was considered as a receptor and 1,4T and 1,5T were considered as ligands for their respective systems in the MMGBSA free energy calculations. The average ΔG values for three trajectory sets of tRNA3Lys–1,4T system are −64.58 kcal mol−1, −57.18 kcal mol−1 and −65.68 kcal mol−1 respectively. The average ΔG values for three trajectory sets of tRNA3Lys–1,5T system are −33.90 kcal mol−1, −24.04 kcal mol−1 and −35.02 kcal mol−1 respectively. However, the average ΔG values vary for different trajectories of the same complex but the difference between both the complexes are maintaining consistent ΔG values. These results indicate that the 1,4T ligand may strongly bind to the tRNA3Lys. All the MMGBSA free energy components for both the ligand bound systems were given in ESI Table S12.† It has been observed that dihedral angle energies and van deer Walls energies are the major contributions for overall free energy of these systems.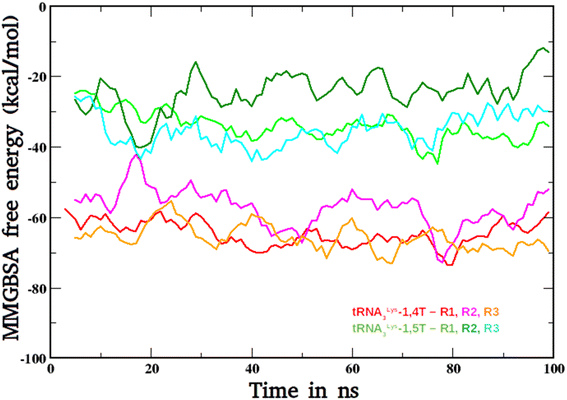 | ||
| Fig. 7 The MMGBSA-free energy plots of tRNA3Lys–1,4T system and tRNA3Lys–1,5T systems for all the three simulation runs (R1, R2, R3). | ||
Exploring conformational flexibility and kinetics using MSM analysis
MSM analysis was performed to understand global conformational landscape as well as local conformational landscape of tRNA3Lys apo and 1,4T and 1,5T ligand bound tRNA3Lys systems. MSM analysis was performed on the tRNA3Lys apo system and then the 1,4T and 1,5T bound tRNA3Lys systems. The trajectories were analysed by MSM to understand local and global kinetics of transitions in the conformations of tRNA3Lys apo system as well as perturbations in the conformations induced by ligands.MSM structural insights to tRNA3Lys apo system
To quantify global structural variations among the macrostates obtained by MSM analysis, an average RMSD of 200 conformations from each macrostate of tRNA3Lys apo system was calculated. The three average values of RMSD of the whole structure representing the three macrostate conformations of tRNA3Lys apo systems were compared with the average RMSD values of the MSM macrostates of 1,4T and 1,5T systems. The average RMSD values and standard deviations are given in Table 4. RMSD of tRNA3Lys apo, MSM macrostate conformations were observed to be having wide range of values (8.38 Å, −1.33 Å) and standard deviation values (∼1.5 Å) indicate that apo tRNA3Lys MSM conformations belonging to different macrostate possess more degrees of freedom and flexibility. To assess the flexibility in the whole tRNA3Lys structure and quantify the local variations which were contributing maximum to overall conformational degrees of freedom, RMSD of different regions of tRNA3Lys apo system were calculated viz D loop, TΨC loop and anticodon regions. These region-specific RMSD values were calculated for the MSM macrostate of tRNA3Lys apo and tRNA3Lys–1,4T and tRNA3Lys–1,5T systems. As compared to the pdb structure (PDB id 1FIR) the conformations drawn from second (green) and third (blue) MSM macrostates of tRNA3Lys apo have shown deviation of the anticodon loop. It was also captured in RMSD values which were varying in the range (1 Å to 6 Å). The RMSD for anticodon regions of conformations from 1st MSM macrostate (red) were observed to be conserved with respect to pdb structure. However, D loop RMSD values in case of tRNA3Lys apo system were seen to have high fluctuations for conformations belonging to the third (blue) macrostate and in consequence this may indicate the distortion of the secondary structure base pairing in D arm. RMSD for the TΨC loop of the three macrostates of tRNA3Lys apo showed fluctuation in the range of 2 Å to 4 Å indicating that TΨC loop is conserved in all the three macrostate conformations.| RMSD | MSM metastable state | Average RMSD (Å) | Standard deviation (Å) | Minimum RMSD (Å) | Maximum RMSD (Å) |
|---|---|---|---|---|---|
| tRNA3Lys | PCCA1 | 5.091 | 1.514 | 1.57 | 8.384 |
| PCCA2 | 4.826 | 1.476 | 1.523 | 8.339 | |
| PCCA3 | 4.135 | 1.66 | 1.339 | 8.223 | |
| tRNA3Lys–1,4T | PCCA1 | 5.456 | 0.495 | 4.446 | 6.798 |
| PCCA2 | 5.57 | 0.49 | 4.329 | 6.754 | |
| PCCA3 | 5.572 | 0.573 | 3.853 | 6.766 | |
| tRNA3Lys–1,5T | PCCA1 | 5.652 | 0.319 | 4.403 | 6.5 |
| PCCA2 | 5.203 | 0.385 | 4.526 | 6.251 | |
| PCCA3 | 5.532 | 0.25 | 4.483 | 6.287 |
Earlier NMR studies have reported77 that the tRNA3Lys apo structure has a complex three dimensional structural landscape. The MSM analysis reported here has shown that there were majorly three macrostate conformations which dominate the three dimensional conformational space of tRNA3Lys apo. These macrostates were verified using the Chapman Kolmogorov test. Conformations belonging to distinct macrostates were further analysed by calculating base pair (secondary and tertiary interactions) distances from four main regions of the tRNA3Lys apo system, viz acceptor arm, D arm, TΨC arm and anticodon arm. The base pairs distances which are responsible for formation of secondary and tertiary structures and reported in NMR studies77 were calculated for all the 200 conformations belonging to each of the three macrostates of tRNA3Lys apo. The G6–U67 pair which is responsible for formation of secondary structure of the acceptor arm was found to be fluctuating with a broad range of values ∼3 Å to 15 Å which indicates that acceptor arm in tRNA3Lys apo has diverse range of conformation in all the three macrostates (ESI Fig. S13†). The D arm intra interactions namely U8–A14, C13–G22 and A14–A21 were calculated (Fig. 8) to check the stability of secondary structure in all the three macrostate conformations of tRNA3Lys apo system. Although, U8–A14 and C13–G22 interaction distances were observed to be conserved, A14–A21 distance was observed to be varying in the range of 10 Å to 14 Å in all the three macrostates, which indicates that D loop structure spans wide range of conformations for A14–A21 interaction. The tertiary interactions across D and TΨC loops of tRNA3Lys which are known to form tertiary structure, mainly U16–G59, G18–Ψ55 and G19–C56 (Fig. 9) were observed to be greater than 12 Å in all the three microstates of tRNA3Lys apo system.
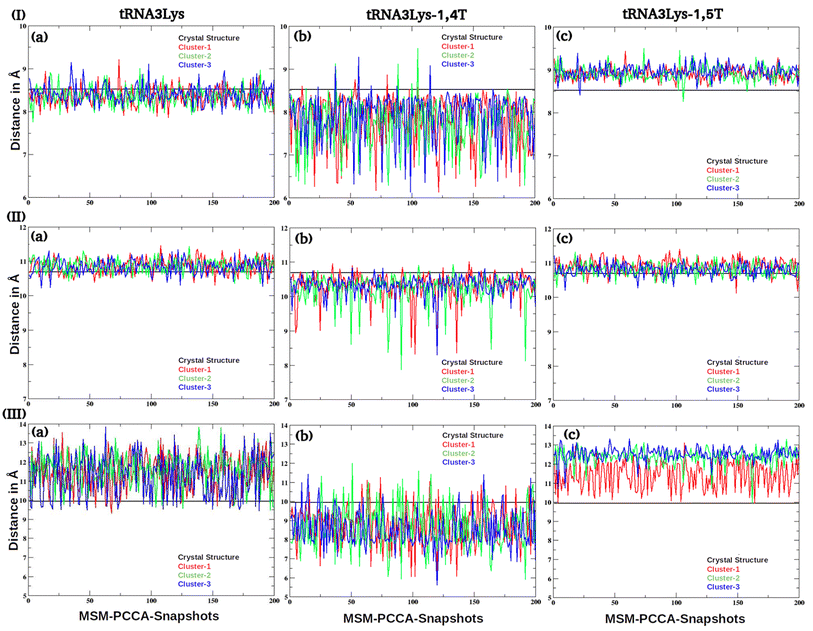 | ||
| Fig. 8 The inter residue distances of (I) U8–A14, (II) C13–G22 and (III) A14–A21 base pairs were given for (a) tRNA3Lys (b) tRNA3Lys–14,T and (c) tRNA3Lys–1,5T complexes. | ||
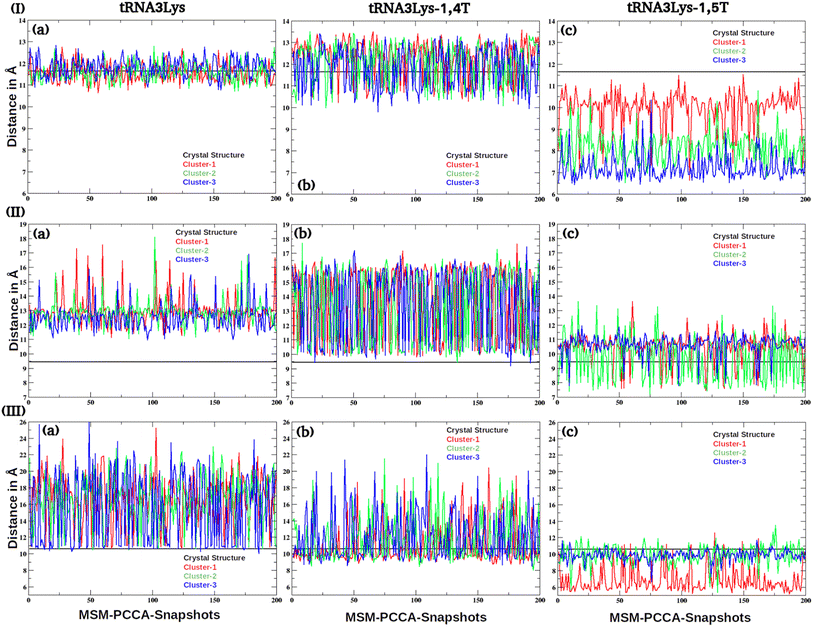 | ||
| Fig. 9 The inter residue distances of (I) U16–G59, (II) G18–Ψ55 and (III) G19–C56 interactions were given for (a) tRNA3Lys (b) tRNA3Lys–14,T and (c) tRNA3Lys–1,5T complexes. | ||
The residue–residue interaction distances across D and TΨC loop indicate the opening of tertiary structure and flexibility of TΨC loop. The major structural difference in 3D conformations segregated by MSM macrostates were observed in the anticodon arm as shown in Fig. 10.
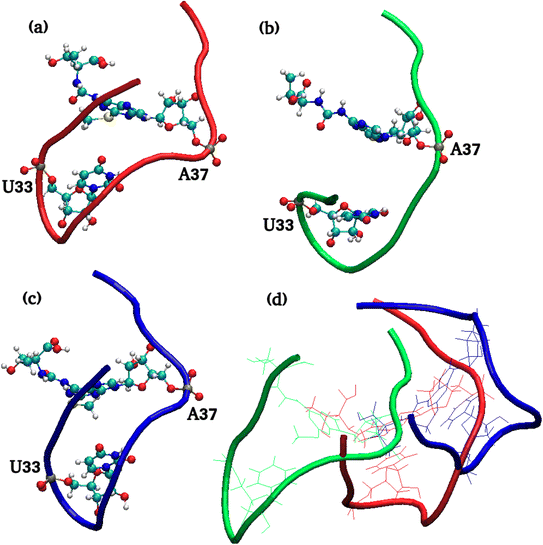 | ||
| Fig. 10 MSM macrostate structures of anticodon loop of (a) tRNA3Lys (b) tRNA3Lys–14T (c) tRNA3Lys–15T and (d) 3 structures superimposed. Residues 33 and 37 are shown in CPK style. | ||
To quantify anticodon structural insights of MSM macrostates, U33–A37 interaction distance which lies in the anticodon loop of tRNA3Lys was calculated. It was observed that the first macrostate (red) of tRNA3Lys apo maintains this distance as that of PDB crystal structure. On the other hand, the remaining two MSM states of tRNA3Lys apo systems (green and blue structures) have shown that more than 90% of conformers have a wide range of variation in the U33–A37 interaction distance. This may indicate that the anticodon loop of tRNA3Lys apo attains noncanonical conformational metastable states. Apart from anticodon loop structural deviations, the D loop and TΨC loop interaction (C11–G45) was shown wide range of variation ∼9 Å to 14 Å (ESI Fig. S14†) in all the three MSM metastable states.
The mean time required for the tRNA3Lys apo system to reach a given ending macrostate j from a different starting macrostate i, is known as the mean first passage time (MFPT for i to j). The MFPT times were calculated for three macrostates obtained by MSM analysis. The value of MFPT is inversely proportional to the rate of transitions between any two macrostates and the difference in MFPT of any two macrosates indicates difference in heights of free energy barriers of those states. The transition for tRNA3Lys apo ranges from 1 ns to 260 ns and has an average value of 111.80 ns for all 3 possible transitions. MFPT for all the macrostates of tRNA3Lys apo system are shown in Fig. 11. Transitions from state-1 to state-3 and from state-2 to state-3 occurred most quickly which were approximately 1 ns for both the paths. The slowest transition was observed from state-3 to state-1 which was measured to be 260 ns.
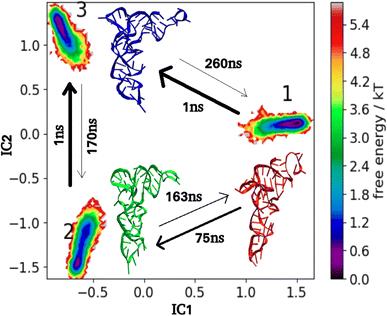 | ||
| Fig. 11 MSM macrostates and MFPT rates for tRNA3Lys apo. The arrows show MFPT in ns. The metastable representative structures 1, 2 and 3 are shown in red, green and blue colors respectively. | ||
Docking of 1,4T and 1,5T ligands against three representative structures, one from each MSM macrostate was carried out. The binding location and the docking scores have been given in ESI Fig. S15† and Table 2.
MSM structural insights to ligand bound tRNA3Lys
To investigate the effect of 1,4T bound and 1,5T bound ligands on tRNA3Lys conformations, the MSM analysis for 1,4T and 1,5T ligand bound systems were performed on MD trajectory data of each system. While constructing MSM metastable states the ligands were removed from the trajectory data to focus on structural variations induced in the three dimensional tRNA3Lys conformational landscape, by each ligand.The presence of ligands 1,4T or 1,5T was observed to be affected by decreasing the range of conformations explored by tRNA3Lys apo. The RMSD values for both the ligand systems were calculated for the whole system as well as region wise. The range of RMSD values of 1,4T system and 1,5T ligand bound systems were observed to be reduced (∼4 Å to 6 Å) i. e., approximately within ∼2 Å span of values as shown in Table 4. Whereas the tRNA3Lys apo system was shown to have quite a wider range of RMSD values (with the range of 6 Å).
To understand region wise effect of ligands on RMSD values, RMSD of anticodon arm, D loop and TΨC loop were calculated for all the conformations of MSM macrostates of both the ligand bound systems. The anticodon arm of the tRNA3Lys–1,4T system in all the three metastable states have shown a range of values (∼min 1.5 Å to max 5.5 Å) which was lesser than the tRNA3Lys apo anticodon RMSD range. However, D loop and TΨC loop RMSD of all the three macrostates conformers of 1,4T system have shown ∼1 Å increase in the range of values as compared to tRNA3Lys apo system. On the other hand, in the case of the 1,5T system, RMSD of the whole structure was seen to be significantly reduced (∼6.5 Å ± 2 Å) as compared to tRNA3Lys apo system. This global reduction in RMSD values was also observed in RMSD of the anticodon arm of the 1,5T system where it was seen to be significantly reduced in conformations from the first macrostate (red). The anticodon RMSD values for conformations in second (green) and third (blue) have more range of values indicating fluctuations in secondary structure of the anticodon region of the 1,5T system. In case of D arm, conformers from third (blue) MSM macrostate of 1,5T system have shown maximum fluctuations in RMSD values while conformers from first (red) and second (green) MSM macrostate have been observed to be significantly conserved as compared to the pdb structure.
The acceptor arm interaction G6–U67 was observed to be having a fluctuating wide range of values in a 1,4T ligand bound system which was similar to apo tRNA3Lys system. However, in case of 1,5T bound system variations of G6–U67 interaction distance (ESI Fig. S13†) was observed to be significantly reduced in conformers from first (red) and second (green) MSM macrostates whereas conformers in 3rd macrosates have similar kind of fluctuation range as compared to tRNA3Lys apo. The interactions U8–A14, C13–G22 and A14–A21 play an important role in secondary structure formation of the D loop, were calculated in ligand bound systems. The interactions U8–A14 and C13–G22 were found to be maintained in 1,4T and 1,5T MSM macrostate conformers (Fig. 8). However, the average distance between A14–A21 was observed to be reduced by 3 Å in the 1,4T ligand bound system as compared with tRNA3Lys apo (Fig. 8). Whereas, the same interaction (A14–A21) was shown to have wider range of variation in conformers from 1st macrostate (red) of 1,5T and the other two macrostate (blue and green) conformers have shown average increase in distance (∼13 Å). Therefore, the D loop secondary structure was found to be stable in the 1,4T bound system and disturbed due to increased distance of the A14–A21 interaction in the 1,5T system. The tertiary structure interactions across the D–TΨC loops, U16–G59, G18–Ψ55 and G19–C56 were calculated to understand how the three dimensional structural landscape of tRNA3Lys gets perturbed in the presence of ligands. In the 1,4T system, the G18–Ψ55 residue distance was observed to have large range of variation (∼10 Å to 16.5 Å) in all the three MSM macrostate conformers (Fig. 9). In the 1,5T system too, similar range of varying G18–Ψ55 distance was observed in only second MSM macrostate represented in green. Although, conformers belonging to first (red) and third (blue) macrostate have shown reduced fluctuation of G18–Ψ55 distance. Another tertiary structure forming base pair G19–C56 distance in the 1,4T system was observed to be fluctuating in the range of (9 Å to 19 Å) indicating instability of tertiary structure and widening of D–TΨC loop. However, in the 1,5T system the average distance between G19–C56 pairs was maintained in second (green) and third (blue) conformers and was observed to be closer to starting pdb structure distance ∼10.7 Å (Fig. 9). The conformers belonging to 1st MSM macrostate have shown reduction in average G19–C56 distance which is around 6.4 Å. This may indicate that the 1,5T ligand strengthens the tertiary structure across the D and TΨC loop as compared to 1,4T ligand. The anticodon loop interaction U33–A37 was observed to be lower by ∼2 Å in all the three macrostates of the 1,4T system. Whereas, the U33–A37 interaction pair in the 1,5T system was observed to be following the canonical loop structure in conformers belonging to the first (red) and third (blue) macrostate. But the 90% of conformers from the second macrostate (green) of the 1,5T system were found to be possessing a wide range of fluctuations (in the range of 6 to 13 Å). As compared to tRNA3Lys apo system, the D loop and TΨC loop interaction (C11–G45) in 1,4T system was observed with range of variation ∼11 Å to 14 Å (ESI Fig. S14†) in all the three MSM metastable states. On the other hand, in the case of the 1,5T system this tertiary structure interaction was seen to be significantly reduced (∼9 Å) which is 3 Å less than the PDB structure (ESI Fig. S14†).
To quantify the effect of 1,4T and 1,5T ligands, on the overall kinetics and transition pathway of tRNA3Lys, the mean first passage time (MFPT) matrix was calculated for both the systems. MFPT for 1,4T is shown in Fig. 12 and 1,5T is shown in Fig. 13. The change in distribution of transition of flux can be understood by transition time between any state i and state j. In the 1,4T system transitions from state-1 to state-3 (2 ns) and from state-2 to state-3 (0.6 ns) occurred most quickly. The slowest transition was seen from state 1 to state 2 (6303 ns). As compared to tRNA3Lys apo system, 1,4T system showed a significantly wide range of MFPT transitions (0.6 ns to 6303 ns). This may indicate that the 1,4T ligand leads to large free energy barriers among the macrostates of tRNA3Lys. However, in the case of a 1,5T system the range of MFPT (10 ns to 300 ns) reveals that the energy barrier between the macrostates of tRNA3Lys was reduced due to the 1,5T ligand.
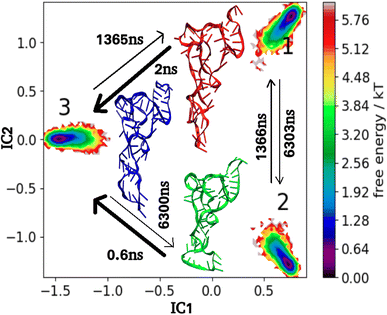 | ||
| Fig. 12 MSM macrostates and MFPT rates for tRNA3Lys–1,4T system. The arrows show MFPT in ns. The metastable representative structures 1, 2 and 3 are shown in red, green and blue colors respectively. | ||
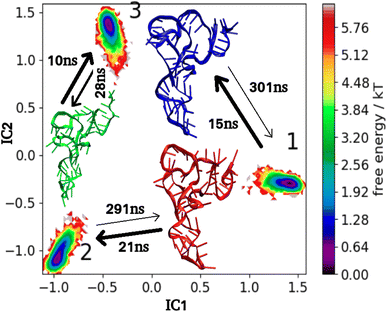 | ||
| Fig. 13 MSM macrostates and MFPT rates for tRNA3Lys–1,5T system. The arrows show MFPT in ns. The metastable representative structures 1, 2 and 3 are shown in red, green and blue colors respectively. | ||
Discussion
Several studies pointed at the structural versatility of the tRNA3Lys and its role in the HIV-1 reverse transcription initiation complex, which might adopt different two- and three-dimensional structures.22 Many experiments have been carried out on the chemical compounds that can bind to the tRNA and restrict the conformational freedom.36–41,45 One of the approaches is the fragment-based strategies in the field of RNA–ligand discovery which may provide potential lead compounds for antiviral drug development.39The in silico docking of two ligands (1,4T and 1,5T) against the tRNA3Lys, shows the ligand interactions with A50 and C63 residues of the tRNA3Lys respectively. The NMR spectroscopic chemical shift mapping experiments revealed two possible binding sites (one in the TΨC-arm of tRNA3Lys and other near to the D-arm) on tRNA3Lys. The residues involved in TΨC-arm are C49, A50, G51, G52, G53, T54, C61, C62, C63, U64 and G65. The residues involved in D-arm are U8, G10, C11, U12, C13, A14, G22, A23 and G24.40 The MD simulations results also show that the stable binding interactions between the ligand and the tRNA3Lys. The experimental dissociation constant values were determined by Tisne et al.45 for both the ligands 1,4T and 1,5T were found to be 1.8 μM and 3.6 μM respectively. According to these experimental results the 1,4T ligand binds 2 fold strongly to the tRNA3Lys compared to 1,5T ligand. The MMGBSA free energy calculations of simulation trajectories also show that the 1,4T ligand binds strongly to the tRNA3Lys compared to the 1,5T ligand. However, the binding location of 1,5T ligand has shown preference for TΨC loop than D arm. It was observed from the MD simulations that the 1,4T ligand was able to bind ∼2 times more strongly than 1,5T ligand at TΨC arm with the help of direct H-bond interactions. It was also found that this 1,4T ligand was forming Mg2+ ion mediated interactions as well as indirect interactions with the TΨC arm residues. In case of tRNA3Lys–1,4T system, the water molecules are also able to interact with TΨC arm residues, close to the 1,4T ligand binding site along with the D arm residues. The starting structures for the simulations are top scored docked poses for each system. In the MD simulations of systems, the water residues are settled in the D arm and may not allow the ligand to bind in the D arm. The D arm residues are interacting strongly with water and may not be allowing 1,4T ligands to interact directly with them. It may be a long-time scale event in the range of milliseconds to seconds to displace water molecules and interact with the D arm by the 1,4T ligand. It may require very long time-scale simulations of multiple docking poses, which is a highly expensive computational process.
Apart from binding strength of the ligand, it is also important to probe the change in structural dynamics due to the ligand. The RMSD of the anticodon loop of tRNA3Lys–1,5T system is low compared to other two systems in all three runs of simulations as shown in ESI Fig. S16.† It has been observed that the 1,5T ligand bound to the tRNA3Lys reduces the flexibility of the anticodon region as well. In order to understand the structural dynamics and kinetics of ligand bound systems, Markov state modelling was performed. Markov state modelling of 300 ns simulations of tRNA3Lys apo system was performed to understand conformational dynamics and functional kinetics. MSM analysis of tRNA3Lys apo was compared independently with MSM results of tRNA3Lys bound with 1,4T and 1,5T ligands. Markov state modeling of tRNA3Lys apo MD trajectory data suggests three principal metastable conformations. These conformations were found to have variations mainly in the anticodon loop of the tRNA3Lys. The experimental study by Benas et al. from where the pdb structure (1FIR) was obtained, had observed the canonical form of anticodon loop tRNA3Lys. This observation was attributed to the crystal packing of two tRNAs that are closely associated head-to-tail so that the CCA end of each one interacts with the anticodon of the other one. They have predicted the formation of noncanonical anticodon loop conformation in case of free tRNA3Lys.54 The MSM results are also suggesting noncanonical conformation of the anticodon loop of apo-tRNA3Lys. Durant et al. have reported the canonical conformation of the anticodon loop of tRNA3Lys by incorporating hypermodifications at 34th and 37th positions.78
As revealed by NMR studies, the acceptor region was found to be flexible and D–TΨC tertiary structure was observed to be opened up. The transition between metastable states takes few nanoseconds in tRNA3Lys apo and those transition rates become slower to microseconds in tRNA3Lys–1,4T system, whereas the order of transitions were observed to be same (∼ns) in tRNA3Lys–1,5T system. MSM analysis of the tRNA3Lys–1,4T system has shown that the 1,4T ligand strengthens the secondary structure in the D arm of tRNA3Lys. However, the residue pairs G18–Ψ55 and G19–C56, were found to be widened up in tRNA3Lys–1,4T system. On the contrary MSM analysis suggests that these tertiary structures forming residue pair distances have reduced due to 1,5T ligand resulting in closing the D–TΨC arm of tRNA3Lys. These findings have been reconfirmed by MSM analysis of only the D–TΨC loop of all the three systems. MSM analysis suggests four metastable states for D–TΨC trajectories of apo tRNA3Lys as well as tRNA3Lys–1,4T system (ESI Fig. S17†). However, MSM of only D–TΨC loop has resulted in three macrostates of tRNA3Lys–1,5T system indicating that reduction in flexibility and closing of D–TΨC loop (ESI Fig. S17–S19†).
It has been known that, in order to form the reverse transcription initiation complex, the tRNA3Lys needs to undergo large-scale conformational rearrangement which requires breaking of acceptor and TΨC stem base pairing.60 Although the binding studies indicate that 1,4T ligand has stronger binding properties than 1,5T ligand, the rigidity of acceptor and TΨC stem was obtained by 1,5T ligand. This property of the 1,5T ligand may prove to indirectly inhibit the initiation of reverse transcription complex. The computational insight of these ligands binding to tRNA3Lys may help experimentalists to understand interesting and stable interactions, and the dynamics of ligand binding.
Conclusions
Computational probing of tRNA3Lys in the presence of ligands has been carried out using molecular docking, molecular dynamics simulations and MSM analysis. The conformational freedom of tRNA3Lys structure has been analysed using MSM analysis. The three stable states obtained for tRNA3Lys with restricted flexibility of tRNA3Lys in the presence of ligands. Different tertiary interactions were also probed in the analysis to understand structural effects in tRNA3Lys. The conformational flexibility, tertiary interactions contribution to various structural effects and other water mediated interactions may guide the future aspects of drug design for HIV-1, where tRNA3Lys acts as a primer for HIV's reverse transcription.Author contributions
Mallikarjunachari Uppuladinne conceptualized, conceived the research work and wrote the manuscript. Archana Achalere performed MSM analysis and wrote the manuscript. Uddhavesh Sonavane and Rajendra Joshi edited and reviewed the final manuscript.Conflicts of interest
The authors declare no conflict of interest.Acknowledgements
The authors acknowledge Bioinformatics Resources and Applications Facility (BRAF), of C-DAC, for providing a supercomputing facility to carry out molecular dynamics simulations. The authors also acknowledge National Supercomputing Mission (NSM), India & Ministry of Electronics and Information Technology (MeitY), and Department of Science and Technology (DST) for the support to perform R&D work at C-DAC.References
- D. Baltimore, Viral RNA-dependent DNA polymerase: RNA-dependent DNA polymerase in virions of RNA tumour viruses, Nature, 1970, 226(5252), 1209–1211 CrossRef CAS PubMed.
- F. Harada, G. G. Peters and J. E. Dahlberg, The primer tRNA for Moloney murine leukemia virus DNA synthesis. Nucleotide sequence and aminoacylation of tRNAPro, J. Biol. Chem., 1979, 254(21), 10979–10985 CrossRef CAS PubMed.
- F. Harada, R. C. Sawyer and J. E. Dahlberg, A primer ribonucleic acid for initiation of in vitro Rous sarcarcoma virus deoxyribonucleic acid synthesis, J. Biol. Chem., 1975, 250(9), 3487–3497 CrossRef CAS.
- C. Isel, C. Ehresmann, G. Keith, B. Ehresmann and R. Marquet, Initiation of Reverse Transcripion of HIV-1: Secondary Structure of the HIV-1 RNA/tRNA|rlmbopopnbop|Lys|clobop|3 (Template/Primer) Complex, J. Mol. Biol., 1995, 247(2), 236–250 CrossRef CAS PubMed.
- R. Marquet, C. Isel, C. Ehresmann and B. Ehresmann, tRNAs as primer of reverse transcriptases, Biochimie, 1995, 77(1–2), 113–124 CrossRef CAS PubMed.
- J. Mak and L. Kleiman, Primer tRNAs for reverse transcription, J. Virol., 1997, 71(11), 8087–8095 CrossRef CAS PubMed.
- L. Ratner, W. A. Haseltine, R. Patarca, K. J. Livak, B. Starcich, S. F. Josephs, E. R. Doran, J. A. Rafalski, E. A. Whitehorn, K. Baumeister, L. Ivanoff, S. R. Petteway Jr., M. L. Pearson, J. A. Lautenberger, T. S. Papas, J. Ghrayeb, N. T. Chang, R. C. Gallo and F. Wong-Staal, Complete nucleotide sequence of the AIDS virus, HTLV-III, Nature, 1985, 313, 277–284 CrossRef CAS.
- Y. Iwatani, A. E. Rosen, J. Guo, K. Musier-Forsyth and J. G. Levin, Efficient Initiation of HIV-1 Reverse Transcription in Vitro: Requirement for RNA Sequences Downstream of the Primer Binding Site Abrogated by Nucleocapsid Protein-Dependent Primer-Template Interactions, J. Biol. Chem., 2003, 278(16), 14185–14195 CrossRef CAS PubMed.
- J. G. Levin, J. Guo, I. Rouzina and K. Musier-Forsyth, Nucleic acid chaperone activity of HIV-1 nucleocapsid protein: critical role in reverse transcription and molecular mechanism, Prog. Nucleic Acid Res. Mol. Biol., 2005, 80, 217–286 CAS.
- A. Rein, L. E. Henderson and J. G. Levin, Nucleic-acid-chaperone activity of retroviral nucleocapsid proteins: significance for viral replication, Trends Biochem. Sci., 1998, 23(8), 297–301 CrossRef CAS PubMed.
- X. Li, Y. Quan, E. J. Arts, Z. Li, B. D. Preston, H. De Rocquigny and M. A. Wainberg, et al.). Human immunodeficiency virus Type 1 nucleocapsid protein (NCp7) directs specific initiation of minus-strand DNA synthesis primed by human tRNA (Lys3) in vitro: studies of viral RNA molecules mutated in regions that flank the primer binding site, J. Virol., 1996, 70(8), 4996–5004 CrossRef CAS PubMed.
- B. Chan, K. Weidemaier, W. T. Yip, P. F. Barbara and K. Musier-Forsyth, Intra-tRNA distance measurements for nucleocapsid protein dependent tRNA unwinding during priming of HIV reverse transcription, Proc. Natl. Acad. Sci. U. S. A., 1999, 96(2), 459–464 CrossRef CAS.
- H. De Rocquigny, C. Gabus, A. Vincent, M. C. Fournie-Zaluski, B. Roques and J. L. Darlix, Viral RNA annealing activities of human immunodeficiency virus type 1 nucleocapsid protein require only peptide domains outside the zinc fingers, Proc. Natl. Acad. Sci. U. S. A., 1992, 89(14), 6472–6476 CrossRef CAS PubMed.
- M. Lapadat-Tapolsky, H. D. Rocquigny, D. V. Gent, B. Roques, R. Plasterk and J. L. Darlix, Interactions between HIV-1 nucleocapsid protein and viral DNA may have important functions in the viral life cycle, Nucleic Acids Res., 1993, 21(4), 831–839 CrossRef CAS PubMed.
- A. C. Prats, L. Sarih, C. Gabus, S. Litvak, G. Keith and J. L. Darlix, Small finger protein of avian and murine retroviruses has nucleic acid annealing activity and positions the replication primer tRNA onto genomic RNA, EMBO J., 1988, 7(6), 1777–1783 CrossRef CAS PubMed.
- M. R. Hargittai, R. J. Gorelick, I. Rouzina and K. Musier-Forsyth, Mechanistic insights into the kinetics of HIV-1 nucleocapsid protein-facilitated tRNA annealing to the primer binding site, J. Mol. Biol., 2004, 337(4), 951–968 CrossRef CAS.
- C. Tisné, B. P. Roques and F. Dardel, The annealing mechanism of HIV-1 reverse transcription primer onto the viral genome, J. Biol. Chem., 2004, 279(5), 3588–3595 CrossRef.
- M. C. Williams, R. J. Gorelick and K. Musier-Forsyth, Specific zinc-finger architecture required for HIV-1 nucleocapsid protein's nucleic acid chaperone function, Proc. Natl. Acad. Sci. U. S. A., 2002, 99(13), 8614–8619 CrossRef CAS PubMed.
- M. Lapadat-Tapolsky, C. Pernelle, C. Borie and J. L. Darlix, Analysis of the nucleic acid annealing activites of nucleocapsid protein from HIV-1, Nucleic Acids Res., 1995, 23(13), 2434–2441 CrossRef CAS PubMed.
- P. Barraud, C. Gaudin, F. Dardel and C. Tisné, New insights into the formation of HIV-1 reverse transcription initiation complex, Biochimie, 2007, 89(10), 1204–1210 CrossRef CAS PubMed.
- C. Tisné, B. P. Roques and F. Dardel, Heteronuclear NMR studies of the interaction of tRNA3Lys with HIV-1 nucleocapsid protein, J. Mol. Biol., 2001, 306(3), 443–454 CrossRef PubMed.
- C. Isel, C. Ehresmann and R. Marquet, Initiation of HIV reverse transcription, Viruses, 2010, 2(1), 213–243 CrossRef CAS PubMed.
- A. C. Bajji, M. Sundaram, D. G. Myszka and D. R. Davis, An RNA complex of the HIV-1 A-loop and tRNALys, 3 is stabilized by nucleoside modifications, J. Am. Chem. Soc., 2002, 124(48), 14302–14303 CrossRef CAS PubMed.
- Y. Bilbille, F. A. Vendeix, R. Guenther, A. Malkiewicz, X. Ariza, J. Vilarrasa and P. F. Agris, The structure of the human tRNALys3 anticodon bound to the HIV genome is stabilized by modified nucleosides and adjacent mismatch base pairs, Nucleic Acids Res., 2009, 37(10), 3342–3353 CrossRef CAS PubMed.
- C. Tisné, M. Rigourd, R. Marquet, C. Ehresmann and F. Dardel, NMR and biochemical characterization of recombinant human tRNA3Lys expressed in Escherichia coli: identification of posttranscriptional nucleotide modifications required for efficient initiation of HIV-1 reverse transcription, RNA, 2000, 6(10), 1403–1412 CrossRef PubMed.
- M. V. Uppuladinne, U. B. Sonavane and R. R. Joshi, MD simulations of HIV-1 RT primer–template complex: effect of modified nucleosides and antisense PNA oligomer, J. Biomol. Struct. Dyn., 2013, 31(6), 539–560 CrossRef CAS PubMed.
- R. Lee, N. Kaushik, M. J. Modak, R. Vinayak and V. N. Pandey, Polyamide nucleic acid targeted to the primer binding site of the HIV-1 RNA genome blocks in vitro HIV-1 reverse transcription, Biochemistry, 1998, 37(3), 900–910 CrossRef CAS PubMed.
- N. Kaushik, T. T. Talele, R. Monel, P. Palumbo and V. N. Pandey, Destabilization of tRNA3Lys from the primer-binding site of HIV-1 genome by anti-A loop polyamide nucleotide analog, Nucleic Acids Res., 2001, 29(24), 5099–5106 CrossRef CAS PubMed.
- N. Kaushik and V. N. Pandey, PNA targeting the PBS and A-loop sequences of HIV-1 genome destabilizes packaged tRNA3Lys in the virions and inhibits HIV-1 replication, Virology, 2002, 303(2), 297–308 CrossRef CAS PubMed.
- N. E. McCrate, M. E. Varner, K. I. Kim and M. C. Nagan, Molecular dynamics simulations of human: the role of modified bases in mRNA recognition, Nucleic Acids Res., 2006, 34(19), 5361–5368 CrossRef CAS PubMed.
- R. Li, L. M. Macnamara, J. D. Leuchter, R. W. Alexander and S. S. Cho, MD simulations of tRNA and aminoacyl-tRNA synthetases: dynamics, folding, binding, and allostery, Int. J. Mol. Sci., 2015, 16(7), 15872–15902 CrossRef CAS PubMed.
- X. Zhang, R. C. Walker, E. M. Phizicky and D. H. Mathews, Influence of sequence and covalent modifications on yeast tRNA dynamics, J. Chem. Theory Comput., 2014, 10(8), 3473–3483 CrossRef CAS PubMed.
- P. S. Prabhakar, N. A. Takyi and S. D. Wetmore, Posttranscriptional modifications at the 37th position in the anticodon stem–loop of tRNA: structural insights from MD simulations, RNA, 2021, 27(2), 202–220 CrossRef CAS.
- S. Vangaveti, P. Haruehanroengra, R. Wang, S. V. Ranganathan and J. Sheng, Understanding Effect of Geranylation of tRNALys on Ribosome Binding: A Computational Study, Biophys. J., 2017, 112(3), 488a CrossRef.
- Q. Shao, Z. Han, J. Cheng, Q. Wang, W. Gong and C. Li, Allosteric Mechanism of Human Mitochondrial Phenylalanyl-tRNA Synthetase: An Atomistic MD Simulation and a Mutual Information-Based Network Study, J. Phys. Chem. B, 2021, 125(28), 7651–7661 CrossRef CAS PubMed.
- Fragment-based approaches in drug discovery, ed. W. Jahnke, D. A. Erlanson, R. Mannhold, H. Kubinyi and G. Folkers, Wiley-VCH, New York, vol. 34, 2006 Search PubMed.
- C. W. Murray and D. C. Rees, The rise of fragment-based drug discovery, Nat. Chem., 2009, 1(3), 187–192 CrossRef CAS PubMed.
- D. C. Rees, M. Congreve, C. W. Murray and R. Carr, Fragment-based lead discovery, Nat. Rev. Drug Discovery, 2004, 3(8), 660–672 CrossRef CAS PubMed.
- F. Chung, C. Tisné, T. Lecourt, F. Dardel and L. Micouin, NMR-Guided Fragment-Based Approach for the Design of tRNALys3 Ligands, Angew. Chem., 2007, 119(24), 4573–4575 CrossRef.
- F. Chung, C. Tisné, T. Lecourt, B. Seijo, F. Dardel and L. Micouin, Design of tRNALys3 Ligands: Fragment Evolution and Linker Selection Guided by NMR Spectroscopy, Chem.–Eur. J., 2009, 15(29), 7109–7116 CrossRef CAS PubMed.
- C. Tisné, F. Guillière and F. Dardel, NMR-based identification of peptides that specifically recognize the d-arm of tRNA, Biochimie, 2005, 87(9–10), 885–888 CrossRef PubMed.
- B. Le Droumaguet and K. Velonia, Click Chemistry: a powerful tool to create polymer-based macromolecular chimeras, Macromol. Rapid Commun., 2008, 29(12–13), 1073–1089 CrossRef CAS.
- A. E. Moorhouse and J. E. Moses, Click chemistry and medicinal chemistry: a case of “cyclo-addiction”, ChemMedChem, 2008, 3(5), 715–723 CrossRef CAS PubMed.
- G. C. Tron, T. Pirali, R. A. Billington, P. L. Canonico, G. Sorba and A. A. Genazzani, Click chemistry reactions in medicinal chemistry: applications of the 1,3-dipolar cycloaddition between azides and alkynes, Med. Res. Rev., 2008, 28(2), 278–308 CrossRef CAS PubMed.
- R. Moumné, V. Larue, B. Seijo, T. Lecourt, L. Micouin and C. Tisné, Tether influence on the binding properties of tRNA Lys 3 ligands designed by a fragment-based approach, Org. Biomol. Chem., 2010, 8(5), 1154–1159 RSC.
- N. Plattner and F. Noé, Protein conformational plasticity and complex ligand-binding kinetics explored by atomistic simulations and Markov models, Nat. Commun., 2015, 6(1), 1–10 Search PubMed.
- D. Guo, T. Mulder-Krieger, A. P. IJzerman and L. H. Heitman, Functional efficacy of adenosine A2A receptor agonists is positively correlated to their receptor residence time, Br. J. Pharmacol., 2012, 166(6), 1846–1859 CrossRef CAS PubMed.
- J. H. Prinz, B. Keller and F. Noé, Probing molecular kinetics with Markov models: metastable states, transition pathways and spectroscopic observables, Phys. Chem. Chem. Phys., 2011, 13(38), 16912–16927 RSC.
- B. E. Husic and V. S. Pande, Markov state models: from an art to a science, J. Am. Chem. Soc., 2018, 140(7), 2386–2396 CrossRef CAS PubMed.
- W. Wang, S. Cao, L. Zhu and X. Huang, Constructing Markov State Models to elucidate the functional conformational changes of complex biomolecules, Wiley Interdiscip. Rev.: Comput. Mol. Sci., 2018, 8(1), e1343 Search PubMed.
- V. S. Pande, K. Beauchamp and G. R. Bowman, Everything you wanted to know about Markov State Models but were afraid to ask, Methods, 2010, 52(1), 99–105 CrossRef CAS PubMed.
- J. D. Chodera and F. Noé, Markov state models of biomolecular conformational dynamics, Curr. Opin. Struct. Biol., 2014, 25, 135–144 CrossRef CAS PubMed.
- J. H. Prinz, H. Wu, M. Sarich, B. Keller, M. Senne, M. Held and F. Noé, et al.). Markov models of molecular kinetics: generation and validation, J. Chem. Phys., 2011, 134(17), 174105 CrossRef PubMed.
- P. Benas, G. Bec, G. Keith, R. Marquet, C. Ehresmann, B. Ehresmann and P. Dumas, The crystal structure of HIV reverse-transcription primer tRNA (Lys, 3) shows a canonical anticodon loop, RNA, 2000, 6(10), 1347–1355 CrossRef CAS PubMed.
- R. Dennington, T. Keith and J. Millam, GaussView, Version 5, 2009 Search PubMed.
- M. J. Frisch, G. W. Trucks, H. B. Schlegel, G. E. Scuseria, M. A. Robb, J. R. Cheeseman, J. A. Pople, et al., Gaussian 03, Revision C.02, Gaussian, Inc., Wallingford, CT, 2004 Search PubMed.
- P. T. Lang, S. R. Brozell, S. Mukherjee, E. F. Pettersen, E. C. Meng, V. Thomas and I. D. Kuntz, et al.). DOCK 6: combining techniques to model RNA–small molecule complexes, RNA, 2009, 15(6), 1219–1230 CrossRef CAS PubMed.
- E. F. Pettersen, T. D. Goddard, C. C. Huang, G. S. Couch, D. M. Greenblatt, E. C. Meng and T. E. Ferrin, UCSF Chimera—a visualization system for exploratory research and analysis, J. Comput. Chem., 2004, 25(13), 1605–1612 CrossRef CAS PubMed.
- D. A. Case, T. D. Darden, T. E. Cheatham III, C. L. Simmerling, J. Wang, R. E. Duke, R. Luo, R. C. Walker, W. Zhang, K. M Merz and B. Roberts, AMBER12, 2012, University of California, San Francisco Search PubMed.
- V. Hornak, R. Abel, A. Okur, B. Strockbine, A. Roitberg and C. Simmerling, Comparison of multiple Amber force fields and development of improved protein backbone parameters, Proteins: Struct., Funct., Bioinf., 2006, 65(3), 712–725 CrossRef CAS PubMed.
- W. L. Jorgensen, J. Chandrasekhar, J. D. Madura, R. W. Impey and M. L. Klein, Comparison of simple potential functions for simulating liquid water, J. Chem. Phys., 1983, 79(2), 926–935 CrossRef CAS.
- T. E. Cheatham and P. A. Kollman, Molecular dynamics simulations highlight the structural differences among DNA: DNA, RNA: RNA, and DNA: RNA hybrid duplexes, J. Am. Chem. Soc., 1997, 119(21), 4805–4825 CrossRef CAS.
- D. M. York, T. A. Darden and L. G. Pedersen, The effect of long-range electrostatic interactions in simulations of macromolecular crystals: a comparison of the Ewald and truncated list methods, J. Chem. Phys., 1993, 99(10), 8345–8348 CrossRef CAS.
- J. P. Ryckaert, G. Ciccotti and H. J. Berendsen, Numerical integration of the cartesian equations of motion of a system with constraints: molecular dynamics of n-alkanes, J. Comput. Phys., 1977, 23(3), 327–341 CrossRef CAS.
- W. Humphrey, A. Dalke and K. Schulten, VMD: visual molecular dynamics, J. Mol. Graphics, 1996, 14(1), 33–38 CrossRef CAS PubMed.
- M. K. Scherer, B. Trendelkamp-Schroer, F. Paul, G. Pérez-Hernández, M. Hoffmann, N. Plattner and F. Noé, et al.). PyEMMA 2: a software package for estimation, validation, and analysis of Markov models, J. Chem. Theory Comput., 2015, 11(11), 5525–5542 CrossRef CAS PubMed.
- H. Wu and F. Noé, Variational approach for learning Markov processes from time series data, J. Nonlinear Sci., 2020, 30(1), 23–66 CrossRef.
- L. Molgedey and H. G. Schuster, Separation of a mixture of independent signals using time delayed correlations, Phys. Rev. Lett., 1994, 72(23), 3634 CrossRef PubMed.
- G. Pérez-Hernández, F. Paul, T. Giorgino, G. De Fabritiis and F. Noé, Identification of slow molecular order parameters for Markov model construction, J. Chem. Phys., 2013, 139(1), 07B604_1 CrossRef PubMed.
- S. Röblitz and M. Weber, Fuzzy spectral clustering by PCCA+: application to Markov state models and data classification, Advances in Data Analysis and Classification, 2013, 7(2), 147–179 CrossRef.
- H. Shi and P. B. Moore, The crystal structure of yeast phenylalanine tRNA at 1.93 Å resolution: a classic structure revisited, RNA, 2000, 6(8), 1091–1105 CrossRef CAS PubMed.
- M. B. Comarmond, R. Giege, J. C. Thierry, D. Moras and J. Fischer, Three-dimensional structure of yeast tRNAAsp. I. Structure determination, Acta Crystallogr., Sect. B: Struct. Sci., 1986, 42(3), 272–280 CrossRef.
- R. T. Byrne, A. L. Konevega, M. V. Rodnina and A. A. Antson, The crystal structure of unmodified tRNA Phe from Escherichia coli, Nucleic Acids Res., 2010, 38(12), 4154–4162 CrossRef CAS PubMed.
- B. Hingerty, R. S. Brown and A. Jack, Further refinement of the structure of yeast tRNAPhe, J. Mol. Biol., 1978, 124(3), 523–534 CrossRef CAS PubMed.
- E. Westhof, P. Dumas and D. Moras, Restrained refinement of two crystalline forms of yeast aspartic acid and phenylalanine transfer RNA crystals, Acta Crystallogr., Sect. A: Found. Crystallogr., 1988, 44(2), 112–124 CrossRef PubMed.
- J. H. Roh, R. M. Briber, A. Damjanovic, D. Thirumalai, S. A. Woodson and A. P. Sokolov, Dynamics of tRNA at different levels of hydration, Biophys. J., 2009, 96(7), 2755–2762 CrossRef CAS PubMed.
- E. V. Puglisi and J. D. Puglisi, Probing the conformation of human tRNA3Lys in solution by NMR, FEBS Lett., 2007, 581(27), 5307–5314 CrossRef CAS PubMed.
- P. C. Durant, A. C. Bajji, M. Sundaram, R. K. Kumar and D. R. Davis, Structural effects of hypermodified nucleosides in the Escherichia coli and human tRNALys anticodon loop: the effect of nucleosides s2U, mcm5U, mcm5s2U, mnm5s2U, t6A, and ms2t6A, Biochemistry, 2005, 44(22), 8078–8089 CrossRef CAS PubMed.
Footnote |
| † Electronic supplementary information (ESI) available. See DOI: https://doi.org/10.1039/d3ra03694d |
| This journal is © The Royal Society of Chemistry 2023 |

