 Open Access Article
A novel tetranuclear Cu(II) complex for DNA-binding and in vitro anticancer activity†
Shuhua Cao *a,
Anlin Wangb,
Kaoxue Lia,
Zhiteng Lina,
Hongwei Yanga,
Xiaolei Zhanga,
Jianmei Qiua and
Xishi Tai*a
aCollege of Chemistry, Chemical and Environmental Engineering, Weifang University, No. 5147 Dongfeng Street, Weifang, 261061, P. R. China. E-mail: shuhua@wfu.edu.cn; taixs@wfu.edu.cn
bAffiliated Beijing Chaoyang Hospital, Capital Medical University, No. 8 Gongren Tiyuchang Nanlu, Chaoyang District, Beijing, 100020, P. R. China
First published on 4th September 2023
Abstract
A novel tetranuclear Cu(II) complex (TNC) was successfully synthesized and characterized by X-ray single crystal diffraction. The interaction of the complex with calf thymus DNA (CT-DNA) has been studied by UV-vis absorption titration, fluorescence technology and molecular docking. The results indicated that TNC could bind to the DNA through an intercalative mode. The agarose gel electrophoresis experiment showed that TNC could cleave supercoiled plasmid DNA into linear DNA. The anticancer activity of TNC was tested on four cancer cell lines: MCF7, A549, 4T1 and HepG2. The results indicated that TNC shown significant activity against all of above cell lines.
Introduction
In the last decades, metal complexes have attracted increasing attention due to the potential applications such as catalysis,1–3 luminescence,4–8 magnetic material,9–13 and biological activities14,15 etc. In particularly, the anticancer activity of the metal complexes has received more attention since cisplatin was successfully used to treat various cancers.16,17Copper is an essential trace element in the human body and plays a critical role in various biological processes. Compared to platinum-based drugs, copper compounds generally exhibit lower systemic toxicity.18 As a result, copper(II) complexes have garnered significant attention as potential anticancer drugs.19–21 Additionally, Cu2+ ions can be reduced to Cu+ ions by glutathione (GSH) overexpressed in the tumor microenvironment. Cu+ ions can then convert hydrogen peroxide (H2O2) overexpressed in the tumor microenvironment into highly toxic reactive oxygen species (ROS) known as hydroxyl radicals (˙OH), thereby killing tumor cells.22–24 This process is known as chemodynamic therapy (CDT). Currently, most of the reagents used for CDT are nanoparticles of metal oxides,25–27 but their application in vivo is limited due to safety concerns. On the other hand, oxamide-based ligands such as N,N′-bis(substituted) oxamide have flourished indeed since they can be used to construct complexes with structural diversity.28–31 In addition to the utilization of an oxamide-based ligand, the incorporation of 1,10-phennanthroline as a secondary ligand was deemed necessary due to the fact that 1,10-phennanthroline derivatives have demonstrated noteworthy biological activity, including but not limited to antibacterial, antifungal, and antiviral properties.32 These complexes have shown promising results in improving the antitumor activity.
Molecular docking is a computer simulation method for drug design through the interaction between receptors and drug molecules. This method is mainly used to study intermolecular interactions (such as ligands and receptors) and predict their binding modes and affinity. In recent years, molecular docking has become an important technology in the field of computer-aided drug research. Many studies on the interaction between complexes and DNA have used molecular docking to predict the interaction mode.33–36
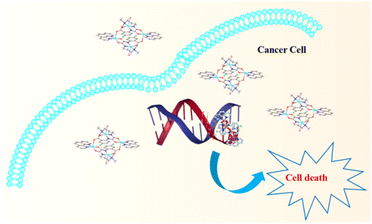
Taking all this into account, in the present study the synthesis, structure, characterization and DNA binding of a tetranuclear copper(II) complex (TNC) were investigated in detail. Molecular docking was also investigated to predict the binding mode. Agarose gel experiments were carried out to further study the ability of TNC to cleave supercoiled plasmid DNA. Moreover, the in vitro anticancer potential of TNC was also evaluated against MCF7, A549, 4T1 and HepG2 cell lines (Scheme 1).
Results and discussion
Synthesis route
The synthetic routes for TNC are shown in Scheme 1S.† The mononuclear copper ligand (CuL) was synthesized from the reaction of 2-amino-5-fluorobenzoic acid with ethyl chlorooxoacetate in tetrahydrofuran medium to get the intermediate ethyl-N-2-(carboxy-4-fluorophenyl)oxamate. Then the intermediate reacted with 3-(dimethylamino)-1-propylamine in tetrahydrofuran medium to get H3L. The CuL was prepared by the reaction of the H3L with cupric chloride and sodium hydroxide in ethanol and water in 1![[thin space (1/6-em)]](https://www.rsc.org/images/entities/char_2009.gif) :
:![[thin space (1/6-em)]](https://www.rsc.org/images/entities/char_2009.gif) 1 (v/v) ratio. TNC was synthesized by the reaction of CuL and cupric bromide with 1,10-phenanthroline in methanol.
1 (v/v) ratio. TNC was synthesized by the reaction of CuL and cupric bromide with 1,10-phenanthroline in methanol.
Crystal structure
The triclinic space group P![[1 with combining macron]](https://www.rsc.org/images/entities/char_0031_0304.gif) is responsible for crystal diffraction parameters of TNC. The complex comprises four Cu(II) centers, two Br− anions, two L ligands and two 1,10-phennanthroline ligands. As the structure of TNC is symmetric, only the symmetric unit is discussed. Fig. 1 shows that the coordination environment around the copper atoms is distinct. The Cu1 atom has an N3OBr donor set and adopts a distorted square pyramidal geometry (τ = 0.04) with bond angles in the range of 83.3(2) to 164.8(2)°. τ is defined as, the difference between the maximum and second maximum angles surrounding the central Cu(II) ion, divided by 60. The range of τ is from zero to 1.00, where zero corresponds to a perfect square pyramid and 1.00 is for an ideal trigonal bipyramid. The basal planes of the square pyramids are formed by the O1, N1, N2, and N3 atoms of the oxamide ligands. The range of bond lengths is from 1.936(4) to 2.048(6) Å and bond angle is from 83.3(2) to 164.8(2)° in the square pyramids. The Cu1 ion deviates 0.278 Å from the basal plane toward the apical bromine anion which is located in the axial position with a bond length of 2.7782(12) Å. Due to the Jahn-Teller elongation effect, the bond length is greater than the basal one.37 The Cu2 atoms are in an N2O3 coordination environment, forming a distorted square pyramidal geometry (τ = 0.235). The basal plane is the square pyramid which is defined by O3, O4 from the oxamide ligand and N4, N5 from the 1,10-phennanthroline ligand. The bond angle range is from 83.0(2) to 174.6(2)° and the bond length range is from 1.928(4) to 1.986(5) Å in the basal plane. The Cu2 ion is located above the basal plane toward the apical O21 atom with a distance about 0.211 Å. The oxygen atom (O21; 1 − X, 2 − Y, 1 − Z) lies in the axial position. The structure was stabilized by hydrogen bonds and π–π* stacking interactions. Free water forms intermolecular hydrogen bonds with the oxamide ligand. 3D supramolecular network of TNC was shown in Fig. 1S.†
is responsible for crystal diffraction parameters of TNC. The complex comprises four Cu(II) centers, two Br− anions, two L ligands and two 1,10-phennanthroline ligands. As the structure of TNC is symmetric, only the symmetric unit is discussed. Fig. 1 shows that the coordination environment around the copper atoms is distinct. The Cu1 atom has an N3OBr donor set and adopts a distorted square pyramidal geometry (τ = 0.04) with bond angles in the range of 83.3(2) to 164.8(2)°. τ is defined as, the difference between the maximum and second maximum angles surrounding the central Cu(II) ion, divided by 60. The range of τ is from zero to 1.00, where zero corresponds to a perfect square pyramid and 1.00 is for an ideal trigonal bipyramid. The basal planes of the square pyramids are formed by the O1, N1, N2, and N3 atoms of the oxamide ligands. The range of bond lengths is from 1.936(4) to 2.048(6) Å and bond angle is from 83.3(2) to 164.8(2)° in the square pyramids. The Cu1 ion deviates 0.278 Å from the basal plane toward the apical bromine anion which is located in the axial position with a bond length of 2.7782(12) Å. Due to the Jahn-Teller elongation effect, the bond length is greater than the basal one.37 The Cu2 atoms are in an N2O3 coordination environment, forming a distorted square pyramidal geometry (τ = 0.235). The basal plane is the square pyramid which is defined by O3, O4 from the oxamide ligand and N4, N5 from the 1,10-phennanthroline ligand. The bond angle range is from 83.0(2) to 174.6(2)° and the bond length range is from 1.928(4) to 1.986(5) Å in the basal plane. The Cu2 ion is located above the basal plane toward the apical O21 atom with a distance about 0.211 Å. The oxygen atom (O21; 1 − X, 2 − Y, 1 − Z) lies in the axial position. The structure was stabilized by hydrogen bonds and π–π* stacking interactions. Free water forms intermolecular hydrogen bonds with the oxamide ligand. 3D supramolecular network of TNC was shown in Fig. 1S.†
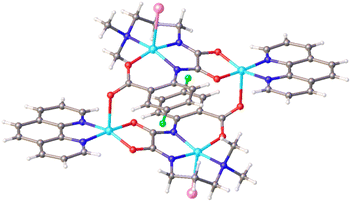 | ||
| Fig. 1 Crystal structure of TNC. C = gray, N = blue, O = red, Cu = sky blue, Br = pink, F = green, solvent molecules are omitted for clarity. | ||
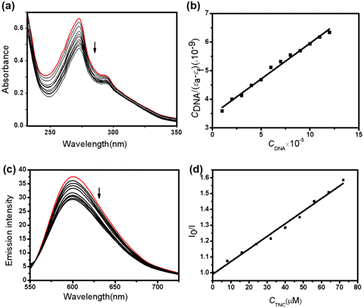
Electronic absorption. To further investigate the interaction between TNC and DNA, UV-vis spectroscopy experiments were carried out. It is well known that complexes can bind to DNA through noncovalent interactions which include intercalative, electrostatic and groove modes. Generally, when the complexes bind to DNA through the intercalative mode, it could result in the strong stacking interaction between the aromatic chromophore of the complex and the base pairs of DNA.39 The groove mode is interaction between the complex and the DNA bases by hydrogen bond and van der Waals force. The electrostatic mode is the interaction between the two through the Coulomb force.36 The absorption spectra was shown in Fig. 2(a). It was observed from Fig. 2(a), as the CT-DNA added in the solution of TNC, the absorption bands of TNC showed hypochromisms about 28.6% and 16.6% without red shifts at 273 nm and 290 nm, respectively. These results clearly showed that TNC most likely bound to CT-DNA by intercalative mode.40,41 To further study the binding strength between TNC and CT-DNA, Kb was calculated using following equation:
| CDNA/(εa − εf) = CDNA/(εb − εf) + 1/[Kb(εb − εf)] | (1) |
Fluorescence spectral studies. Next, fluorescence spectral were carried out to further determinate the binding mode. EB (ethidium bromide) is a kind of nucleic acid intercalating agent and its fluorescence intensity is very weak. Once binding with DNA, the fluorescence intensity of EB will be greatly improved. If the complex replaced EB and intercalated with DNA base, the fluorescence intensity of EB will be weakened. The emission spectra of the EB–DNA was shown in Fig. 2(c). It was observed from Fig. 2(c) that emission quenching at 600 nm due to TNC addition to the EB–DNA mixture, which became more obvious with increasing TNC concentration, suggesting that TNC replace the EB molecules from the DNA binding sites. The results for the quenching of EB–DNA by TNC was in agreement with the following Stern–Volmer equation:43
| I0/I = 1 + KsvCBNC | (2) |
Molecular docking. The binding mode of the lowest free energy pose of TNC and DNA are shown in Fig. 3. As depicted from Fig. 3, the π–π* stacking between phenanthroline ligand of TNC and benzene ring of DC9 residue in DNA double helix and the hydrophobic interaction between TNC and DT8 residue of DNA made the TNC stably bind to DNA through the intercalative mode. The results of molecular docking were consistent with the experimental results of DNA binding.
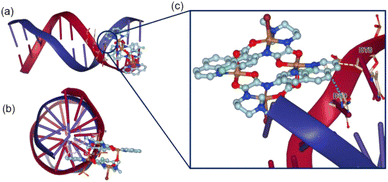 | ||
| Fig. 3 Binding pose for TNC and CT-DNA. (a) X-axis view (b) Z-axis view (c) binding site. The blue dotted line indicated π–π* stacking and yellow dotted line indicates hydrophobic interaction. | ||
DNA cleavage. In order to further investigate the cleavage ability of TNC on plasmid pUC19 DNA (which is a supercoiled DNA), the agarose gel electrophoresis experiment was performed. As shown in Fig. 3S,† with the increase of TNC concentration, the number of supercoiled DNA (Form I) decreased and the amount of linear DNA (Form II) increased, indicating that TNC could cleave supercoiled DNA into linear DNA. These results indicated that excellent DNA cleavage ability would contribute to cytotoxicity against cancer cells.
Experimental
Materials
Calf thymus DNA (CT-DNA) and 2-amino-5-fluorobenzoic acid (98%) were bought from Alfa Aesar. Ethyl chlorooxoacetate (98%) and 3-(dimethylamino)-1-propylamine (98%) were purchased from Aladdin, shanghai. MCF-7, A549, 4T1 and HepG2 cells were purchased from Chinese Academy of Sciences Cell Bank. All other chemicals were commercially available and used directly.Synthesis of the TNC
![[double bond, length as m-dash]](https://www.rsc.org/images/entities/char_e001.gif) O)]; 1446 [ν (C
O)]; 1446 [ν (C![[double bond, length as m-dash]](https://www.rsc.org/images/entities/char_e001.gif) N)]; UV-vis: λmax (nm) [εmax (M−1 cm−1)]: 273(66204); 290(31314).
N)]; UV-vis: λmax (nm) [εmax (M−1 cm−1)]: 273(66204); 290(31314).| Bond | Dist. | Bond | Dist. |
|---|---|---|---|
| a 1 − X, 2 − Y, 1 − Z. | |||
| Cu1–O1 | 1.936(4) | Cu2–O4 | 1.928(4) |
| Cu1–N2 | 1.972(5) | Cu2–O3 | 1.950(4) |
| Cu1–N1 | 1.992(5) | Cu2–N4 | 1.986(5) |
| Cu1–N3 | 2.048(6) | Cu2–N5 | 1.986(5) |
| Cu1–Br1 | 2.7782(12) | Cu2–O21 | 2.244(5) |
| Angle | (°) | Angle | (°) |
|---|---|---|---|
| O1–Cu1–N2 | 162.4(2) | O4–Cu2–O3 | 85.13(17) |
| O1–Cu1–N1 | 90.03(18) | O4–Cu2–N4 | 94.7(2) |
| N2–Cu1–N1 | 83.3(2) | O3–Cu2–N4 | 174.6(2) |
| O1–Cu1–N3 | 87.0(2) | O4–Cu2–N5 | 160.5(2) |
| N2–Cu1–N3 | 95.1(2) | O3–Cu2–N5 | 95.43(19) |
| N1–Cu1–N3 | 164.8(2) | N4–Cu2–N5 | 83.0(2) |
| O1–Cu1–Br1 | 101.64(15) | O4–Cu2–O21 | 106.01(18) |
| N2–Cu1–Br1 | 95.51(18) | O3–Cu2–O21 | 92.06(16) |
| N1–Cu1–Br1 | 99.65(16) | N4–Cu2–O21 | 93.17(18) |
| N3–Cu1–Br1 | 95.58(19) | N5–Cu2–O21 | 93.50(18) |
Stability of TNC
Dissolved a certain amount of TNC in DMSO to obtain 10 mM stock solution. Took 20 μL stock solution and diluted it with water. The absorbance of the diluted solution was measured using a ultraviolet visible (UV-vis) spectrophotometer from 240–400 nm.DNA interaction studies
Conclusions
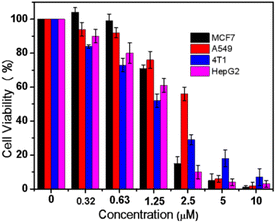
A novel tetranuclear Cu(II) complex (TNC) bridged by N-(2-carboxy-4-fluorophenyl) – N′-[3-(dimethylamino)propyl]oxamide had been successfully synthesized and well characterized. The interaction of TNC with CT-DNA had been studied using UV-vis absorption, fluorescence technology and molecular docking. The results revealed that TNC could bind to CT-DNA through the intercalative mode. Agarose gel experiment was carried out to further study the ability of TNC to cleave supercoiled plasmid DNA. The results showed that TNC could cleave supercoiled plasmid DNA into linear DNA. In addition, TNC showed excellent cytotoxic activity against MCF7, A549, 4T1 and HepG2 cancer cell lines. The results clearly illustrated that TNC have potential practical applications.Conflicts of interest
There are no conflicts to declare.Acknowledgements
We thank Guangzhou Yinfo Information Technology Co., Ltd. for providing a friendly and versatile web server (https://cloud.yinfotek.com) to aid the molecular docking studies.Notes and references
- S. Xia, L. Gan, K. Wang, Z. Li and D. Ma, J. Am. Chem. Soc., 2016, 138, 13493–13496 CrossRef CAS PubMed.
- P. Zhang, X. Hou, L. Liu, J. L. Mi and M. Dong, J. Phys. Chem. C, 2015, 119(50), 28028–28037 CrossRef CAS.
- Y. S. Kang, Y. Lu, K. Chen, Y. Zhao, P. Wang and W. Y. Sun, Coordin. Chem. Rev., 2019, 378, 262–280 CrossRef CAS.
- L. You, B. Zhao, H. Liu, S. Wang, G. Xiong, Y. He, F. Ding, J. J. Joos, P. F. Smet and Y. Sun, CrystEngComm, 2018, 20, 615–623 RSC.
- K. M. Ayers, N. D. Schley and G. Ung, Chem. Commun., 2019, 55(58), 8446–8449 RSC.
- A. B. Scharf, S. L. Zheng and T. A. Betley, Dalton Trans., 2021, 50(19), 6418–6422 RSC.
- E. E. Braker, N. F. M. Mukthar and N. D. Schley, ChemPhotoChem, 2021, 5(10), 902–905 CrossRef CAS.
- Y. Mi, M. Yang, X. Kuang and C. Lu, Chin. J. Struct. Chem., 2022, 41(2), 2202079–2202084 CAS.
- D. Shi, W. Wang, S. Wang and Z. Liu, J. Mol. Struct., 2021, 12229(5), 129807 CrossRef.
- H. W. Wei, Q. F. Yang, X. Y. Lai, X. Z. Wang, T. L. Yang, Q. Hou and X. Y. Liu, CrystEngComm, 2018, 20, 962–968 RSC.
- K. Dankhoff and B. Weber, CrystEngComm, 2018, 20, 818–828 RSC.
- D. Natke, A. Preiss, S. Klimke, T. Shiga, R. Boca, M. Ohba, H. Oshio and F. Renz, Eur. J. Inorg. Chem., 2021, 2021(15), 1498–1504 CrossRef CAS.
- B. Dojer, A. Golobič, N. Babič, Z. Jagličić and M. Kristl, J. Mol. Struct., 2022, 1265, 133393 CrossRef CAS.
- C. Schattschneider, S. D. Kettenmann, S. Hinojosa, J. Heinrich and N. Kulak, Coordin. Chem. Rev., 2019, 385, 191–207 CrossRef CAS.
- M. Sohrabi, M. Saeedi, B. Larijani and M. Mahdavi, Eur. J. Med. Chem., 2021, 216, 113308 CrossRef CAS PubMed.
- X. Tai, H. Guo and Q. Guo, Chin. J. Struct. Chem., 2018, 37(7), 1052–1056 CAS.
- S. Cao, X. Tai and C. Xin, Chin. J. Struct. Chem., 2021, 40(3), 324–328 CAS.
- D. C. Shobha, B. Thulasiram, A. R. Rao and N. Penumaka, J. Fluoresc., 2018, 28, 1195–1205 CrossRef PubMed.
- S. H. S. Saleem, M. Sankarganesh, J. D. Raja, P. R. A. Jose, A. Sakthivel, T. C. Jeyakumar and R. N. Asha, J. Saudi Chem. Soc., 2021, 25, 101225 CrossRef CAS.
- P. Jain, C. Das, S. Roychoudhury, H. Majumder and S. Das, ChemistrySelect, 2016, 1(21), 6623–6631 CrossRef.
- S. Abdelrahman, M. Alghrably, M. Campagna, C. A. E. Hauser, M. Jaremko and J. I. Lachowicz, Molecules, 2021, 26, 4730 CrossRef CAS PubMed.
- S. Cao, X. Li, Y. Gao, F. Li, K. Li, X. Cao, Y. Dai, L. Mao, S. Wang and X. Tai, Dalton Trans., 2020, 49, 11851–11858 RSC.
- S. Cao, F. Li, Q. Xu, M. Yao, S. Wang, Y. Zhou, X. Cui, R. Man, K. Li and X. Tai, J. Saudi Chem. Soc., 2021, 25, 101372 CrossRef CAS.
- B. Ma, S. Wang, F. Liu, S. Zhang, J. Duan, Z. Li, Y. Kong, Y. Sang, H. Liu, W. Bu and L. Li, J. Am. Chem. Soc., 2019, 141, 849–857 CrossRef CAS PubMed.
- S. Wang, L. Yang, H. Cho, S. Chueng and K. Lee, Biomaterials, 2019, 224, 119498 CrossRef CAS PubMed.
- P. Yang, J. Tao, F. Chen, Y. Chen, J. He, K. Shen, P. Zhao and Y. Li, Small, 2021, 11(7), 202005865 Search PubMed.
- N. Zhang, G. Shu, L. Shen, J. Ding, E. Qiao, S. Fang, J. Song, Y. Yang, Z. Zhao, C. Lu, J. Tu, M. Xu, Y. Du, M. Chen and J. Ji, Nano Res., 2022, 15(6), 5262–5272 CrossRef CAS.
- B. Ramakrishna, D. Divya, P. V. Monisha and B. Manimaran, Eur. J. Inorg. Chem., 2015, 36, 5839–5846 CrossRef.
- M. M. Omar, H. F. A. El-Halim and E. A. M. Khalil, Appl. Organomet. Chem., 2017, 31, e3724 CrossRef.
- S. Weheabby, M. A. Abdulmalic, M. Atzori, R. Sessoli, A. Aliabadi and T. Rüffer, Dalton Trans., 2018, 47(45), 16164–16181 RSC.
- S. P. Gavrish, Y. D. Lampeka, M. V. Babak and V. B. Arion, Inorg. Chem., 2018, 57(3), 1288–1297 CrossRef CAS PubMed.
- M. r Kuma, S. U. Parsekar, N. Duraipandy, M. S. Kiran and A. P. Koley, Inorg. Chim. Acta, 2019, 484, 219–226 CrossRef.
- N. Arshad, N. Abbas, F. Perveen, B. Mirza, A. M. Almuhaini and S. Alkahtani, J. Saudi Chem. Soc., 2021, 25, 101323 CrossRef CAS.
- S. A. Al-Harbi, J. Saudi Chem. Soc., 2022, 26, 101528 CrossRef CAS.
- A. Hossan, A. F. Alrefaei, H. A. Katouah, A. Bayazeed, B. H. Asghar, F. Shaaban and N. M. El-Metwaly, J. Saudi Chem. Soc., 2023, 27(2), 101599 CrossRef CAS.
- A. Ziannaa, G. D. Geromichalosa, A. Pekoub, A. G. Hatzidimitrioua, E. Coutouli-Argyropoulouc, M. Lalia-Kantouria, A. A. Pantazakib and G. Psomasa, J. Inorg. Biochem., 2019, 199, 110792 CrossRef PubMed.
- P. Sudipta, C. Koushik, G. Surajit, R. Kunal, J. Barnali and K. Saugata, J. Mol. Struct., 2018, 1152, 96–100 CrossRef.
- S. Cao, J. Fan, W. Sun, F. Li, K. Li, X. Tai and X. Peng, Chem. Commun., 2019, 55, 12956–12959 RSC.
- F. Shan, H. Song, X. Gao, B. Li and X. Ma, Chin. J. Struct. Chem., 2022, 41(2), 2202057–2202063 CAS.
- Y. Kou, M. Li and X. Ren, Spectrochim. Acta, Part A, 2018, 205, 435–441 CrossRef CAS PubMed.
- S. Radisavljević, L. Bratsos, A. Scheurer, J. Korzekwa, R. Masnikosa, A. Tot, N. Gligorijević, S. Radulović and A. R. Simović, Dalton Trans., 2018, 47, 13696 RSC.
- A. M. Pyle, J. P. Rehmann, R. Meshoyrer, C. V. Kumar, N. J. Turro and J. K. Barton, J. Am. Chem. Soc., 1989, 111, 3051–3058 CrossRef CAS.
- D. R. Mcmillan and K. M. Mcnett, Chem. Rev., 1998, 3, 1201–1220 CrossRef PubMed.
Footnote |
| † Electronic supplementary information (ESI) available. CCDC 1888702. For ESI and crystallographic data in CIF or other electronic format see DOI: https://doi.org/10.1039/d3ra03624c |
| This journal is © The Royal Society of Chemistry 2023 |

