 Open Access Article
Optimization of the photocatalytic degradation of phenol using superparamagnetic iron oxide (Fe3O4) nanoparticles in aqueous solutions
Edris Bazrafshanab,
Leili Mohammadi*c,
Amin Allah Zareiab,
Jafar Mosafer*bd,
Muhammad Nadeem Zafare and
Abdollah Dargahi *fg
*fg
aHealth Sciences Research Center, Torbat Heydariyeh University of Medical Sciences, Torbat Heydariyeh 33787 95196, Iran
bDepartment of Environmental Health Engineering, Torbat Heydariyeh University of Medical Sciences, Torbat Heydariyeh 33787 95196, Iran. E-mail: Jafarmosafer8@gmail.com
cInfectious Diseases and Tropical Medicine Research Center, Research Institute of Cellular and Molecular Sciences in Infectious Diseases, Zahedan University of Medical Sciences, Zahedan 98167-43463, Iran. E-mail: lailimohamadi@gmail.com
dResearch Center of Advanced Technologies in Medicine, Torbat Heydariyeh University of Medical Sciences, Torbat Heydariyeh, Iran
eDepartment of Chemistry, University of Gujrat, Gujrat 50700, Pakistan
fDepartment of Environmental Health Engineering, Khalkhal University of Medical Sciences, Khalkhal, Iran. E-mail: a.dargahi29@yahoo.com
gSocial Determinants of Health Research Center, Ardabil University of Medical Sciences, Ardabil, Iran
First published on 24th August 2023
Abstract
The present work was carried out to remove phenol from aqueous medium using a photocatalytic process with superparamagnetic iron oxide nanoparticles (Fe3O4) called SPIONs. The photocatalytic process was optimized using a central composite design based on the response surface methodology. The effects of pH (3–7), UV/SPION nanoparticles ratio (1–3), contact time (30–90 minutes), and initial phenol concentration (20–80 mg L−1) on the photocatalytic process were investigated. The interaction of the process parameters and their optimal conditions were determined using CCD. The statistical data were analyzed using a one-way analysis of variance. We developed a quadratic model using a central composite design to indicate the photocatalyst impact on the decomposition of phenol. There was a close similarity between the empirical values gained for the phenol content and the predicted response values. Considering the design, optimum values of pH, phenol concentration, UV/SPION ratio, and contact time were determined to be 3, 80 mg L−1, 3, and 60 min, respectively; 94.9% of phenol was eliminated under the mentioned conditions. Since high values were obtained for the adjusted R2 (0.9786) and determination coefficient (R2 = 0.9875), the response surface methodology can describe the phenol removal by the use of the photocatalytic process. According to the one-way analysis of variance results, the quadratic model obtained by RSM is statistically significant for removing phenol. The recyclability of 92% after four consecutive cycles indicates the excellent stability of the photocatalyst for practical applications. Our research findings indicate that it is possible to employ response surface methodology as a helpful tool to optimize and modify process parameters for maximizing phenol removal from aqueous solutions and photocatalytic processes using SPIONs.
1. Introduction
Water pollution by phenol and its derivatives is seriously challenging for developing and developed countries.1,2 There is a wide range of industries that extensively use phenols, including petrochemicals, phenolic resin production, oil refineries, textiles, paints, plastics, paper, and steel.3,4 The discharge of such untreated organic pollutants into the environment is critical because their low concentrations harm organisms, and most of these substances have been recognized as hazardous pollutants by the European Commission and the US Environmental Protection Agency.5–7 Also, contaminated water in the human body can result in central nervous system paralysis and threaten the liver, pancreas, and kidneys.8 Because of its recalcitrant nature and high toxicity, its removal or reduction to harmless levels by many biological, physical, and chemical processes is a complicated process.9,10 Therefore, a suitable and efficient method for removing phenol from water and wastewater should be considered.Various methods are used for removing phenol, such as biological methods including activated sludge,11 a sequencing batch reactor (SBR),12 a moving bed biofilm reactor (MBBR),13 physical methods such as adsorption and sonolysis, and chemical methods including the Fenton reaction, electrochemical methods,14 ozonation,15,16 and application of nanomaterials.17 The pH, temperature, oxygen, and inhibitory effect of phenol have limited biological methods in the treatment of highly contaminated samples. Other common treatment processes, such as physical and chemical methods, also transfer contaminants from one phase to another, concentrate them, or produce a new contaminant that requires further treatment. Nowadays, large-scale applications are mainly focused on preventing any type of secondary pollution. Reusable nanophotocatalysts have attracted much attention. To meet such challenges, magnetically separable nanostructured ferrites are highly effective.18 Spinel ferrite nanoparticles, from a chemical point of view, offer attractive surfaces to tune the interfacial properties and also present high colloidal stability. To take advantage of spinel ferrites, advanced magnetic-based semiconductor photocatalysts are highly desirable to overcome the problem of separation and secondary pollution.19
Magnetite (Fe3O4)-based photocatalysts are found to be effective as a simple recyclable photocatalytic material; they not only prevent the excessive use of catalyst but also allow easy recovery of the deactivated photocatalyst, making the process fruitful. Taking into account the cost factor and efficiency, plasmonic nanostructures of noble metal-modified magnetite materials show significant promise.20–22
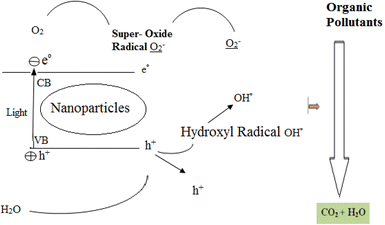
In recent years, the advanced oxidation process has been used as a suitable alternative to conventional treatment processes due to its ease of use, economy, and high efficiency.23–26 The basis of the oxidation process is the production of hydroxyl radicals (OH); this process is able to decompose stable organic compounds. Selected types of this process include combining photocatalysts with ozone, UV lamps, Fenton, O3/UV, UV/H2O2, etc.27,28 Among these methods, photocatalytic processes are attractive due to their unique properties such as the complete decomposition of pollutants (organic matter) into minerals such as water and carbon dioxide, ease of implementation, no need for complex equipment, and high capability in the elimination of various pollutants in a short time.29 During photocatalytic processes, electrons are transferred from the capacitance layer to the conduction layer, which leaves an empty hole in the capacitance layer, inducing a positive charge in the capacitance layer. This empty cavity can react in contact with water and form a hydroxyl free radical (Fig. 1), which plays an essential role in photocatalytic processes.30
Rehman et al. successfully synthesized a ternary nanocomposite of Fe3O4@rGO@AgI by a reflux method for the photodegradation of phenol. Fe3O4@rGO@AgI showed a high photocatalytic performance with 99% phenol degradation. They stated that the superior photocatalytic performance is mainly attributed to the rapid transfer of light-generated electrons from the GO nanosheets to AgI.31
In a study by Madima et al., Fe3O4/TiO2 magnetic nanocomposites were used as an effective and recyclable photocatalyst with different loading percentages of Fe3O4 by a hydrothermal method. Examination of the optical properties in their study showed that the increase in the photocatalytic activity of the 20% FT nanocomposite was attributed to the high surface area, the increase in light absorption, and the formation of a heterogeneous structure, which increases the separation efficiency of the photo-generated electron–hole pairs.32
Analysis of the results obtained by Ahmed et al. showed that methylene blue is more effectively degraded due to visible light irradiation by nickel-doped zinc oxide photocatalysts.33 Recently, the application of nanotechnology in the treatment of pollutants has been further developed compared to other methods due to its ease and economics of use.34,35 Nanoparticles can be used to purify and convert pollutants into harmless materials due to their small size, large cross-section, unique crystalline shape and lattice order, and high reactivity.34 Among the different types of nanoparticles, iron oxide nanoparticles are part of the group of base oxides and have a wide range of applications as catalysts, adsorbents, etc. Distinctive features of these nanoparticles are their availability, cheapness, non-volatility, non-toxicity, stability, reusability, high adsorption capacity, and reactivity. They also have the ability to adsorb anions.28,36 Magnetite (Fe3O4) can be ideally used for biological applications, including cell isolation, magnetic resonance imaging, and drug delivery, because of its low toxicity, suitable biocompatibility, and special magnetic properties.37 Amongst metal NPs, iron NPs are extensively used due to their rapid, inexpensive, frequent, non-toxic reactions and their capability for adsorbing pollutants and removing heavy metals from contaminated water.
In this study, a particular type of iron oxide nanoparticles called superparamagnetic iron oxide nanoparticles (SPIONs) are used, which are a suitable option for clean processes due to their unique physicochemical properties caused by their very small size (about 10 nm). In typical classical research, when conducting experiments with multiple factors, one parameter is altered while all other parameters remain constant. This process is repeated for each parameter to determine their behavior and optimal conditions. It leads to ignoring the interference effect of other factors in the process.38 The constraints of classical methods can be overcome by optimization of all the effective factors by experimenting with statistical techniques, like RSM and Taguchi, as the most commonly employed experimental design methods.39,40 Response surface methods can be designed in different ways depending on their application in the experimental design.41,42 Among the RSM CCD (central composite design), D-optimal, and Box–Behnken methods, the CCD method has been used in this study.
Rahmani et al. (2006), in their study, investigated the possibility of the photocatalytic decomposition of phenol using the UV/TiO2 process and its conversion into stable materials such as water and carbon dioxide. The results of the experiments showed that among the studied processes of phenol removal, aeration-ultraviolet combination with titanium dioxide has the highest efficiency compared to other processes.43 Shokouhi et al. (2009), in their study, compared the decomposition efficiency of phenol using advanced oxidation methods in the presence of ozone and ultraviolet radiation. The percentage of phenol decomposition using a 125 watt UV lamp after one hour was 32.4%, while during the same period, it reached 93.6% using the ozonation method.44 Bazrafshan et al. (2007) also investigated the removal of phenol from aqueous solutions using pistachio shell ash. Based on the results, the highest adsorption capacity of pistachio shell ash was 327.6 mg g−1, and removal efficiency was equal to 98.28%.45 Naseri et al. (2011) photocatalytically decomposed phenol in an aqueous medium using titanium dioxide (TiO2) nanoparticles enriched with trivalent iron (Fe3+) and synthesized by a sol–gel method. The results of that study showed that the Fe3+–TiO2 nano-photocatalyst has an effective role in the photocatalytic decomposition of phenol, especially at higher concentrations in the Fe3+–TiO2/UV process.46 Therefore, according to the above, the present work aims to optimize the photocatalytic process using superparamagnetic iron oxide NPs in the phenol removal from aqueous media.
2. Materials and methods
Sigma Aldrich (USA) provided iron(II) chloride tetrahydrate (FeCl2·4H2O, 99%), ammonium hydroxide (5 M), and iron(III) chloride hexahydrate (FeCl3·6H2O, 99%). The N50 neodymium magnet (50 × 50 × 30 mm) with 14 kilo Gauss remanence was provided by Kaiven, Inc (China). The materials were analytical grade. We used deionized water as a solvent.2.1. Synthesis of iron oxide superparamagnetic NPs (SPIONs)
The synthesis steps of SPIONs by the co-precipitation method were as follows: first, iron salts, FeCl3·6H2O (4.54 g) and FeCl2·4H2O (1.9 g), were dissolved in 15 mL of deoxygenated water (for 15 min under argon gas). Continuing the gasification and maintaining the same conditions, 1.83 mL of 12 M hydrochloric acid solution was added and stirred on the stirrer for 30 min. 11.93 mL of 32% ammonium hydroxide solution (NH4OH) dissolved in 150 mL of deoxygenated water was mixed in a dropwise manner, followed by stirring of the solution with a homogenizer for one hour at 1000 rpm. The gas flow was cut off and ammonium hydroxide was evaporated by alternating stirring for 30 minutes by placing the sample in hot water at 70 °C for 30 min. The sample was then allowed to stand again in the same container of hot water, without stirring, for 90 min. Finally, the prepared nanoparticles were collected with a neodymium N50 magnet and then rinsed several times with deoxygenated and deionized water for the removal of excess solutes.The resulting black precipitate was washed again with 96% ethanol and 0.01 M HCl solution and finally washed with deoxygenated and deionized water. The prepared nanoparticles were finally dried in a freeze dryer for one day and the product was stored in an oxygen-free environment at room temperature. The rate of sterilization, the amount of ammonium hydroxide, and the temperature conditions strongly affected the properties of the nanoparticles. Therefore, all of these conditions were optimized in the above preparation method to minimize the cost and time as much as possible and to maximize the ease of implementation technique for having the SPIONs with the desired properties and characteristics.
2.2. Experimental design and optimization
SPIONs and RSM were used to perform the experimental design of phenolic photocatalytic analysis. RSM is defined as a set of statistical and mathematical methods useful for analyzing and modeling problems whose answers are of interest.47,48 It is affected by different variables and aims to find the optimal conditions for the response.49,50 It involves an experimental modeling approach that evaluates the relationships between controlled empirical factors and the obtained results. RSM is a popular experimental approach used in various industrial processes and chemical reactions to operate the process more economically and reliably to ensure greater stability and produce high-quality products.51,52Whenever multiple input variables can affect the performance metrics of the process, it is possible to use RSM to evaluate the relationship between process performance metrics (responses) and input variables (independent variables) and to identify optimal conditions for the involved processes. In the present work, we selected a face-centered central composite (CCD) design, as a commonly employed type of RSM, to optimize the phenol photocatalytic degradation by SPIONs. CCD can be used as a great design instrument for sequential experiments, allowing testing of the absence of fit with the availability of a sufficient amount of test values.49 Design Expert software (Stat-Ease, trial version 7.1) was used to apply CCD. We used 4 factors in three complete factorial CCD levels based on RSM that presented 30 experiments (16 factorial points, 6 replications at central points, and 8 axial points) to optimize the selected variables. Table 1 shows the experimental range of contributing factors and the selective levels of the independent variables. Adjusted R2 and adjusted coefficient (R2) were used for fitting of the removal efficiency of phenol. In addition, ANOVA was employed as a statistical approach for the analysis of responses and to obtain a better understanding of the variable effects. This statistical model was used because of the high cost of NPs, linear equation, and sample shrinkage. Table 2 presents experimental configurations, which were designed by CCD to evaluate the effect of factors and optimize the parameters of the process. It is possible to represent the answer, Y, using a mathematical relation correlating the response level. Based on the following quadratic equation, the Y answer is presented as a polynomial model:53,54
| Y = b0 + b1X1 + b2X2 + b3X3 + b4X4 + b11X12 + b22X22 + b33X32 + b44X42 + b12X1X2 + b13X1X3 + b14X1X4 + b23X2X3 + b24X2X4 + b34X3X4 | (1) |
| Factor | Independent variable | Range and level of actual and coded values | ||
|---|---|---|---|---|
| −1 | 0 | +1 | ||
| X1 | pH | 3 | 5 | 7 |
| X2 | Initial phenol concentration | 20 | 50 | 80 |
| X3 | Time | 30 | 60 | 90 |
| X4 | UV/SPION ratio | 1 | 2 | 3 |
| Run order | pH | Phenol concentration (mg L−1) (X2) | Time (min) (X3) | UV/SPION ratio (X4) | Response (%) | |
|---|---|---|---|---|---|---|
| Experimental | Predicted | |||||
| 1 | −1 | 1 | 0 | 0 | 64.14 | 63.42 |
| 2 | −1 | 1 | −1 | 1 | 51.93 | 52.12 |
| 3 | 0 | 0 | 0 | −1 | 59.5025 | 58.16 |
| 4 | −1 | −1 | 1 | 1 | 94.9 | 95.05 |
| 5 | −1 | 0 | −1 | −1 | 47.2925 | 48.88 |
| 6 | −1 | −1 | 0 | 0 | 85.625 | 84.4 |
| 7 | −1 | 0 | −1 | 1 | 68.7775 | 69.44 |
| 8 | −1 | −1 | −1 | −1 | 51.93 | 52.26 |
| 9 | −1 | 0 | 1 | 0 | 85.625 | 84.16 |
| 10 | −1 | 1 | 1 | −1 | 51.93 | 52.32 |
| 11 | 0 | 0 | 0 | 0 | 76.35 | 76.89 |
| 12 | 1 | 0 | 0 | 0 | 59.5025 | 59.5 |
| 13 | −1 | 1 | 1 | 1 | 73.415 | 73.63 |
| 14 | −1 | −1 | 1 | 1 | 94.9 | 95.05 |
| 15 | 0 | 0 | 0 | 1 | 80.9875 | 79.65 |
| 16 | 0 | 0 | 0 | 0 | 76.35 | 76.89 |
| 17 | −1 | −1 | −1 | 1 | 73.415 | 72.99 |
| 18 | −1 | −1 | 1 | −1 | 73.415 | 73.39 |
| 19 | −1 | 1 | −1 | 1 | 51.93 | 52.12 |
| 20 | 0 | 0 | 0 | 0 | 76.35 | 76.89 |
| 21 | −1 | 0 | 0 | 0 | 74.4 | 80.8 |
| 22 | −1 | 1 | 1 | −1 | 51.93 | 52.32 |
| 23 | −1 | 0 | −1 | −1 | 47.2925 | 44.7 |
| 24 | 0 | 0 | 0 | 0 | 76.35 | 76.89 |
| 25 | −1 | −1 | 1 | −1 | 73.415 | 73.39 |
| 26 | 0 | 0 | 0 | 0 | 76.35 | 76.89 |
| 27 | −1 | 0 | 0 | 0 | 80.9875 | 76.54 |
| 28 | −1 | 1 | 1 | 1 | 73.415 | 73.63 |
| 29 | −1 | 0 | −1 | 0 | 64.14 | 62.93 |
| 30 | −1 | 1 | −1 | −1 | 30.445 | 31.73 |
2.3. Characterization of SPIONs
The SPIONs were identified for particle size distribution by DLS analysis. For this purpose, a Malvern Zeta Sizer (NANO-ZS, Malvern, UK) was used that was equipped with a 4 mW He–Ne laser at a scattering angle of 90°. It works at 633 nm via reverse scatter detection. A TEM (Philips CM120, Philips Electron Optics, Netherlands) was used at 120 kV for performing morphological analysis of NPs.2.4. Photocatalytic experiments and the photocatalytic reactor
This study was an experimental and laboratory-scale study. It was performed in a discontinuous system. In this study, phenol produced by Merck, German company, was used to prepare the samples. To start, we prepared a stock phenol solution. Afterwards, we diluted it with double distilled water to create solutions of the desired concentrations. The synthetic effluent, with the desired concentrations under predetermined conditions (designed by Design Expert software) was introduced into a Plexiglas reactor and exposed to UV radiation with a radiation power of 8, 15, 30 W (the entire perimeter of the reactor was covered with aluminum to allow for the reflection of ultraviolet radiation from the reactor to increase the decomposition efficiency of phenol).To measure the amount of phenol output, a spectrophotometric device with a wavelength of 500 nm was used. All experiments were performed at laboratory temperature. Since the flow in the reactor is discontinuous, a magnet was used at the end of the reactor to homogenize the effluent and mix the nanoparticles with the effluent. The process was carried out according to the sample volume table designed by Design Expert software, and according to that software, the removal efficiency of phenol under the specified conditions was evaluated. The results related to different runs according to the table are analyzed to determine the optimal removal conditions.
3. Results and discussion
3.1. FTIR
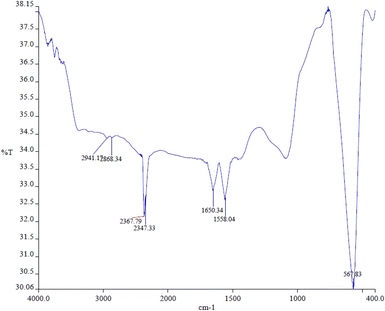
The FTIR spectrum obtained from the pure magnetite nanoparticles is presented in Fig. 2. The intense peak observed at 567 cm−1 is attributed to the stretching vibration mode associated with the metal–oxygen Fe–O bonds in the crystalline lattice of Fe3O4. It is characteristically pronounced for all spinel structures, particularly for ferrites.56,57 A band at 1650 cm−1 is related to the presence of hydroxyl groups and is attributed to OH-bending.583.2. Particle size of SPIONs
Fig. 3 shows the DLS results of SPIONs at 13.8 ± 1.2 nm (Fig. 3), which was almost confirmed by TEM results, indicating a relative size of ∼10 nm and a spherical morphology for SPIONs (Fig. 3). Table 3 summarizes these results.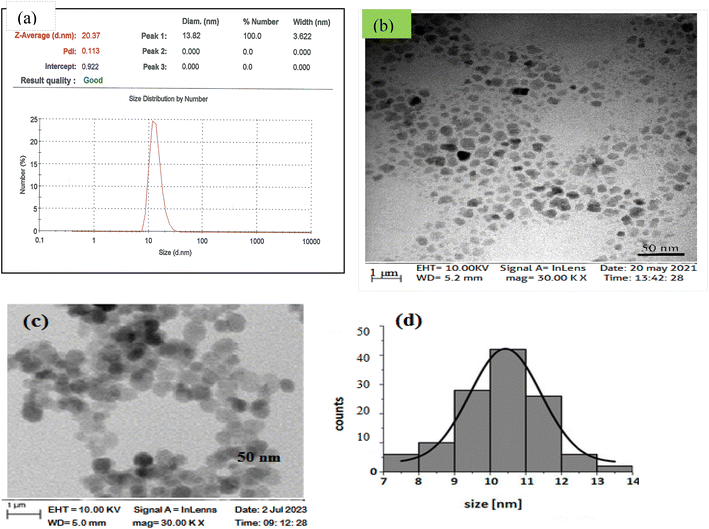 | ||
| Fig. 3 (a) Particle size distribution of SPIONs obtained by DLS, TEM micrograph of SPIONs (b) before the phenol adsorption process, (c) and (d) after the phenol adsorption process. | ||
| Method | Result | Particle size29 | PDI |
|---|---|---|---|
| DLS | Z-average | 20.3 ± 2.3 | 0.11 ± 0.08 |
| Number | 13.8 ± 1.2 | 0.11 ± 0.08 | |
| TEM | — | 10 | — |
3.3. XRD
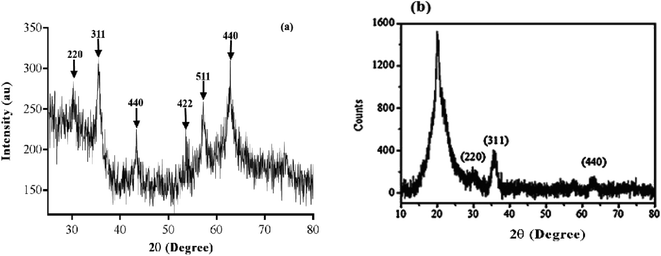
Based on the XRD data shown in Fig. 4, the crystalline pattern of SPIONs indexed as planes 220, 311, 222, 400, 422, 511, and 440 coincided well with the crystal planes of standard JCPDS (joint committee on powder diffraction standards) of a cubic inverse spinel structure of m-Fe3O4 NPs.59 The broad diffraction pattern lines illustrated in Fig. 4 indicated that the particles have are nanometer sized.38 Finally, the full-width at half maximum (FWHM) of the strongest reflection of the (311) peak at 2θ = 35.48 was used for the measurement of crystallite size, by applying the Debby–Scherrer equation.60
 | (2) |
3.4. Vibrating sample magnetometer (VSM)
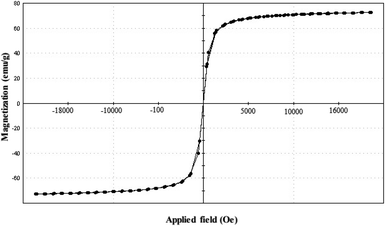
VSM was employed for investigating the magnetic properties of the developed SPIONs. Fig. 5 shows super-paramagnetism in SPIONs without magnetic hysteresis with saturated magnetic values of 72.7 emu g−1 at 2 T at room temperature (300 K).3.5. Optical properties of SPIONs
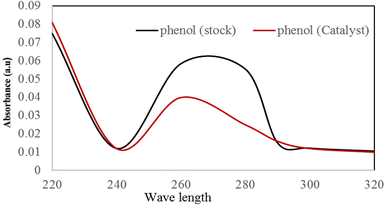
The optical absorption properties of the synthesized SPIONs were measured in the wavelength region 200–320 nm, as shown in Fig. 6. The bandgap of the nanoparticles was calculated using the Tauc equation.| αhν = A(hν − Eg)n |
Phenol photodegradation was carried out using 20 mL of 10 ppm phenol solution containing 0.02 g of photocatalyst in a 100 mL conical flask kept in the dark for 30 minutes to ensure adsorption–desorption equilibrium.61 Then, the photodegradation reaction was performed for 1 hour under 250 W visible light and stirring for 60 minutes. After that, the catalyst was removed, and the remaining phenol levels were recorded using a spectrophotometer Agilent UV-vis analysis. Fig. 6 shows the spectral changes after degradation for 60 minutes. Using the Beer–Lambert law, the degradation for phenol was 90%.
3.6. Impact of experimental parameters on the specific surface area of samples
First, the variables affecting the phenol removal process and their range were identified in this study. Hence, the capacity of the UV/SPION ratio to remove phenol at pH 7, 5, and 3 was tested, keeping other variables constant. According to the results, the UV/SPIONs could only remove phenol at a pH of 3 and the obtained efficiency was about 95% in 60 minutes. Afterward, the experiment was executed in accordance with the operational parameter values presented in Table 2. RSM was used for the analysis of experimental results for obtaining an experimental model with the best response. Table 2 indicates the percentage of phenol removal in real and predicted values. There was a closeness between actual values and the predicted ones in the model for a specific run. To develop a statistical model, the importance of regression coefficients relative to p-values was determined. The ANOVA results are presented in Table 4, which imply the statistical significance of the quadratic model obtained from RSM for % phenol removal (Y). A value of p below 0.05 indicates the significance of the effect of an expression. A Prob > F value below 0.0001 and a F value = 111.73 indicate the model significance for phenol removal by this process. A small value of Prob > F (below 0.05) indicates the result randomness and the significant impact of the model expressions on the response (Table 5). The “Lack of Fit” of 83.57 indicates that the mismatch is significant. It is only 0.01% more likely to cause a Lack of fit of this magnitude because noise can measure the SNR with sufficient accuracy. A ratio above 4 is acceptable. An adequate accuracy ratio of 43.382 indicates a sufficient signal. It is possible to use this model for moving in the design space. Using the quadratic model, the mathematical relationship between the dependent response and the independent variables was explained. The mathematical expression of the relationship between independent variables (time, concentration, pH, and the molar ratio of UV/SPIONs) and phenol removal percentage are presented with regard to the factors coded in the eqn (3):| Y (Efficiency removal) = 81.15 – 8.52 [pH] − 10.49 [Phenol Concentration] + 10.66 [Time] + 10.77 [UV/SPIONs] + 0.26 [pH. UV/SPIONs] − 0.14 [Phenol Concentration Time] − 0.088 [Phenol Concentration UV/SPIONs]+ 0.23 [Time UV/SPIONs] − 8.87 [pH2] − 6.89 [Phenol Concentration2] – 2.99 [Time2] − 7.98 [UV/SPIONs]2 | (3) |
| Term | Coefficient | Standard error |
|---|---|---|
| Constant | 81.15 | 0.94 |
| pH | −8.52 | 1.27 |
| UV/SPIONs | 10.77 | 1.58 |
| Phenol concentration | – 10.49 | 0.59 |
| Time | + 10.66 | 0.57 |
| pH. UV/SPIONs | 0.26 | 1.67 |
| Phenol concentration. UV/SPIONs | 0.088 | 0.62 |
| Time. UV/SPIONs | 0.23 | 0.56 |
| Source | Sum of squares | df | Mean square | F value | p-value Prob > F | |
|---|---|---|---|---|---|---|
| Model | 6590.86 | 12 | 549.24 | 111.73 | <0.0001 | Significant |
| A-pH | 221.18 | 1 | 221.18 | 44.99 | <0.0001 | |
| B-Phenol (Conc.) | 1551.95 | 1 | 1551.95 | 315.70 | <0.0001 | |
| C-Time | 1719.22 | 1 | 1719.22 | 349.73 | <0.0001 | |
| D-UV/SPIONs | 228.07 | 1 | 228.07 | 46.40 | <0.0001 | |
| AB | 0.063 | 1 | 0.063 | 0.33 | 0.5704 | |
| AC | 0.039 | 1 | 0.039 | 0.20 | 0.6573 | |
| AD | 0.12 | 1 | 0.12 | 0.024 | 0.8778 | |
| BC | 0.22 | 1 | 0.22 | 0.046 | 0.8336 | |
| BD | 0.097 | 1 | 0.097 | 0.020 | 0.8897 | |
| CD | 0.84 | 1 | 0.84 | 0.17 | 0.6851 | |
| A2 | 152.17 | 1 | 152.17 | 30.96 | <0.0001 | |
| B2 | 141.50 | 1 | 141.50 | 28.78 | <0.0001 | |
| C2 | 16.00 | 1 | 16.00 | 3.25 | 0.0890 | |
| D2 | 174.89 | 1 | 174.89 | 35.58 | <0.0001 | |
| Residual | 83.57 | 17 | 4.92 | |||
| Lack of fit | 83.57 | 8 | 10.45 | 0.78 | 0.6955 | Not significant |
| Pure error | 0.000 | 9 | 0.000 | |||
| Cor total | 6674.43 | 29 |
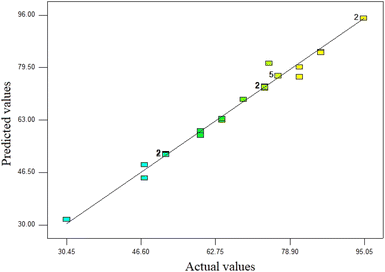
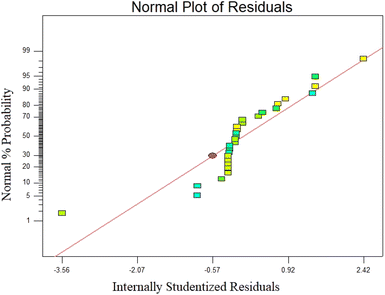
′′Prob > F′′ below 0.05 denotes the significance of the model conditions. Values above 0.1 denote insignificant model conditions. According to statistical analysis, the coefficients X1, X2, X3, X4, X12, X22, and X42 were statistically significant. According to the F value presented in Table 5, time (F value: 349.73) has the highest impact on the photocatalyst process for phenol removal following concentration and UV/SPION ratio. Also, the interaction between concentration and time compared to other interactions showed an F value above 0.17. The large value of the determination coefficient (R2 = 0.9875), which is a good criterion for the model's fit, shows a high correlation between the experimental responses and the predicted response. Also, adjusted R2 (0.9786) supported the high correlation between the theoretical and observed values (Table 6). Fig. 7 confirms that the predicted values are very close to the (actual) experimental values. The coefficient of one factor indicates its effect; the coefficients of the two combined factors indicate the interaction between them, and the second-order expression implies the quadratic effect. Based on the ANOVA results, the quadratic model (equivalent to 3) is sufficient to predict the removal of phenol by a photocatalytic process in the studied range of variables. Residual shows the difference between an observed value (Y) and its fit (Ŷ).62 The normal distribution of residues is investigated using normal probability diagrams. The normal probability graphs of the residuals did not show a large deviation from normal (Fig. 8). The coefficient of determination (R2) expresses the polynomial model's quality, and the F test (Fisher test) is used to determine the importance of the coefficients.63,64 Model components are assessed through a p-value. The parameter coefficients and other features of the mathematical model are shown in Table 6. Using a correlation coefficient (R2), the model accuracy is checked. The p-values were below 0.05.65 The R2 value demonstrated 98.75 percent of the changes in reduction of efficiency caused by independent variables. The model was found to be ineffective to account for only 1.25% of the changes. Considering the higher equality diagram (Fig. 7), there is a good correlation between the predicted and experimental values, which indicates sufficient model accuracy for the prediction of the response.
| Std. dev. | 2.22 | R-squared | 0.9875 |
|---|---|---|---|
| Mean | 68.23 | Adj R-squared | 0.9786 |
| C.V.% | 3.25 | Pred R-squared | 0.9431 |
| PRESS | 16.87 | Adeq precision | 43.382 |
3.7. The effect of influential variables on phenol removal
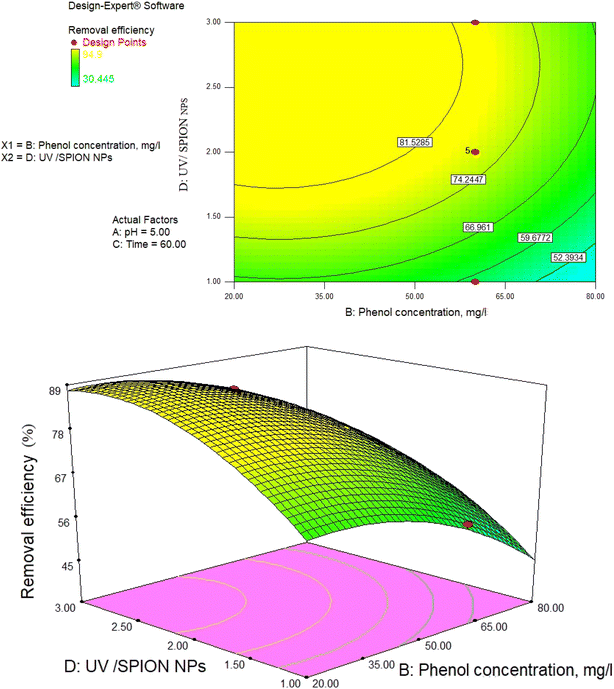
The interactive effects of phenol removal process variables were studied using a photocatalytic process by drawing 2D and 3D surface curves against both independent variables with applying constant values for other variables. Fig. 9–14 show the central level (0) of the 3D surface diagrams and 2D response lines (phenol removal percentage) of the interaction between variables. Fig. 9–14 show the effect of the amount of independent variables in this study on the phenol removal efficiency.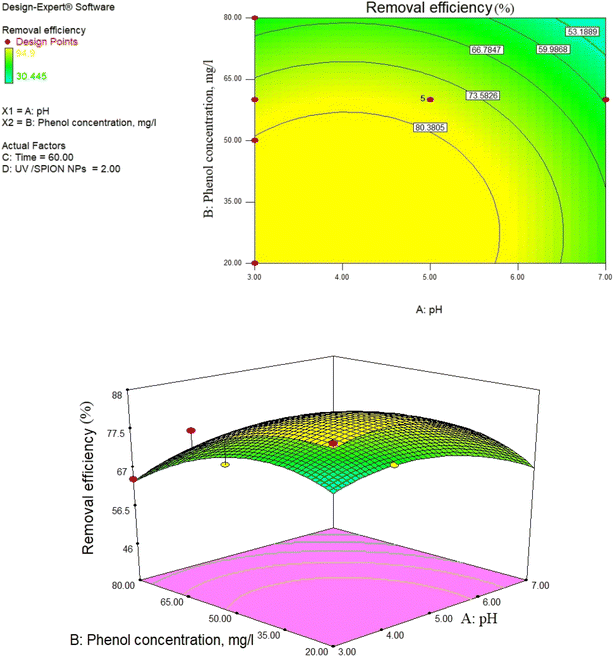 | ||
| Fig. 9 2D contour and 3D surface plot of the interaction effect of phenol concentration and pH on phenol removal efficiency by a photocatalytic degradation process at constant SPION ratio and time. | ||
3.8. Impact of pH and photocatalyst concentration
pH as a crucial factor has an active impact on most processes. The pH effect on the removal of phenol is relative to the solution pH and the functional groups available in the SPIONs, affecting its surface charge. As observed in Fig. 9, 81% removal of phenol was obtained at a pH of 3 and a concentration of 65 mg L−1, and 73.5% removal was found at 60 min and pH of 4.The reason for this is the generation of the OH radicals by the photocatalytic process in the presence of SPIONs. The removal percentage of phenol increased with decreasing solution pH. Nevertheless, it was noted that phenol removal decreases rapidly at higher pH (Fig. 9–11). The pH of the solution is a critical parameter that affects the ionization of contaminants and adsorbent surface.66,67 In 2013, de Abreu et al. conducted a study on the use of nanoparticles in treating dairy wastewater. They found that a pH level of 4 was the most effective.68 One of the reasons for increasing the efficiency of phenol removal under acidic conditions could be that under acidic conditions, the superoxide radical  reacts with hydrogen ions and produces perhydroxyl radicals (H2O*). As a result, perhydroxyl radicals can form hydrogen peroxide, which becomes OH*. But it is understandable that in alkaline conditions, the rate of phenol decomposition is lower than in acidic and neutral conditions, and the reason for this can be attributed to the rapid decomposition of hydroxyl radicals in these conditions. Our detected results have also been obtained in other studies.69–71
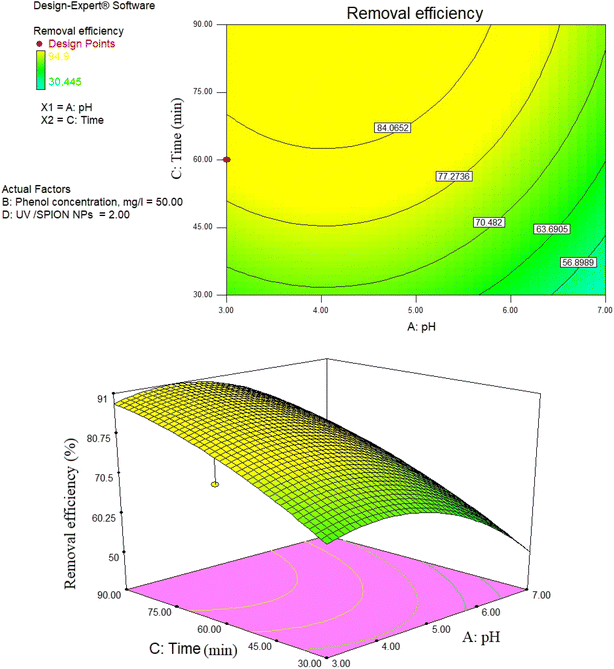 | ||
| Fig. 10 2D contour and 3D surface plot of the interaction effect of time and pH on removal efficiency of phenol by photocatalytic degradation process at constant SPION ratio and phenol concentration. | ||
When the SPION particles are exposed to UV radiation, the electrons of the orbital layer are excited, and positively charged holes are produced on the SPIONs. Positive holes (h) react with OH and excited electrons react with O2 adsorbed on the SPION surface.
These findings are in agreement with the findings of Guo et al.,72 which showed the critical role of H+ions in the formation of OH radicals. At pH values higher than 11, compared to neutral pH, phenol decomposition will be less due to the presence of phenol molecules in the form of phenolate. The reactivity of these anions is higher than phenol molecules. Besides, the concentration of OH radicals increases in alkaline conditions.73 Although this may be due to the greater phenol degradation at the alkaline pH compared to the neutral pH, a higher OH- concentration in the solution prevents the UV penetration from reaching the catalyst surface. In addition, high pH contributes to the formation of carbonate ions, which are effective adsorbents of OH– ions and are able to decrease the degradation rate.74,75 This can cause less phenol degradation at alkaline pH compared to acidic pH.
3.9. The catalyst dose impact on photocatalytic processes
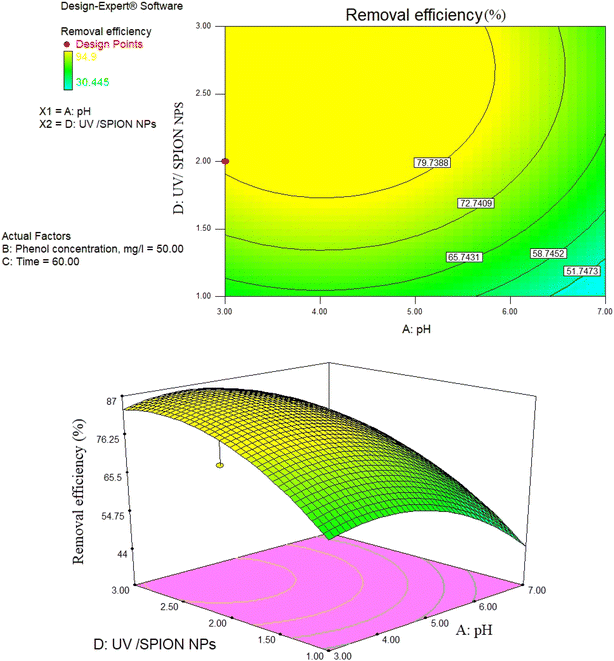
Catalyst dose is a critical parameter that has been widely investigated. The effect of catalyst concentration and UV on the phenol photocatalytic decomposition is shown in Fig. 10. As expected, phenol decomposition increases with increasing UV and catalyst concentration from 1 to 2. According to some studies,75,76 this is due to the fact that increasing the number of SPIONs particles increases the number of available active sites, and thus increasing the number of photons increases the adsorption of phenol molecule. However, when the UV/SPION ratio was increased to 2.5, no significant increase in phenol decomposition was observed. The reason for this is that when there are significant amounts of catalyst present, its accumulation and deposition can occur, resulting in a decrease in the amount of catalyst available for absorbing photons. The effect and opacity of the extra SPIONs screening act as a shield, thus preventing light penetration and causing loss of surface area for light absorption and reduced catalytic activity, as previously reported.72,75,77,78 Therefore, the optimal UV/dose of SPIONs was determined to be 2.Delnavaz et al. (2014) optimized and predicted the photocatalytic process by titanium nanoparticles immobilized on the concrete surface to treat phenol-containing water by the Taguchi method and predicted the removal efficiency by an artificial neural network. Their results showed that the effect of input pollutant concentration and pH is greater than other factors.79
3.10. Impact of initial phenol concentration and contact time
Another essential factor in experimental processes is contact time. As observed in Fig. 10, 12, and 14, more phenol was removed as the contact time increased, which is ascribed to the high presence of active sites over time. Moreover, it results in the production of hydroxyl radicals required for the reaction due to the increase in time, and the produced hydroxyl radicals would have adequate time for reaction with organic compounds.80The effect of contact time on phenol removal rate at different initial concentrations (20, 50, and 80 mg L−1) was investigated as shown in Fig. 12. The results show that the contact time to reach equilibrium is approximately 60 minutes for all experiments. Therefore, the selected contact time of 60 minutes, which was used in our experiments, is sufficient to achieve equilibrium. It was noted that the adsorption process is very fast.
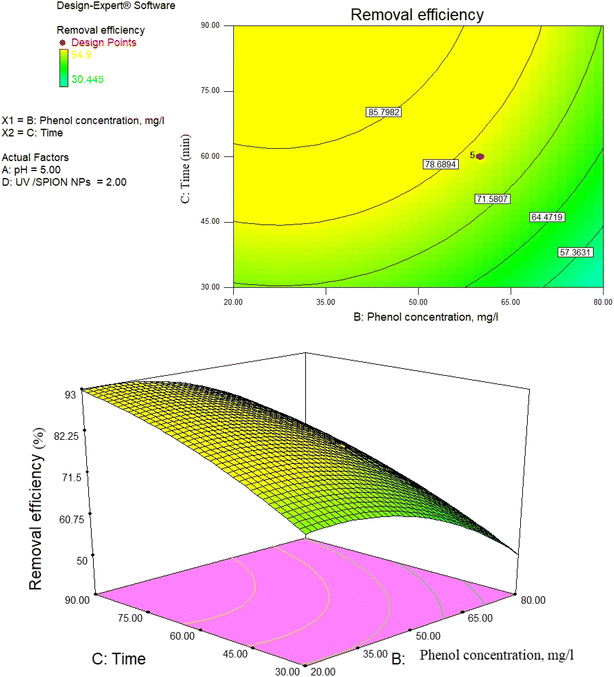 | ||
| Fig. 12 3D surface and contour plot of the interaction effect of phenol concentration and time on phenol removal efficiency by photocatalytic degradation process at constant pH and UV/SPION ratio. | ||
In fact, for all the experiments, more than 75% of the equilibrium adsorption capacity was obtained in the first 40 minutes. The initial rapid adsorption is probably because of the specific structure of SPIONs, which allows the immediate contact of phenol with the surface active sites. By further increasing the time, the remaining active sites become less available and the propulsive force decreases, so it takes a long time to reach equilibrium. Fig. 13 indicates that the phenol concentration over the process is negative over time. For contact times of 35–65 minutes, a rapid increase is observed in removal efficiency. According to previous work, the removal efficiency decreases at high concentrations because the catalyst coating surface is saturated with the reactants.81 In their study, Zamankhan et al. (2013) removed phenol from the liquid phase with a nano-zinc oxide photocatalyst. The removal efficiency after 5 hours was more than 90%.82
3.11. UV/SPION ratio
The obtained results indicate that it is necessary to increase the amount of OH and SPIONs in the reaction medium to increase the efficiency at higher concentrations.55The UV/SPION ratio = 3 provided higher phenol removal rates. According to research findings, using high molar ratios does not result in increased removal efficiency since higher molar ratios indicate the combination of additional amounts of UV and OH radicals generated during the process and lead to weaker OH˙ with lower activity. The radicals (HO˙) are formed due to the combination of the hydroxyl radical in the reaction zone and the UV in the medium, which are weaker and helpful for reducing the removal efficiency.83,84
As observed in Fig. 14, the removal percentage of phenol increases with increasing the amount of photocatalyst, which is related to the increase in the number of photocatalysts, increasing the number of available active centers. In addition, by increasing the amount of photocatalyst, the catalyst surface for adsorption increases, leading to the adsorption of more contaminants.78
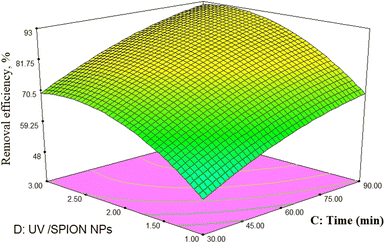 | ||
| Fig. 14 The 3D surface of the interaction effect of time and UV/SPION ratio on RB19 removal efficiency by photocatalytic degradation process at constant pH and phenol concentration. | ||
3.12. Optimization of the phenol removal process
Design-Expert software (Stat-Ease, trial version 7.1) was used to perform an optimization for determining the optimal conditions for phenol removal. Optimal conditions were a pH of 3, time of 60 min, UV/SPION ratio of 2, initial phenol concentration of 50 mg L; and phenol removal efficiency was predicted to be 80.79% under optimal conditions. The experiment was performed under these optimal conditions to confirm the predicted optimal values.The obtained value was 94.9%, which is closely related to the predicted phenol removal percentage (80.79%). The desirability of a near-unity model with lower error illustrates the model applicability.85 The utility of 0.952 (Fig. 15a) supports the model application and predicted responses. Additionally, Fig. 14b indicates the desirability impact of the individual process variables. The utility values of these variables are approximate to unity, which indicates matching of the model with the operational parameters. Plus values show the fit level of each variable to the model.
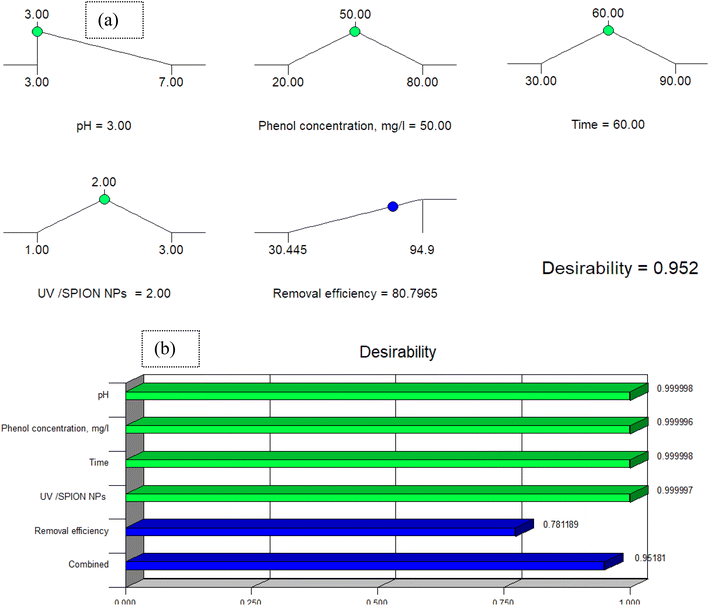 | ||
| Fig. 15 (a) The desirability effect for phenol removal and (b) desirability effect of the individual parameters. | ||
3.13. Regeneration of synthesized iron oxide (Fe3O4) superparamagnetic nanoparticles
An important benefit of using superparamagnetic nano-adsorbent (Fe3O4) is that it is recyclable. The nano-adsorbent can be reused up to 5 times and still maintain its high efficiency and capacity for adsorption without any major reduction. In general, the major successes of this project are the reduction of raw material purchasing costs and the increase in speed for separating the adsorbent and pollutant absorbed from the liquid phase.The results of the cyclic application of superparamagnetic nano-absorbent (Fe3O4) in the removal of phenol are shown in Fig. 16 under optimal conditions.
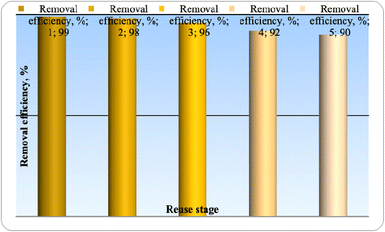 | ||
| Fig. 16 Recovery of superparamagnetic nano-absorbent (Fe3O4) after five times in optimal conditions. | ||
In order to check the possibility of regeneration and reuse of the nanoparticles under study, a sample containing 50% by volume of phenol was prepared, SPIONs were placed in it, and after 60 minutes, the removal efficiency was calculated. Then, SPIONs were separated from the solution and were washed and placed again in a container containing 50 percent of the volume of the sample and the pollutant removal efficiency was recorded again; this process was repeated 5 times. According to the figure, these nanoparticles maintains consistent removal efficiency even after being used five times for phenol adsorption, indicating that they can still effectively remove pollutants.
3.14. Comparison of photocatalytic decomposition using nano-absorbent (Fe3O4) with other nanoparticles in the removal of different pollutants
Table 7 shows the conditions for removing a number of pollutants from the environment by photocatalytic processes. As can be seen, SPIONs are among the cases with high pollutant removal efficiency compared to the use of different nanocatalysts. In addition, according to the amount of nanocatalyst used in the process and the time of the process, it can be concluded that the application of this photocatalyst is also economical.| Ref. | Catalyst | Amount of catalyst used (gr) | Pollutant under study | Light | Process time | Efficiency removal (%) |
|---|---|---|---|---|---|---|
| This study | SPIONs | — | Phenol | UV | 60 | 94.9 |
| 31 | Fe3O4@rGO@AgI | 0.4 g/350 mL | Phenol | UV | — | 99 |
| 32 | Fe3O4/TiO2 | — | Rhodamine B dye | UV | 120 | 91 |
| 86 | MNPs@BNPs-ZnS | 0.08 | MB | Vis | 90 | 37 |
| MNPs@BNPs-ZnS | 0.08 | MB | UV | 90 | 25.4 | |
| MNPs@BNPs-ZnS | 0.08 | MO | Vis | 90 | 33 | |
| MNPs@BNPs@ZnO–ZnS | 0.08 | MO | Sun light | 120 | 5 | |
| 87 | ZnO + alginate 2% | 0.025–0.3 | MB | UV | 240 | 63 |
| 88 | ZnO–ZnS–MnO2 | — | MB | Vis | 140 | 97 |
| 89 | Cs–ZnS-NPs | — | Acid brown | UV | 180 | 92 |
| 90 | ZnO@ZnS CSNPs | — | Congo red | UV | 120 | 85 |
| 91 | ZnO–ZnS nanowire | — | MO | Hg-arc (300 W) | 40 | 90 |
| 92 | ZnO@ZnS core–shell | 0.05 | Rose bengal | UV | 120 | 50 |
| 89 | Chitosan–ZnS-NPs | 50 mg | Acid black | UV | 234 | 92.6 |
| 93 | ZnS–CdS | — | MO | Uv–visible | 120 | 44.1 |
| 94 | ZnO NPs | 20 mg | MB | UV | 90 | 55 |
| 95 | Ag–AgBr–ZnO | — | RhB | Sunlight | 60 | 90 |
| 96 | Ag–ZnO | — | MB | Sunlight | 120 | 72 |
| 86 | Fe3O4@BNPs@ZnO–ZnS | 0.08 | MO, MB | Mercury lamp 125 | 90 | 85%,67 MO (80.5%) |
| 97 | SiO2@TiO2 | — | Rhodamine B | UV | — | ∼99.9 |
4. Conclusions
The photocatalytic process was optimized using (Fe3O4) superparamagnetic nanoparticles to remove phenol from an aqueous solution by CCD in RSM. We studied the impact of the oxidation process parameters, the molar ratio of UV/SPIONs (1–3), pH (3–7), contact time (30–90 min), and initial phenol concentration (20–80 mg L−1). Using CCD RSM, the interaction of optimal conditions and process parameters was investigated. This design was also used to create a quadratic model equation with independent variables and their simultaneous and combined effect on the response variable. The statistical data was analyzed using one-way ANOVA. The observed values are highly approximate to the predicted (theoretical) response values. Optimal conditions, including a pH of 3, contact time of 60 min, phenol concentration of 80 mg L−1, and UV/SPIONs molar ratio of 3 were achieved; a removal efficiency of 93.77 percent was achieved under the aforementioned conditions. The determination coefficient (R2 = 0.9875%) and the adjusted R2 (0.9786%) values demonstrated that RSM could describe phenol removal by this process. According to the ANOVA results, the quadratic model designed by RSM had statistical significance for % phenol removal. Our research findings indicated that it is possible to use RSM to optimize process parameters for phenol removal from aqueous solution as well as the UV/SPIONs photocatalytic process. Moreover, a remarkable point observed in the use of synthesized nano-adsorbent was its recyclability up to 4 times, and according to the experiment, there is no significant change in its removal potential.The studied magnetic nanoparticles have unique physical and chemical properties and show high magnetic properties and very good stability and can be easily separated from solution by applying an external magnetic field.
Author contributions
All authors contributed to the study conception and design. The authors indicated in parentheses made substantial contributions to the following tasks of research: conceptualization (Edris Bazrafshan, Leili Mohammadi, Amin Allah Zarei, Jafar Mosafer, Muhammad Nadeem Zafar, and Abdollah Dargahi), writing—original draft, writing—revision, investigation, methodology (Edris Bazrafshan, Leili Mohammadi, Amin Allah Zarei, Jafar Mosafer, Muhammad Nadeem Zafar, and Abdollah Dargahi), and supervision (Leili Mohammadi, Jafar Mosafer, Muhammad Nadeem Zafar, and Abdollah Dargahi). All the authors read and approved the final manuscript.Conflicts of interest
The authors declare no competing interests.Acknowledgements
This work was supported by the Research Grant of Torbat Heydariyeh University of Medical Sciences, Iran (Grant No. IR.THUMS.REC.1396.51).References
- A. Dargahi, H. R. Barzoki, M. Vosoughi and S. A. Mokhtari, Arabian J. Chem., 2022, 15, 103801 CrossRef CAS.
- R. Shokoohi, R. A. Gillani, M. M. Mahmoudi and A. Dargahi, Desalin. Water Treat., 2018, 101, 185–192 CrossRef CAS.
- M. Tasbihi, C. R. Ngah, N. Aziz, A. Mansor, A. Z. Abdullah, L. K. Teong and A. R. Mohamed, Ind. Eng. Chem. Res., 2007, 46, 9006–9014 CrossRef CAS.
- L. Mohammadi, M. N. Zafar, M. Bashir, S. H. Sumrra, S. S. Shafqat, A. A. Zarei, H. Dahmardeh, I. Ahmad and M. I. Halawa, J. Environ. Chem. Eng., 2021, 9, 105576 CrossRef CAS.
- M. Bertelli and E. Selli, J. Hazard. Mater., 2006, 138, 46–52 CrossRef CAS PubMed.
- A. Kumar, S. Kumar, S. Kumar and D. V. Gupta, J. Hazard. Mater., 2007, 147, 155–166 CrossRef CAS PubMed.
- A. Almasi, M. Mahmoudi, M. Mohammadi, A. Dargahi and H. Biglari, Toxin Rev., 2021, 40, 189–197 CrossRef CAS.
- B. Hameed and A. Rahman, J. Hazard. Mater., 2008, 160, 576–581 CrossRef CAS PubMed.
- M. L. Chin, A. R. Mohamed and S. Bhatia, J. Teknol., 2004, 91–103 Search PubMed.
- S. Patnaik, D. P. Sahoo and K. Parida, J. Colloid Interface Sci., 2020, 560, 519–535 CrossRef CAS PubMed.
- D. Suryaman, K. Hasegawa and S. Kagaya, Chemosphere, 2006, 65, 2502–2506 CrossRef CAS PubMed.
- G. Moussavi, M. Mahmoudi and B. Barikbin, Water Res., 2009, 43, 1295–1302 CrossRef CAS PubMed.
- B. Ayati, H. Ganjidoust and M. M. Fattah, J. Environ. Health Sci. Eng., 2007, 4, 107–112 CAS.
- G. Busca, S. Berardinelli, C. Resini and L. Arrighi, J. Hazard. Mater., 2008, 160, 265–288 CrossRef CAS PubMed.
- D. Manojlovic, D. Ostojic, B. Obradovic, M. M. Kuraica, V. Krsmanovic and J. Puric, Desalination, 2007, 213, 116–122 CrossRef CAS.
- L. Mohammadi, E. Bazrafshan, M. Noroozifar, A. Ansari-Moghaddam, F. Barahuie and D. Balarak, J. Chem., 2017, 2017, 1–10 CrossRef.
- K. Pal, A. Si, G. S. El-Sayyad, M. A. Elkodous, R. Kumar, A. I. El-Batal, S. Kralj and S. Thomas, Crit. Rev. Solid State Mater. Sci., 2021, 46, 385–449 CrossRef CAS.
- Q. Chen, F. Ji, T. Liu, P. Yan, W. Guan and X. Xu, Chem. Eng. J., 2013, 229, 57–65 CrossRef CAS.
- S. Patnaik, K. K. Das, A. Mohanty and K. Parida, Catal. Today, 2018, 315, 52–66 CrossRef CAS.
- S. Mansingh, D. Padhi and K. Parida, Appl. Surf. Sci., 2019, 466, 679–690 CrossRef CAS.
- P. Mishra, A. Behera, D. Kandi, S. Ratha and K. Parida, Inorg. Chem., 2020, 59, 4255–4272 CrossRef CAS PubMed.
- P. Mishra, S. Patnaik and K. Parida, Catal. Sci. Technol., 2019, 9, 916–941 RSC.
- F. J. Beltrán, F. J. Rivas and R. Montero-de-Espinosa, Water Res., 2005, 39, 3553–3564 CrossRef PubMed.
- B. Kasprzyk-Hordern, M. Ziółek and J. Nawrocki, Appl. Catal., B, 2003, 46, 639–669 CrossRef CAS.
- T. Sreethawong and S. Chavadej, J. Hazard. Mater., 2008, 155, 486–493 CrossRef CAS PubMed.
- E. Bazrafshan, F. KordMostafapoor, M. M. Soori and A. H. Mahvi, Fresenius Environ. Bull., 2012, 21, 2694–2701 CAS.
- D. S. Bhatkhande, V. G. Pangarkar and A. A. Beenackers, Water Res., 2003, 37, 1223–1230 CrossRef CAS PubMed.
- T. Mano, S. Nishimoto, Y. Kameshima and M. Miyake, Chem. Eng. J., 2015, 264, 221–229 CrossRef CAS.
- S. Shanmugapriya, M. Premalatha and N. Anantharaman, J. Eng. Appl. Sci., 2008, 3, 36–41 Search PubMed.
- M. Aghaei, B. Khezri, K. Zare and H. Aghaei, Iran. J. Chem. Chem. Eng., 2011, 30, 89 CAS.
- G. U. Rehman, M. Tahir, P. Goh, A. Ismail and I. U. Khan, Powder Technol., 2019, 356, 547–558 CrossRef CAS.
- N. Madima, K. K. Kefeni, S. B. Mishra, A. K. Mishra and A. T. Kuvarega, Inorg. Chem. Commun., 2022, 145, 109966 CrossRef CAS.
- I. Ahmad, M. Aslam, U. Jabeen, M. N. Zafar, M. N. K. Malghani, N. Alwadai, F. H. Alshammari, A. S. Almuslem and Z. Ullah, 2022.
- Y. P. Katsenovich and F. R. Miralles-Wilhelm, Sci. Total Environ., 2009, 407, 4986–4993 CrossRef CAS PubMed.
- P. G. Tratnyek, R. L. Johnson, G. V. Lowry and R. A. Brown, in Chlorinated Solvent Source Zone Remediation, Springer, 2014, pp. 307–351 Search PubMed.
- E. Bazrafshan, A. H. Mahvi and M. A. Zazouli, Asian J. Chem., 2011, 23, 5506 CAS.
- J. Hizal and R. Apak, J. Colloid Interface Sci., 2006, 295, 1–13 CrossRef CAS PubMed.
- L. Zhang, R. He and H.-C. Gu, Appl. Surf. Sci., 2006, 253, 2611–2617 CrossRef CAS.
- T. Moriguchi, K. Yano, M. Tahara and K. Yaguchi, J. Colloid Interface Sci., 2005, 283, 300–310 CrossRef CAS PubMed.
- S. Rahdar, K. Pal, L. Mohammadi, A. Rahdar, Y. Goharniya, S. Samani and G. Z. Kyzas, J. Mol. Struct., 2021, 1231, 129686 CrossRef CAS.
- S. Alizadeh, H. Sadeghi, M. Vosoughi, A. Dargahi and S. A. Mokhtari, Int. J. Environ. Anal. Chem., 2022, 102, 3707–3721 CrossRef CAS.
- A. Dargahi, R. A. Gilan, M. R. Samarghandi, H. ZolghadrNasab and F. Karimi, Biomass Convers. Biorefin., 2022, 1–15 Search PubMed.
- A. Rahmani and A. Enayati Movafagh, J. Water Wastewater, 2006, 17, 32–37 Search PubMed.
- R. Shokoohi, L. Ebrahimzadeh, A. R. Rahmani, S. J. Ebrahimi and M. R. Samarghandi, J. Water Wastewater, 2010, 20, 30–35 Search PubMed.
- E. Bazrafshan, A. Mahvi, S. Nasseri and M. Shaieghi, J. Environ. Health Sci. Eng., 2007, 4, 127–132 CAS.
- S. Hemmati Borji, S. Nasseri, R. Nabizadeh Nodehi, A.H. Mahvi and A.H. Javadi, Iranian Journal of Health and Environment, 2011, 3, 369–380 Search PubMed.
- A. Seidmohammadi, Y. Vaziri, A. Dargahi and H. Z. Nasab, Biomass Convers. Biorefin., 2023, 9057–9073 CrossRef CAS.
- A. Almasi, A. Dargahi, M. Mohammadi, A. Azizi, A. Karami, F. Baniamerian and Z. Saeidimoghadam, Int. J. Pharm. Technol., 2016, 8, 16728–16736 CAS.
- A. Mattei, F. Mealli and A. Nodehi, in Handbook of Labor, Human Resources and Population Economics, Springer, 2022, pp. 1–41 Search PubMed.
- E. Bazrafshan, L. Mohammadi, M. NadeemZafar, A. Dargahi and F. Pirdadeh, Arabian J. Chem., 2023, 16, 104998 CrossRef CAS.
- D. Kanakaraju, M. A. A. Jasni, A. Pace and M. H. Ya, Environ. Sci. Pollut. Res., 2021, 28, 68834–68845 CrossRef CAS PubMed.
- L. Mohammadi, E. Bazrafshan, M. Noroozifar and A. Ansari-Moghaddam, Health Scope, 2016, 5, e40439 CrossRef.
- C. A. Igwegbe, J. O. Ighalo, K. K. Onyechi and O. D. Onukwuli, Sustain. Water Resour. Manag., 2021, 7, 1–16 CrossRef.
- S. Agarry and C. Owabor, Niger. J. Technol., 2012, 31, 346–358 Search PubMed.
- Z. Noori Motlagh, G. Shams Khoramabadi and H. Godini, Journal of Yafteh, 2013, 14, 51–61 Search PubMed.
- A. Bordbar, A. Rastegari, R. Amiri, E. Ranjbakhsh, M. Abbasi and A. Khosropour, Biotechnol. Res. Int., 2014, 2014, 705068 CAS.
- R. Waldron, Phys. Rev., 1955, 99, 1727 CrossRef CAS.
- L. Nalbandian, E. Patrikiadou, V. Zaspalis, A. Patrikidou, E. Hatzidaki and C. N. Papandreou, Curr. Nanosci., 2016, 12, 455–468 CrossRef CAS.
- M. Helmi Rashid Farimani, N. Shahtahmassebi, M. Rezaee Roknabadi and N. Ghows, Nanomed. J., 2014, 1, 71–78 Search PubMed.
- H. El Ghandoor, H. Zidan, M. M. Khalil and M. Ismail, Int. J. Electrochem. Sci., 2012, 7, 5734–5745 CrossRef CAS.
- A. Behera, D. Kandi, S. M. Majhi, S. Martha and K. Parida, Beilstein J. Nanotechnol., 2018, 9, 436–446 CrossRef CAS PubMed.
- A. Dargahi, M. Moradi, R. Marafat, M. Vosoughi, S. A. Mokhtari, K. Hasani and S. M. Asl, Biomass Convers. Biorefin., 2021, 1–18 Search PubMed.
- A. Dargahi, M. Vosoughi, S. A. Mokhtari, Y. Vaziri and M. Alighadri, Arabian J. Chem., 2022, 15, 103648 CrossRef CAS.
- K. Hasani, M. Moradi, S. A. Mokhtari, H. Sadeghi, A. Dargahi and M. Vosoughi, Int. J. Chem. React. Eng., 2021, 19, 261–275 CrossRef CAS.
- O. Gholipoor and S. A. Hosseini, New J. Chem., 2021, 45, 2536–2549 RSC.
- L. Mohamadi, E. Bazrafshan, M. Noroozifar and A. Ansari-Moghaddam, J. Mazandaran Univ. Med. Sci., 2016, 26, 129–144 Search PubMed.
- J. Wang, Z. Jia, S. Liang, P. Qin, W. Zhang, W. Wang, T. Sercombe and L. Zhang, Mater. Des., 2018, 140, 73–84 CrossRef CAS.
- P. de Abreu, E. L. Pereira, C. M. M. Campos and F. L. Naves, Acta Sci., Technol., 2013, 35, 75–81 CAS.
- G. Asgari, A. Chavoshani and A. Rahmani, Water Wastewater, 2014, 29–37 Search PubMed.
- G. Asgari, A. Seidmohammadi, A. Chavoshani and A. R. Rahmani, J. Res. Health Sci., 2013, 14, 36–39 Search PubMed.
- R. Shokohi, A. H. Mahvi and Z. Bonyadi, J. Mazandaran Univ. Med. Sci., 2009, 19, 59–67 Search PubMed.
- Z. Guo, R. Ma and G. Li, Chem. Eng. J., 2006, 119, 55–59 CrossRef CAS.
- D. S. Bhatkhande, V. G. Pangarkar and A. A. C. M. Beenackers, J. Chem. Technol. Biotechnol., 2002, 77, 102–116 CrossRef CAS.
- F. Akbal and A. Nur Onar, Environ. Monit. Assess., 2003, 83, 295–302 CrossRef CAS PubMed.
- N. Kashif and F. Ouyang, J. Environ. Sci., 2009, 21, 527–533 CrossRef CAS PubMed.
- L. Yang, E. Y. Liya and M. B. Ray, Water Res., 2008, 42, 3480–3488 CrossRef CAS PubMed.
- Y. Paz, C. R. Chim., 2006, 9, 774–787 CrossRef CAS.
- A. Mahvi, M. Ghanbarian, S. Nasseri and A. Khairi, Desalination, 2009, 239, 309–316 CrossRef CAS.
- M. Delnavaz, B. Ayati, H. Ganjidoust and S. Sanjabi, Iran-Water Resour. Res., 2014, 9, 75–87 Search PubMed.
- A. Javid, S. Nasseri, A. Mesdaghinia, M. Alimohammadi, R. M. Aghdam and N. Rastkari, J. Environ. Health Sci. Eng., 2013, 11, 1–6 CrossRef PubMed.
- A. Seid-Mohammadi, Z. Ghorbanian, G. Asgari and A. Dargahi, Desalin. Water Treat., 2020, 193, 369–380 CrossRef CAS.
- H. Zamankhan, B. Ayati and H. Ganjidoust, Nashrieh Shimi va Mohandesi Shimi Iran, 2013, 31, 9–19 Search PubMed.
- J. Roslan, S. Mustapa Kamal, M. Y. KF and N. Abdullah, 2015.
- S. Parastar, Y. Poureshgh, S. Nasseri, M. Vosoughi, H. Golestanifar, S. Hemmati, G. Moradi and A. Asadi, 2012.
- N. Shahzad, D. Pugliese, V. Cauda, M. Shahzad, Z. Shah, M. Baig and E. Tresso, J. Photochem. Photobiol., A, 2017, 337, 192–197 CrossRef CAS.
- M. Khodamorady and K. Bahrami, Heliyon, 2023, 9, e16397 CrossRef CAS PubMed.
- T. Tamer, W. Abou-Taleb, G. Roston, M. Mohyeldin, A. Omer, R. Khalifa and A. Hafez, Environ. Nanotechnol., Monit. Manage., 2018, 10, 112–121 Search PubMed.
- M. Abdullah, P. John, Z. Ahmad, M. N. Ashiq, S. Manzoor, M. I. Ghori, M. U. Nisa, A. G. Abid, K. Y. Butt and S. Ahmed, Appl. Nanosci., 2021, 11, 2361–2370 CrossRef CAS.
- A. Aziz, N. Ali, A. Khan, M. Bilal, S. Malik, N. Ali and H. Khan, Int. J. Biol. Macromol., 2020, 153, 502–512 CrossRef CAS PubMed.
- A. Sadollahkhani, O. Nur, M. Willander, I. Kazeminezhad, V. Khranovskyy, M. O. Eriksson, R. Yakimova and P.-O. Holtz, Ceram. Int., 2015, 41, 7174–7184 CrossRef CAS.
- X. Gao, J. Wang, J. Yu and H. Xu, CrystEngComm, 2015, 17, 6328–6337 RSC.
- A. Sadollahkhani, I. Kazeminezhad, J. Lu, O. Nur, L. Hultman and M. Willander, RSC Adv., 2014, 4, 36940–36950 RSC.
- H.-J. Wang, Y. Cao, L.-L. Wu, S.-S. Wu, A. Raza, N. Liu, J.-Y. Wang and T. Miyazawa, J. Environ. Chem. Eng., 2018, 6, 6771–6779 CrossRef CAS.
- G. Hitkari, S. Singh and G. Pandey, Nano-Struct. Nano-Objects, 2017, 12, 1–9 CrossRef CAS.
- Q. Zhang, C. Tian, A. Wu, Y. Hong, M. Li and H. Fu, J. Alloys Compd., 2013, 563, 269–273 CrossRef CAS.
- X. Chang, Z. Li, X. Zhai, S. Sun, D. Gu, L. Dong, Y. Yin and Y. Zhu, Mater. Des., 2016, 98, 324–332 CrossRef CAS.
- P. Wilhelm and D. Stephan, J. Photochem. Photobiol., A, 2007, 185, 19–25 CrossRef CAS.
| This journal is © The Royal Society of Chemistry 2023 |

