DOI:
10.1039/D3RA03394E
(Paper)
RSC Adv., 2023,
13, 33242-33254
Enhanced electrocatalytic oxygen redox reactions of iron oxide nanorod films by combining oxygen vacancy formation and cobalt doping†
Received
21st May 2023
, Accepted 19th October 2023
First published on 13th November 2023
Abstract
A synergistic effect of Co-doping and vacuum-annealing on electrochemical redox reactions of iron oxide films is demonstrated in the present work. In this research, a series of defect-rich iron oxy/hydroxide nanorod arrays: α-FeOOH, Fe2O3, and FeOx nanorod thin film catalysts were synthesized via a hydrothermal approach followed by thermal and vacuum treatments. Besides, a cobalt doping process was employed to prepare the thin film of Co-doped FeOx nanorods. The morphology, crystallinity, and electrochemical activities of Co-doped oxygen-deficient FeOx (Co-FeOx/FTO) show strong correlations with metal concentration and thermal treatments. The electrochemical measurements demonstrated that the as-deposited Co-doped FeOx NR catalyst could achieve a maximum OER current of 30 mA cm−2, which was six times greater than that recorded by as-deposited Co-doped FeOOH NR catalysts (5.7 mA cm−2) at 1.65 V vs. RHE, confirming the superior electrocatalytic OER activity at the as-deposited Co-doped FeOx NR catalyst after cobalt doping. It is believed that these results are attributed to two factors: the synergistic effect of Co doping and the defect-rich nature of FeOx nanorod catalysts that are used in sustainable energy systems.
1 Introduction
Utilizing renewable energy resources efficiently and cost-effectively is essential for meeting modern civilization's ever-increasing energy needs while also reducing environmental impact.1,2 It is difficult to produce renewable electricity exclusively from solar or wind energy because the energy is intermittent and has a limited storage capacity. Additionally, the transportation sector requires charging systems that comply with environmental standards as well as energy-efficient charge storage technology. These limitations can be overcome with electrochemical water splitting and metal–air batteries.3,4 In particular, hydrogen evolution through electrocatalytic water splitting is an innovative technique that can contribute to a sustainable and clean energy future.5–10 To achieve oxygen evolution reactions or reduction reactions in alkaline media, high overpotentials are required.11 Despite this, OER and ORR exhibit sluggish reaction kinetics and a relatively complex mechanism, which limits their utility as water electrolyzers.12–17 Numerous electrocatalysts have been designed to facilitate or accelerate OER and ORR conversions in light of these factors.8–19 Due to their relatively high electrochemical properties in acidic environments, noble transition metal oxides (e.g. RuO2 and IrO2) are also essential electrode materials for OER.20 On the other hand, platinum-based materials are more likely to undergo the ORR,21,22 although they are less effective for reverse reactions of OERs.23 Their high costs and scarcity prevent electrocatalytic water splitting from being commercially implemented. Therefore, non-noble metal catalysts that are efficient and robust are of paramount importance for electrochemical OER.
In recent years, a platform of earth-abundant-based nanostructured materials has attracted great attention for catalysis, sensing, and energy conversion applications.24–30 Further, nanostructured materials architecture has several advantages in terms of size reduction or pores creation, which improve charge transfer and electrochemical reaction mechanisms.31,32 In this regard, iron oxide nanostructured electrocatalysts have been investigated for energy conversions within water splitting due to their catalytic performance, low cost, non-toxicity, good stability, and excellent physical and chemical properties.33–35 Furthermore, doping processes,36,37 and/or the creation of crystal lattice defects via surface modification (e.g., oxygen vacancies)38–40 have been used as an appealing and effective approach to advance the electrocatalytic performance of iron oxide and enhance the OER, and ORR kinetics.41–43 For instance, Babar et al.44 demonstrated a unique thin film of a FeOx nanobeads electrocatalyst as a bifunctional catalyst for OER and HER in 0.5 M KOH. According to the electrochemical measurements analysis, FeOx nanobead films demonstrated a high current density and significant Tafel slopes of 1.10 and 0.58 mA cm−2, and 54 and 85 mV dec−1 for OER and HER, respectively. These findings were ascribed to the FeOx nanobeads films' high electrochemically active surface area (ECSA) of 1765 cm2. By tuning the temperature of H2 treatment, Zhourong et al.42 developed an efficient and robust approach to developing FeOx/Fe hetero-structures ORR electrocatalysts. The as-prepared Fe2O3@NC-450 showed outstanding ORR features with Eonsets of 1.001 V and E1/2s of 0.838 V, as well as limited current densities of 6.71 mA cm−2. Moreover, they noted that the superior performance was due to a well-defined FeOx/Fe heterostructure with multiple crystal faces, as well as a good interaction between the FeOx/Fe heterostructure and the nitrogen-doped carbon layers.
By doping metal cations (Ni, Fe, V, Cu, Mn, etc.) in metal centers, oxygen or hydrogen adsorption-free energies can be reduced, causing hydrogen and oxygen evolution to proceed at a faster rate.45 Hou et al. suggest that Co2+ could be incorporated into the Fe3+ crystal lattice to enhance the electrocatalytic properties of Co sites in FeOx electrodes.46 A synergetic effect of Co-doping over Fe at appropriate levels over catalytic materials can boost the OER performances of electrocatalytic materials in alkaline conditions. In related work, Gong et al.47 have electrodeposited pure CoOx onto GC support for OER in alkaline media in a related study. According to the authors, adding Fe3+ to the 1 M KOH electrolyte reduces the overpotential and Tafel slope at CoOx catalysts toward OER from 378 to 309 mV and 59.5 to 27.6 mV dec−1, respectively. Furthermore, due to interactions between the Fe and Co atoms, a good stability of 20 h for OER at 10 mA cm−2 was obtained. A recent study published by Guan et al.48 showed that Co3O4 (10%)@FeOx (2%) has better electrocatalytic performance for OER when assayed with 1.0 M KOH than FeCoOx. Additionally, they reported that iron metal (as iron (oxy)/hydroxide) attached to cobalt oxide surface increases Co3O4 charge transfer abilities and facilitates a stable water-binding reaction. Interestingly, as shown by Xiao et al.49 a combination of internal composition alterations and outward morphology via doping or the construction of faulty structures plays a vital role in considerably improving the electrochemical features of metal oxide toward the OER. They claim that as-prepared Zn-doped Co3O4 hollow structure materials show high OER stability and a low overpotential of 353 mV. A mesoporous electrocatalyst made from P-doped CoSe2 nanoclusters on CC has also been demonstrated by Zhang et al.50 for both ORR and OER. Due to the synergy between the hierarchical flake arrays and the P atomic level doping, the catalysts achieved an overpotential of 230 mV for OER. Moreover, Chen et al.51 used an etching-cooperative method to effectively manufacture defect-rich Fe–CoP nanosheet electrocatalysts with Fe doping rates of around 0.18% towards OER. According to electrochemical investigations, the produced nanosheet materials demonstrated high stability (20 h) and cycle durability up to 2000 cycles. Furthermore, the defect-rich FeCoP nanosheet electrocatalysts show a lower Tafel slope and overpotential for OER in 1.0 M KOH (56.1 mV dec−1 and 312 mV) than the reference RuO2 catalyst (62.4 mV dec−1 and 344 mV). According to the authors, nanosheets made from Fe–CoP exhibit superior electrocatalytic activity for OER as a result of both heteroatom doping and defect-rich nanosheets that were found to alter the electronic composition and increase available active sites, respectively. Zhang et al.52 presented a rapid and simple one-step technique for creating large concentrations of oxygen and cation vacancies during the fabrication of porous monolayer NiFe-LDH nanosheet catalysts. They revealed that monolayer NiFe-LDH nanosheets exhibit the best OER behavior by enhancing OH* intermediate bonding strength and water adsorption.
In this study, we constructed a novel structure using Co-doped FeOx nanorods material to provide an efficient and effective electrocatalyst for overall water splitting in alkaline medium. The oxygen vacancy effect and cobalt synergistic interactions in Co-doped FeOx nanorods were highlighted and compared with un-annealed FeOOH NRs and annealed Fe2O3 NRs catalysts for OER and ORR electrocatalytic activity. The fabricated materials' physicochemical properties were investigated using XRD, FE-SEM, EDX, and XPS techniques, and electrochemical measurements were used to examine the electrocatalytic performance of as-synthesized iron oxides nanorods catalysts for water splitting in alkaline conditions using CV, CA, and EIS.
2 Experimental methods
2.1 Materials
Iron(III) chloride (FeCl3, ≥ 98.0%), sodium chloride (NaCl ≥ 99.8%) were acquired from Fisher Scientific. Fluorine-tin oxide substrate (FTO) was obtained from Kaivo optoelectronic technology. Cobalt(II) chloride (CoCl2, > 99%) was received from Sigma Aldrich. All chemicals were used as received.
2.2 Preparation of α-FeOOH, Fe2O3, and FeOx thin film electrodes
The FeO electrodes were grown on a piece of FTO (sheet resistance 8–12). To clean FTO, soap water, DI water, acetone, and ethanol were ultrasonically cleaned for 15 minutes each, then dried with hot air. A hydrothermal method was used to grow green FeOOH films on FTO by mixing FeCl3 and NaCl in an aqueous solution under acidic conditions. Subsequently, it was transferred into a Teflon-lined autoclave and the FTO (1 cm × 2 cm), and heated at 100 °C for 4 h to form α-FeOOH films. The obtained FeOOH NRs/FTO films were annealed under different pressure values (101.3 kPa to 0.01 kPa) at 400 °C for 2 h (rate = 3.0 °C min−1) to produce a brown thin film of hematite NRs (Fe2O3/FTO). After that, a dark green thin film of the FeOx NRs/FTO was obtained via the thermal treatment of the Fe2O3 NRs at 400 °C for 2 h under a vacuum. The final step was to apply an electrodeposition step at a controlled charge of 5–20 mC cm−2 from a cobalt precursor solution. This resulted in a reddish-brown thin film of Co-doped FeOx NRs/FTO. The mass loading of catalysts on FTO substrates is approximately 60–65 mg cm−2. Lastly, electrodeposition was performed with a 3-electrode setup using an electrochemical workstation. The FeOx or FeOOH/FTO thin film is used as a working electrode, Pt wire counter electrode, and sat. Ag/AgCl reference electrode. Using cobalt precursor solution at −2.0 V, a controlled charge of 2–7 mC cm−2 was applied to generate a thin reddish-brown FeOx NRs/FTO film.
2.3 Catalyst characterization
The morphology and element composition of the fabricated thin films of iron oxide samples were explored using a scanning electron microscope (SEM, JSM-6380LA), and armed with an energy-dispersive X-ray spectroscopy (EDX) analyzer, respectively. The crystallinity and purity of the samples were examined by X-ray diffraction (XRD) on Bruker D8-advance diffractometer using Cu Kα radiation (λ = 1.5418 Å). XPS analysis of the materials was surveyed by XPS (Escalab 250 spectrometer, Thermo Fisher). The electrochemical features of the obtained materials was determined by cyclic voltammetry (CV), chronoamperometry (CA), and electrochemical impedance spectroscopy (EIS) which were performed via the three-electrode pyrex glass cell using a computerized potentiostat/galvanostat (Autolab, PGSTAT30) with NOVA 1.11 software. The cell consists of a Pt wire and Ag/AgCl (3.0 M KCl) as counter and reference electrodes, respectively, and the fabricated thin films of iron oxides grown on FTO were employed as working electrodes. The electrodes were further tested for long-term stability by cycling between 0.2 and 1.75 V (versus RHE) for 100 cycles. After 100 CVs, the FeOx /FTO electrode was reactivated compared to a fresh sample for the reproducibility test. Oxygen redox reactions were conducted using 1.0 M KOH at 25 °C versus RHE. At room temperature, OER and ORR experiments were conducted by applying the cathodic-anodic potential versus a reference electrode in 1.0 M KOH electrolyte in air, N2, and O2-saturated conditions with a scan rate of 10 mV s−1. In order to evaluate the durability of the fabricated electrode materials, CA characterization was performed by fixing the potentials of the electrode materials. In addition, EIS characterization was completed at frequencies between 10−2 and 200 kHz with 30 mV amplitudes at 1.6 V bias versus RHE in 1.0 M KOH.
3 Results and discussion
3.1 Crystalline, structural, and surface features of FeOx/FTO electrodes
The Oxygen deficient FeOx/FTO and Co-doped FeOx/FTO electrode materials were obtained by hydrothermal approaches and followed by an electrodeposition approach. Fig. S1† demonstrates the different phases for oxygen-deficient Co-doped FeOx/FTO electrode catalysts. The synthesis procedures of Co-doped FeOx NRs/FTO catalysts were carried out via three steps: during the first step, a light green thin film of α-FeOOH NRs was assembled on FTO substrate by a hydrothermal method in acidic media (pH 1.5) at 100 °C for 4 h, then the obtained FeOOH NRs/FTO film was undergoing to an annealing procedure at 450 °C for 2 h under atmosphere to be converted to a brown thin film of hematite NRs (Fe2O3/FTO). After that, a dark green film of the FeOx NRs/FTO was created via the thermal treatment of the Fe2O3 NRs at 400 °C for 2 h under a vacuum. In the final step, an electrodeposition step was applied at a controlled charge of 5 mC Cm−2 from cobalt precursor solution obtaining a reddish-brown thin film of Co-doped FeOx NRs/FTO.
Fig. 1 displays the powder diffraction patterns of a sequence of obtained FeOx/FTO materials compared to those of the FeOOH and Fe2O3 electrodes annealed in air. The XRD patterns in Fig. 1a reveal that the presence of one peak at 2θ = 35.5° could be indexed to the diffraction plane of (110), corresponding to the phase of α-FeOOH crystal structure (PDF card 00-001-0662). In addition, two peaks located at 2θ values 35.9 and 64.2° are recorded, attributed to the crystal diffraction planes of (110) and (300) of the annealed Fe2O3 sample (PDF card 00-003-0813). Leaving off the FTO diffraction peak, the remaining peak is attributed to hematite, whose standard PDF card is (00-003-0813). The strongest diffraction peak is [110], which indicates that both the α-FeOOH and Fe2O3 samples, are growing along the direction of [110], which is favorable for photogenerated electron transmission.53,54 Additionally, the Scherrer equation was used to calculate crystallite sizes from the diffraction patterns. The crystallite sizes of α-FeOOH and Fe2O3 electrodes were 23.86 nm and 21 nm, respectively. The enlarged X-ray diffraction pattern of the FeOx samples in Fig. 1b matches the diffraction lines of the FeO materials (PDF # 00-001-1223). Besides, the XRD patterns show that the diffraction peaks of FeOx NRs materials are identical to those of the FTO substrate, confirming the peaks of them are overlapped with that of FTO support. Further, the powder XRD of the Co-doped FeOOH and FeOx materials in Fig. 1c matches the diffraction lines of the FeOOH materials (PDF card 00-001-0662), and FeOx (PDF # 00-001-1223). There were no other XRD peaks observed during the Co-doping process, which suggests no crystalline phases were produced.
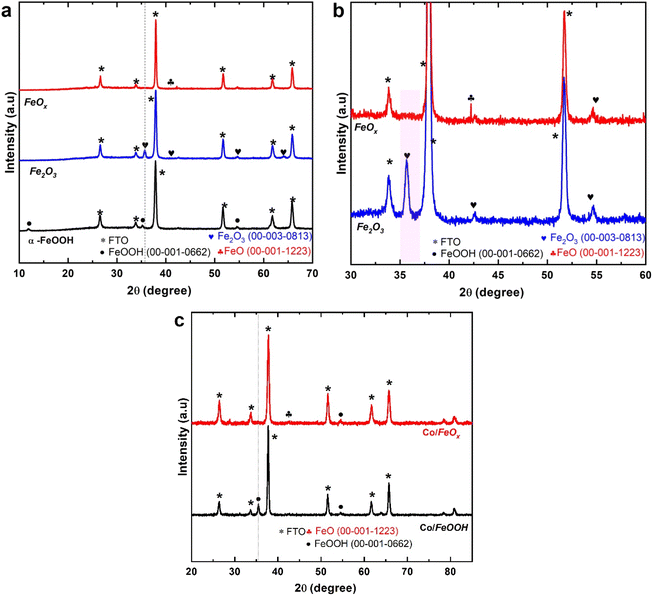 |
| | Fig. 1 Diffraction pattern of FeOx electrodes. (a) Normalized X-ray diffraction patterns of the fabricated α-FeOOH, Fe2O3 (annealed in the air), and FeOx catalysts on FTO substrate obtained by hydrothermal approach (b) enlarged view of fabricated Fe2O3 (annealed in air) and oxygen-deficient FeOx electrodes (annealed in vacuum). All the peaks are indexed using reference peaks. (c) XRD patterns of Co/FeOOH and Co/FeOx catalysts on FTO substrate prepared by electrodeposition approach. | |
3.2 Morphological features of FeO-based electrodes
To observe the morphology and meso-structural facts, the FeOOH, Fe2O3, and oxygen-deficient FeOx materials were examined by FE-SEM (Fig. 2). FE-SEM images of FeOOH electrode materials (Fig. 2a and b) indicate uniform rod-like morphology and a typical size of 20–90 nm arrays covering the FTO substrate fully. Similarly, FE-SEM images of the fabricated Fe2O3 electrodes reveal that the electrode retains a rod-like morphology with an average diameter of about 20–80 nm and a length of about 300–400 nm (Fig. 2c and d). After annealing under vacuum, the morphology is similar to FeOOH (Fig. 2e and f). This proves that vacuum annealing of FeOOH will not affect the morphological structure of oxygen-deficient FeOx electrodes on FTO substrates. Besides, an ultrathin nanoparticle of SnO2 is grown at the surface of the entire α-FeOOH, Fe2O3, and FeOx NRs catalysts during the annealing treatment either under air or under vacuum, which can be attributed to the tin diffusion from the FTO conductive support within the preparation procedures, as a dopant.52,53 These results lead to the enhancement of the electrical conductivity within the presence of two dopants of Sn and Co. To prove the existence of FeOOH, EDAX analysis of electrodes was conducted and the results are tabulated in Table 1. Furthermore, the EDAX analysis (Table 1) of the fabricated materials: α-FeOOH, Fe2O3, and FeOx NRs confirmed the presence of O, Fe, and Sn atoms, corresponding to the O (K-edge), Fe (K-edge), and Sn (L-edge) signals, respectively. As can be seen from Table 1, the FeOx NRs electrode has a higher Sn percentage than that recorded for both Fe2O3 and –FeOOH electrodes. This provides significant evidence for the diffusion of Sn to the surface as a dopant in FeOx NRs electrodes during the film's preparation. Due to annealing under vacuum, oxygen vacancies were formed in this material, which enhanced the electrocatalytic performance.
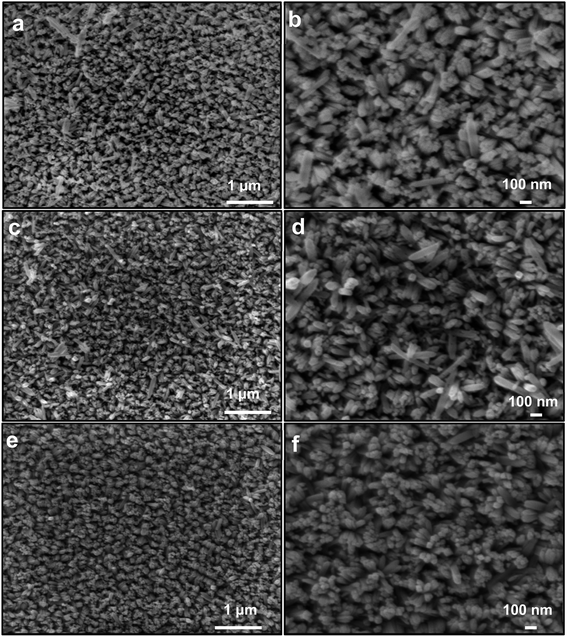 |
| | Fig. 2 Morphological features of fabricated electrodes. FE-SEM photographs of the fabricated (a and b) α-FeOOH, (c and d) Fe2O3 NRs, and (e and f) FeOx NRs samples. | |
Table 1 EDX analysis of the fabricated (a) α-FeOOH, (b) Fe2O3 NRs, and (c) FeOx NRs samples, (d) Co-doped FeOx electrodes
| Materials/elements |
FeOOH NRs |
Fe2O3 NRs |
FeOx NRs |
Co- FeOx NRs |
| wt% |
at% |
wt% |
at% |
wt% |
at% |
wt% |
at% |
| O K |
43.5 |
83.9 |
42.4 |
83 |
41.6 |
82.9 |
27 |
64.8 |
| Fe K |
4.9 |
2.7 |
6.3 |
3.5 |
4.8 |
2.7 |
29.5 |
20.3 |
| Sn L |
51.6 |
13.4 |
51.2 |
13.5 |
53.5 |
14.3 |
41 |
13.3 |
| Co L |
— |
— |
— |
— |
— |
— |
2.5 |
1.6 |
| Total |
100 |
3.3 Surface properties of FeOx electrodes
To gain further information on the possible valence states (chemical environment) of the as-synthesized α-FeOOH, Fe2O3, and FeOx NRs films, XPS analysis was investigated, as illustrated in Fig. 3. A full-scale XPS spectrum shown in Fig. S2† indicates that iron and oxygen are the main components of all catalysts. As shown in Fig. 3a, Fe 2p spectrums for all catalytic films contain two distinct peaks at 710 and 723 eV, consistent with previous literature reports of Fe 2p3/2 and Fe 2p1/2 having a characteristic spin–orbit doublet.43,55,56 In Fig. 3a, the peaks at 711.2 eV and 724.7 eV are attributed to bivalent iron (Fe2+), and those at 712.7 and 731.4 eV are attributed to trivalent iron (Fe3+). Besides a weak characteristic satellite appears at a binding energy of 717.6 eV of the α-FeOOH NRs films, assigned to the presence of iron in the valence state of Fe3+. Notably, there was a shift in the satellite peak position to 714.8 eV of the Fe2O3 and FeO NRs films, suggesting the presence of characteristic Fe2+ and the phase conversion from the α-FeOOH to the Fe2O3 and FeOx samples. In addition, the peak intensity of Fe 2p3/2 and Fe 2p1/2 of the FeOx NRs films is lower than that observed in Fe2O3, indicating that the number of iron atoms on the surface of FeOx NRs films is low.57,58 Fig. 3b displays the XPS spectra respectively for O 1s regions of FeOOH/FTO (black), Fe2O3/FTO, and FTO/ FeOx (red). As shown in the O 1s spectrum (Fig. 3b), in addition to the peak agreeing to oxygen in the lattice (OL), there was also another higher energy peak (OV) at 531.8 eV, which can be credited to oxygen vacancies present on the surface.59,60 There is a notable difference between FeOx/FTO and Fe2O3/FTO, indicating that chemisorbed oxygen is present due to oxygen vacancies.59,60 According to these interpretations of XPS, FeOOH, Fe2O3, and FeOx electrode materials are generally pure.
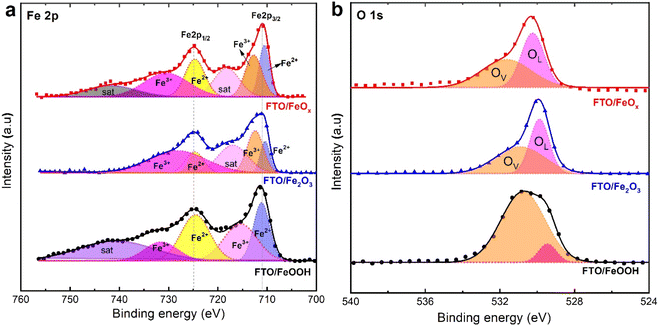 |
| | Fig. 3 High-resolution XPS core-level Fe 2p (a) spectra of prepared FeOOH, Fe2O3, and FeOx on FTO substrates, (b) O 1s core-level spectra. | |
3.4 Electrochemical features of FeOx for OER
As shown in Fig. 4, the electrocatalytic features of the obtained materials on FTO substrates for OER in alkaline media was measured through CVs. All the data were evaluated in a 3-electrode system employing FeOOH, Fe2O3, and FeOx-loaded FTO electrodes as working electrodes. Fig. 4a clearly illustrates the good catalytic performance of FeOx NRs samples compared to FeOOH, Fe2O3 NRs, and FTO substrates. Notably, the annealed FeOx NRs achieved a significant shift in the onset potential reaching 150 mV for OER compared with un-annealed α-FeOOH NRs catalysts, indicating greater availability of defect-rich nanorods of FeOx NRs within the heat treatment under vacuum. In Fig. 4b, CVs of as-synthesized materials were also conducted in the current window between −0.1 and 0.1 mA cm−2. It can be seen that the FeOx NRs electrodes clearly show characteristic redox peaks of the Fe2+ ion, confirming the reversible transformations of Fe2+ and Fe3+ species towards OER in alkaline conditions.61 Fig. S3† reports the CVs analysis for the FeOx NRs materials at different annealing temperatures (200–500 °C) under vacuum for 2 h and the constant pressure of 10−3 Pa. The results demonstrate that as the annealing temperature was increased from 200 to 400 °C, the anodic OER currents linearly increased. In addition, there was a slight negative shift in the overpotential at the studied temperatures. At 500 °C, the anodic OER currents decreased, indicating that the optimal temperature for enhancing OER kinetics is 400 °C. In Fig. 4c, the current generated at 1.75 VRHE under different vacuum annealing conditions is shown to be highest for vacuum annealing at 400 °C, which is the optimum temperature for the electrodes shown in Fig. 4a. Fig. 4d manifests that the Tafel slope of FeOx/FTO (51 mV dec−1) is significantly lesser than those of FeOOH/FTO (68 mV dec−1), and Fe2O3/FTO (72 mV dec−1). Furthermore, Fig. 4e illustrates the long-term stability of FeOx NRs electrodes throughout a prolonged cycling analysis at 1.0 M KOH. The results demonstrate a slight reduction in peak currents after multi-cycling measurements (100 cycles), confirming the excellent durability of the FeO NRs electrodes which improves OER performance. Besides, Fig. 4f confirmed that the fresh and reactivated FeO NRs (after 100 CVs) electrodes exhibit the same behavior and present excellent stability for OER which is consistent with that explored in Fig. 4e. Based on these results, FeOx electrodes have more exposed active sites, which contributes to improved electrocatalytic features.
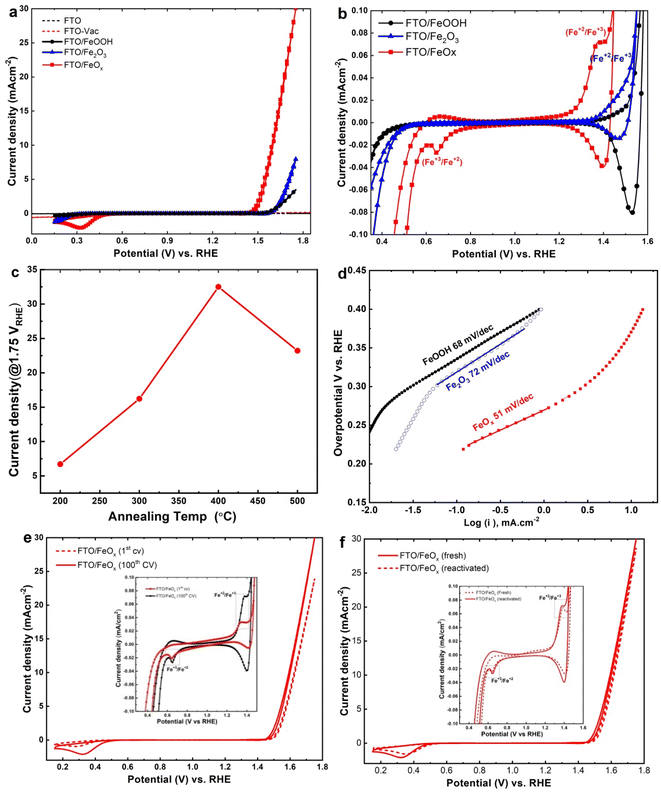 |
| | Fig. 4 Electrochemical features for OER. (a) Cyclic voltammetric plots of FeOOH nanorods prepared by hydrothermal approach, Fe2O3, oxygen-deficient FeOx electrode film on FTO substrate prepared by thermal and vacuum annealing approach, (b) enlarged view of prepared electrodes. (c) Current–potential features at 1.75 V versus RHE for different annealing conditions (red symbols) in the 1 M KOH solution and (d) Tafel plots derived from the polarization plots in (a). All the voltammetric plots were obtained without IR compensation. (e) Multicycle measurements for FTO/FeOx electrode before and after 100 CVs. (f) Reactivated FeOx/FTO electrode after 100 CVs compared with a fresh sample. All experiments were executed in 1.0 M KOH (pH 13.6) with a sweep rate of 10 mV s−1. | |
3.5 Structural and surface features of Co/FeOx electrodes
To further explore the surface and chemical composition of the as-deposited Co-doped FeOx NRs sample, structural and surface features were illustrated, as shown in Fig. 5. Mainly, the FE-SEM photograph of the fabricated Co-doped FeOx (Fig. 5a) that was calcined in the vacuum displays interrelated particles. SEM photographs demonstrate the introduction of Co into FeOx electrodes and interrelated particles. Upon inclusion of Co throughout FeOx particles, nanorod-like structures are largely retained, demonstrating that Co-doping does not affect FeOx's morphology. Besides, the EDX analysis shown in Fig. 5b of the Co-FeOx NRs material indicated the presence of both iron and cobalt within L-edge signals and O (K-edge signal) elements which confirms these elements have the reverse (opposite) direction of their growth axis compared with other samples onto FTO. The elemental analysis, derived from EDX spectra, shows the wt% of Fe and O atoms (lowest ratio) for Co-doped FeOx NRs catalyst is 29.52 and 27.01%, respectively, which is assigned to the molar ratio of 1![[thin space (1/6-em)]](https://www.rsc.org/images/entities/char_2009.gif) :3 corresponding to FeO and ultrathin SnO2 composition. The Co-doped FeOx NRs catalyst exhibits a deposition weight ratio of 2.46%, confirming the incorporation of cobalt into the catalyst (as a dopant). To further explore the surface and chemical composition of the prepared Co-doped FeOx NRs sample, the XPS spectrum was illustrated, as shown in Fig. 5c and d. The Fe 2p spectrum shown in Fig. 5c reveals that the spectrum of as-deposited Co-doped FeOx NRs film contains two distinct peaks at 733.6 and 747.6 eV, assigned to the characteristic spin–orbit doublet of Fe 2p3/2 and Fe 2p1/2. Two shake-up satellites also appear at binding energies of 741.4 and 754.4 eV, indicating the existence of Fe3+ iron. Fig. 5d displays the Co 2p XPS spectra of Co-doped FeOx NRs film. It shows distinct peak peaks for Co3+ 2p3/2, and Co2+ 2p3/2, at 778.47, and 784.07, suggesting Co3+ and Co2+ species coexist in Co-doped FeOx. In the O 1s spectra of the as-made Co-doped FeOx NRs sample (Fig. S4†), two major peaks are appearing with binding energies of 552.5 and 553.8 eV, ascribing to the presence of lattice oxygen over the Co-doped FeOx NRs catalyst. The fitted Co 2p spectrum of as-deposited Co-doped FeOx NRs catalyst shown in Fig. 5d points out cobalt presence in FeOx electrodes.
:3 corresponding to FeO and ultrathin SnO2 composition. The Co-doped FeOx NRs catalyst exhibits a deposition weight ratio of 2.46%, confirming the incorporation of cobalt into the catalyst (as a dopant). To further explore the surface and chemical composition of the prepared Co-doped FeOx NRs sample, the XPS spectrum was illustrated, as shown in Fig. 5c and d. The Fe 2p spectrum shown in Fig. 5c reveals that the spectrum of as-deposited Co-doped FeOx NRs film contains two distinct peaks at 733.6 and 747.6 eV, assigned to the characteristic spin–orbit doublet of Fe 2p3/2 and Fe 2p1/2. Two shake-up satellites also appear at binding energies of 741.4 and 754.4 eV, indicating the existence of Fe3+ iron. Fig. 5d displays the Co 2p XPS spectra of Co-doped FeOx NRs film. It shows distinct peak peaks for Co3+ 2p3/2, and Co2+ 2p3/2, at 778.47, and 784.07, suggesting Co3+ and Co2+ species coexist in Co-doped FeOx. In the O 1s spectra of the as-made Co-doped FeOx NRs sample (Fig. S4†), two major peaks are appearing with binding energies of 552.5 and 553.8 eV, ascribing to the presence of lattice oxygen over the Co-doped FeOx NRs catalyst. The fitted Co 2p spectrum of as-deposited Co-doped FeOx NRs catalyst shown in Fig. 5d points out cobalt presence in FeOx electrodes.
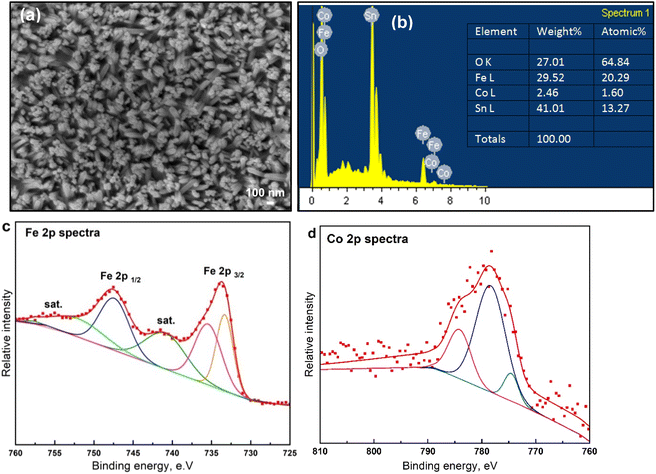 |
| | Fig. 5 . Surface and morphological features of electrodes. (a) SEM images of Co-doped FeOx on FTO substrate prepared by electrochemical deposition approach. (b) The energy-dispersive X-ray EDX profile of Fe, Co, Sn, and O elements of Co-doped FeOx electrodes. (c) High-resolution XPS results of Fe 2p spectra and (d) Co 2p spectra of fabricated electrodes. | |
To further illustrate the electrocatalytic OER performance of the as-deposited Co-doped FeO and Co-doped FeOOH NRs catalysts in comparison with un-doped FeO and FeOOH NRs materials, linear sweep voltammetry (LSV) responses were performed in 1.0 MKOH at 10 mV s−1. As shown in Fig. 6a, the LSV analysis of as-deposited Co-doped FeOx NRs catalyst pointed out maximum OER current could reach 30 mA cm−2, which was six times greater than that recorded for as-deposited FeOOH NRs catalyst (5.7 mA cm−2) at 1.65 V vs. RHE, confirming the superior electrocatalytic OER activity at as-deposited Co-doped FeO NRs catalyst after cobalt doping. The Inset of Fig. 6a illustrates the generated current density at 1.75 VRHE under different Co doping levels, validating that the best performance was acquired for 5 mC cm−2 cobalt doping, which are the optimum conditions applied for Co-based electrodes. Moreover, the OER potentials at 10 mA cm−2 at Co-doped FeOx and FeOx NRs catalysts were 1.54 and 1.62 V respectively, which indicates an 80 mV decrease for Co-doped FeOx NRs, as shown in Fig. 6b. These results could be attributed to two factors: the synergistic effect of Co doping and defect-rich FeO NRS catalyst which is consistent with published works.48,50,51,61–63 Besides, the OER kinetics process at un-doped FeOx, FeOOH, and Co-doped FeOx and Co-doped FeOOH NRs samples was examined via the Tafel slope, as drawn in Fig. 6c. The Tafel slope values were 51, 68, 61.5, and 79.4 mV dec−1, respectively. It is confirmed that vacuum annealing plays a crucial role in improving the electrochemical kinetics of OER by enhancing the Tafel slope (Fig. 6c) compared to the other catalysts. To further investigate the role of Co-dopant in the enhancement of Co-doped FeOx NRs catalysts towards OER activity, the ECSA was illustrated. The capacitive currents shown in Fig. 6d of the fabricated materials reveal that the linear slope for the obtained catalysts: α-FeOOH, Fe2O3 NRs, FeO, and Co-doped FeO NRs is 10.71, 10.61, 19, 45 mF cm−2, respectively. The results pointed out that the linear slope of catalysts with Co doping has larger ECSA than that without Co doping, confirming that the Co-doped FeOx NRs materials generate more active sites by Co doping. As compared to other fabricated electrodes, Co- FeOx catalysts do the best of all synthesized Fe- and/or Co-doped binary electrocatalysts (Fig. 6e). In alkaline conditions, Co doping levels have a greater potential to boost the OER features of electrocatalysts.
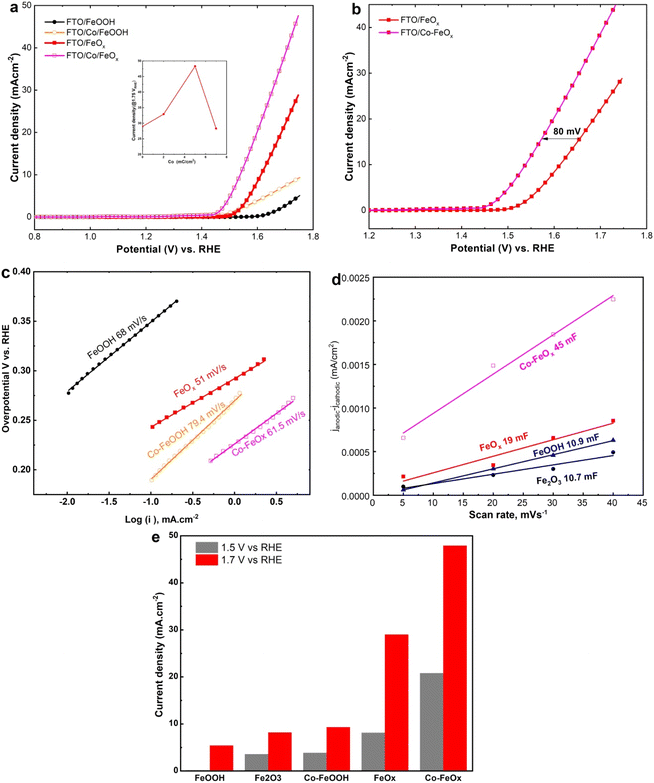 |
| | Fig. 6 Electrochemical OER features of Co-doped electrodes. (a) LSV curves of FeOOH, Co-doped FeOOH, oxygen-deficient FeOx (annealed in vacuum), and Co-doped FeOx nanorods electrode materials on FTO substrate in 1.0 M KOH at a sweep rate of 10 mV s−1. (b) Comparative LSV plots of FeOx and Co-FeOx electrodes. (c) Linear plots of capacitive currents of the fabricated electrodes against sweep rate. (d) Tafel plots obtained from the polarization plots in a. (e) Comparison of the as-made catalyst OER features with the OER current features at different potentials. | |
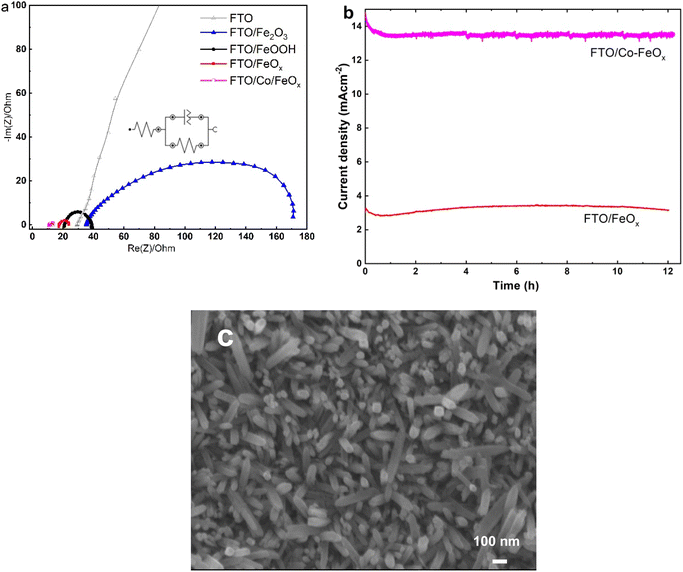
To explore further information for the charge transfer kinetics of the fabricated materials towards OER, the EIS was also performed, as illustrated in Fig. 7a. The Nyquist plots, according to the fitting results of the equivalent circuit shown in the inset plot, reveal that the Co-doped FeOx catalyst revealed a smallest charge transfer resistance (Rct = 2.61 Ω) than the other samples (Table 2), indicating that the Co-doped FeO catalyst has a faster charge transfer ability for OER. Besides, Table S1† shows the EIS parameters recorded from equivalent circuit fitting for the experimental measurements. Additionally, the Co/FeOx electrodes showed superior electronic conductivity and better OER than other electrode types. These results are by results from CV. In comparison with all the catalysts, Co/FeOx shows the lowermost Rs and Rct, indicating its superb conductivity and rapid charge transfer. The FeOx and Co/FeOx electrodes fabricated in this study displayed varying solution resistances, which may be due to electrostatic interactions between FeOx and OH- near the electrode surface.64 Further, these results show that Co/FeOx electrodes are more promising kinetically than FeOx electrodes alone due to their superior electrical conductivity.
 |
| | Fig. 7 (a) Nyquist curves obtained from EIS analysis in 1 M KOH at 1.60 V vs. RHE of prepared electrode materials. (b) Chronoamperometry responses of FeOx and Co-doped FeOx electrodes were evaluated in 1.0 M KOH under a applied potential of 1.55 V vs. RHE. (c) SEM image of Co/FeOx electrodes obtained after OER durability tests. | |
Table 2 Comparison of electrochemical performance of our catalyst Co-doped FeOx NRs film for OER in alkaline condition with that published relating to iron oxides-based electrocatalysts
| Anodic catalysts |
Overpotential at 10 mA cm−2, mV |
Current density, mA cm−2 |
Tafel slope, mV dec−1 |
Stability, h |
Electrolyte conc., M |
Ref. |
| 10%Co3O4@2%FeOx/G-110 |
1.55 V vs. RHE |
50 mA cm−2 at 1.55 VRHE |
63 |
25 h |
1.0 M KOH |
65 |
| SC/FeOx-NBs/FTO |
1.50 V vs. RHE |
120 mA cm−2 at 1.50 VRHE |
54 |
24 h |
0.5 M KOH |
46 |
| CoOx + Fe3+ (0.3 mM) catalyst |
1.55 V vs. RHE |
∼750 mA cm−2 at 1.55 VRHE |
27.6 |
25 h at 10 mA cm−2 |
1.0 M KOH |
47 |
| Fe–Mn–O NSs/CC |
1.50 V vs. RHE |
100 mA cm−2 at 1.55 V vs. RHE |
63.9 |
12 h at 10 mA cm−2 |
1.0 M KOH |
62 |
| NiFe-LDH NSs |
1.50 V vs. RHE |
200 mA cm−2 at 1.60 VRHE |
47 |
20 h |
N2-saturated 1 M KOH |
66 |
| Fe–NiO–Ni CHNAs |
1.475 V vs. RHE |
120 mA cm−2 at 1.475 VRHE |
∼43.4 |
24 h at 10 mA cm−2 |
1.0 M KOH |
67 |
| P–CoSe2/N–C |
1.48 V vs. RHE |
70 mA cm−2 at 1.45 VRHE |
36 |
10 h at 10 mA cm−2 |
Alkaline medium |
50 |
| Co-doped FeO/FTO NRs |
1.54 V vs. RHE |
30 mA cm−2 at 1.65 VRHE |
61 |
12 h at 1.55 VRHE |
Air-saturated 1 M KOH |
Our work |
To evaluate the long-term durability of the Co-doped FeOx NRs sample in comparison with the FeOx NRs sample, the CA analysis was measured at a fixed potential of 1.55 V vs. RHE. As shown in Fig. 7b, the Co-doped FeO NRs sample recorded higher and stable anodic OER current (14.5 mA cm−2) than the FeO NRs sample (3.25 mA cm−2) for 12 h, indicating the superior electrocatalytic OER performance at the Co-doped FeO NRs which is in agreement to the CVs analysis, as previously mentioned. We have used SEM to analyze the morphological features of Co/FeOx/FTO following long-term studies of the OER reactions. The SEM picture of Co/FeOx in Fig. 7c discloses that the morphology of the FeOx nanorods morphology is nearly preserved after the long-standing OER test. The electrocatalytic OER performance of as-made Co-doped FeO NRs catalyst was evaluated and compared to that reported in the literature for FeO-based electrocatalysts in alkaline medium, as illustrated in Table 2.
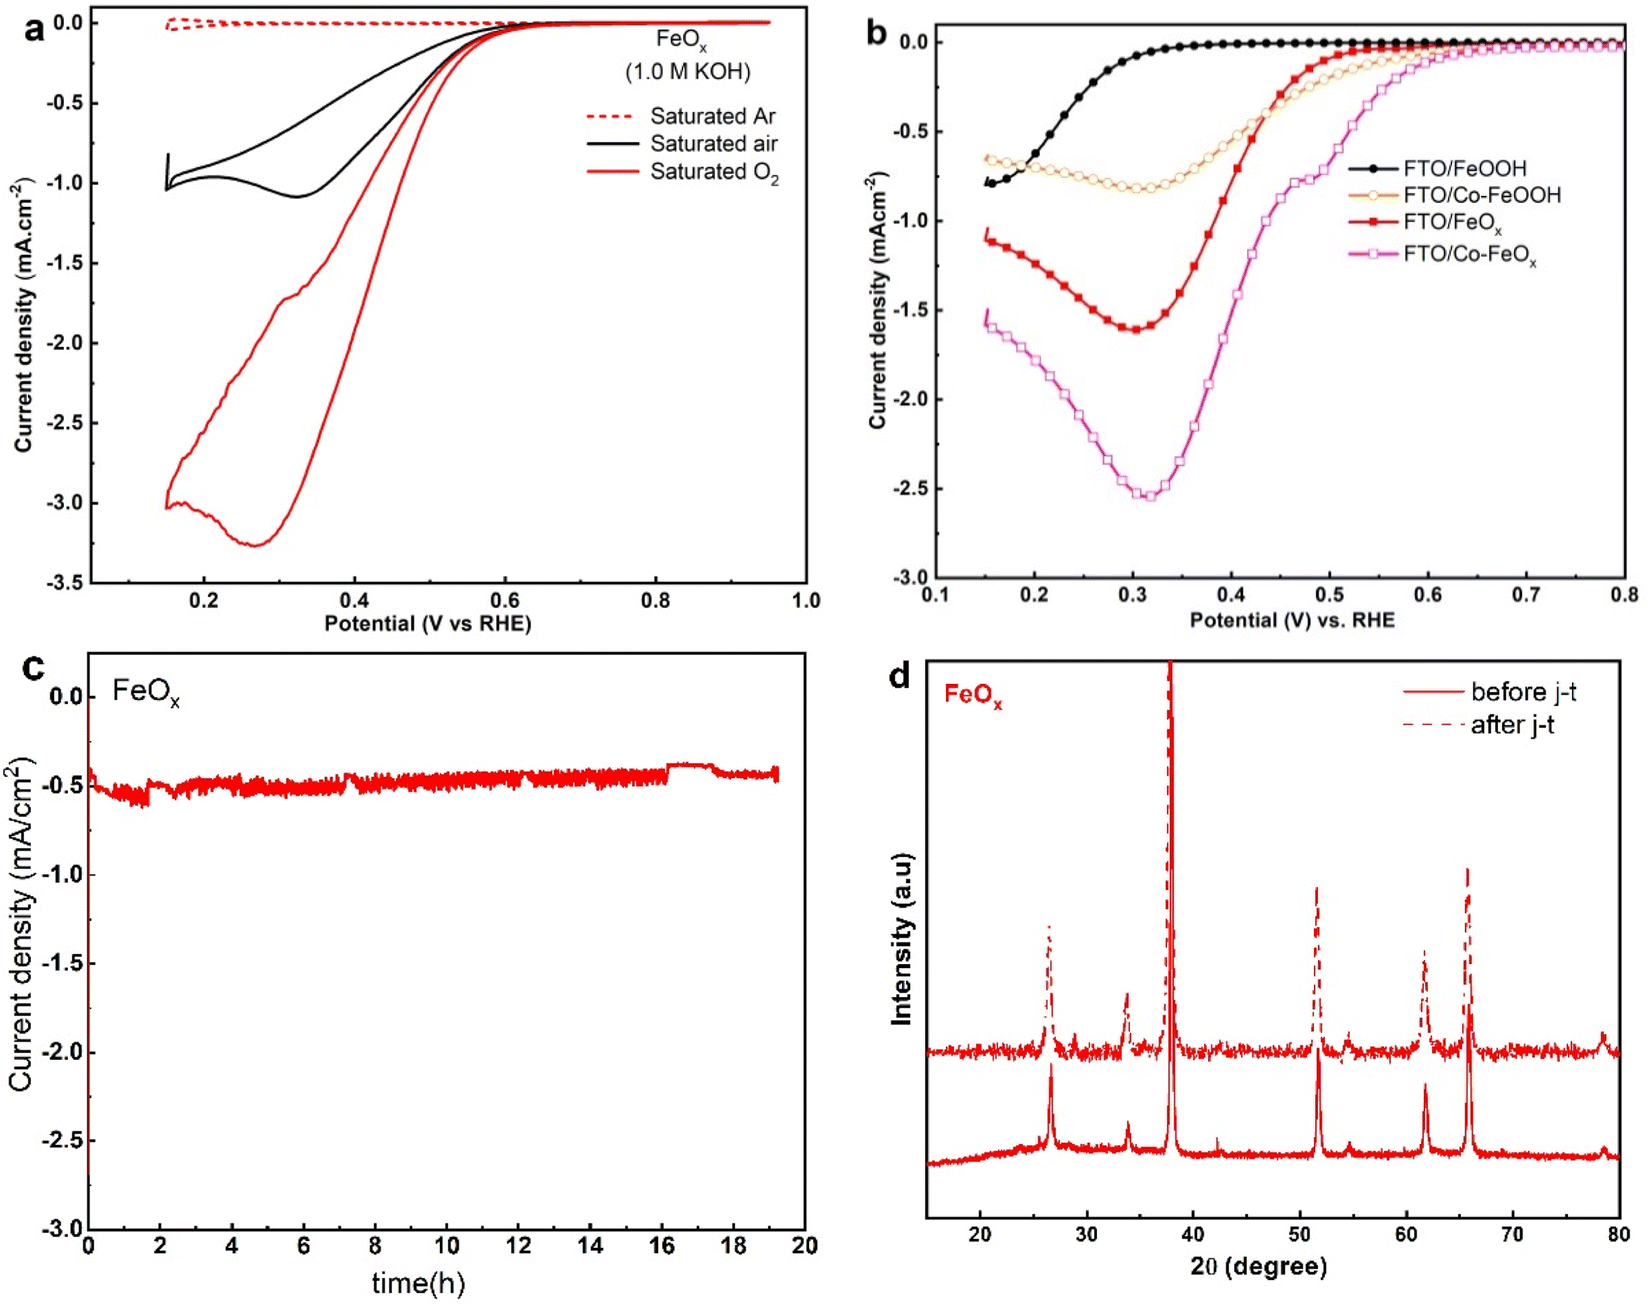
Fig. 8a illustrates the electrocatalytic activity of the fabricated FeOx NRs samples for ORR, the CVs responses were assessed in 1.0 M KOH saturated Ar, air, and oxygen, respectively. In Ar-saturated alkaline solutions, FeOx electrodes showed no noticeable redox peak. Further, the voltammograms showed that the CV loops continuously increased under the O2 atmosphere at the FeOx surface compared with the Ar and air atmosphere. This indicates the higher ORR activity of FeOx NRs catalyst in a sat. Oxygen atmosphere. To evaluate the electrocatalytic activity of un-doped α-FeOOH, FeOx, Co doped-α-FeOOH and Co-doped FeOx NRs samples for ORR in 1.0 M KOH, the LSV described in Fig. 8b was carried out. As a consequence, the Co/FeOx catalysts showed greater ORR onset potential and a much higher current density of 2.6 mA cm−2, suggesting a synergistic ORR catalytic capability between Co and FeOx. According to these electrochemical tests, the fabricated Co-doped FeOx catalysts function as both ORR and OER catalysts. Further, potentiostatic chronoamperometry was used to assess the durability of the FeOx electrodes for the ORR. Fig. 8c shows that the FeOx catalyst exhibited exceptional stability for ORR after 20 hours of continuous operation. XRD spectra were used to analyze the crystalline features of FeOx/FTO after long-term studies of ORR. The XRD pattern of FeOx/FTO (Fig. 8d) shows no significant changes in crystalline structure.
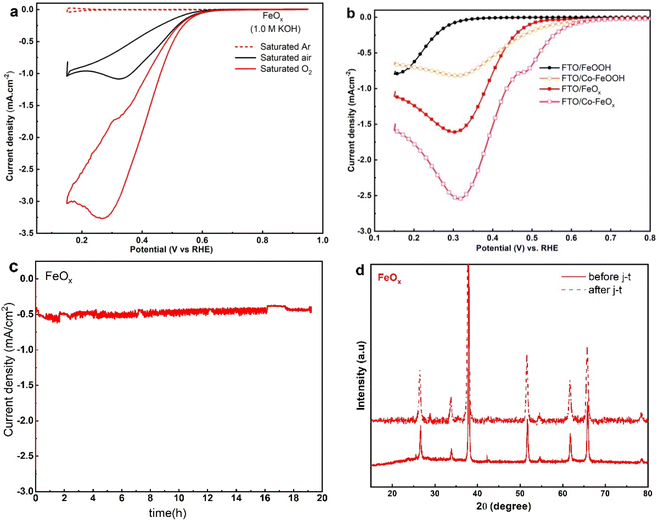 |
| | Fig. 8 (a) CV curves of FeOx nanorods oxygen reduction reactions in saturated Ar, air, and O2 saturated 1.0 M KOH electrolyte vs. RHE with a scan rate of 10 mV s−1 (b) LSV of un-doped FeOOH, oxygen-deficient FeOx, and doped Co-doped-FeOOH and Co-doped FeOx NRs samples for ORR in 1.0 M KOH. (c) Time-dependent current density plot of FeOx catalyst under a constant potential at 0.4 V vs. RHE. (d) XRD pattern of FeOx electrodes on FTO substrate before and after durability tests. | |
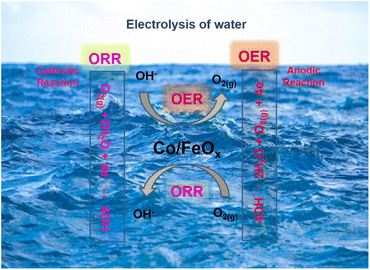
Using an adsorption mechanism, it is possible to achieve both water electrolysis and oxygen bifunctionality in alkaline solutions. In Fig. 9, the electrochemical oxygen reactions in 1.0 M KOH are illustrated to produce OER and ORR. In the process of adsorbing OH– and transferring four electrons, OER produces intermediate species, including HO*, O*, and HOO*. ORR processes use two mechanisms. In one case, undissolved oxygen molecules adsorb directly on active sites; in another, dissolved oxygen molecules are surface-adsorbed by hydroxide ions.68–71 Co-doping oxygen-deficient FeOx materials may enhance their electro-catalytic performance for OER/ORR reactions by reducing hydrogen and oxygen adsorption-free energies. This study validates the important role cobalt doping plays in iron oxide and the importance of producing oxygen-deficient metal oxides. As a result, the OER and ORR activities related to electrochemical energy are enhanced.
 |
| | Fig. 9 Schematic representation of electrochemical water splitting to oxygen reactions (ORR and OER). | |
4 Conclusions
In summary, a series of defect-rich iron oxy/hydroxide nanorod arrays: α-FeOOH, Fe2O3, and FeOx NRs thin film catalysts were synthesized via a hydrothermal approach followed by thermal and vacuum treatments. Besides, a cobalt doping process was employed to prepare the thin film of Co-doped FeOx NRs. The electrocatalytic performance and stability of as-prepared catalysts for OER in the alkaline medium have been achieved with Co-doped FeOx NRs thin film catalysts with lower charge transfer resistance (Rct = 2.61 Ω) and excellent durability reaching 12 h in basic medium. The electrochemical features pointed out as-deposited Co-doped FeOx NRs catalyst clearly showed that maximum OER current could reach 30 mA cm−2, six times higher than that recorded by as-deposited Co-doped FeOOH NRs catalysts (5.7 mA cm−2). Cobalt doping of FeOx NRs catalysts in as-deposited state has a superior electrocatalytic OER/ORR activity. These results could be attributed to two factors: the synergistic effect of Co doping and defect-rich FeOx NRs catalysts in sustainable energy systems. Our results prove the importance of vacuum treatment in preparing defect-rich FeOx NRs and Co-doped FeOx NRs that demonstrate electrochemical activity for water splitting in alkaline mediums.
Author contribution
Saleh Omar: data curation, formal analysis, investigation. Maged N. Shaddad: writing – original draft, investigation, conceptualization. Prabhakarn Arunachalam: conceptualization, writing – review & editing, data curation, supervision. Mabrook S. Amer: data curation, writing – review & editing, Saba A. Aladeemy: inverstigation Abdullah M. Al-Mayouf: supervision, funding acquisition, project administration.
Conflicts of interest
The authors declare that they have no known competing financial interests or personal relationships that could have appeared to influence the work reported in this paper.
Acknowledgements
The authors extend their appreciation to the Deputyship for Research & Innovation, Ministry of Education in Saudi Arabia for funding this research (IFKSURC-1-4007).
References
- Y. L. Zhang, K. Goh, L. Zhao, X. L. Sui, X. F. Gong, J. J. Cai and Z. B. Wang, Nanoscale, 2020, 12, 21534–21559 RSC.
- J. Xie, J. Zhang, S. Li, F. Grote, X. Zhang, H. Zhang and Y. Xie, J. Am. Chem. Soc., 2013, 135, 17881–17888 CrossRef CAS PubMed.
- S. Ramakrishnan, J. Balamurugan, M. Vinothkannan, A. R. Kim, S. Sengodan and D. J. Yoo, Appl. Catal., B, 2020, 279, 119381 CrossRef CAS.
- Y. Y. Zhai, X. R. Ren, J. Q. Yan and S. Z. Liu, Small Struct., 2021, 2, 2000096 CrossRef CAS.
- C. C. McCrory, S. Jung, J. C. Peters and T. F. Jaramillo, J. Am. Chem. Soc., 2013, 135, 16977–16987 CrossRef CAS PubMed.
- J. Wang, W. Cui, Q. Liu, Z. Xing, A. M. Asiri and X. Sun, Advanced Materials, 2016, 28, 215–230 CrossRef CAS PubMed.
- M. K. Debe, Nature, 2012, 486, 43–51 CrossRef CAS PubMed.
- X. Ding, J. Yu, W. Huang, D. Chen, W. Lin and Z. Xie, Chem. Eng. J., 2023, 451, 138550 CrossRef CAS.
- B. Sarfraz, I. Bashir and A. Rauf, Fuel, 2023, 337, 127253 CrossRef CAS.
- M. S. Amer, P. Arunachalam, A. M. Al-Mayouf, A. A. AlSaleh and Z. A. Almutairi, Environ. Res., 2023, 236, 116818 CrossRef CAS PubMed.
- M. S. Amer, P. Arunachalam, A. M. Alsalman, A. M. Al-Mayouf, Z. A. Almutairi, S. A. Aladeemy and M. Hezam, Catal. Today, 2022, 397, 197–205 CrossRef.
- X. He, X. Zhao, F. Yin, B. Chen, G. Li and H. Yin, Int. J. Energy Res., 2020, 44, 7057–7067 CrossRef CAS.
- Z. Zhang, D. Zhou, J. Liao, X. Bao and H. Yu, Int. J. Energy Res., 2019, 43, 1460–1467 CrossRef CAS.
- R. Ramachandran, T. W. Chen, P. Veerakumar, G. Anushya, S. M. Chen, R. Kannan and M. Boominathan, RSC Adv., 2022, 12, 28227–28244 RSC.
- A. Raveendran, M. Chandran and R. Dhanusuraman, RSC Adv., 2023, 13, 3843–3876 RSC.
- S. Chandrasekaran, M. Khandelwal, F. Dayong, L. Sui, J. S. Chung, R. D. K. Misra and C. Bowen, Adv. Energy Mater., 2022, 12, 2200409 CrossRef CAS.
- S. Mathi and J. Jayabharathi, RSC Adv., 2020, 10, 26364–26373 RSC.
- M. S. Amer, P. Arunachalam, M. A. Ghanem, M. Al-Shalwi, A. Ahmad, A. I. Alharthi and A. M. Al-Mayouf, Int. J. Energy Res., 2021,(45), 9422–9437 CrossRef CAS.
- R. Atchudan, T. N. J. I. Edison, S. Perumal, R. Vinodh, N. Muthuchamy and Y. R. Lee, Fuel, 2020, 277, 118235 CrossRef CAS.
- T. Audichon, T. W. Napporn, C. Canaff, C. Morais, C. Comminges and K. B. Kokoh, J. Phys. Chem. C, 2016, 120, 2562–2573 CrossRef CAS.
- F. D. Kong, S. Zhang, G. P. Yin, N. Zhang, Z. B. Wang and C. Y. Du, Electrochem. Commun., 2012, 14, 63–66 CrossRef CAS.
- C. Cui, L. Gan, H.-H. Li, S.-H. Yu, M. Heggen and P. Strasser, Surface composition, Nano Lett., 2012, 12, 5885 CrossRef CAS PubMed.
- D. Yang, B. Li, H. Zhang and J. Ma, Int. J. Hydrogen Energy, 2012, 37, 2447–2454 CrossRef CAS.
- M. S. Amer, M. A. Ghanem, A. M. Al-Mayouf and P. Arunachalam, J. Electrochem. Soc., 2018, 165(7), H300 CrossRef CAS.
- M. S. Burke, J. J. Enman, A. S. Batchellor, S. Zou and S. W. Boettcher, Chem. Mater., 2015, 27, 7549–7558 CrossRef CAS.
- K. Mukai, T. M. Suzuki, T. Uyama, T. Nonaka, T. Morikawa and I. Yamada, RSC Adv., 2020, 10(73), 44756–44767 RSC.
- G. Zeng, M. Liao, C. Zhou, X. Chen, Y. Wang and D. Xiao, RSC Adv., 2016, 6(48), 42255–42262 RSC.
- S. Chandrasekaran, D. Ma, Y. Ge, L. Deng, C. Bowen and J. Roscow, et al., Nano Energy, 2020, 77, 105080 CrossRef CAS.
- D. Chen, Q. Sun, C. Han, Y. Guo, Q. Huang, W. A. Goddard and J. Qian, J. Mater. Chem. A, 2022, 10(30), 16007–16015 RSC.
- Y. Guo, Q. Huang, J. Ding, L. Zhong, T. T. Li, J. Pan and S. Huang, et al., Int. J. Hydrogen Energy, 2020, 46(43), 22268–22276 CrossRef.
- J. Wang, X. Yue, Y. Yang, S. Sirisomboonchai, P. Wang, X. Ma and G. Guan, J. Alloys Compd., 2020, 819, 153346 CrossRef CAS.
- M. S. Amer, M. A. Ghanem and A. M. Al-Mayouf, J. Electroanal. Chem., 2020, 871, 197–205 CrossRef.
- H. P. Zhao, M. Zhu, H. Y. Shi, Q. Q. Zhou, R. Chen, S. W. Lin and C. Z. Lu, Molecules, 2022, 27, 9050 CrossRef CAS PubMed.
- J. Li, G. Lu, G. Wu, D. Mao, Y. Guo, Y. Wang and Y. Guo, RSC Adv., 2022, 3, 12409–12416 RSC.
- W. Zhang, W. Lai and R. Cao, Chem. Rev., 2017, 117, 3717–3797 CrossRef CAS PubMed.
- S. R. Ede and Z. Luo, J. Mater. Chem. A, 2021, 9, 20131–20163 RSC.
- P. A. Radu, T. Borodi, A. Nan, M. Suciu and R. Turcu, Effects of rare earth doping on multi-core iron oxide nanoparticles properties, Appl. Surf. Sci., 2018, 428, 492–499 CrossRef.
- R. Fernández-Climent, S. Giménez and M. García-Tecedor, Sustainable Energy Fuels, 2020, 4, 5916–5926 RSC.
- Y. Li, F. M. Li, X. Y. Meng, S. N. Li, J. H. Zeng and Y. Chen, ACS Catal., 2018, 8, 1913–1920 CrossRef CAS.
- M. N. Shaddad, P. Arunachalam, M. Hezam, N. M. AL-Saeedan, S. Gimenez, J. Bisquert and A. M. Al-Mayouf, Int. J. Hydrogen Energy, 2021, 46, 23702–23714 CrossRef CAS.
- C. M. Tian, W. W. Li, Y. M. Lin, Z. Z. Yang, L. Wang, Y. Du and K. H. Zhang, J. Phys. Chem. C, 2020, 124, 12548–12558 CrossRef CAS.
- Z. Xiao, C. Wu, W. Wang, L. Pan, J. Zou, L. Wang and G. Li, J. Mater. Chem. A, 2020, 8, 25791–25804 RSC.
- S. Chandrasekaran, N. Li, Y. Zhuang, L. Sui, Z. Xiao, D. Fan and Y. Liu, Chem. Eng. J., 2022, 431, 134073 CrossRef CAS.
- N. U. A. Babar, Y. F. Joya, H. Khalil, F. Hussain and K. S. Joya, Int. J. Hydrogen Energy, 2021, 46, 7885–7902 CrossRef CAS.
- C. L. McCarthy, C. A. Downes, E. C. Schueller, K. Abuyen and R. L. Brutchey, ACS Energy Lett., 2016, 1, 607–611 CrossRef CAS.
- Y. Hou, F. Zuo, A. Dagg and P. Feng, Angew. Chem., Int. Ed., 2013, 52, 1248–1252 CrossRef CAS PubMed.
- L. Gong, X. Y. E. Chng, Y. Du, S. Xi and B. S. Yeo, ACS Catal., 2018, 8, 807–814 CrossRef CAS.
- N. Liu and J. Guan, Mater. Today Energy, 2021, 21, 100715 CrossRef CAS.
- Y. Xiao, Y. Wang, M. Xiao, C. Liu, S. Hou, J. Ge and W. Xing, NPG Asia Mater., 2020, 12, 73 CrossRef CAS.
- H. Zhang, T. Wang, A. Sumboja, W. Zang, J. Xie, D. Gao and J. Wang, Adv. Funct. Mater., 2018, 28, 1804846 CrossRef.
- T. Chen, S. Qin, M. Qian, H. Dai, Y. Fu, Y. Zhang and Q. Yang, Energy Fuels, 2021, 35, 10890–10897 CrossRef CAS.
- X. Zhang, Y. Zhao, Y. Zhao, R. Shi, G. I. Waterhouse and T. Zhang, Adv. Energy Mater., 2019, 9, 1900881 CrossRef.
- A. G. Tamirat, W. N. Su, A. A. Dubale, H. M. Chen and B. J. Hwang, J. Mater. Chem. A, 2015, 3, 5949–5961 RSC.
- W. Xia, J. Sun, X. Zeng, P. Wang, M. Luo, J. Dong and H. Yu, ACS Omega, 2020, 5, 2205–2213 CrossRef CAS PubMed.
- T. Yamashita and P. Hayes, Appl. Surf. Sci., 2008, 254(8), 2441–2449 CrossRef CAS.
- S. Majumder, M. Sardar, B. Satpati, S. Kumar and S. Banerjee, J. Phys. Chem. C, 2018, 122, 21356–21365 CrossRef CAS.
- J. Mohapatra, A. Mitra, H. Tyagi, D. Bahadur and M. Aslam, Nanoscale, 2015, 7, 9174–9184 RSC.
- C. Zhu, Y. Liu, C. Huo and H. Liu, RSC Adv., 2018, 8, 32073–32083 RSC.
- T. Qin, X. Zhang, D. Wang, T. Deng, H. Wang, X. Liu and W. Zhang, ACS Appl. Mater. Interfaces, 2018, 11, 2103–2111 CrossRef PubMed.
- T. Xian, X. Sun, L. Di, Y. Zhou, J. Ma, H. Li and H. Yang, Catalysts, 2019, 9, 1031 CrossRef CAS.
- C. Guo, X. Liu, L. Gao, X. Ma, M. Zhao, J. Zhou and Q. Wei, J. Mater. Chem. A, 2019, 7, 21704–21710 RSC.
- J. Sun, X. Hu, Z. Huang, T. Huang, X. Wang, H. Guo and D. Sun, Nano Res., 2020, 13, 2056–2062 CrossRef CAS.
- H. Xiong, Y. Dong, D. Liu, R. Long, T. Kong and Y. Xiong, J. Phys. Chem. Lett., 2022, 13(5), 1272–1282 CrossRef CAS PubMed.
- Q. Hu, G. Li, X. Liu, B. Zhu, X. Chai, Q. Zhang and C. He, Angew. Chem., 2019, 131, 4362–4366 CrossRef.
- N. Liu and J. Guan, Mater. Today Energy, 2021, 21, 100715 CrossRef CAS.
- X. Zhang, Y. Zhao, Y. Zhao, R. Shi, G. I. Waterhouse and T. Zhang, Adv. Energy Mater., 2019, 9, 1900881 CrossRef.
- Y. Lei, T. Xu, S. Ye, L. Zheng, P. Liao, W. Xiong and X. Sun, Appl. Catal., B, 2021, 285, 119809 CrossRef CAS.
- Q. A. Islam, R. Majee and S. J. Bhattacharyya, J. Mater. Chem. A., 2019, 7, 19453–19464 RSC.
- N. Kumar, K. Naveen, M. Kumar, T. C. Nagaiah, R. Sakla, A. Ghosh and A. K. Paul, ACS Appl. Energy Mater., 2021, 4, 1323–1334 CrossRef CAS.
- M. A. Ghanem, P. Arunachalam, A. Almayouf and M. T. Weller, J. Electrochem. Soc., 2016, 163, H450 CrossRef CAS.
- M. S. Amer, P. Arunachalam, M. A. Ghanem, A. M. Al-Mayouf and M. Shar, Appl. Surf. Sci., 2020, 513, 145831 CrossRef CAS.
|
| This journal is © The Royal Society of Chemistry 2023 |
Click here to see how this site uses Cookies. View our privacy policy here. 
 Open Access Article
 This Open Access Article is licensed under a Creative Commons Attribution-Non Commercial 3.0 Unported Licence
 *a,
Mabrook S. Amerac,
Saba A. Aladeemyb and
Abdullah M. Al-Mayouf
*a,
Mabrook S. Amerac,
Saba A. Aladeemyb and
Abdullah M. Al-Mayouf