DOI:
10.1039/D3RA03254J
(Paper)
RSC Adv., 2023,
13, 24918-24924
Synthesis of niobium(IV) carbide nanoparticles via an alkali-molten-method at a spatially-limited surface of mesoporous carbon †
Received
16th May 2023
, Accepted 15th August 2023
First published on 22nd August 2023
Abstract
One-pot synthesis of niobium carbabide (NbC) nanoparticles with ca. 30–50 nm was achieved via a rationally designed novel alkali-molten salt method using niobium oxide (Nb2O5), potassium carbonate (K2CO3), and mesoporous carbon (MPC). In this reaction, potassium niobate (KNbO3) was produced as an intermediate and carbonization of KNbO3 proceeds at a spatially limited external surface encompassed by the mesopores of MPC due to the repulsive characteristics of ionic KNbO3 toward hydrophobic MPC, which affords the size-controlled NbC nanoparticles with a narrow particle distribution. The particle sizes tended to become smaller as the pore sizes of MPCs or the temperature on the calcination under the nitrogen stream decreased. Elemental reactions along the one-pot synthesis of NbC nanoparticles were clarified by X-ray spectroscopic, thermogravimetric, and mass spectrometric measurements.
Introduction
Catalytic reactions such as hydrogen production, methanol synthesis, Fischer–Tropsch synthesis, and reverse water gas shift reaction are essential to realizing carbon neutrality using sustainable energy production aiming to emit essentially no carbon dioxide.1–5 In these catalytic processes, noble metals such as platinum have been widely used as active sites in catalysis. However, due to their scarcity, their use in sustainable energy production is currently not realistic. From the background, alternative materials of the noble metals are strongly desired.
Transition metal carbides (TMCs) are expected as alternatives to noble metals since TMCs possess high melting point, high corrosion resistance, and significant electronic and catalytic characteristics.6–18 Among the many TMCs, niobium carbide (NbC) has attracted chemists because of its mechanical and chemical stability, and excellent electrochemical potential.19 NbC was conventionally synthesized by calcination at high temperature after mixing niobium(V) oxide (Nb2O5) and carbon sources, affording adamant NbC with large particle sizes.20 However, the growth of the particle size causes a decrease in the amount of active sites per weight.
Regarding this, the preparation of nano-sized NbC has been addressed by a lot of researchers to increase active sites per weight on the catalysis.6,21–32 Recently, Tour and Zhao et al. synthesized NbC nanoparticles with ca. 20 nm of size via novel flash Joule heating in the reactor composed of capacitor banks, electrodes, quartz and a carbon source.21 Takanabe and his co-workers succeeded in the synthesis of various TMCs including NbC nanoparticles with the size of <10 nm by a skillful strategy using ethanol solution of metal precursors and mesoporous graphitic carbon nitride (mpg-C3N4), in which the TMC nanoparticles were produced in the mesopores of mpg-C3N4.22 As we can see in the pioneered study such as aforementioned literature, the key point on the preparation of size-controlled TMC nanoparticles is “reaction field”. In other words, the size-controlled TMC nanoparticles are afforded resulting from precise design of the reaction field of a carbonization of metal species precursor.
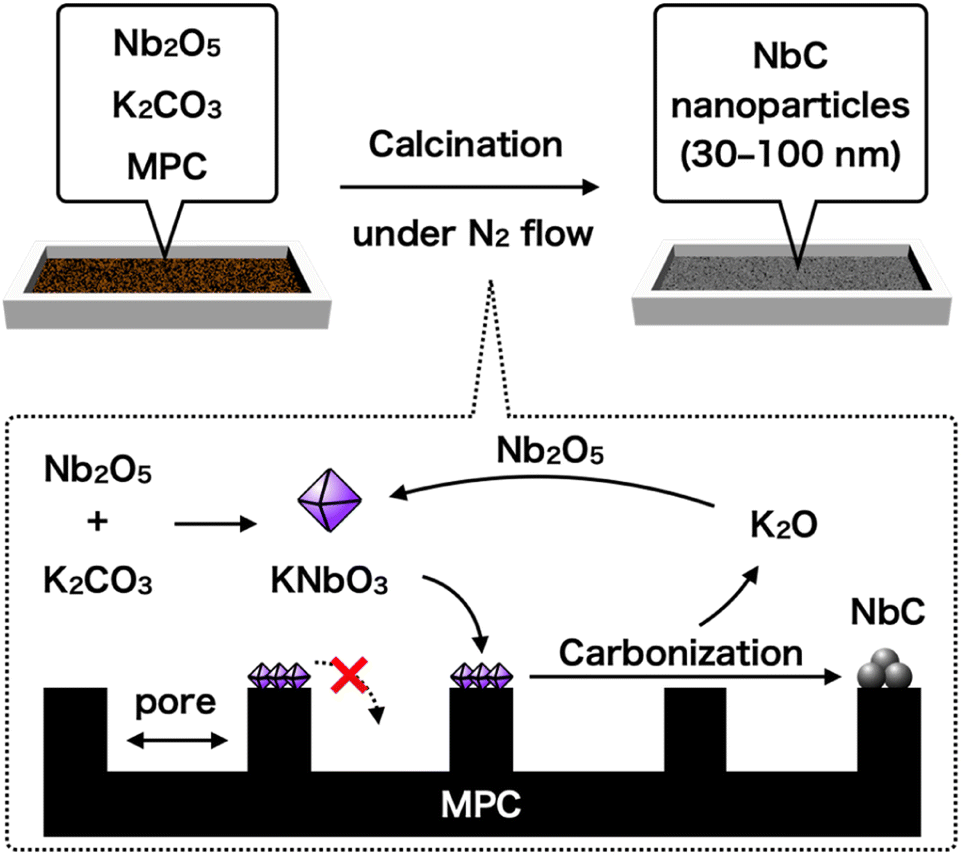
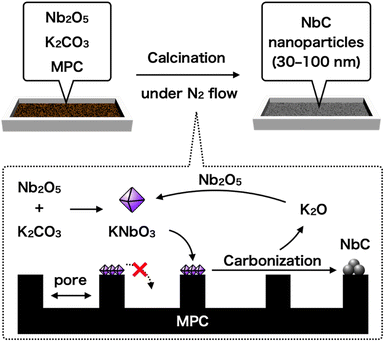
Here, we reported a rationally designed new one-pot synthetic method of NbC nanoparticles with 30–50 nm by using Nb2O5, potassium carbonate (K2CO3), and hydrophobic mesoporous carbon (MPC). The key strategy of this method is utilizing a prohibition of capillary action (CA) of intermediated potassium niobate (KNbO3) into the nano-sized pores of MPC due to significantly low affinity between them, resulting in the formation and growth of NbC particles at limited external surface encompassed by the pores as a reaction field (Fig. 1). Pore size of MPC had a direct relationship to area of the external surface unit, hence the size of resulting NbC nanoparticles was also changed by varying the pore size of MPC. Moreover, the nanoparticle sizes of the synthesized NbC gradually became smaller as the calcination temperature decreased, indicating a possibility of precise adjustment of particle sizes. Furthermore, we propose elemental reactions during the synthesis of NbC nanoparticles from Nb2O5.
 |
| | Fig. 1 Schematic representation of the alkali-molten method proposed in this study. | |
Results and discussion
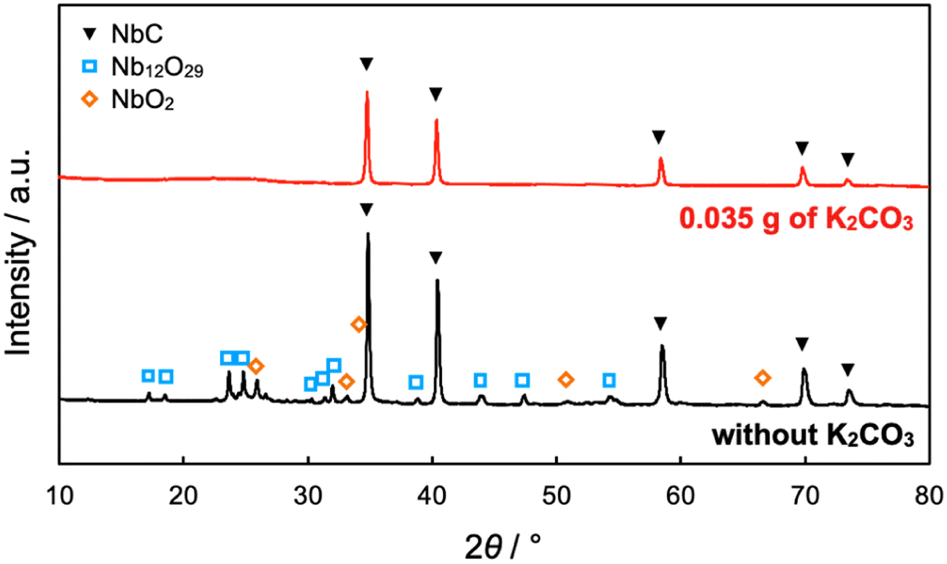
The NbC nanoparticles were synthesized from Nb2O5 and MPC possessing 150 nm of mean pore size (MPC-150) with K2CO3 under N2 atmosphere. Fig. 2 displays X-ray diffraction (XRD) patterns of niobium species after calcination of the physical mixture of Nb2O5 and MPC with/without K2CO3 at 1150 °C under N2 stream. In the case of the absence of K2CO3, NbC was formed accompanied by residual reduced niobium oxide species (NbO2, Nb12O29) with the NbC yield of 31.8% estimated by reference intensity ratio (RIR) method, while Nb2O5 was completely converted to NbC under the presence of K2CO3. This finding indicates that K2CO3 promoted the formation of NbC. To explore the impact of carbon sources on the synthesis of NbC nanoparticles, graphite was used instead of MPC. Although XRD measurements revealed that NbC could be produced regardless of carbon source, crystalline size (D) of NbC synthesized with graphite (D = 55 nm, Fig. S1†) was larger than that with MPC-150 (D = 32 nm). Moreover, transmission electron microscopic (TEM) images showed that NbC prepared with graphite tended to grow compared to NbC obtained by MPC-150 because the average particle sizes calculated by manual estimation of diameter of 200 of NbC particles were 77, and 51 nm on using graphite and MPC-150, respectively (Fig. 3a–f, S2 and S3†). Moreover, the significantly wider distribution of particle size of NbC on graphite than MPC-150 implies the presence of spatially limited area on MPC-150.
 |
| | Fig. 2 XRD patterns of products after calcination of the mixture of Nb2O5 (0.1 g) and MPC-150 (0.1 g) with or without K2CO3 at 1150 °C for 10 h under N2 stream atmosphere. The yield of NbC was estimated to be 31.8% on the absence of K2CO3. | |
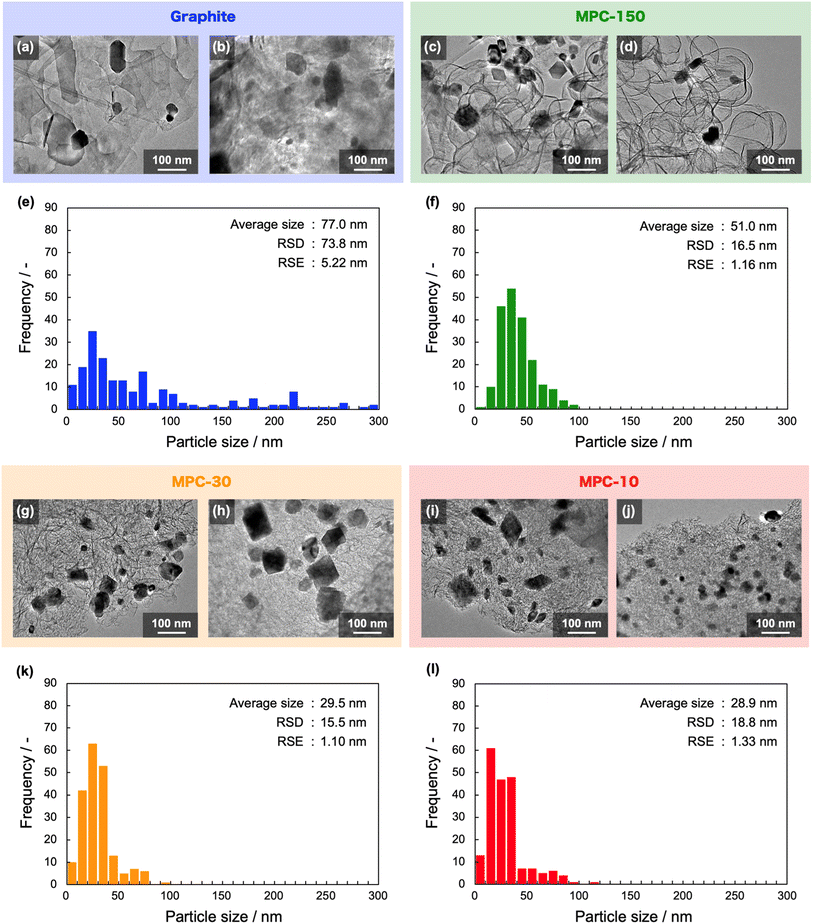 |
| | Fig. 3 (a–d and g–j) TEM images of synthesized NbC particles with (a and b) graphite, (c and d) MPC-150, (g and h) MPC-30, and (i and j) MPC-10 as carbon sources. (e, f, k and l) size distributions of the NbC nanoparticles synthesized with (e) graphite, (f) MPC-150, (k) MPC-30, and (l) MPC-10. The distribution was estimated by the measuring particle sizes of NbC in TEM images. The terms RSD and RSE indicate “relative standard deviation” and “relative standard error”, respectively. | |
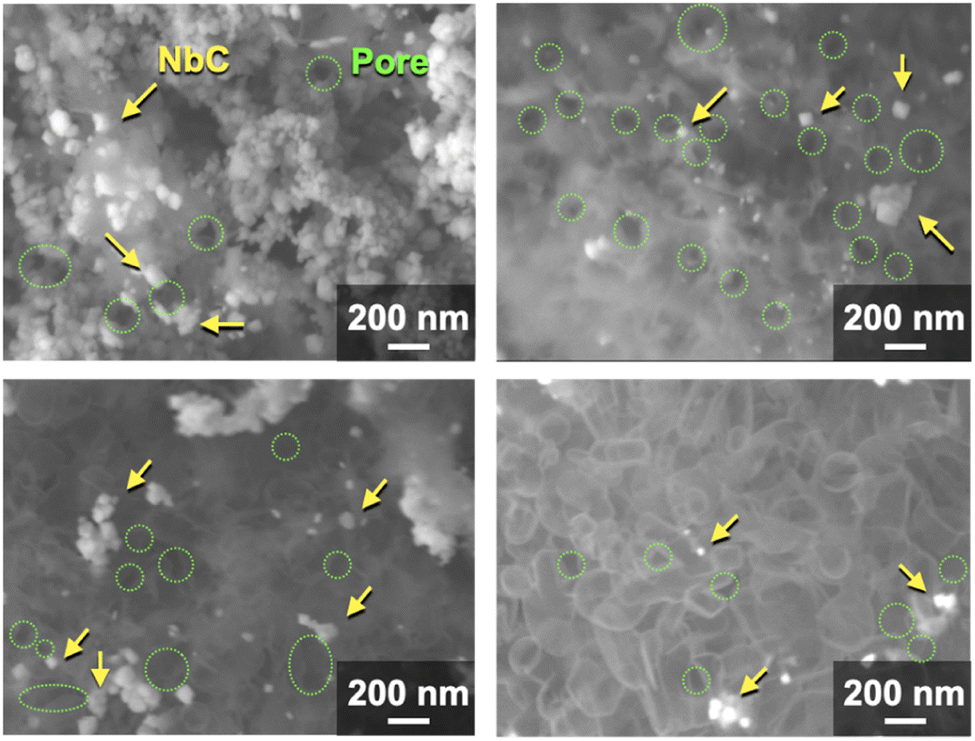
In this context, NbC was synthesized with MPCs which possess pore sizes of 30 nm (MPC-30) and 10 nm (MPC-10) to investigate the effect of the pore. The XRD measurement revealed the D values of NbC synthesized with MPC-30 (D = 30 nm) or MPC-10 (D = 27 nm), indicating that crystalline sizes were not dependent on the pore sizes of MPCs (Fig. S4†). On the other hand, TEM observation clearly revealed that the size of NbC nanoparticles synthesized with MPC-30, in which average particle size was 30 nm, decreased compared to that prepared with MPC-150 (Fig. 3g, h, k and S5†). Notably, the average particle size of NbC obtained from MPC-10 (average size: 29 nm) was almost identical to the condition under the usage of MPC-30, and the size was larger than their pore size (Fig. 3i, j, l and S6†). This finding indicates that the reaction does not proceed in the mesopore but at the external surface. To visualize the reaction field, scanning electron microscopy (SEM) was performed (Fig. 4). Intriguingly, few NbC particle exists in the pore of MPC, demonstrating the formation of NbC occurs at the external surface of MPC. The origin of differences in particle size on the used MPC was considered by the calculation of the external surfaces area (Sext) for each MPC from Brunauer–Emmett–Teller surface area (SBET) and the internal surface area of the pore (Sint) estimated by N2 adsorption/desorption experiments: Sext = SBET − Sint (Fig. S7,† and Table 1). The Sext for the MPC-150, MPC-30, and MPC-10 were 26.0, 49.9, and 32.3 m2 g−1, respectively. The slight difference in Sext compared to SBET indicates that the MPC with smaller pores possesses a larger number of pores per weight. In such a situation, the area of a limited external surface encompassed by mesopores as a reaction field became smaller. Hence, the smaller particle sizes were afforded in the case of MPC with small pores.
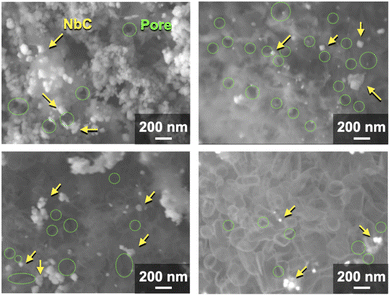 |
| | Fig. 4 SEM images of synthesized NbC by the calcination of the mixture of Nb2O5 (0.1 g) MPC-150 (0.1 g), and K2CO3 (0.035 g) at 1150 °C for 10 under N2 stream atmosphere. | |
Table 1 Brunauer–Emmett–Teller surface areas (SBET), internal surface areas arising from mesopores (Sint) estimated by Barrett–Joyner–Halenda (BJH) method, and external surface area (Sext) of MPC-150, MPC-30, and MPC-10. Sext was calculated by the equation as follow: Sext = SBET − Sint
| Type of MPC |
SBET/m2 g−1 |
Sint/m2 g−1 |
Sext/m2 g−1 |
| MPC-150 |
203.2 |
177.2 |
26.0 |
| MPC-30 |
695.0 |
645.1 |
49.9 |
| MPC-10 |
1055.9 |
1023.6 |
32.3 |
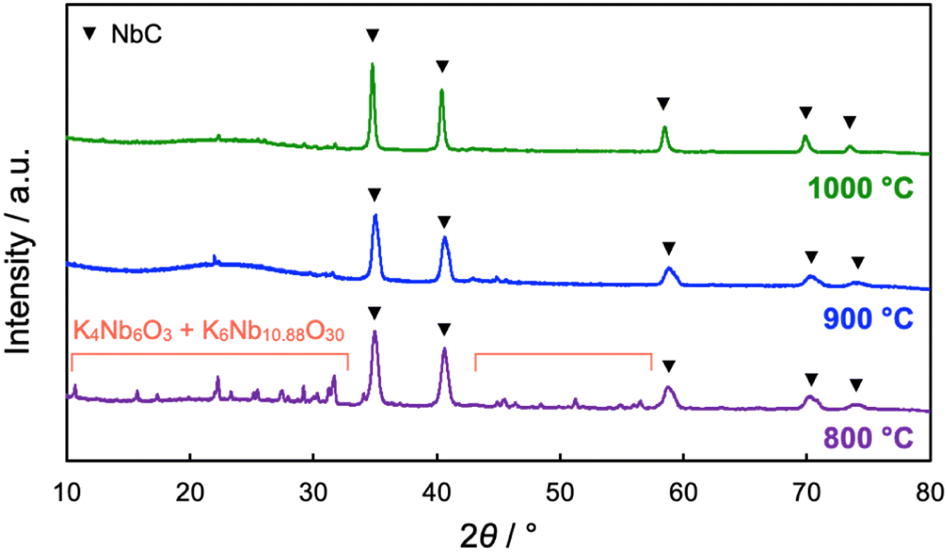
The impact of calcination temperatures on the formation of NbC was also investigated. Fig. 5 shows XRD patterns of the products after calcination at different temperatures (800–1000 °C). NbC could be successfully synthesized alone above 1000 °C (see Fig. 2 for the calcination at 1150 °C), while potassium niobate (KNbO3) was observable at 900 °C, and other potassium niobate species (K4Nb6O17) was also detected in addition to KNbO3 in the case of calcination at 800 °C. However, KNbO3 completely deteriorated and only diffraction peaks arising from NbC appeared on the calcination at 900 °C for 20 h (Fig. S8†). Weakening peaks of K4Nb6O17 and KNbO3 accompanied with strengthen of the NbC peak was also observed by calcination at 800 °C for 40 h, too (Fig. S8†). Notably, no NbC was generated on the calcination at 900 °C at 20 h in the absence of K2CO3 (Fig. S9†), therefore the niobates were reaction-active species. Since K4Nb6O17 is an intermediate in the formation of KNbO3 from Nb2O5 and K2CO3,33,34 these findings indicate that NbC is formed by the reaction of carbon and KNbO3. Here, the intermediated KNbO3 is expected to have an extraordinary contribution to selective reaction at the external surface of MPC. Capillary action (CA) is generally the dominant driving force on incursion of liquid into the nano-scale pores and its magnitude is strongly dependent on the affinity between the liquid and substrate possessing pores.35 Since ionic KNbO3 molten, composed of K+ and [NbO6]7− octahedra,36,37 disfavors hydrophobic MPC, the CA is not preferred, resulting in the prohibition of the incursion of KNbO3 molten into the pore of MPC. The D values of NbC became smaller as the calcination temperature decreased, i.e. D = 36, 31, and 17 nm for 1150 °C (10 h), 1000 °C (10 h), and 900 °C (20 h), respectively. The average particle sizes of NbC estimated from TEM observation also coincided with this tendency (Fig. S10 and S11†). The decrease in the particle sizes was due to preventing sintering, and particle sizes of NbC could be changed in our novel alkali-molten synthetic method with MPC by the variation calcination temperature.
 |
| | Fig. 5 XRD patterns of products after calcination of the mixture of Nb2O5 (0.1 g) MPC-150 (0.1 g), and K2CO3 (0.035 g) at different temperatures for 10 h under N2 stream atmosphere. The yields of NbC were estimated to be 60.8, 85.5, and 85.5% on the calcination at 800, 900, 1000 °C, respectively. | |
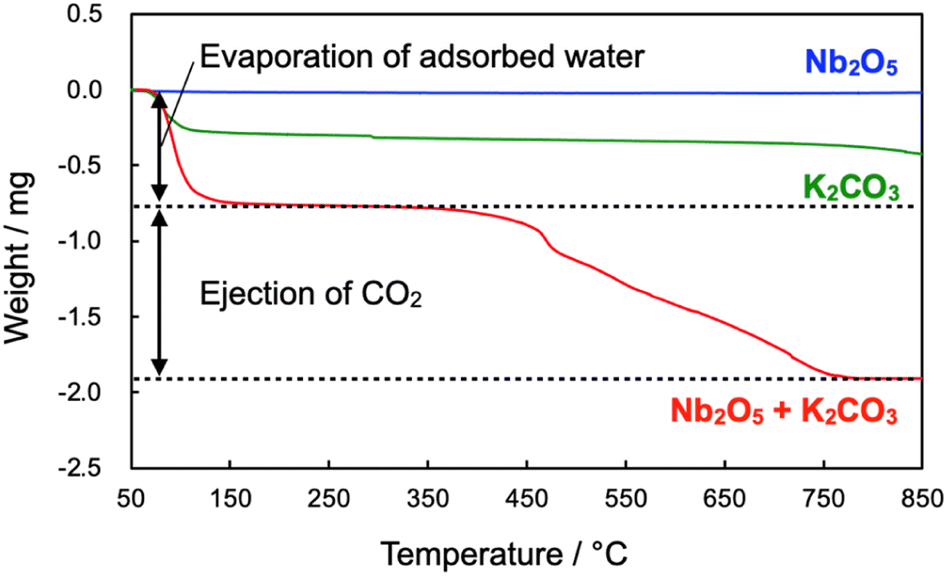
According to the result mentioned above, Nb2O5 stepwise changed to NbC via KNbO3 intermediate. To clarify the reaction mechanism on the first step, from Nb2O5 to KNbO3, thermogravimetry (TG) was performed for Nb2O5, K2CO3, and the mixture of Nb2O5 and K2CO3 (Fig. 6). Weight was identical on the elevation of temperature in the case of Nb2O5, while the clear weight loss from 50 °C to 175 °C of temperature range was observable on the K2CO3 and their mixture. The decrease in the weight is attributed to the dehydration of K2CO3.38 In addition to the dehydration, second 1.13 mg of weight loss could be seen in only the mixture. A gaseous by-product was responsible for the weight loss since KNbO3 was never evaporated at 900 °C, hence mass spectrometry of possible gaseous products during temperature elevation was performed for the mixture of Nb2O5 and K2CO3 (Fig. S12†). The mass signals strongly indicate that only CO2 (m/z = 44) was produced as gaseous products, which is reasonable because the theoretical stoichiometric amount of emitted CO2 in the reaction was 1.02 mg, coinciding with the experimental value (1.13 mg). Thus, the first step in the synthesis of NbC can be described as eqn (1), which is well-matched with the result mentioned in the effect of calcination temperature.
| | |
Nb2O5 + K2CO3 → 2KNbO3 + CO2
| (1) |
Here, K
2CO
3 used in this experiment (2.53 × 10
−4 mol) was stoichiometrically lacking to Nb
2O
5 (3.76 × 10
−4 mol), but a complete transformation of Nb
2O
5 to KNbO
3 could be explained by the discussion mentioned below.
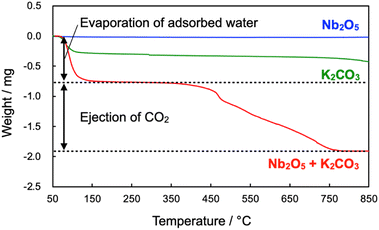 |
| | Fig. 6 TG profiles of Nb2O5, K2CO3 and their mixture during temperature elevation at the rate of 10 °C min−1 under N2 atmosphere. | |
The reaction mechanism in the second step was hence tracked by using commercial KNbO3 and MPC-150. The XRD measurement strongly suggests that KNbO3 is the reactant for the formation of NbC (Fig. S13†). The weight of the mixture of KNbO3 and MPC-150 decreased by 92.0 mg after calcination. Here, K2O is known to be degraded to K2O2 and K above 360 °C.39 The K2O2 again afford K2CO3 by reacting with CO,39 while K evaporates above 757 °C.40 Hence, not only the gaseous materials but also K2O can be the product responsible for weight loss. If the CO2 was formed in this process under estimation of evaporation of K2O, the theoretical weight loss was 76.9 mg, while the weight loss was 88.1 mg in the case of the formation of CO. Hence, CO is preferred as the product because of well matching the experimental data. Therefore, a possible reaction can be depicted as follow.
| | |
2KNbO3 + 7C → 2NbC + 5CO + K2O
| (2) |
It should be noted that K2O likely to reacts with Nb2O5 in the case of the existence of Nb2O5.41 Indeed, the reaction of Nb2O5 and KOH at 700 °C afforded KNbO3 (Fig. S14†), where reaction temperature was set to 700 °C to laten carbonization of KNbO3 and KOH transformed into K2O by dehydration at this temperature.42 The reaction of K2O with Nb2O5 well explains the fact that no Nb2O5 remains despite the condition of the stoichiometric lacking of K2CO3 to Nb2O5 for all experiments. Hence the following equation can be described.
The entire reaction mechanism was proposed from the findings of experiments. On the direct reaction at the first step, Nb2O5 was transformed into KNbO3 by the reaction with K2CO3 (eqn (1)) and K2O was generated as a by-product. The K2O further makes Nb2O5 change KNbO3 (eqn (3)) or reacts with CO2 to regenerate K2CO3 (ref. 43) (eqn (4)). On the other hand, since NbO2 was also formed in the absence of K2CO3 (Fig. 2), indirect paths from NbO2 should be also considered (eqn (5)–(7)). The second step is the carbonization of intermediated KNbO3 on the external surface of MPC (eqn (2)). The selective proceeding at the external surface is due to the inhibition of CA as mentioned above. All considerable elemental reactions in the synthesis of NbC nanoparticles using MPC are shown as follows.
First step
(Direct reaction from Nb2O5)
| | |
Nb2O5 + K2CO3 → 2KNbO3 + CO2
| (1) |
(Indirect reaction via NbO2)
| | |
Nb2O5 + C → 2NbO2 + CO
| (5) |
| | |
Nb2O5 + CO → 2NbO2 + CO2
| (6) |
| | |
2NbO2 + K2CO3 → 2KNbO3 + CO
| (7) |
Second step
| | |
2KNbO3 + 7C → 2NbC + 5CO + K2O
| (2) |
Experimental
Synthesis of niobium(IV) carbide (NbC)
0.1 g of graphite (8.33 × 10⁻³ mol, KANTO CHEMICAL Co., Inc.) or MPC (8.33 × 10⁻³ mol, TOYO TANSO Co., Ltd), 0.1 g of Nb2O5 (3.76 × 10⁻⁴ mol, FUJIFILM Wako Pure Chemical Co., Ltd), and 0.035 g of K2CO3 (2.53 × 10⁻⁴ mol, FUJIFILM Wako Pure Chemical Co., Ltd) were mixed by mortar and obtained mixture was added on the platinum boat. The reactants on the platinum boat were placed in the oven and calcined at different temperature (800–1150 °C) for 10 h under N2 atmosphere. After cooling to room temperature, NbC was obtained. On the investigation of reaction mechanism, KNbO3 (KOJUNDO CHEMICAL LABORATORY Co., Ltd) was also used as reactants.
X-ray diffraction (XRD) measurement
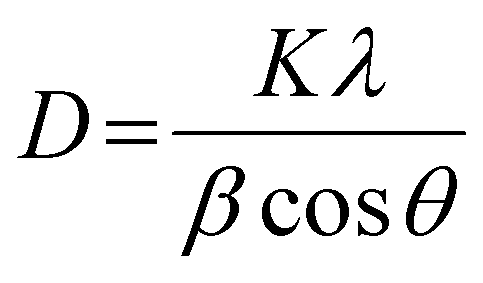
The XRD analysis was performed using Ultima-IV apparatus (Rigaku Co., Ltd). All samples were irradiated with Cu Kα (λ = 0.154 nm) at a voltage of 40 kV and current of 40 mA. The scanning range and scanning speed were set to 5°–80° and 2.0° min−1 for all the measurements. The “D/teX Ultra” was utilized as a detector. A crystalline size (D) was calculated by Scherrer equation as shown below:| |
 | (8) |
where, K, β, and θ represent shape factor, dull widths at half maximum, and diffraction angle, respectively. The composition of the resulting materials was simply quantified by using reference intensity ratio (RIR) method.
Nitrogen (N2) adsorption/desorption test
N2 adsorption/desorption isotherms were recorded by a BELSORP-mini II apparatus (MicrotracBEL Co., Ltd). 10 mg of sample was placed in a glass cell and was heated at 150 °C for 2 h in vacuo as pre-treatment. N2 adsorption experiments were performed at −196 °C.
Thermogravimetry (TG)
Thermogravimetry-differential thermal analyzer (Thermo plus EVO, Rigaku Co., Ltd) was used for TG-DTA, and the sample was added into a platinum pan (SHIMADZU). The α-alumina was used as a reference. On the investigation of mechanism, the sample was heated from 25 to 900 °C at the rate of 10 °C min−1 under N2 stream condition.
Temperature-programed mass spectrometry
The mixture of Nb2O5 (0.1 g) and K2CO3 (0.035 g) in the glass cell was heated to 1000 °C at the rate of 5.0 °C min−1 by using BELCAT II apparatus (MicrotracBEL Co., Ltd). The ejected gaseous component was analyzed by mass spectrometry using BELMASS (MicrotracBEL Co., Ltd).
Transmission electron microscopy (TEM)
All samples were added in ethanol and the suspensions were sonicated. The suspensions were dip on the Cu microgrid (Okenshoji Co., Ltd) and dried. TEM images were observed at 200 kV using a JEM-2100F (JEOL) system.
Scanning electron microscopy (SEM)
The resulting NbC was placed onto carbon tape equipped with alumina substrate (Okenshoji Co., Ltd) and SEM images of it were observed by field-emission scanning electron microscopy (FE-SEM, JSM-7400F, JEOL) with a measurement condition as follow: 5 kV of voltage, 1.0 × 10⁻¹⁰ A of current, and 8 mm of working distance.
Conclusions
We succeeded in the fabrication of NbC nanoparticles with a size of 30–50 nm by a novel alkali-molten salt method using MPCs. The NbC nanoparticles became smaller when MPC possessing small pore size was used due to the decreasing in area of the external surface encompassed by pores as reaction field. The particle sizes of NbC were also changeable by calcination temperature. Furthermore, all considerable elemental reactions were demonstrated by the X-ray spectroscopic, thermogravimetric, and mass spectrometric analyses. We believe that the strategy in the present study has an extraordinary contribution to the field of material chemistry and accelerates development of nano-sized functional materials.
Author contributions
Keigo Tashiro: preparation of manuscript, TEM observation, analyses. Shogo Kobayashi: preparation of manuscript, experiments, analyses. Hinako Inoue: experiments. Shuhei Shimoda: preparation of manuscript, TEM observation. Akihide Yanagita: TEM observation. Shigeo Satokawa: preparation of manuscript.
Conflicts of interest
There are no conflicts to declare.
Acknowledgements
This study was supported by the Joint Usage/Research Center for Catalysis, Hokkaido University.
References
- C. B. Peres, P. M. R. Resende, L. J. R. Nunes and L. C. de Marais, Clean Technol., 2022, 4, 1193–1207 CrossRef.
- M. González-Castaño, B. Dorneanu and H. Arellano-García, React. Chem. Eng., 2021, 6, 954–976 RSC.
- X. Pan, F. Jiao, D. Miao and X. Bao, Chem. Rev., 2021, 121, 6588–6609 CrossRef CAS PubMed.
- S. Sun, H. Sun, P. T. Williams and C. Wu, Sustainable Energy Fuels, 2021, 5, 4546–4559 RSC.
- A. J. Barrios, D. V. Peron, A. Chakkingal, A. I. Dugulan, S. Moldovan, K. Nakouri, J. Thuriot-Roukos, R. Wojcieszak, J. W. Thybaut, M. Virginie and A. Y. Khodakov, ACS Catal., 2022, 12, 3211–3225 CrossRef CAS.
- C. Giornado and M. Antonietti, Nano Today, 2011, 6, 366–380 CrossRef.
- J. G. Chen, Chem. Rev., 1996, 96, 1477–1498 CrossRef CAS PubMed.
- D. J. Ham and J. S. Lee, Energies, 2009, 2, 873–899 CrossRef CAS.
- D. Zeng and M. J. Hampden-Smith, Chem. Mater., 1992, 4, 968–970 CrossRef CAS.
- Y. Xiao, J.-Y. Hwang and Y.-K. Sun, J. Mater. Chem. A, 2016, 4, 10379–10393 RSC.
- H. Zhang, X. Yang, H. Zhang, J. Ma, Z. Huang, J. Li and Y. Wang, Chem. - Eur. J., 2021, 27, 5074–5090 CrossRef CAS PubMed.
- H. Prats, J. J. Piñero, F. Viñes, S. T. Bromley, R. Sayós and F. Illas, Chem. Commun., 2019, 55, 12797–12800 RSC.
- S. Meyer, A. V. Nikiforov, I. M. Petrushina, K. Köhler, E. Christensen, J. O. Jensen and N. J. Bjerrum, Int. J. Hydrogen Energy, 2015, 40, 2905–2911 CrossRef CAS.
- T. Wakisaka, K. Kusada, D. Wu, T. Yamamoto, T. Toriyama, S. Matsumura, H. Akiba, O. Yamamuro, K. Ikeda, T. Otomo, N. Palina, Y. Chen, L. S. R. Kumara, C. Song, O. Sakata, W. Xie, M. Koyama, Y. Kubota, S. Kawaguchi, R. L. Arevalo, S. M. Aspera, E. F. Arguelles, H. Nakanishi and H. Kitagawa, J. Am. Chem. Soc., 2020, 142, 1247–1253 CrossRef CAS PubMed.
- S. Ahmad, I. Ashraf, M. A. Mansoor, S. Rizwan and M. Iqbal, Nanomaterials, 2021, 11, 776 CrossRef CAS PubMed.
- H. Zhang, J. Liu, Z. Tian, Y. Ye, Y. Cai, C. Liang and K. Terabe, Carbon, 2016, 100, 590–599 CrossRef CAS.
- C. Kunkel, F. Viñes and F. Illas, Energy Environ. Sci., 2016, 9, 141–144 RSC.
- K.-H. Wu, Y. Jiang, S. Jiao, K.-C. Chou and G.-H. Zhang, J. Mater. Res. Technol., 2020, 9, 11778–11790 CrossRef CAS.
- Y. Lian, N. Yang, D. Wang, Y. Zheng, C. Ban, J. Zhao and H. Zhang, Adv. Energy Sustainability Res., 2020, 1, 2000038 CrossRef.
- V. L. S. T. da Silva, M. Schmal and S. T. Oyama, J. Solid State Chem., 1996, 123, 168–182 CrossRef.
- B. Deng, Z. Wang, W. Chen, j. T. Li, D. X. Luong, R. A. Carter, G. Gao, B. I. Yakobson, Y. Zhao and J. M. Tour, Nat. Commun., 2022, 13, 262 CrossRef CAS PubMed.
- N. S. Alhajri, D. H. Anjum, M. N. Hedhili and K. Takanabe, ChemistrySelect, 2016, 2, 290–296 CrossRef.
- S. Qin, B. Liao, L. Mao and F. Xiao, Mater. Lett., 2014, 121, 162–165 CrossRef CAS.
- R. Mahle, P. L. Mahapatra, A. K. Singh, P. Kumbhakar, M. Paliwal, C. S. Tiwary and R. Banerjee, ACS Sustainable Chem. Eng., 2022, 10, 13650–13660 CrossRef CAS.
- A. Gupta, M. Mittal, M. K. Singh, S. L. Suib and O. P. Pandey, Sci. Rep., 2018, 8, 13597 CrossRef PubMed.
- L. Yate, L. E. Coy, G. Wang, M. Baltrán, E. Díaz-Barriga, E. M. Saucedo, M. A. Ceniceros, K. Załęski, I. Llarena, M. Möller and R. F. Ziolo, RSC Adv., 2014, 4, 61355–61362 RSC.
- M. Lei, H. Zhao, H. Yang, B. Song and W. H. Tang, J. Eur. Ceram. Soc., 2008, 28, 1671–1677 CrossRef CAS.
- D. E. Grove, U. Gupta and A. W. Castleman Jr, Langmuir, 2010, 26, 16517–16521 CrossRef CAS PubMed.
- P. G. Li, M. Lei, Z. B. Sun, L. Z. Cao, Y. F. Guo, X. Guo and W. H. Tang, J. Alloys Compd., 2007, 430, 237–240 CrossRef CAS.
- E. Coy, Y. Yate, D. P. Valencia, W. Aperador, K. Siuzdak, P. Torruella, E. Azanza, S. Estrade, I. Iatsunskyi, F. Peiro, X. Zhang, J. Tejada and R. F. Ziolo, ACS Appl. Mater. Interfaces, 2017, 9, 30872–30879 CrossRef CAS.
- J. Ma, M. Wu, Y. Du, S. Chen, W. Jin, L. Fu, Q. Yang and A. Wen, J. Alloys Compd., 2009, 475, 415–417 CrossRef CAS.
- Y. Du, M. Lei, H. Yang and X. Wang, J. Wuhan Univ. Technol., Mater. Sci. Ed., 2008, 23, 779–782 CrossRef CAS.
- S. Uchida, Y. Inoue, Y. Fujishiro and T. Sato, J. Mater. Sci., 1998, 33, 5125–5129 CrossRef CAS.
- D.-H. Kim, M.-R. Joung, I.-T. Seo, J. Hur, J.-H. Kim, B.-Y. Kim, H.-J. Lee and S. Nahm, J. Eur. Ceram. Soc., 2014, 34, 4193–4200 CrossRef CAS.
- A. Depalo and A. C. Santomaso, Colloids Surf., A, 2013, 436, 371–379 CrossRef CAS.
- A. I. Stash, E. O. Terekhova, S. A. Ivanov and V. G. Tsirelson, Acta Crystallogr., Sect. B: Struct. Sci., Cryst. Eng. Mater., 2021, 77, 728–739 CrossRef CAS.
- D. Yang, Y. Wang, L. Li, M. Yao, W. Zhang, H. Gu, S. Zhang, M. Fan, G. A. Sewvandi and D. Hu, Inorg. Chem., 2021, 60, 97–107 CrossRef CAS PubMed.
- N. Mazur, H. Huinink, B. Borm, S. Sansota, H. Fischer and O. Adan, Thermochim. Acta, 2022, 715, 179286 CrossRef CAS.
- J. M. Illingworth, B. Rand and P. T. Williams, Fuel Process. Technol., 2022, 235, 107348 CrossRef CAS.
- F. Aitken and F. Volino, Phys. Fluids, 2022, 34, 017112 CrossRef CAS.
- X. Hong, L. Lu, Y. Zhao and X. Wu, Chin. Phys. Lett., 1995, 12, 83–86 CrossRef CAS.
- H. M. Yang, D. H. Zhang, Y. Chen, M. J. Ran and J. C. Gu, Earth Environ. Sci., 2017, 69, 012051 Search PubMed.
- S. Yokoyama, K. Tanaka, M. Seisho and H. Haneda, J. Jpn. Pet. Inst., 1983, 26, 462–466 CrossRef CAS.
|
| This journal is © The Royal Society of Chemistry 2023 |
Click here to see how this site uses Cookies. View our privacy policy here. 
 Open Access Article
 This Open Access Article is licensed under a
  *a,
Shogo Kobayashia,
Hinako Inouea,
Akihide Yanagita
*a,
Shogo Kobayashia,
Hinako Inouea,
Akihide Yanagita