
 Open Access Article
 This Open Access Article is licensed under a Creative Commons Attribution-Non Commercial 3.0 Unported Licence
The effect of cetyltrimethylammonium bromide (CTAB) addition on green synthesis of porous N-doped TiO2 for photoreduction of heavy metal ion Cr(VI)
Diana Vanda Wellia *a,
Atika Syafawia,
Yulia Eka Putria and
Muldarisnurb
*a,
Atika Syafawia,
Yulia Eka Putria and
Muldarisnurb
aDepartment of Chemistry, Faculty of Mathematics and Natural Sciences, Universitas Andalas, Indonesia. E-mail: nandadiana@sci.unand.ac.id
bDepartment of Physics, Faculty of Mathematics and Natural Sciences, Universitas Andalas, Indonesia
First published on 10th October 2023
Abstract
In this study, porous TiO2 photocatalysts modified by nitrogen (NCT) were successfully synthesized using a combination of green synthesis methods by utilizing Aloe vera (L.) Burm. f. peel and hydrothermal method. In addition, TiO2 was modified by increasing the active surface area using Cetyltrimethylammonium Bromide (CTAB). The X-ray Diffraction (XRD) results indicated that the anatase phase was formed. The result of the Diffuse Reflectance Spectroscopy UV-Vis (DRS UV-Vis) using the Tauc-plot method showed that all porous N-doped TiO2 samples experienced a decrease in the energy gap. This indicates the successful modification of TiO2 by nitrogen, as confirmed by the Fourier Transform Infra-Red (FTIR) result. Field Emission Scanning Electron Microscopy (FESEM) result showed that the synthesized TiO2 had a spherical morphology of 10–30 nm diameter. The Braunauer, Emmett, and Teller (BET) result indicated that the type IV isotherm curve with a mesoporous structure was formed. The NCT0.75 sample had a surface area and pore size of 95.02 m2 g−1 and 8.021 nm, respectively, while the NTi0.75 sample had a surface area and pore size of 90.97 m2 g−1 and 5.161 nm, respectively. The photocatalytic activity of the porous N-doped TiO2 was tested on photoreduction of metal pollutant model Cr(VI). The result demonstrated that the NCT0.75 sample had the most optimal photocatalytic activity by reducing 89.42% of Cr(VI) metal ions.
Introduction
As a developing country, Indonesia has begun to show high economic growth, particularly in the industrial sector. The rapid development of industry harms the environment, such as producing and discharging hazardous waste into the environment without prior processing.1 Heavy metal waste, such as lead (Pb), cadmium (Cd), mercury (Hg), and chromium (Cr), are produced mainly through industrial activities.2 According to the World Health Organization (WHO), chromium(VI) waste is one of the carcinogenic pollutants to humans.3 Cr(VI) is mostly produced from industrial activities, such as metallurgy, the leather industry, the electroplating industry, and the wood industry. This condition must be overcome immediately. For this purpose, one way is to change Cr(VI) to Cr(III) to reduce the level of poison.4Photocatalytic is an effective, non-toxic, economical, and easy method to convert Cr(VI) to Cr(III). The photocatalytic process requires a catalyst, such as semiconductor catalysts, including TiO2, ZnO, ZnS, ZrO2, CdS, and WO3. Due to its electronic and optical properties, high photocatalytic activity, and non-toxicity, TiO2 is considered an ideal semiconductor catalyst.5 Pure TiO2 with an anatase phase has a band gap value of 3.2 eV, which is limited only under UV light. Several attempts have been made to expand the working ability of TiO2 to the visible light region, namely through metal doping, non-metal doping, and sensitization. Li et al. (2020) showed that nitrogen is the most effective dopant used because it can modify the electronic structure of TiO2 by forming a new band (N 2p orbital) above the valence band (O 2p orbital).6,7 In addition, efforts to increase photocatalytic activity can also be conducted by expanding the surface of the photocatalyst with the formation of pores.8
TiO2 nanoparticles can be synthesized using chemical and physical methods, such as solvothermal, sol–gel, hydrothermal, sonochemical, microwave, and ultrasonic irradiation. According to Byrappa and Adschiri (2007) and Hayashi and Hakuta (2010), hydrothermal synthesis is usually understood to involve heterogeneous reactions occurring in aqueous or non-aqueous fluids that result in crystallization above room temperature and at high pressure (>1 atm). The majority of scientists have used the word “solvothermal” to describe chemical reactions that happen in non-aqueous solvents. The closed stainless steel autoclave used for hydrothermal synthesis often has a Teflon coating to resist the high heat and pressures involved in this process.9 So this method requires high capital requirements for instrumentation, and the inability to monitor crystal growth, this method can only be carried out in supercritical solvent conditions, and uses non-aqueous solvents with very high boiling points.10
Physical methods include thermal decomposition, laser irradiation, and electrolysis while chemical methods use chemicals such as sodium borohydride or sodium citrate as reducing agents. Physical methods typically use highly intensive costly equipment that involves vacuum and chemical methods are considered the most commonly used technique to synthesize nanoparticles. Preparation through chemical and physical methods can lead to environmental problems upon discharge due to the usage of dangerous chemicals.11 So these methods not only require high energy and high pressure, but also they are expensive. Moreover, the chemical processes involve reducing and stabilizing agents producing by-products that are not environmentally friendly.12 Therefore, the nanoparticle biosynthesis method is used because of being environmentally friendly without the use of complex equipment and techniques and also high temperatures and pressures.13
Medicinal plant Aloe vera (L.) Burm. f. can be selected as a reducing and stabilizing agent in the biosynthesis of N-doped TiO2 because it contains secondary metabolites, such as saponins, flavonoids, and tannins, acting as biogenic capping agents.14,15 A capping agent is a functional compound that maintains the shape of the particles by controlling the direction of crystal growth. Crystal growth can run fast which causes the resulting particle size to be large. Specifically, the capping agent will be in a particular crystal plane to lower the surface energy to direct the process nucleation forms stable TiO2.17
The application of N-doped TiO2 with high crystallinity and specific surface area is very important to increase photocatalytic efficiency. One way to develop a material with a high surface area is to introduce a pore-forming agent to the synthesis of the material. The synthesis of porous N-doped TiO2 using CTAB as a pore-forming agent was performed by Toe et al. (2018), leading to the production of a porous material with a high, uniform, and homogeneous specific surface area, thereby increasing photocatalytic activity.16 Therefore, in this study, CTAB was used as a pore-forming agent in synthesizing porous N-doped TiO2 and utilizing Aloe vera (L.) Burm. f. bark extract as a natural capping agent using a combination of biosynthetic and hydrothermal methods. The resulting porous N-doped TiO2 was applied to reduce metal ions Cr(VI).
Experimental
Materials
The materials used in this study were TiCl4 (Merck) as TiO2 precursor, Aloe vera (L.) Burm. f. (Aloe vera), NH4OH 25% as nitrogen source, commercial cetyltrimethylammonium bromide (CTAB) (Merck) as porous forming agent, deionized water, ethanol (p.a. Merck), aquadest, NaOH (Merck), K2Cr2O7 (Merck) for pollutant model, H2SO4 (p.a. Merck), and 1,5-diphenylcarbazide (Merck) as complexing agent. All materials were used as received. The equipment used includes glassware, funnels, Whatman No. 42 filter paper, magnetic stirrer, hot plate, cylinder vessel, autoclave, furnace, centrifuge, oven, analytical balance, pH meter, aluminium foil, and light sources (VISALUX LED lamps 24 watts). The instruments used for sample characterization were X-ray Diffraction (XRD-XPERT PRO PANalytical pw 30/40), Diffuse Reflectance Spectroscopy UV-Vis (DRS UV-Vis-SPECORD 210 Plus), Fourier Transform Infra-Red (FTIR-PerkinElmer Version 10.6.1), Braunauer, Emmett, and Teller analysis (BET-Quantachrome Nova 4200e), Field Emission Scanning Electron Microscopy (FESEM) and Electron Dispersive X-ray (EDX-FEI Quanta FEG 650), and Ultraviolet-visible (UV-Vis) Spectrophotometry (SHIMADZU CORP 04843).Preparation of Aloe vera (L.) Burm. f. extract
To prepare the Aloe vera samples, the peel was taken and separated from the gel 10 g of fresh sample was washed and mashed. Then the sample was boiled with deionized water (100 mL) and stirred for 1 h at 70 °C. The bark extract was filtered using the Whatman filter paper.18Synthesis of porous TiO2 nanoparticles
5 mL of titanium chloride (TiCl4 1 M) solution was put into a flat bottom flask and stirred at a constant speed (1500 rpm) in a closed state. Then, 50 mL of deionized water and Aloe vera (L.) Burm. f. peel extract with a volume concentration of 10% v/v were added dropwise under constant stirring. After adding the extract, 0.925 g of CTAB and 1 M NaOH were added to obtain pH ∼ 7. After stirring for 24 h, the formed nanoparticles were centrifuged (10![[thin space (1/6-em)]](https://www.rsc.org/images/entities/char_2009.gif) 000 rpm) and washed with ethanol and distilled water three times each to remove impurities. Then the obtained precipitate was dried at 105 °C for 10 h and calcined at 500 °C for 1 h. The same treatment was also conducted on the control, namely the synthesis product, without adding CTAB.16 The obtained porous TiO2 nanoparticle from this initial step will use as the substrate for the N-doping process.
000 rpm) and washed with ethanol and distilled water three times each to remove impurities. Then the obtained precipitate was dried at 105 °C for 10 h and calcined at 500 °C for 1 h. The same treatment was also conducted on the control, namely the synthesis product, without adding CTAB.16 The obtained porous TiO2 nanoparticle from this initial step will use as the substrate for the N-doping process.
Synthesis of porous N-doped TiO2
The porous N-doped TiO2 was prepared using the hydrothermal method. A total of 0.2 grams of porous TiO2 was added to a mixture of 8 mL deionized water and 12 mL ethanol in a 50 mL cylindrical vessel. After adding 0.25 mL of 25% NH4OH, the solution was stirred for 2 h. The obtained mixture was put into a 50 mL Teflon-coated autoclave at 180 °C for 12 h. Afterward, the samples were centrifuged (10000 rpm), repeatedly washed with ethanol and distilled water, and dried in an oven at 105 °C for 10 h. The resulting product was labelled NCT0.25. The same steps were repeated for different volumes of 25% NH4OH, namely 0.5 mL, 0.75 mL, and 1 mL, with the product labels NCT0.5, NCT0.75, and NCT1 (see Table 1). TiO2 control samples were synthesized without the addition of CTAB (labelled as NTi) and NH4OH (labelled as CTO).19
:Ti mole ratio of samples
| No. | Sample | Sample code | Mole ratio N:Ti |
|---|---|---|---|
| 1 | Non-doped porous TiO2 | CTO | — |
| 2 | N-Doped TiO2 using CTAB | NCT0.25 | 1:1 |
| 3 | N-Doped TiO2 using CTAB | NCT0.5 | 2:1 |
| 4 | N-Doped TiO2 using CTAB | NCT0.75 | 3:1 |
| 5 | N-Doped TiO2 using CTAB | NCT1 | 4:1 |
| 6 | N-Doped TiO2 without CTAB | NTi0.75 | 3:1 |
Characterization of porous TiO2 nanoparticles
The samples were characterized using XRD to detect the crystal phase of the sample. Then the refinement process was performed on XRD using the Rietica program with the Le Bail method to obtain crystallographic data of the synthesized material. The optical properties of the samples were studied by DRS UV-Vis. FTIR was employed to determine the chemical structures of porous N-doped TiO2 samples. The surface morphology and composition of the samples were evaluated by FESEM and EDX, respectively. In addition, BET analysis was utilized to determine the specific surface area, pore diameter, and pore volume of the samples.Photocatalytic activity test
0.01 g of K2Cr2O7 was dissolved in 1 L of solution. H2SO4 6 N was added until the pH reached 2 and stirred for 30 minutes. After that, 0.05 g porous N-doped TiO2 sample was inserted into 10 mL of that solution. The mixture was stirred for 5 min until N-doped TiO2 was dispersed homogeneously. Then, the mixture was continue stirred in the dark for 210 min to reach adsorption/desorption equilibrium. After keeping for 210 min, the mixture was placed in a bright place irradiated by a 24 watt Light Emitting Diode (LED) lamp for 240 min. The mixture was put into a test tube and centrifuged. After separating the filtrate, 10 drops of 0.5% w/v 1,5-diphenylcarbazide as coloring agent was added forming complex solution. The absorbance of this complex solution was measured by UV-Vis spectrophotometer at a 543 nm wavelength. The same steps were repeated for NCT0.25, NCT0.5, NCT0.75, and NCT1. Porous TiO2 without adding NH4OH (CTO) and N-doped TiO2 without adding CTAB (NTi0.75) samples were used as control.20 The efficiency of Cr(VI) reduction can be calculated using the following formula:where Ai and Af are the absorbances of Cr(VI) before and after irradiation, respectively. Each experiment was carried out twice, with the average data reported.
Result and discussion
Porous N-doped TiO2 nanoparticles
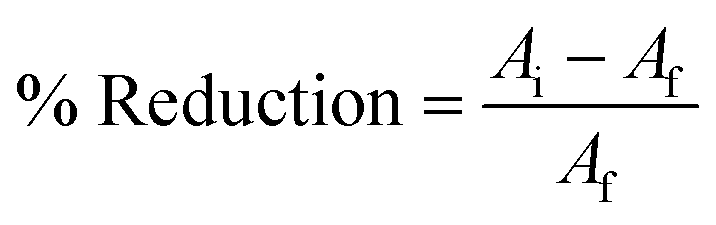
Porous N-doped TiO2 nanoparticles were synthesized using a combination of green synthesis methods (using Aloe vera as a natural capping agent) and hydrothermal method in the TiO2 doping process. Rahim et al. (2020) showed that the results of phytochemical tests on the skin of Aloe vera confirmed the presence of secondary metabolites, such as tannins, saponins, flavonoids, and anthraquinones.21 Aloe vera peel which acts as a natural capping agent, contains compounds functioning as strong chelating, reducing, and stabilizing agents in maintaining the shape and size of nanoparticles and preventing agglomeration.15 Flavonoid and tannin compounds found in Aloe vera skin can bind Ti metal due to possessing hydroxyl (–OH) and carbonyl (C![[double bond, length as m-dash]](https://www.rsc.org/images/entities/char_e001.gif) O) groups. In the ionic state, Ti4+ repulsion occurs due to a similar charge. After being reduced to Ti0, Ti atoms can interact with each other through metallic bonds to form nano-sized clusters. The neutral charge of the Ti atom is due to the electron donation to the Ti4+ ion by the hydroxyl and carbonyl functional groups to produce Ti nanoparticles and to prevent agglomeration as a stabilizer.22,23 The mechanism of reduction of TiO2 nanoparticles by plant extracts can be seen in Fig. 1.
O) groups. In the ionic state, Ti4+ repulsion occurs due to a similar charge. After being reduced to Ti0, Ti atoms can interact with each other through metallic bonds to form nano-sized clusters. The neutral charge of the Ti atom is due to the electron donation to the Ti4+ ion by the hydroxyl and carbonyl functional groups to produce Ti nanoparticles and to prevent agglomeration as a stabilizer.22,23 The mechanism of reduction of TiO2 nanoparticles by plant extracts can be seen in Fig. 1.
 | ||
| Fig. 1 Mechanism of metal nanoparticles synthesis by plant extracts.23 | ||
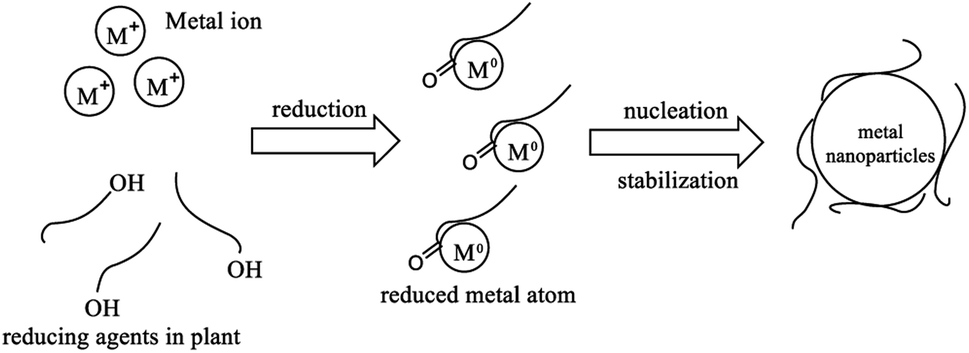
Fig. 2 shows that all the synthesis results obtained are in powder form. The influence of the N/Ti mole ratio can be seen from the color of the TiO2 powder produced, namely pure white powder for undoped TiO2 (CTO) and yellowish-white for N-doped TiO2 (NCT) samples. Samples that are yellowish-white indicate that doping using nitrogen has been carried out successfully.16 Meanwhile, the results of previous studies reported that the synthesis of C–TiO2 with carbon dopant obtained a white powder before calcination and a grayish-white powder after the calcination process.24 Whereas the synthesis of Fe–TiO2 with Fe dopant shows the brown color from Fe-doped TiO2.25 So that it can be confirmed that it is a nitrogen dopant that has been induced into TiO2.
 | ||
| Fig. 2 Synthesized porous TiO2 and N-doped porous TiO2 nanoparticle samples: (a) CTO, (b) NCT0.25, (c) NCT0.5, (d) NCT0.75, and (e) NCT1. | ||
FESEM-EDX analysis
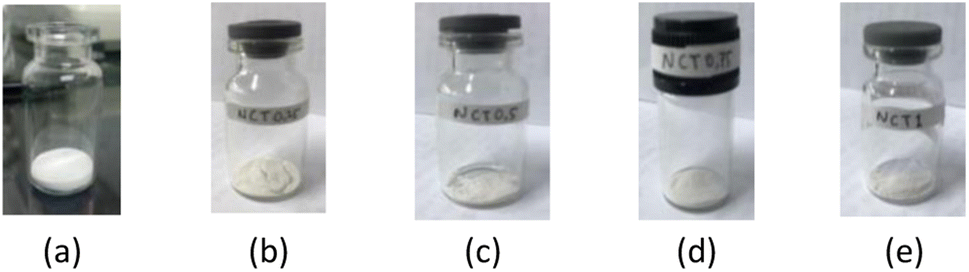
Based on Fig. 3, the formation of particles in the N-doped TiO2 sample with the addition of CTAB (NCT0.75) displays a more perfect and homogeneous spheric/spherical morphology compared to the N-doped TiO2 sample without CTAB (NTi0.75). The NCT0.75 sample had a dominant particle size distribution in the range of 18–20 nm in addition to pores due to the addition of CTAB. The porous structure is caused by the formation of CTAB micelles, which function as pore molds assisting the production of surfaces with porous structure after the calcination process. | ||
| Fig. 3 FESEM images and particle size distribution of samples: (a) NTi0.75 and (b) NCT0.75. | ||
The role of CTAB as a capping agent is able to control particle size during the synthesis process so that the particle size becomes smaller and more uniform.26 Meanwhile, NTi0.75 showed that the particle shape was not entirely spherical, because the rod-shaped particles were found. Also, the dominant particle size distribution was in the range of 10–14 nm. Additionally, it can be seen that the NTi0.75 sample had a denser structure. This is due to the absence of CTAB as a pore-forming agent and particle size-controlling agent.27
EDX characterization was employed to determine the elemental composition of the samples, as shown in Fig. 4. Fig. 4 illustrates that the NCT0.75 and NTi0.75 samples had sharp and strong peaks in titanium (Ti) and oxygen (O). A nitrogen (N) peak was not detected in both samples because the detector was not sensitive enough to analyze elements with a small atomic number (Z < 11), such as nitrogen and boron. The EDX detector able to determine elemental nitrogen is the ultra-thin window (UTW) which has a high sensitivity.28
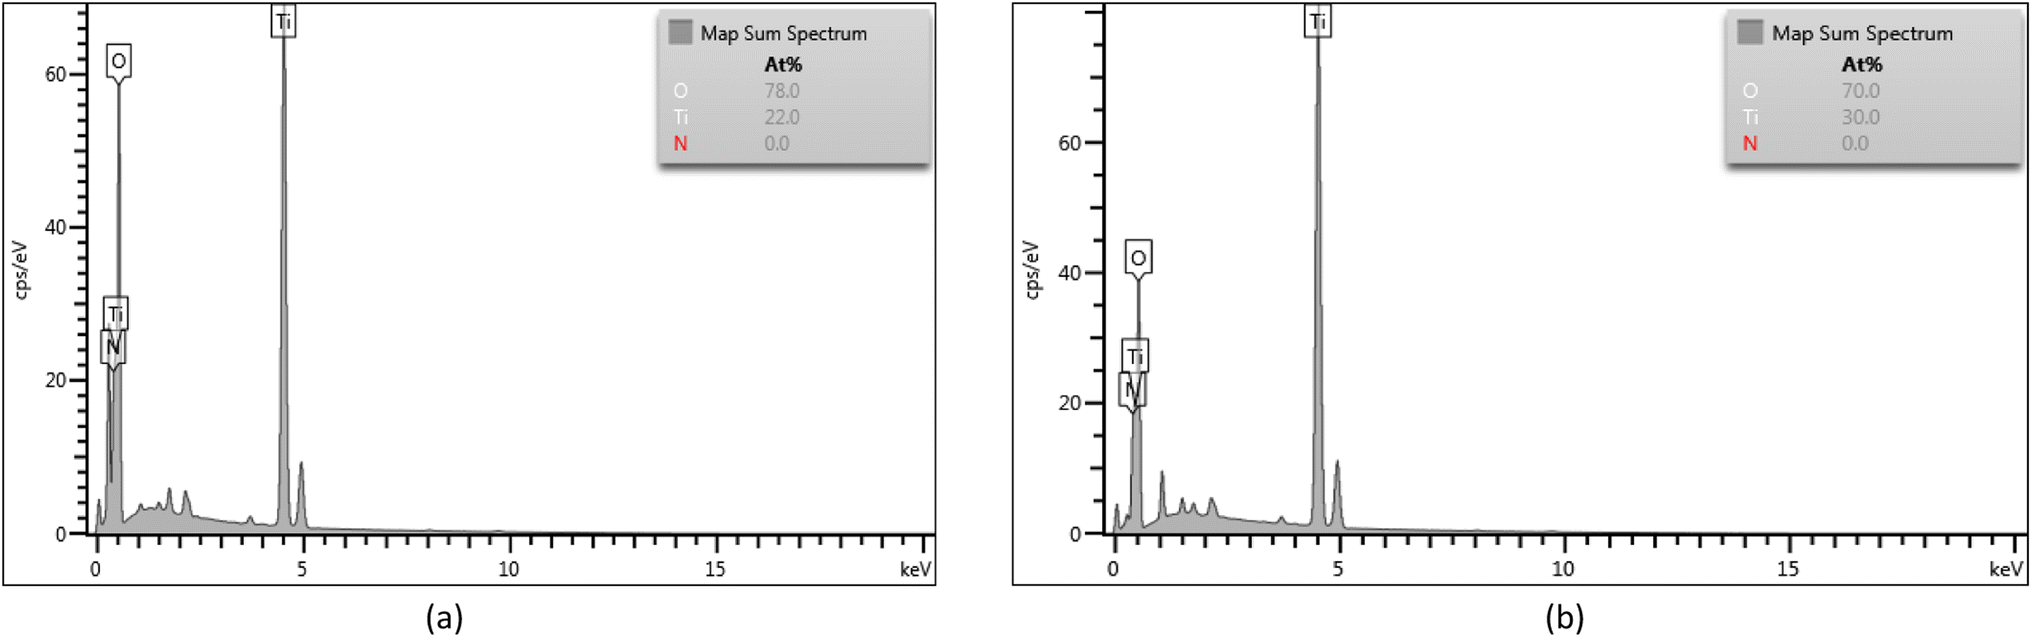 | ||
| Fig. 4 EDX spectrum of samples: (a) NCT0.75, (b) NTi0.75. | ||
On the other hand, the absence of a nitrogen peak may be caused by the trace amount of added nitrogen as a dopant, so the instrument cannot detect the element. To confirm the presence of nitrogen-doped on TiO2, further characterization was conducted. For instance, the XRD data was utilized for the refinement process so that a peak shift could be seen in the presence of nitrogen doping on TiO2.
XRD analysis
The crystal phase, crystal size, and crystallinity of the synthesized compounds were investigated by XRD.29 The XRD patterns of the TiO2 samples with the addition of nitrogen-doped CTAB are shown in Fig. 5. It can be seen that the standard anatase TiO2 had Bragg diffraction peaks with the 2θ values of 25.3°, 37.87°, 48.05°, 53.93°, and 55.10° indexed in planes (101), (004), (200), (105), and (211).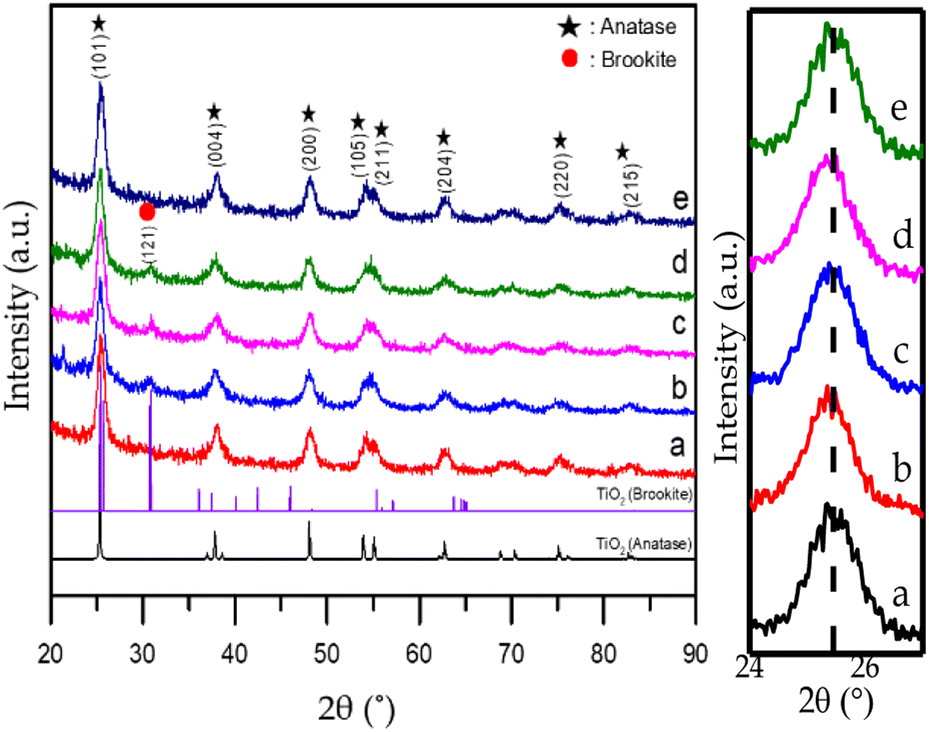 | ||
| Fig. 5 XRD diffraction patterns of samples: (a) CTO, (b) NCT0.25, (c) NCT0.5, (d) NCT0.75, and (e) NCT1. | ||
The results of this study indicate that there is no significant difference between the obtained 2θ values and the standard data, both showing anatase crystals. However, it was observed that there is a phase transformation from anatase to brookite in NCT0.25, NCT0.5, and NCT0.75. This is indicated by a characteristic peak at 2θ = 30.8°, which can be originated from the brookite crystal surface indexed in the plane (121), based on ICSD standard no. 154605.
This result indicates that adding an appropriate nitrogen amount to the hydrothermal solution can cause the change of crystal phase from the anatase to an anatase–brookite mixed phase, better known as a heterostructured material, while the excess addition of nitrogen produces anatase TiO2 products with relatively low crystallinity, it can be seen from the NCT1 diffractogram that there is no brookite peak at 2θ = 30.8°.30,31 The formation of this heterojunction mixture enhances the photoreduction results, especially in the NCT0.75 sample, which can be considered the most optimum sample compared to others.
Nitrogen deposition has the effect of reducing band gap energy and making the material more active in visible light. The XRD diffractogram in Fig. 5 displays the typical TiO2 peak appearance. The successful impregnation of TiO2 or N–TiO2 serves as evidence of this. The anatase structure cannot be destroyed by doping TiO2, as the N–TiO2 diffractogram shows peaks that are comparable to TiO2. But according to earlier studies, the doping procedure might render a crystal lattice ineffective, and its result made N-doped TiO2 more photo catalytically active due to the decreased band gap energy.32
The crystal size of the synthesized material can be calculated from the Full Width at Half Maximum (FWHM) value at peak (101) using the Debye–Scherrer equation. From the calculation results, the crystal size of the control TiO2 was 7.61 nm. The crystal size increased to 8.37 nm in the NCT0.25 sample by doping due to the larger atomic radius of nitrogen (N3− 1.46 Å) than that of oxygen (O2− 1.40 Å). Therefore, the crystal size increased by nitrogen doping. This can be explained by the fact that nitrogen doping can sharpen the XRD peak by increasing the crystal growth rate and the crystal size.33
Further analysis was performed by the refinement process using the Rietica program with the Le Bail method to obtain crystallographic data from the synthesized TiO2 and determine the effect of nitrogen dopant on TiO2 crystallographic data (Fig. 6). Refinement was conducted using the TiO2 standard anatase phase ICSD no. 9855 with a tetragonal structure, space group I41/amdS, length a and b 3.8040 Å, length c 9.614 Å, and cell volume 139.12 Å3. The refined results of nitrogen-doped porous TiO2 with variations in dopant volume of nitrogen (0, 0.25, 0.5, 0.75, and 1 mL) are shown in Table 2. The diffraction data of the nitrogen-doped porous TiO2 sample is in good agreement with the anatase standard. According to Andrieux et al. (2018), smoothing success is indicated by obtaining an R-profile (Rp) of less than 15%, an R-weight profile (Rwp) of less than 20%, and a goodness of fit (X2) of less than 5.34
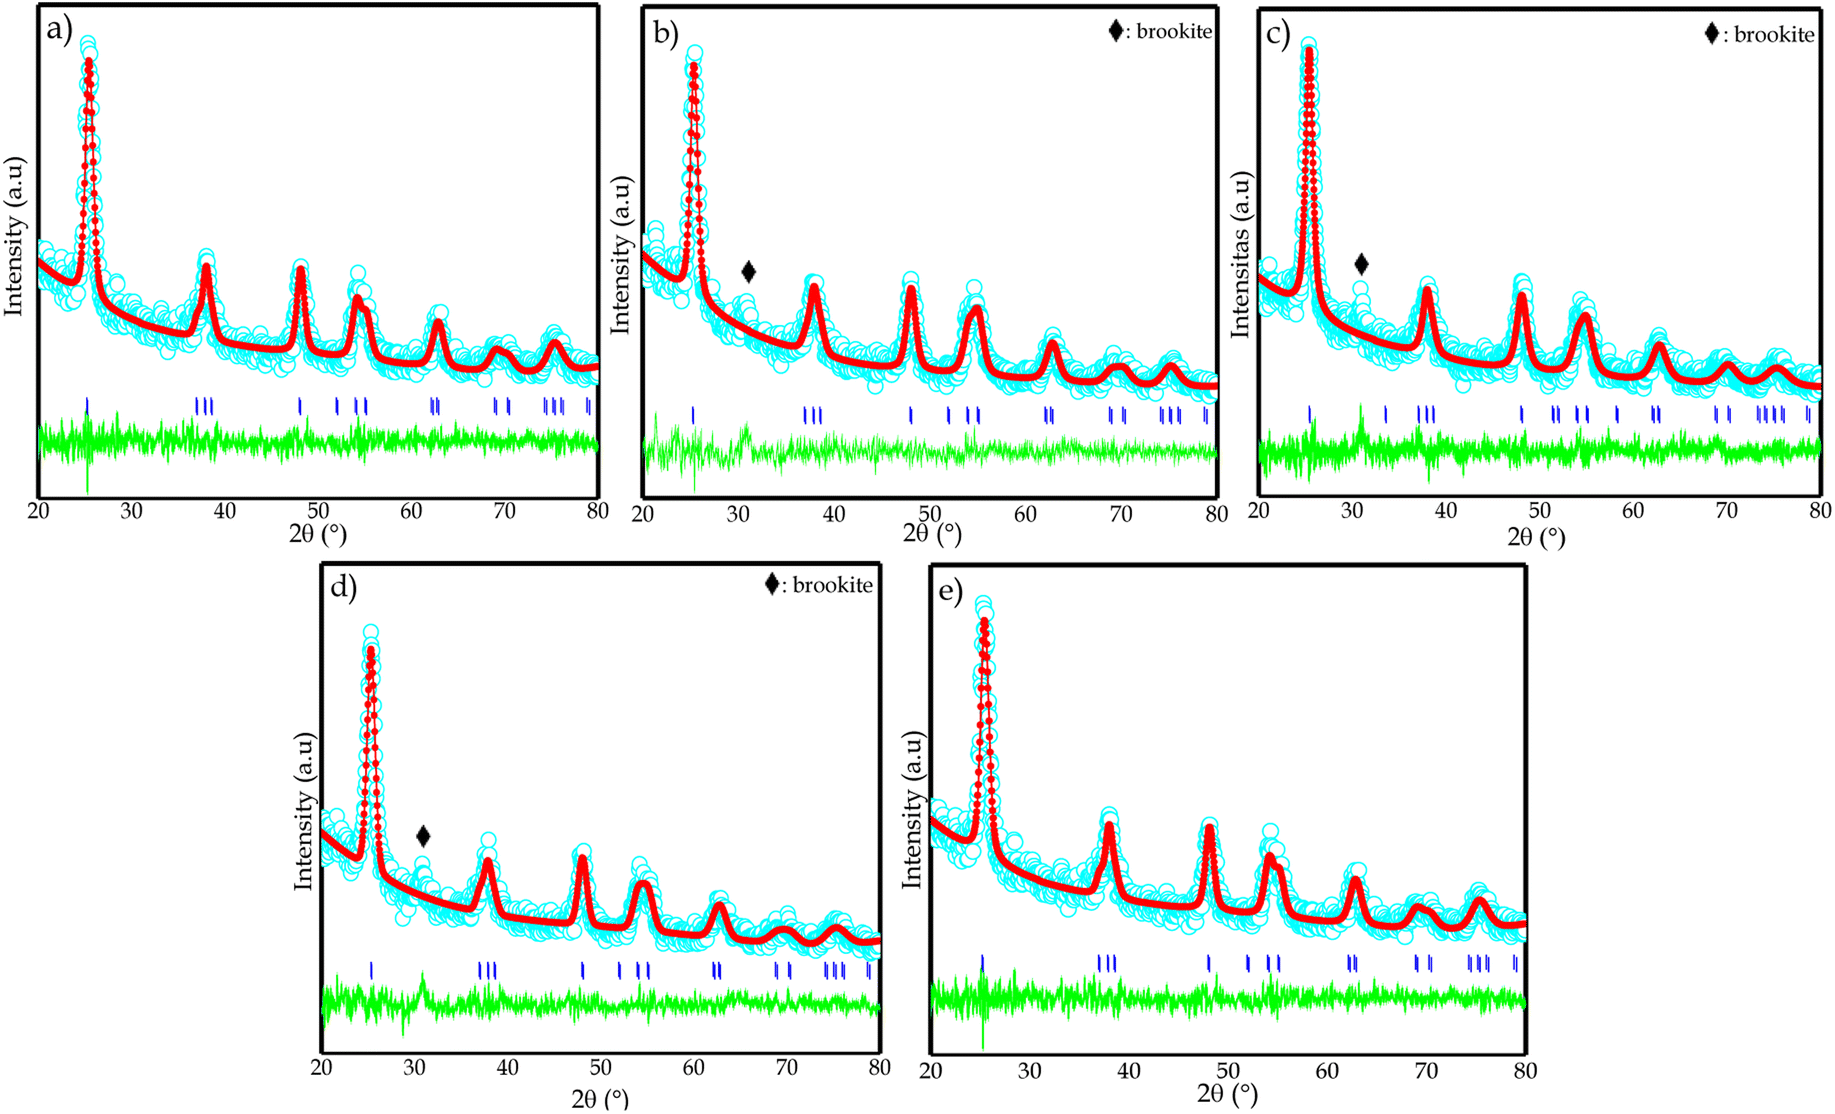 | ||
| Fig. 6 Le Bail plot of samples: (a) CTO, (b) NCT0.25, (c) NCT0.5, (d) NCT0.75, and (e) NCT1 based on XRD data with space group I41/amdS. | ||
| Parameters | CTO | NCT0.25 | NCT0.5 | NCT0.75 | NCT1 |
|---|---|---|---|---|---|
| Space group | I41/amdS | I41/amdS | I41/amdS | I41/amdS | I41/amdS |
| Crystal system | Tetragonal | Tetragonal | Tetragonal | Tetragonal | Tetragonal |
| Asymmetric unit (Z) | 4 | 4 | 4 | 4 | 4 |
| a (Å) | 3.7786 | 3.7866 | 3.8024 | 3.7915 | 3.7791 |
| b (Å) | 3.7786 | 3.7866 | 3.8024 | 3.7915 | 3.7791 |
| c (Å) | 9.4693 | 9.4957 | 9.5385 | 9.5104 | 9.4703 |
| V (Å3) | 135.2034 | 136.1571 | 137.9071 | 136.7159 | 135.2512 |
| Rp (%) | 7.53 | 7.33 | 7.49 | 7.56 | 7.52 |
| Rwp (%) | 7.02 | 6.62 | 10.29 | 6.36 | 7.02 |
| GoF (χ2) | 0.1916 | 0.227 | 0.9562 | 0.1725 | 0.1916 |
Table 2 demonstrates that undoped TiO2 with N-doped TiO2 does not change its structure, such as space group, crystal lattice, and asymmetry. The magnification of the peak with the highest intensity indicates that the peak shift occurs due to the lattice tension on the crystal size. It can be seen that adding nitrogen dopants causes an increase in the values of lattice parameters: a, b, and c, as well as cell volume. The increase in cell volume was caused by the doping of nitrogen (1.46 Å) which has a larger atomic radius than oxygen (1.40 Å). So, the position of the oxygen atom can be occupied by nitrogen increasing the crystal lattice and hence the cell volume. The increase in cell volume after doping with nitrogen indicates that nitrogen was doped on the TiO2 lattice. It also confirms the peak shift in the XRD pattern toward a smaller 2θ.33,35
DRS UV-Vis analysis
By UV-Vis DRS characterization, the absorption of light energy and the optical properties of nitrogen-doped TiO2 nanoparticles were investigated. Fig. 7 displays the absorption intensity of the control TiO2 sample (CTO) occurring in the UV light region at a wavelength <400 nm. However, all nitrogen-doped TiO2 catalysts showed a shift in absorption intensity to the visible region of ∼410 nm, confirming the successful doping. This result is supported by a report from Dong et al. (2018) stating that adding nitrogen dopant can shift the absorption intensity of TiO2 to the visible light region.36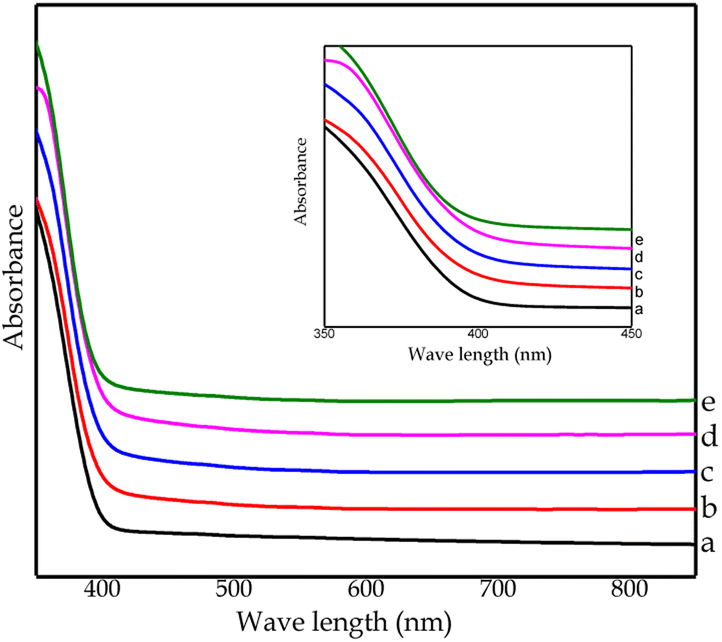 | ||
| Fig. 7 DRS UV-Vis spectrum of all samples: (a) CTO, (b) NCT0.25, (c) NCT0.5, (d) NCT0.75, and (e) NCT1. | ||
Based on the results of DRS UV-Vis, the band gap energy for each sample can be calculated using the Tauc plot method, as shown in Fig. 8. In this study, the control TiO2 sample (CTO) had an energy gap of 3.2 eV. After doping using nitrogen, there was a decrease in the energy gap for samples NCT0.25, NCT0.5, and NCT0.75 by 3.16 eV, 3.15 eV, and 3.14 eV, respectively. However, the NCT1 sample experienced an increase in the energy gap to 3.16 eV. It is possible that the NCT1 sample had a change in crystal structure and composition due to the influence of adding excess nitrogen dopant.16
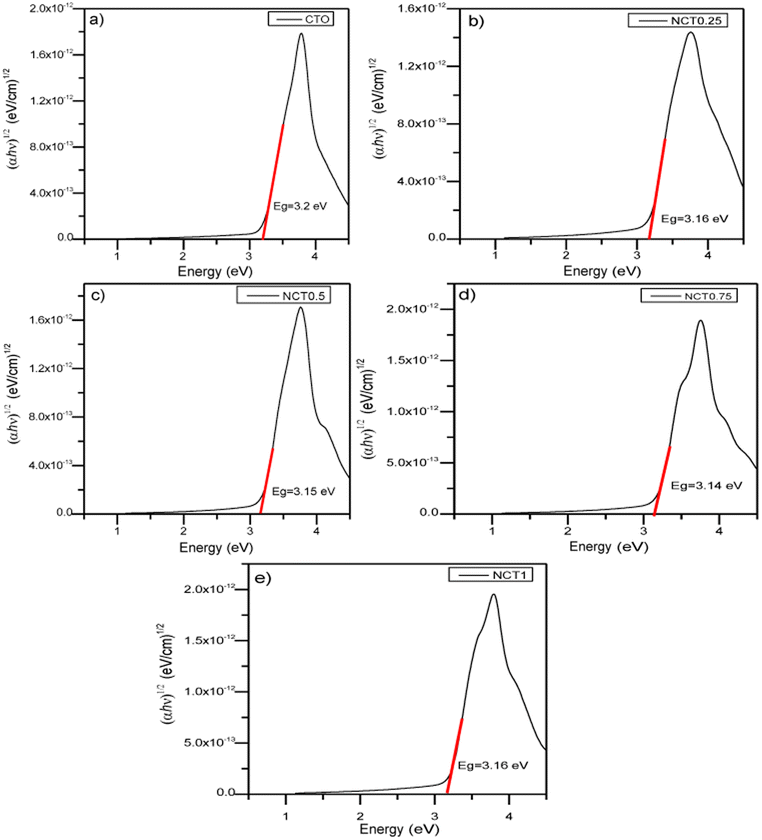 | ||
| Fig. 8 Band gap energy of all samples: (a) CTO, (b) NCT0.25, (c) NCT0.5, (d) NCT0.75, and (e) NCT1. | ||
The most optimum sample synthesized in this study was NCT0.75 with the band gap energy of 3.14 eV, the lowest achieved value. The decrease in the gap energy as the result of nitrogen doping proves the successful doping of nitrogen on TiO2. It was confirmed that nitrogen dopant contributes to the narrowing of the band gap of the photocatalyst by forming a new N 2p band between the O 2p and Ti 3d orbitals in the valence band of the TiO2 electronic structure. Photons can trigger the transfer of electrons from the valence band to the conduction band by absorbing energy in the visible region corresponding to the lower band gap energy.7
FTIR analysis
FTIR characterization was employed to detect bond vibrations or interactions in the formation of porous N-doped TiO2. Measurements were made in the range of 400–4000 cm−1. The FTIR spectra of undoped TiO2 and nitrogen-doped TiO2 samples are shown in Fig. 9. Also, the identification of the FTIR vibration types is tabulated in Table 3. The spectra of the N-doped TiO2 sample without CTAB (NTi0.75) had the same pattern as those of the TiO2 and N-doped TiO2 using CTAB (CTO and NCT0.75). This is because all samples underwent a calcination process, so no peaks indicated the presence of CTAB in the samples. The calcination process causes the breaking of many bonds of organic compounds, such as CTAB, followed by decomposition.37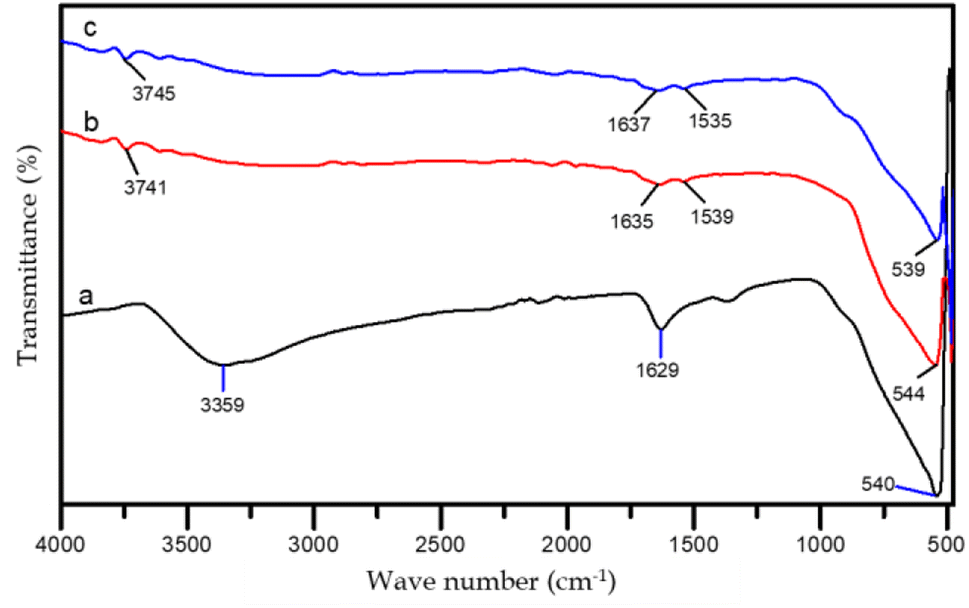 | ||
| Fig. 9 FTIR spectrum of samples: (a) CTO, (b) NCT0.75, and (c) NTi0.75. | ||
| Wave number (cm−1) | Vibration type | ||
|---|---|---|---|
| CTO | NCT0.75 | NTi0.75 | |
| 3359 | 3741 | 3745 | Strain vibration of O–H |
| 1629 | 1635 | 1637 | Bending vibration of O–H |
| — | 1539 | 1535 | Vibration of N–H |
| 540 | 544 | 539 | Vibration of Ti–O, Ti–O–Ti, dan Ti–N |
Nitrogen-doped TiO2 samples (NCT0.75 and NTi0.75) showed absorption peaks in the region of 1530–1640 cm−1 while the TiO2 spectra without doping (CTO) only exhibited absorption peaks in the region of 1629 cm−1. The absorption peaks at 1539 cm−1 and 1535 cm−1 corresponded Ti–N bonds caused by NH2 vibrations indicating that nitrogen was doped to the titanium metal center. In Fig. 9a, the FTIR spectra indicate a wide band at wavenumbers 3350–3750 cm−1, which is an O–H strain vibration adsorbed on the surface. The absorption peak also appears at wave number 1629 cm−1, which is a bending vibration of dissociated O–H or water molecules adsorbed on the surface of TiO2 and the presence of N–H bonds.38 Fig. 9b and c illustrate that the resulting absorption bands are smaller due to the evaporation of the hydroxyl groups and water during the calcination and hydrothermal processes.39 The TiO2 spectra had broad absorption peaks in the range of wavenumbers between 400 and 800 cm−1 indicating strong strain vibrations of the Ti–O and Ti–O–Ti bonds in N-doped TiO2 and TiO2.33,40 Wavenumber 505.31–680.83 cm−1 is a characteristic of Ti–N bond vibrations.32
Surface area analyzer (SSA) analysis
SAA characterization was used to measure pore size (cc/g), specific surface area (m2 g−1), and pore diameter (D) in N-doped TiO2 samples with the addition of CTAB and N-doped TiO2 without the addition of synthesized CTAB.41 The surface area and porosity of the N-doped TiO2 sample with and without the addition of CTAB were investigated through the nitrogen adsorption–desorption isotherm shown in Fig. 10. The adsorption–desorption isotherms shown in Fig. 10a and b illustrate the type IV isotherm which is a characteristic of mesoporous materials. Based on the data in Table 4, it is shown that the specific surface area of the NCT0.75 sample (95.02 m2 g−1) is larger compared to that of the NTi0.75 sample, which is 90.97 m2 g−1. The resulting pore sizes of the NCT0.75 and NTi0.75 samples were 8.021 nm and 5.161 nm, respectively. It is proven that the synthesized material had pores with mesoporous sizes because of having pores in the size range of 2 to 50 nm. The NCT0.75 sample had a higher specific surface area than the NTi0.75 sample. This proves that adding CTAB played a role as a pore-forming agent in the sample to increase the specific surface area of the sample and its photocatalytic activity.16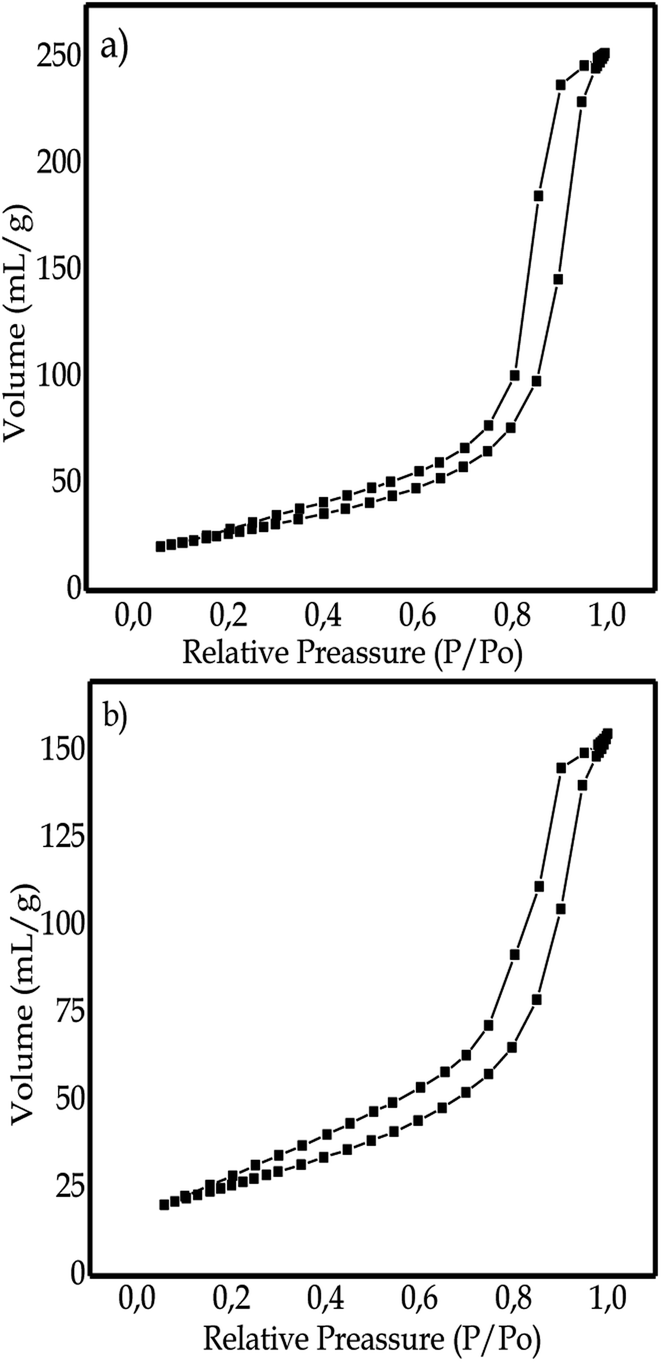 | ||
| Fig. 10 BET isotherm curve of samples: (a) NCT0.75, (b) NTi0.75. | ||
| No. | Sample | Specific surface area (m2 g−1) | Pore diameter (nm) | Pore volume (mL g−1) |
|---|---|---|---|---|
| 1 | N-doped TiO2 with CTAB (NCT0.75) | 95.02 | 8.021 | 0.3902 |
| 2 | N-doped TiO2 without CTAB (NTi0.75) | 90.97 | 5.161 | 0.2398 |
Porous materials with a large specific surface area have not maximized the photocatalytic activity of TiO2. Li, Xiao et al.19 synthesized mesoporous TiO2 spheres by further modifying nitrogen doping with the addition of CTAB as a pore-forming agent, resulting in a porous material that has a high specific surface area, homogeneous, uniform, and high concentration to enhance TiO2 photocatalytic activity in degrading pollutants. The relatively high specific surface area of the porous N-doped TiO2 can facilitate the diffusion of reactant molecules and offer more active sites for adsorption so that the photocatalytic process is more efficient.
So that it can be confirmed that the photocatalytic activity can be increased due to 2 factors: firstly the addition of a pore-forming agent (CTAB) to produce many and uniform pores, thus increasing the specific surface area of the porous N-doped TiO2 sample, and secondly doping using nitrogen to reduce the bandgap energy TiO2. Therefore, TiO2 is able to optimize its performance as a photocatalyst with a dual role of adsorption and photodegradation as well.
Based on Fig. 11, it can be explained that there was an interaction between TiO2 and surfactants. The surfactant forms a micelle to reduce surface tension. The positively-charged TiO2 material interacts electrostatically through O+ ions on H2O+ bound to the surface of TiO2 with Br− ions which are the hydrophilic part of CTAB.42 In the hydrothermal process, a crystallization process undergoes structural rearrangement due to heating to form a crystal core. At this stage, crystal growth occurs. In the next stage, calcination takes place with the purpose of decomposing the surfactants remaining in the pore material. The calcination in this study occurred at the temperature of 500 °C for 1 h which was much higher than the CTAB thermal decomposition temperature (300 °C). The calcination is expected to decompose the CTAB surfactant into O2, CO2, and H2O gases to leave open pores with a size matching the size of the surfactant.43
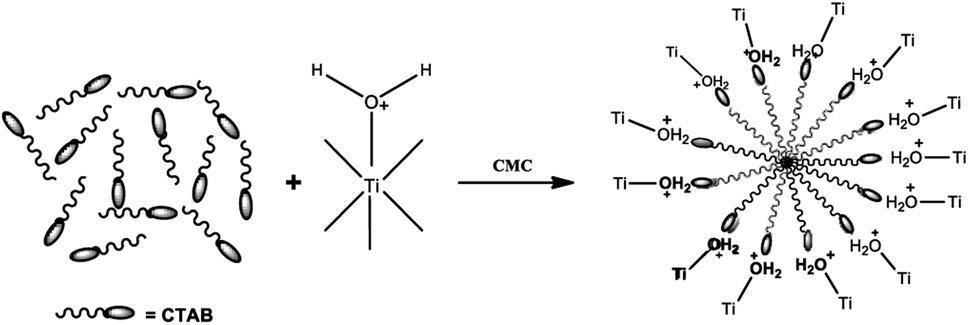 | ||
| Fig. 11 Interaction between TiO2 and CTAB on micelle formation.42 | ||
Photocatalytic activity test
The synthesized N-doped TiO2 sample with the addition of CTAB (NCT0.75) and control TiO2 (CTO) were tested for a photocatalytic activity to reduce 10 mg L−1 of Cr(VI) metal ions irradiated under a 24 watt LED lamp with different irradiation times of 0 min and 240 min. The Cr(VI) solution was prepared under acidic conditions until the pH reached 2. This is because the lower the pH, the higher the concentration of H+ ions. It is known from the overall Cr(VI) reduction reaction equation that protons (H+) are needed in this process. Therefore, with an increase in the number/availability of protons, the equilibrium shifts to the right, and the rate of the Cr(VI) reduction reaction increases.44The photocatalytic test was initiated with adsorption–desorption equilibrium in the dark for 210 min to observe the adsorption/absorption effect of the catalyst on the Cr(VI) solution. The metal ion Cr(VI) has a specific complexing reagent used in quantitative analysis, namely 1,5-diphenylcarbazide. The Cr–diphenylcarbazide complex produces a purplish pink color, the complementary color of the color absorbed by the complex. The color of a complex is caused by the transition of electrons from the ground state to a higher energy level. When the electron transition requires radiation in the visible light range, the color of the complex changes. Transition in this complexing reaction occurs with a charge transfer between metal to ligand and ligand to metal. The reaction can be seen in Fig. 12. The absorbance of the complex solution was measured at a wavelength of 543 nm using a UV-Vis spectrophotometer.45
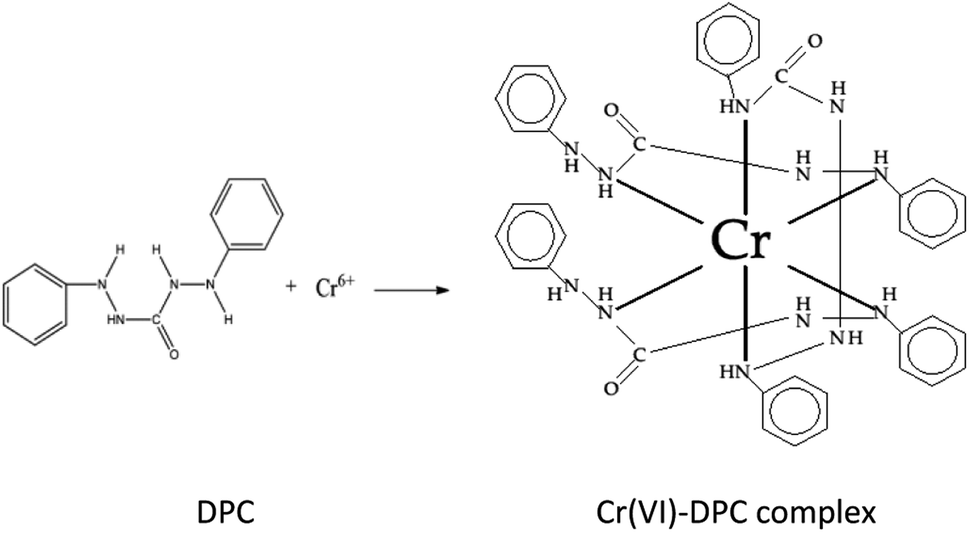 | ||
| Fig. 12 Complexing reaction of 1,5-diphenyl carbazide with Cr(VI) ion.46 | ||
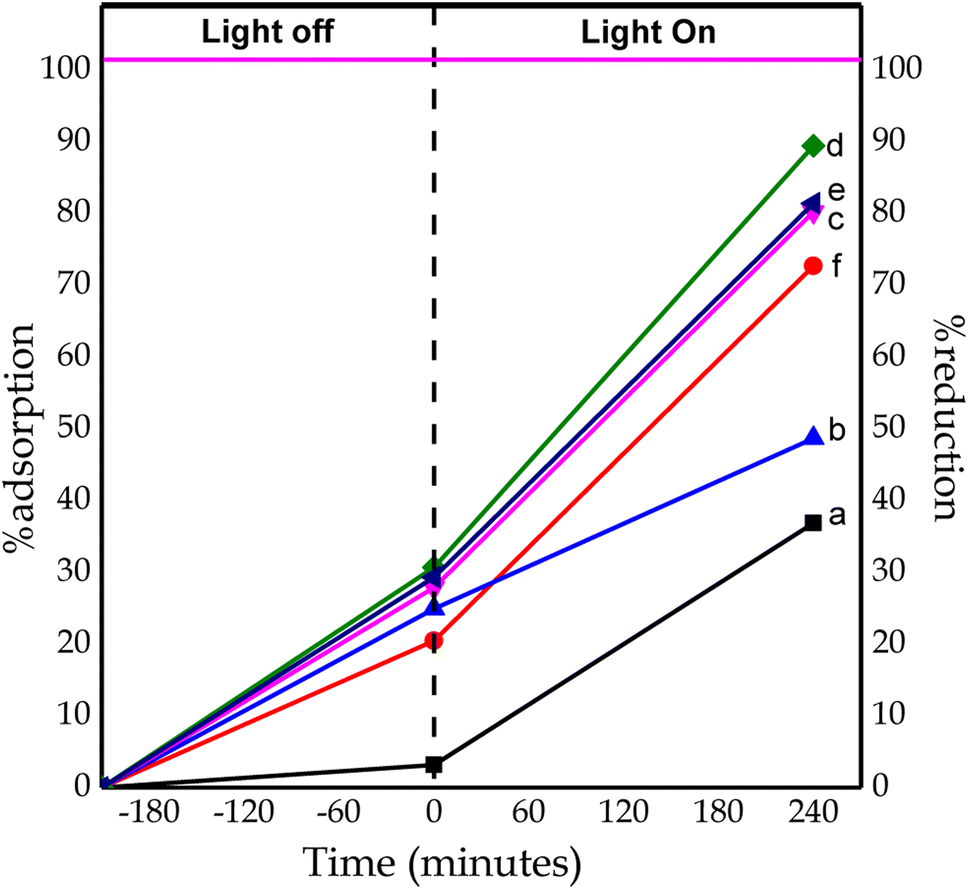
The photocatalytic test results in Fig. 13 compare the adsorption and reduction percentages of Cr(VI) for each catalyst at the 0th and 240th minute of irradiation. The percentage reduction of Cr(VI) ions from CTO, NCT0.25, NCT0.5, NCT0.75, NCT1, and NTi0.75 after 240 minutes of irradiation were 36.89%, 48.68%, 80.22%, 89, 42%, 81.38%, and 72.66%. The adsorption ability of the samples CTO, NCT0.25, NCT0.5, NCT0.75, NCT1, and NTi0.75 was 3.19%, 24.91%, 27.86%, 30, 66%, 29.3%, and 20.47%, respectively, for 210 minutes in the dark.
 | ||
| Fig. 13 Percentage of adsorption and reduction of Cr(VI) ions by catalysts: (a) CTO, (b) NCT0.25, (c) NCT0.5, (d) NCT0.75, (e) NCT1, and (f) NTi0.75. | ||
It can be seen from Fig. 13 NCT0.75 had the most optimum percentage of adsorption and reduction due to the addition of nitrogen dopants with the optimum volume of 0.75 mL. Modification using nitrogen dopants can narrow the TiO2 band gap. So, excited electrons from the valence band can be accepted by nitrogen above the valence band, which is then transferred to the conduction band with lower energy absorption. This can effectively inhibit the occurrence of photoexcited holes and also reduce electron–hole recombination. So it can increase the photocatalytic activity of TiO2.47 However, the nitrogen volume above 1 mL decreases the photocatalytic activity. This is because the higher volume of added dopant nitrogen beyond its optimum limit resulted in a partial covering of the TiO2 surface where the Cr(VI) reduction reaction occurred, thereby increasing the chances of electron–hole recombination during the photocatalytic process.44 As a result, the photocatalytic activity of Cr(VI) reduction decreased. In addition, the high percentage of photocatalytic activity in the NCT0.75 sample was caused by the formed anatase/brookite TiO2 heterostructured material, which was able to inhibit the rate of electron–hole recombination to extend the lifetime of a photocatalyst. This was associated with the synergistic effect of combining anatase and brookite TiO2 semiconductors affecting the increase in photocatalyst activity.48,49
In Fig. 14, it can be seen that electrons were able to move from the TiO2 brookite conduction band to the conduction band of TiO2 anatase. In contrast, h+ was able to move from the valence band of TiO2 anatase to the valence band of TiO2 brookite resulting in a high separation efficiency of electron–hole pairs. The anatase/brookite TiO2 heterojunction material had a high interfacial area, so the efficiency of separating electron–hole pairs and the photocatalytic activity increases.50
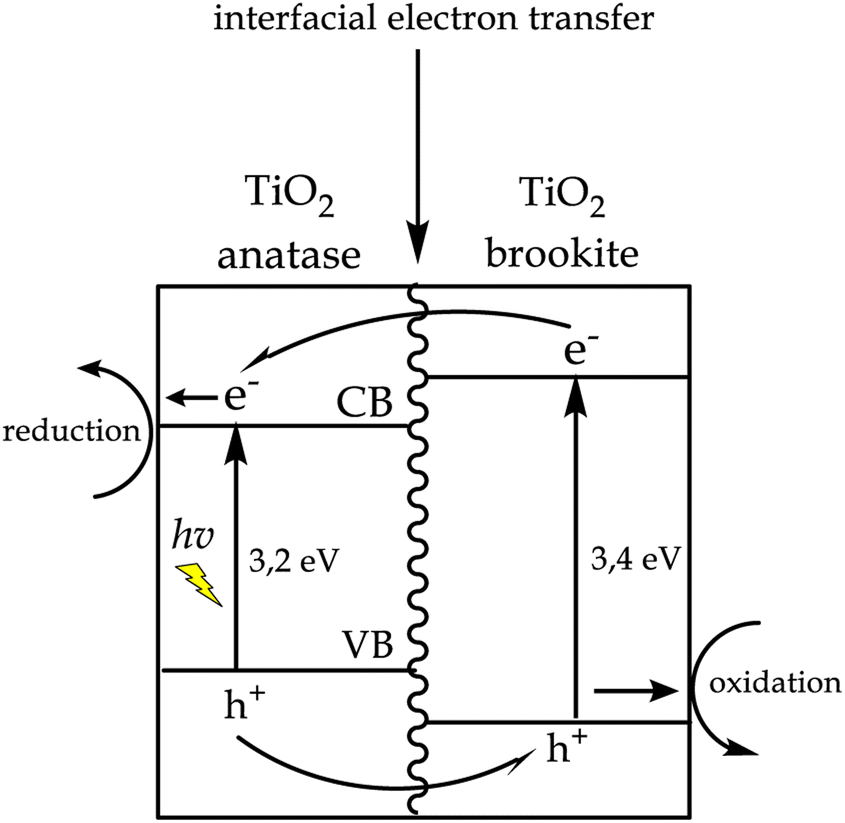 | ||
| Fig. 14 Charge transfer scheme at anatase/brookite TiO2 heterojunction. | ||
The increase in photocatalytic activity could also be influenced by adsorption factors, namely by adding CTAB as a pore-forming agent. The pores formed in the sample function as adsorbents that could reduce the concentration of the heavy metal Cr(VI). So the photocatalytic activity increased.8 It can be seen from the results of this study that the NCT0.75 sample had a higher reduction percentage (89.42%) compared to that of the NTi0.75 sample (72.66%). The difference between these two samples was due to adding CTAB to N-doped TiO2. Research by Li Hongliang et al. (2016) stated that CTAB added-TiO2 samples provided the highest photocatalytic percentage compared to that of other samples. This was attributed to the addition of CTAB as a pore-forming agent, which could increase the surface area of the sample.8
The percentage reduction increased with increasing irradiation time. By increasing the irradiation time, the catalyst receives light for a longer time, followed by generating more electrons. The resulting electrons play a role in the reduction reaction of Cr(VI). The overall reactions are as follows:
| TiO2 + hν → TiO2 (h+ + e−) | (1) |
| Cr2O72− + 14H+ + 6e− → 2Cr3+ + 7H2O | (2) |
| 2H2O + 4h+ → O2 + 4H + | (3) |
| O2 + 2H+ + TiO2 (2e−) → H2O2 | (4) |
| Cr2O72− + 3H2O2 + 8H+ → 2Cr3+ + 3O2 + 7H2O | (5) |
Conclusions
According to the results, it can be concluded that the porous N-doped TiO2 photocatalyst was successfully synthesized using the green synthesis-hydrothermal method. Adding CTAB as a pore-forming agent to the photocatalyst gave mesoporous structures with pore sizes ranging from 5–8 nm. It also increased the specific surface area of N-doped TiO2, namely 90–95 m2 g−1. The morphology of the synthesized TiO2 nanoparticles was spherical/spherical, with a size distribution of 10–30 nm. The NCT0.75 photocatalyst with the addition of 0.75 mL nitrogen dopants was the most optimum dopant because of having the best photocatalytic activity in reducing Cr(VI) heavy metal ions with a reduction percentage of 89.42% and an adsorption percentage of 30.66%. The porous N-doped TiO2 photocatalyst had the optimal photocatalytic activity in the presence of CTAB. So it exhibited a dual role of adsorption and photoreduction of Cr(VI) heavy metal ions. The photocatalytic activity was increased by adding various nitrogen dopants in porous TiO2. The percentage reduction of Cr(VI) ions from CTO, NCT0.25, NCT0.5, NCT0.75, NCT1, and NTi0.75 after 240 minutes of irradiation were 36.89%, 48.68%, 80.22%, 89, 42%, 81.38%, and 72.66%, respectively.Author contributions
Conceptualization: D. V. W.; investigation: A. S.; methodology: D. V. W., Y. E. P.; supervision: D. V. W., Y. E. P.; visualization: A. S.; writing-original draft: D. V. W., A. S.; writing-review & editing: M.Conflicts of interest
There are no conflicts to declare.Acknowledgements
DVW would like to acknowledge Faculty of Mathematics and Natural Sciences, Universitas Andalas for the research funding with contract number 18/UN.16.03.D/PP/FMIPA/2022.Notes and references
- A. A. Bachri and E. Normelani, FDI, income, and environmental pollution in Indonesia, International Journal of Energy Economics and Policy, 2020, 10, 383–389 CrossRef.
- X. F. Lei, Z. N. Zhang, Z. X. Wu, Y. J. Piao, C. Chen, X. Li, X. X. Xue and H. Yang, Synthesis and characterization of Fe, N and C tri-doped polymorphic TiO2 and the visible light photocatalytic reduction of Cr(VI), Sep. Purif. Technol., 2017, 174, 66–74 CrossRef CAS.
- A. Villabona-Ortíz, C. N. Tejada-Tovar and R. Ortega-Toro, Modelling of the adsorption kinetics of chromium(VI) using waste biomaterials, Rev. Mex. Ing. Quim., 2020, 19, 401–408 Search PubMed.
- A. D. Mani, et al., Facile synthesis of efficient visible active C-doped TiO2 nanomaterials with high surface area for the simultaneous removal of phenol and Cr(VI), Mater. Res. Bull., 2015, 61, 391–399 CrossRef CAS.
- A. Mohamed, et al., Visible light photocatalytic reduction of Cr(VI) by surface modified CNT/titanium dioxide composites nanofibers, J. Mol. Catal. A: Chem., 2016, 424, 45–53 CrossRef CAS.
- G. Li, et al., Synthesis of N-doped TiO2 with good photocatalytic property, Phys. B, 2020, 588, 412184 CrossRef CAS.
- D. V. Wellia, D. Nofebriani, N. Pratiwi and S. Safni, Synthesis of Porous N-doped TiO2 by Using Peroxo Sol-Gel Method for Photocatalytic Reduction of Cd(II), Bull. Chem. React. Eng. Catal., 2022, 17, 103–112 CrossRef CAS.
- H. Li, et al., Synthesis and characterization of N-doped porous TiO2 hollow spheres and their photocatalytic and optical properties, Materials, 2016, 9, 849 CrossRef PubMed.
- A. H. Mamaghani, F. Haghighat and C. S. Lee, Hydrothermal/solvothermal synthesis and treatment of TiO2 for photocatalytic degradation of air pollutants: preparation, characterization, properties, and performance, Chemosphere, 2019, 219, 804–825 CrossRef CAS PubMed.
- B. Bejaoui, I. Bouchmila, K. Nefzi, I. B. Slimen, S. Koumbad, P. Martin, N. Joly and N. M'Hamdi, Nanostructured Titanium Dioxide (NS-TiO2), Updates on Titanium Dioxide, 2023, 34, 4–5 Search PubMed.
- N. Seman, et al., Preparation Method of Titanium Dioxide Nanoparticles and Its Application: An Update, IOP Conference Series: Earth and Environmental Science, 2022, 1091, 012064 Search PubMed.
- M. Aravind, M. Amalanathan and M. S. M. Mary, Synthesis of TiO2 nanoparticles by chemical and green synthesis methods and their multifaceted properties, SN Appl. Sci., 2021, 3, 1–10 Search PubMed.
- I. C. Maurya, S. Singh, S. Senapati, P. Srivastava and L. Bahadur, Green synthesis of TiO2 nanoparticles using Bixa orellana seed extract and its application for solar cells, Sol. Energy, 2019, 194, 952–958 CrossRef CAS.
- S. Kumar, A. Yadav, M. Yadav and J. P. Yadav, Effect of climate change on phytochemical diversity, total phenolic content and in vitro antioxidant activity of Aloe vera (L.) Burm. f., BMC Res. Notes, 2017, 10, 1–12 CrossRef PubMed.
- A. K. Sidhu, N. Verma and P. Kaushal, Role of Biogenic Capping Agents in the Synthesis of Metallic Nanoparticles and Evaluation of Their Therapeutic Potential, Front. Nanotechnol., 2022, 3, 1–17 Search PubMed.
- E. D. Toe, W. Kurniawan, E. G. Mariquit and H. Hinode, Synthesis of N-doped mesoporous TiO2 by facile one-step solvothermal process for visible light photocatalytic degradation of organic pollutant, J. Environ. Chem. Eng., 2018, 6, 5125–5134 CrossRef CAS.
- Y. E. Putri, R. Najela, N. Andriani and D. Wellia, SrTiO3 Nanokubus: Sintesis, Kontrol Morfologi dan Sifat Termoelektrik (Tinjauan), Jurnal Akta Kimia Indonesia, 2021, 6, 83 CrossRef.
- A. F. Syuadi, Sintesis Nanopartikel Titanium Oksida menggunakan Ekstrak Kulit Aloe vera (L.) Burm. f. dan Karakterisasinya, Andalas University, 2021 Search PubMed.
- X. Li, P. Liu, Y. Mao, M. Xing and J. Zhang, Preparation of homogeneous nitrogen-doped mesoporous TiO2 spheres with enhanced visible-light photocatalysis, Appl. Catal., B, 2015, 164, 352–359 CrossRef CAS.
- D. V. Wellia, D. Fitria and S. Safni, C-N-Codoped TiO2 Synthesis by using Peroxo Sol Gel Method for Photocatalytic Reduction of Cr(VI), J. Pure Appl. Chem. Res., 2018, 7, 26–32 CrossRef.
- R. d. Mourisa, Uji Daya Hambat Ekstrak Kulit Lidah Buaya (Aloe Barbadensis Miller) Terhadap Bakteri E. coli, Jurnal Ilmiah Maksitek, 2020, 5, 1689–1699 Search PubMed.
- A. Michalak, Phenolic compounds and their antioxidant activity in plants growing under heavy metal stress, Pol. J. Environ. Stud., 2006, 15, 523–530 CAS.
- V. V. Makarov, et al., “Green” Nanotechnologies: Synthesis of Metal Nanoparticles Using Plants, Acta Naturae, 2014, 6, 35–44 CrossRef CAS PubMed.
- D. S. N. Ichsani and C. Kusumawardani, Sol-Gel Synthesis and Characterization of Carbon doped TiO2 Based on Solanum Tuberosum Starch, Indonesian Journal of Chemistry and Environment, 2022, 4, 65–72 CrossRef.
- L. J. Kusumawardani and Y. Syahputri, Study of structural and optical properties of Fe(III)-doped TiO2 prepared by sol-gel method, IOP Conference Series: Earth and Environmental Science, 2019, 299, 012066 Search PubMed.
- Y. Bao, T. Wang, Q. Kang, C. Shi and J. Ma, Micelle-template synthesis of hollow silica spheres for improving water vapor permeability of waterborne polyurethane membrane, Sci. Rep., 2017, 7, 1–14 CrossRef PubMed.
- K. Kalantari, M. Kalbasi, M. Sohrabi and S. J. Royaee, Synthesis and characterization of N-doped TiO2 nanoparticles and their application in photocatalytic oxidation of dibenzothiophene under visible light, Ceram. Int., 2016, 42, 14834–14842 CrossRef CAS.
- M. F. Gazulla, M. Rodrigo, E. Blasco and M. Orduña, Nitrogen determination by SEM-EDS and elemental analysis, X-Ray Spectrom., 2013, 42, 394–401 CrossRef CAS.
- M. Thacker, Y. N. Chen, C. P. Lin and F. H. Lin, Nitrogen-doped titanium dioxide mixed with calcium peroxide and methylcellulose for dental bleaching under visible light activation, Int. J. Mol. Sci., 2021, 22, 3759 CrossRef CAS PubMed.
- J. Jin, S. Chen, J. Wang, C. Chen and T. Peng, One-pot hydrothermal preparation of PbO-decorated brookite/anatase TiO2 composites with remarkably enhanced CO2 photoreduction activity, Appl. Catal., B, 2020, 263, 118353 CrossRef CAS.
- Y. Cao, et al., Highly photocatalytic activity of brookite/rutile TiO2 nanocrystals with semi-embedded structure, Appl. Catal., B, 2016, 180, 551–558 CrossRef CAS.
- A. R. Putra Hidayat, V. R. Andina, A. Ahnaf, N. Widiastuti and R. M. Iqbal, Synthesis, Characterization, and Performance of TiO2-N as Filler in Polyethersulfone Membranes for Laundry Waste Treatment, Jurnal Sains & Seni ITS, 2019, 8, 2337–3520 Search PubMed.
- T. T. Khan, et al., Synthesis of N-doped TiO2 for efficient photocatalytic degradation of atmospheric NOx, Catalysts, 2021, 11, 1–13 Search PubMed.
- J. Andrieux, B. Gardiola and O. Dezellus, Synthesis of Ti matrix composites reinforced with TiC particles: in situ synchrotron X-ray diffraction and modeling, J. Mater. Sci., 2018, 53, 9533–9544 CrossRef CAS.
- T. P. Wendari, et al., Structure-property relationships in the lanthanide-substituted PbBi2Nb2O9 Aurivillius phase synthesized by the molten salt method, J. Alloys Compd., 2021, 860, 158440 CrossRef CAS.
- Y. Dong, et al., Graphdiyne-hybridized N-doped TiO2 nanosheets for enhanced visible light photocatalytic activity, J. Mater. Sci., 2018, 53, 8921–8932 CrossRef CAS.
- R. N. Sari, N. Nurhasni and M. A. Yaqin, Green Synthesis Nanoparticle ZnO Sargassum sp. Extract and the Products Charactheristic, Jurnal Pengolahan Hasil Perikanan Indonesia, 2017, 20, 238 CrossRef.
- X. Cheng, X. Yu and Z. Xing, Characterization and mechanism analysis of N doped TiO2 with visible light response and its enhanced visible activity, Appl. Surf. Sci., 2012, 258, 3244–3248 CrossRef CAS.
- R. T. Rasheed, Preparation and Characterization of TiO2 Nanostructure by TiCl4 Hydrolysis with Additive NaOH, Al-Mustansiriyah Journal of Science, 2018, 28, 100–107 CrossRef.
- N. T. Nolan, et al., Effect of N-doping on the photocatalytic activity of sol-gel TiO2, J. Hazard. Mater., 2012, 211–212, 88–94 CrossRef CAS PubMed.
- K. S. W. Sing, et al., Reporting Physisorption Data for Gas/Solid Systems with Special Reference to the Determination of Surface Area and Porosity, Pure Appl. Chem., 1985, 57, 603–619 CrossRef CAS.
- L. H. Kao, T. C. Hsu and K. K. Cheng, Novel synthesis of high-surface-area ordered mesoporous TiO2 with anatase framework for photocatalytic applications, J. Colloid Interface Sci., 2010, 341, 359–365 CrossRef CAS PubMed.
- B. T. Dipowardani, S. Sriatun and T. Taslimah, Sintesis Silika Kristalin Menggunakan Surfaktan Cetiltrimetilamonium Bromida (CTAB) dan Trimetilamonium Klorida (TMACl) sebagai Pencetak Pori, Jurnal Kimia Sains dan Aplikasi, 2008, 11, 20–28 CrossRef.
- S. Slamet, R. Syakur and W. Danumulyo, Pengolahan limbah logam berat, Makara, Teknologi, 2003, 7, 27–32 Search PubMed.
- S. Fatimah and A. Haris, Pengaruh Dopan Zink Oksida pada TiO2 terhadap Penurunan Kadar Limbah Fenol dan Cr(VI) secara Simultan dengan Metode Fotokatalisis, Jurnal Kimia Sains dan Aplikasi, 2014, 17, 86–89 CrossRef.
- E. H. Mourid, M. Lakraimi and L. Benaziz, High efficiency of calcined anionic clay to remove the chromate anions CrO42− from polluted water, Fr.-Ukr. J. Chem., 2020, 8, 26–47 CAS.
- M. Shofiyullah, W. Udaibah and I. N. Fitriani, Studi Density Functional Theory (DFT) Pengaruh Co-doping Zn dan N pada TiO2 Anatas, Walisongo Journal of Chemistry, 2020, 3, 92 CrossRef.
- A. N. Illahi, et al., Sintesis dan Karakterisasi Material Fotokatalis Heterojunction Bi4Ti3O12/SrTiO3 dengan Metode Sonikasi, Jurnal Kimia Riset, 2020, 5, 36 CrossRef.
- Q. C. Xu, D. V. Wellia, Y. H. Ng, R. Amal and T. T. Y. Tan, Synthesis of porous and visible-light absorbing Bi2WO6/TiO2 heterojunction films with improved photoelectrochemical and photocatalytic performances, J. Phys. Chem. C, 2011, 115, 7419–7428 CrossRef CAS.
- Sintesis Material Heterojunction Bi4Ti3O12/TiO2 dengan Metode Sonikasi, 2019.
| This journal is © The Royal Society of Chemistry 2023 |