DOI:
10.1039/D3RA03229A
(Paper)
RSC Adv., 2023,
13, 21105-21117
Thermally stable and color-tunable bi-activated (Dy3+/Eu3+) alkaline earth metasilicate phosphor for luminescent devices†
Received
15th May 2023
, Accepted 18th June 2023
First published on 12th July 2023
Abstract
A solid-state reaction methodology has been adopted to synthesize Dy3+ (dysprosium)/Eu3+ (europium) co-activated Na4Ca4Si6O18 (NCMS) phosphors. The structural, morphological, and luminescence characteristics of the prepared materials have been investigated. The phase purity of the material was confirmed by X-ray diffraction (XRD) by comparing the diffraction peaks with the JCPDS standard pattern (JCPDS card no. 75-1687). The photoluminescence (PL) spectra of NCMS phosphors activated with Dy3+ and co-activated with Dy3+ (sensitizer)/Eu3+ (activator) ions were investigated. The as-prepared NCMS phosphors co-activated with Dy3+/Eu3+ ions were excited with near-ultraviolet light (λex = 348 nm) and showed the utmost energy transfer of up to 97.80% from sensitizer to activator. Dexter and Reisfeld's approximation specifically confirms that the energy transfer from sensitizer to activator was through electric dipole–dipole interactions. The Dy3+-activated NCMS phosphor showed an illumination shift from yellow to red by varying the Eu3+ ion concentration and colour tunability is also observed by altering the excitation energy. The emission intensity was sustained up to 92.21% at 423 K (∼150 °C), indicating an excellent thermal stability of the bi-activated NCMS phosphor. The Dy3+/Eu3+ co-doped NCMS phosphors display excellent thermal stability with flexible color tunability to emerge as promising contenders in the field of lighting and display technologies.
1. Introduction
Over the past few decades, inorganic material-based phosphors with extensive optical properties have been investigated for various solid-state lighting applications, such as w-LEDs, multicolour displays, solar cells, and temperature sensors.1–3 Especially focused on w-LEDs, the inorganic luminescent device technology based on these phosphors has replaced incandescent and fluorescent lamps.4,5 Owing to their plethora of merits, including lifespan, high durability, affordability, and environmental friendliness, phosphor-based luminous devices have attracted the attention of researchers.6,7 It is commonly known that commercial w-LEDs are fabricated by coating a yellow emitting YAG:Ce3+ (Ce3+ ion-doped yttrium aluminium garnet) phosphor, with a reasonably broad spectrum, on blue-emitting InGaN LED chip. One such fabricated w-LED shows a deprived value of color rendering index and correlated colour temperature caused by the dearth of red colour emitting components.8–10 In order to achieve sufficient CRI and lower CCT with improved luminous stability, researchers and scientists have turned to an alternative approach in which the suitable amalgamation of an RGB (red: R, green: G, and blue: B) mono phase phosphor onto a UV/n-UV LED has been proposed. Nevertheless, the proclaimed approach is challenging to implement in practice due to the reabsorption of blue emission by the RG phosphor.11,12 The aforementioned glitches to produce white light can be resolved by developing a co-doped monophase phosphor combined with a UV/n-UV LED chip. By transferring energy (sensitizer → activator) in the same host matrix, the single phase white light generating phosphors provide remarkable features, such as appropriate CRI and CCT, spectral tunability, excellent colour reproducibility, and appealing visual perception.13
In contemplation of an efficient single phase phosphor, the adaptation of an appropriate host matrix with suitable dopant ions needs to be investigated. Numerous inorganic oxide host matrices have been explored, holding special redeeming features, such as excellent physical and chemical stability, cost-effectiveness, eco-friendliness, remarkable optical, thermal stability, and facile preparation.14,15 Therefore, the aforementioned characteristics in host matrices, including silicates, vanadates, borates, phosphates, molybdates, niobates, and tungstates, engages researchers in this fascinating field.16 Among the above-listed hosts, silicates have received much attention owing to their significant attributes, such as stable crystal matrix, cost-effective preparation, and excellent chemical and physical stability. Due to these properties, silicates doped with RE3+ (Eu3+, Tb3+, Dy3+ and Tm3+) ions can be employed in diverse applications specified as solar cells, w-LEDs, display devices, optical-thermometry, indoor agricultural lighting, lasers, biosensing, and imaging.17 However, metasilicate hosts exhibit excellent luminescent properties in combination with a small amount of rare earth ions as dopants.18 In the recent era, colour tunable luminescent properties in the phosphor materials can also be achieved via incorporating dual RE ions into the host matrix. Therefore, a suitable combination of dopant ions is indeed the primary necessity to develop the desired phosphor that can be applied to appropriate domains such as display and lighting.19
Among various available RE ions, trivalent dysprosium (Dy3+) is one of the accessible ions, and Dy3+ doped phosphor exhibits three foremost emission peaks in blue (B) and yellow (Y) regions with a feeble peak in the red region. Based on the ratio of emission intensity of two remarkable peaks, i.e., Y/B, white light may be generated with Dy3+ doped phosphor. The white light produced through Dy3+ doped phosphor suffers from lower CRI and higher CCT value due to the inadequacy of the red component in the phosphor. Moreover, taking account of Eu3+ as an activator ion into the Dy3+ activated phosphor can improve the CRI value and results in the tunable white light shifting from cool to warm region.20,21 Therefore, in order to obtain spectral tunability via involving the energy transfer process between Dy3+ and Eu3+, the development of Dy3+/Eu3+ bi-activated inorganic phosphors has been focused in the current research work.
The prime goal of the present article is to acquire a white light emitting single phase phosphor with effective features of colour tunability via varying the wavelength as well as the concentration of activator ions. In the current article, the as-synthesized sodium calcium metasilicate (Na4Ca4Si6O18) phosphors activated with Dy3+ and Dy3+/Eu3+ ions have been synthesized via a well-established solid-state reaction route. Furthermore, structural, morphological, optical, photoluminescence (PL), and decay studies have been performed through distinct characterization techniques to explore the characteristic features of the as-synthesized phosphor. Most importantly, the PL and PL decay studies expand the excitation and emission spectra and also elaborate the energy transfer process between the activator and sensitizer. The thermal stability and colorimetric properties of Na4Ca4Si6O18:Dy3+/Eu3+ phosphor have also been investigated to reveal its practicability in optoelectronic device applications.
2. Material synthesis and characterization techniques
To synthesize sodium calcium metasilicate (Na4Ca4Si6O18) phosphors activated with Dy3+ and Dy3+/Eu3+ ions, a solid-state reaction methodology has been followed. Precursors with high-purity chemicals such as Na2SiO3, CaO, SiO2, Dy2O3, and Eu2O3 have been used in a stoichiometric ratio. The precursors were weighed in an agate mortar and ground for an hour to achieve a perfect homogeneously mixed fine powder. Further, the fine powder was placed into the alumina crucible, which was then kept in the programmable furnace at different temperatures to optimize the calcination temperature. The optimized calcination temperature has been used as 950 °C to synthesize all NCMS samples.22 The samples with 0.0, 1.0, 3.0, 4.0, 5.0, and 6.0 mol% of Dy3+ concentrations in NCMS phosphor are coded as NCMS, ND1, ND3, ND4, ND5, and ND6, respectively. Further, the Eu3+ ion is co-doped with the 5.0 mol% Dy3+ doped NCMS phosphor (optimized) by increasing the Eu3+ concentration from 1.0 mol% to 10.0 mol%, named as NDE1 to NDE10. Moreover, the sample containing 1.0 mol% of Dy3+ and 1.0 mol% of Eu3+ bi-activated NCMS phosphor is denoted as ND1E1.
The structural analysis of undoped, singly Dy3+ doped, and Dy3+/Eu3+ co-doped NCMS phosphors have been performed using Rigaku high resolution X-ray diffractometer (HRXRD) (Model: SmartLab). The field emission scanning electron microscope (FE-SEM) is used to analyse the particle size and morphology of the as-prepared material using NOVA Nano SEM450. The optical band gaps for the as-prepared samples have been recorded via Jasco spectrometer with model no. V-770. The bonding, frequency, and vibrational modes were obtained using PerkinElmer Spectrum Two FT-IR spectrometer. The photoluminescence studies have been accomplished with the xenon lamp established in JASCO FP-8300 spectrofluorometer to record excitation and emission spectra. The decay measurement analysis has been done using the Edinburgh Spectrofluorophotometer (model no. FLS980) employed with a pulsed xenon lamp. Ocean optics spectrophotometer accessories assembled with an optical fibre system were used to determine the thermal stability of the as-synthesized phosphor.
3. Results and discussion
3.1. Phase identification, surface morphology, and optical band gap studies
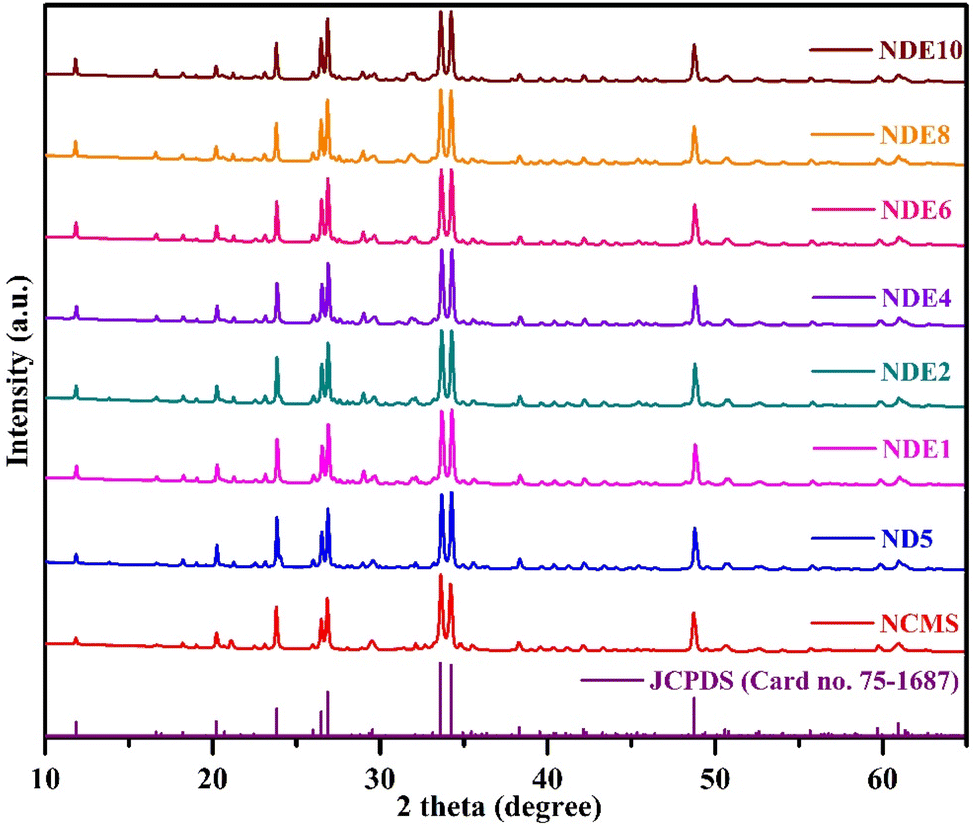
3.1.1. X-ray diffraction. Fig. 1 exhibits the XRD measurements of the NCMS host (undoped) and NCMS phosphors activated with Dy3+ and Dy3+/Eu3+ ions. The diffraction peak profiles of all represented samples are well acceded with the standard XRD pattern (JCPDS card no. 75-1687) and do not reveal any extra peak. The peaks established in the diffraction patterns with the non-appearance of impurity peaks endorse the pure phase of the Na4Ca4Si6O18 host sample. Pure crystalline hexagonal Na4Ca4Si6O18 host is formed with the P32 space group containing V = 1249.42 Å3 along with the value of lattice parameters as a = b = 10.46 Å; c = 13.17 Å.22
 |
| | Fig. 1 XRD patterns of undoped (NCMS), optimized Dy3+ doped (ND5), and Dy3+/Eu3+ co-doped (NDE1, NDE2, NDE4, NDE6, NDE8, and NDE10) NCMS phosphors. | |
XRD profiles of NCMS phosphors activated with Dy3+ and Dy3+/Eu3+ ions agree with standard XRD patterns, which implies that the crystal structure remains the same even after adding dopants. Moreover, ionic radii of both sensitizer (Dy3+: 0.912 Å) and activator (Eu3+: 0.947 Å) ions are close to the ionic radii of Ca2+ (1.00 Å) ion. Therefore, it is expected that both dopants and co-dopants will occupy the Ca2+ site to exhibit superior results without altering the crystal structure. The average crystallite size (Dhkl) of all the prepared NCMS samples was evaluated via the Debye–Scherrer equation below:23
| |
 | (1) |
where
λ designates the incident X-ray wavelength with the value 0.154 nm,
θhkl and
βhkl symbolize Bragg's diffraction angle and full width at half maxima (FWHM) of the represented diffraction peaks.
24 The average crystallite size and other parameters have been computed for all the samples using the above formula and represented in
Table 1.
Table 1 Sample code, average crystallite size, Bragg's angle (θhkl), and FWHM (βhkl) of undoped, Dy3+ doped, and Dy3+/Eu3+ co-doped NCMS phosphors
| Na4Ca4Si6O18:xDy3+/yEu3+ samples |
Sample code |
Average crystallite size (nm) |
θhkl |
βhkl |
| x = 0.0 and y = 0.0 mol% |
NCMS (undoped) |
51.89 |
33.63 |
0.254 |
| 34.21 |
0.241 |
| x = 5.0 and y = 0.0 mol% |
ND5 |
51.20 |
33.63 |
0.209 |
| 34.21 |
0.198 |
| x = 5.0 and y = 1.0 mol% |
NDE1 |
51.10 |
33.63 |
0.221 |
| 34.21 |
0.206 |
| x = 5.0 and y = 2.0 mol% |
NDE2 |
50.28 |
33.63 |
0.221 |
| 34.21 |
0.207 |
| x = 5.0 and y = 4.0 mol% |
NDE4 |
49.34 |
33.63 |
0.216 |
| 34.21 |
0.202 |
| x = 5.0 and y = 6.0 mol% |
NDE6 |
48.19 |
33.63 |
0.221 |
| 34.21 |
0.208 |
| x = 5.0 and y = 8.0 mol% |
NDE8 |
48.01 |
33.63 |
0.213 |
| 34.21 |
0.203 |
| x = 5.0 and y = 10.0 mol% |
NDE10 |
47.37 |
33.63 |
0.220 |
| 34.21 |
0.209 |
The size of undoped and ND5 are 51.89 and 51.20 nm, respectively, and the average crystallite size varies from NDE1 to NDE10 in the range of 51.10 to 47.37 nm after insertion of Eu3+. It can be ascertained that the crystalline size decreases as the concentration of co-dopant ions increases, which implies that the contraction in the lattice may occur via occupying the larger ionic radii site (Ca2+) by smaller ionic radii (Dy3+ & Eu3+) ions.25,26
3.1.2. Morphological analysis with FE-SEM. Surface morphology and particle size of Dy3+/Eu3+ co-doped NCMS phosphor (Dy3+: 5.0 mol% and Eu3+: 1.0 mol%) has been investigated with the help of FE-SEM micrographs, as exhibited in Fig. 2(a) and (b). The FE-SEM images of as-prepared phosphors show agglomerated morphology with irregular shapes, which ascertains that the samples are prepared at a high temperature.27 Fig. 2(a) and (b) represent the micrographs of Dy3+/Eu3+ co-doped NCMS phosphor at 5 and 10 μm resolution. Fig. 2(c) represents the energy dispersive spectrum (EDS) of NCMS:Dy3+/Eu3+ to disclose the elemental presence in the sample.
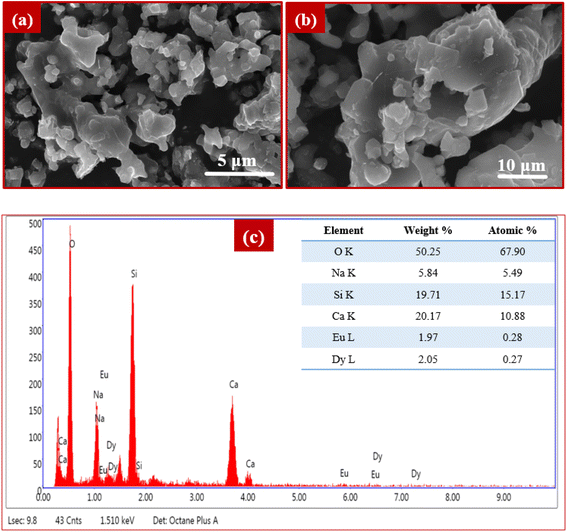 |
| | Fig. 2 (a-b) FE-SEM micrographs of NCMS:Dy3+/Eu3+ phosphor at different resolutions (c) energy dispersive spectrum (EDS). | |
3.1.3. Optical band gap studies. Fig. S1† depicts the band gap of Dy3+/Eu3+ co-doped Na4Ca4Si6O18 phosphors, whereas the inset indicates the diffuse reflectance spectra with the intense reflectance band in the range of 200–300 nm wavelength.28 Samples coded with NDE1 and NDE10 show weak absorption bands positioned at 348 nm and 393 nm that are obtained due to the f–f transition of Dy3+ and Eu3+ ions. Moreover, energy band gap values for NDE1 and NDE10 have been evaluated using Kubelka–Munk (K–M) relation, which is accompanied by the Tauc equation and given as:29| | |
(F(R)hυ) = B(hυ − Eg)n
| (2) |
where Eg denotes the band gap energy, F(R) as the Kubelka–Munk function, h and B are the Planck's constant and proportionality constant, respectively. Moreover, ν is the photon energy, and n denotes the specific values, which ascertain the types of electronic transition. For instance, direct and indirect allowed transitions correspond to the values (n) of 1/2 and 2, while direct and indirect forbidden transitions correspond to 3/2 and 3, respectively. Fig. S1† represents the energy band gap values for NDE1 and NDE10, which are evaluated by the plot between [F(R)hυ]2 versus hυ, indicating the direct allowed transition band and are found to be 4.34 and 4.38 eV, respectively.30
3.2. FT-IR spectroscopy
Fig. S2† exhibits the FT-IR spectroscopy of NCMS:5.0 Dy3+/1.0 Eu3+ (NDE1) and NCMS:5.0 Dy3+/10.0 Eu3+ (NDE10) phosphors, which have been recorded in order to examine the functional groups. From the FT-IR spectra of NDE1 and NDE10, it can be observed that both samples show analogous absorption peaks, which indicate similar chemical compositions.31 The peaks presented in the FT-IR spectra have been depicted in the range of 500–1275 cm−1 and positioned at 529, 624, and 696 cm−1 owing to bending vibration modes of Si–O bond linkages.32 However, asymmetric and symmetric stretching in Si–O–Si correspond to 729 and 1030 cm−1, respectively, while bands observed at 914 cm−1 are due to Si–O symmetric stretching mode.33 The bands centred at 1095 cm−1 are due to the vibrational mode of metal (Ca, Na) bonds with oxygen atoms (O).34 In both FT-IR spectra, there are no additional peaks, supporting the conclusion that the addition of Dy3+ and Eu3+ dopant ions in NCMS phosphor had no discernible impact.35
3.3. Luminescent studies of NCMS phosphors activated with Dy3+ and Dy3+/Eu3+ ions
PL spectral measurements of NCMS phosphors activated with Dy3+ and Dy3+/Eu3+ ions have been carried out to analyse photoluminescence properties. Fig. 3(a) exhibits the photoluminescence excitation (PLE) spectrum of optimized 5.0 mol% of Dy3+ activated Na4Ca4Si6O18 phosphor under an emission wavelength of 576 nm. In Fig. 3(a), the excitation peaks are positioned at 321, 348, 360, 382, 421, 450, and 476 nm, which begin from the lower energy state 6H15/2 to a variety of excited states, including 6P3/2, 6P7/2, 6P5/2, 4F7/2, 4G11/2, 4I15/2 and 4F9/2, respectively.36 The peak appearing at 348 nm has the highest intensity among all excitation peaks and thus indicates that the greatest possible amount of absorption energy is at this particular wavelength for Dy3+. Hence, the photoluminescence (PL) profiles of Dy3+ (x = 1.0, 3.0, 4.0, 5.0, and 6.0 mol%) doped Na4Ca4Si6O18 phosphors obtained at the strongest excitation wavelength of 348 nm is shown in Fig. 3(b).
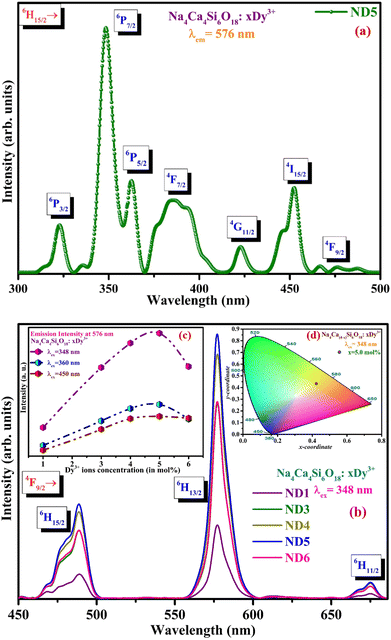 |
| | Fig. 3 (a and b) PLE spectrum of Dy3+ (x = 5.0 mol%) and PL emission spectra of ND1 to ND6 phosphors at λem = 576 nm and λex = 348 nm (c) variation of emission intensity at 576 nm with the concentration of Dy3+ ions at different excitation wavelengths (d) CIE chromaticity diagram of ND5 under 348 nm excitation wavelength. | |
The bands in the PL spectra credited to pure Dy3+ transitions are attained at 488, 576 and 675 nm, which corresponds to 4F9/2 → 6HJ (where J are 15/2, 13/2, and 11/2, respectively) as depicted in Fig. 3(b).37 The intense peak is located at 576 nm (4F9/2 → 6H13/2), attributed to forced electric dipole (ED) transition in which the dopant ions are situated at a location lacking an inversion centre, whereas the second dominant peak is at 488 nm (4F9/2 → 6H15/2), due to a magnetic dipole (MD) transition.38 The Ca2+ site having low symmetry, can be substituted by Dy3+ ions due to the fact that the Dy3+ ionic radii is smaller than that of Ca2+ ions.39 Furthermore, stark splitting of emission peaks has been observed for the transitions at 488 and 675 nm up to the utmost of J + 1/2 as a result of the crystal field effect, where J is total angular momentum.40 Fig. 3(c) depicts the effect of the concentration of Dy3+ ions on 4F9/2 → 6H13/2 intensity under different significant excitation wavelengths (348, 360, and 450 nm). The rise in concentration enhances the luminescence intensity until 5.0 mol% and further with the concentration, the intensity declines due to the widely known concentration quenching effect.41 Due to a reduction in the distance between the dopant (Dy3+) ions at considerably larger dopant ion concentrations (beyond 5.0 mol%), it is more likely that the energy of absorbed ions is released non-radiatively despite being transmitted radiatively. Thus, the highly optimized Dy3+ concentration in the NCMS host is observed to be 5.0 mol% (ND5), which falls in the yellow region under n-UV (λex = 348 nm) excitation as denoted in the CIE chromaticity diagram (Fig. 3(d)). The as-prepared Dy3+ ion induced phosphor emits yellow colour along with a feeble red emission band. Therefore, in order to achieve intense white light along with better CRI value and color tunability behaviour, Eu3+ was included as a co-dopant ion to the optimized yellow emitting (5.0 mol%) Dy3+ activated NCMS phosphor to accomplish the prerequisite red emission.42
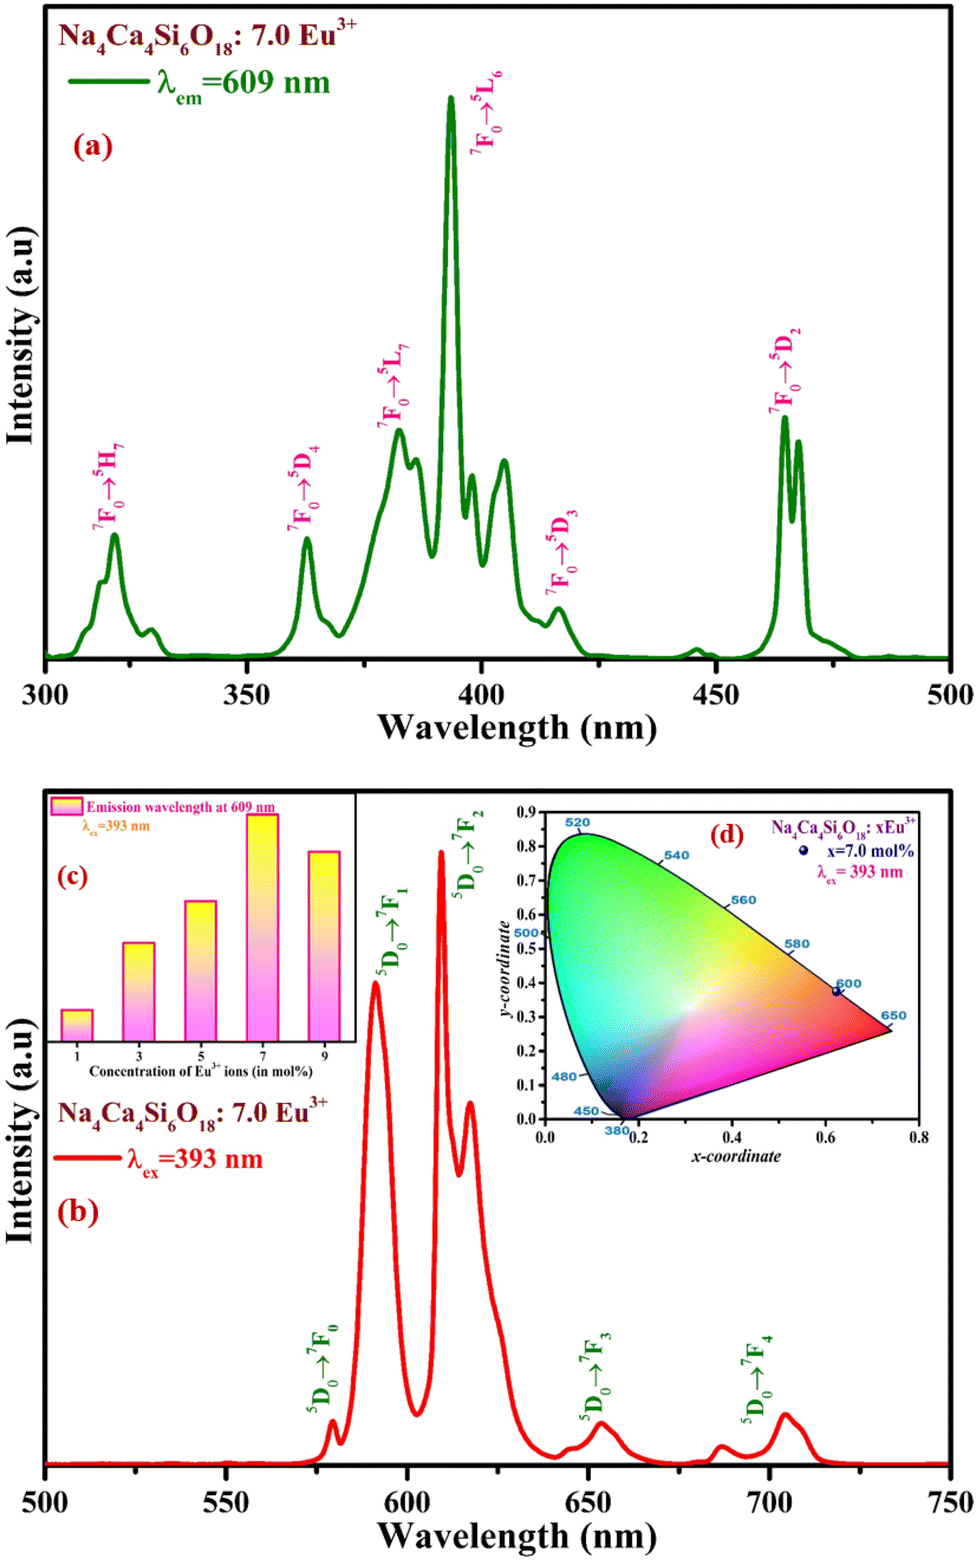
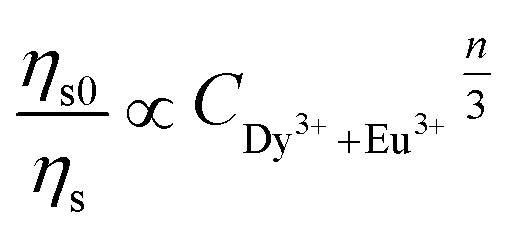
Thus, the PLE and PL spectra of 7.0 mol% of Eu3+ (optimized) activated NCMS phosphor have been measured, as shown in Fig. 4(a) and (b). Numerous excitation peaks in 300–500 nm range have been recognized at different excitation wavelengths attributed to the different transitions as 321 (7F0 → 5H7), 364 (7F0 → 5D4), 382 (7F0 → 5L7), 393 (7F0 → 5L6), 416 (7F0 → 5D3), and 464 nm (7F0 → 5D2), as depicted in Fig. 4(a). Two strongly intense peaks are captured in n-UV and blue region positioned at 393 and 464 nm, which implies that the as-synthesized NCMS:Eu3+ can be adequately excited with n-UV/blue light. Furthermore, the dominant excitation peak observed at 393 nm is chosen to record the PL spectrum of Eu3+ activated NCMS phosphor in a range of 500–750 nm, as represented in Fig. 4(b). The emission peaks at 579, 591, 609, 653, and 704 nm reveal the transitions of Eu3+ ions under 393 nm excitation from the lower energy state 5D0 to distinct excited states as 7F0, 7F1, 7F2, 7F3, and 7F4, respectively.43 In the PL spectrum, two peaks positioned at 591 (orange: O) and 609 nm (red: R) wavelengths are quite strong among the five peaks. The highest peak at 609 nm attributed to forced electric dipole (ED) transition (5D0 → 7F2) complies with the selection rule ΔJ ≤ 2 and is inherently hypersensitive and strongly impacted by the crystal field environment. However, the peak positioned at 591 nm ascribed to magnetic dipole (MD) transition (5D0 → 7F1) obeys the selection rule ΔJ = 1.44 The red to orange (R/O) emission intensity ratio or asymmetric ratio quantifies the site symmetry of the dopant ions. Particularly for Eu3+ ion-doped NCMS phosphor, the red to orange emission intensity ratio is found to be 1.42 for optimum concentration (7.0 mol%) of Eu3+ ions, indicating that Eu3+ ions are placed at the low symmetry sites as the R/O ratio is greater than unity.45
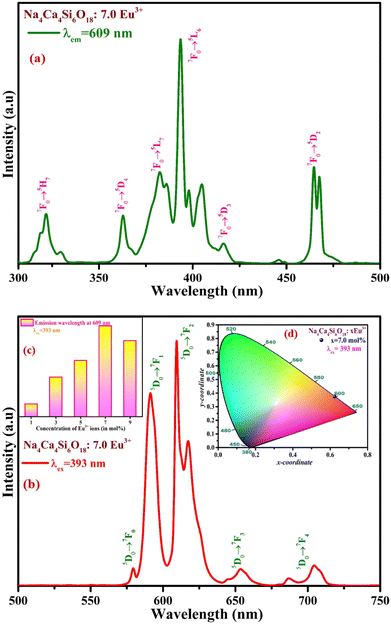 |
| | Fig. 4 (a and b) PLE and PL spectrum of 7.0 mol% of Eu3+ activated NCMS phosphor; (c) intensity of 5D0 → 7F2 transition versus concentration of Eu3+ ions (in mol%); (d) CIE chromaticity diagram of the optimized Eu3+ activated NCMS phosphor under 393 nm excitation wavelength. | |
Fig. 4(c) illustrates the optimum activator (Eu3+) ion concentration in the host matrix with the highest emission intensity, after which the intensity is suppressed through the effect of the concentration quenching mechanism via expressing non-radiative energy transfer among the Eu3+ ions. The emission colour of the optimized concentration of Eu3+ doped NCMS phosphor falls under the red region with the CIE coordinates (0.631, 0.367), as shown in Fig. 4(d).
PLE spectra of ND1E1 (Dy3+: 1.0 mol% doped and Eu3+: 1.0 mol% co-doped NCMS phosphors) were measured by affixing at the highest emission wavelength of each dopant (Dy3+: 576 nm) and (Eu3+: 609 nm), as represented in Fig. 5. The excitation spectrum of ND1E1 phosphor exhibits characteristic absorption peaks of Dy3+ and Eu3+ in n-UV and blue regions in a range of 300–500 nm. Furthermore, one of the crucial prerequisites for energy transfer from Dy3+ to Eu3+ is that the sensitizer emission (donor: Dy3+) overlaps with the activator excitation (acceptor: Eu3+), which was satisfied in the current work. To demonstrate the energy transfer mechanism along with colour tunability behaviour in bi-activated (Dy3+/Eu3+) NCMS phosphor, the sample has been excited at selected wavelengths of 348, 364, 393, and 464 nm. Based on the above results, ND1E1 phosphor may efficiently excite using n-UV and blue LEDs.
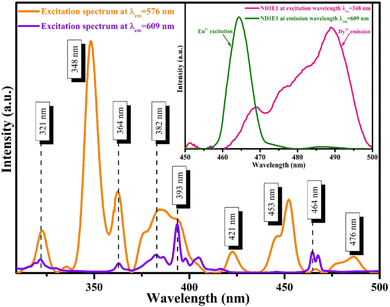 |
| | Fig. 5 Photoluminescence excitation spectra for ND1E1 phosphor at emission wavelengths 576 and 609 nm (inset: spectral overlap for emission of sensitizer (Dy3+) and absorption of activator (Eu3+)). | |
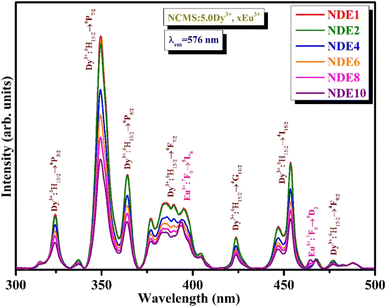
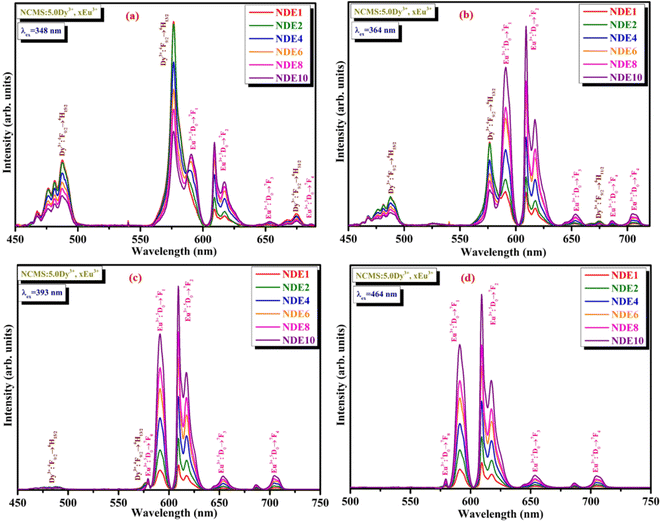
Fig. 6 depicts the excitation spectra of co-activated xDy3+/yEu3+ (where x = 5.0 mol% and y = 1.0, 2.0, 4.0, 6.0, 8.0, and 10.0 mol%) Na4Ca4Si6O18 phosphors at 576 nm emission wavelength. The peaks obtained in the spectra are a mixture of Dy3+ and Eu3+ ions positioned at 321, 348, 364, 382, 393, 421, 453, 464, and 476 nm, corresponding to the transitions from the ground state of Dy3+ (6H15/2) and Eu3+ (7F0) to various excited states 6P3/2 (Dy3+), 6P7/2 (Dy3+), 6P5/2 (Dy3+), 4F7/2 (Dy3+), 5L6 (Eu3+), 4G11/2 (Dy3+), 4I15/2 (Dy3+), 5D2 (Eu3+), and 4F9/2 (Dy3+), respectively. Fig. 7(a)–(d) epitomizes the PL spectra of Dy3+/Eu3+ co-activated NCMS phosphors under various excitation (348, 364, 393, and 464 nm) wavelengths. The emission peaks perceived in visible (blue: B, yellow: Y, orange: O and red: R) regions represented by energy transitions between ground and excited levels of Dy3+ (4F9/2 → 6HJ, J = 15/2, 13/2 and 11/2) and Eu3+ (5D0 → 7FJ, J = 0, 1, 2, 3 and 4) ions as explained in the preceding graphs.
 |
| | Fig. 6 Photoluminescence excitation spectra of co-activated 5.0 mol% of Dy3+ and x mol% of Eu3+ (x = 1.0, 2.0, 4.0, 6.0, 8.0 and 10.0 mol%) Na4Ca4Si6O18 phosphors under 576 nm emission wavelength. | |
 |
| | Fig. 7 (a–d) Emission spectra of NDE1, NDE2, NDE4, NDE6, NDE8, and NDE10 phosphors under distinct excitation wavelengths (a) λex = 348 nm (b) λex = 364 nm (c) λex = 393 nm (d) λex = 464 nm. | |
Moreover, it is evident from Fig. 7(a)–(d) that the emission peaks of Dy3+ & Eu3+ and their intensities can be strongly impacted by the excitation wavelengths and concentration of activator ions. According to Fig. 7(a), the emission peaks ascribed to Dy3+ ions under 348 nm excitation wavelength exhibit a decrement in emission intensities, while an increment in emission intensity is observed for the peaks associated with Eu3+ ions. Here, the enhancement of the absorption probability of Eu3+ ions and energy transfer from Dy3+ (sensitizer) to Eu3+ (activator) ions are responsible for the rise in Eu3+ emission intensity with concentration.46 Energy transfer from Dy3+ to Eu3+ is more prominent and conspicuous under pure Dy3+ excitation (348 nm) wavelengths. Under 364 nm excitation, the emission peak intensity related to Dy3+ ions is dominated initially and later by the peaks of Eu3+ ions as the concentration of Eu3+ ions increases on account of energy transfer from sensitizer to activator ions.47 Emission peaks appearing due to Eu3+ ions were quite intense under 393 nm excitation, along with feeble peaks ascribed to Dy3+ ions, which is due to the comparable excitation wavelengths of both the dopants. However, under the 464 nm excitation wavelength, the dominant emission peaks corresponding to Eu3+ have been observed as the absorption intensity of Eu3+ ion is leading in comparison to Dy3+, which substantiates that there is no reverse transfer of energy (i.e., Eu3+ to Dy3+). Fig. 7(a)–(d) portrays the increase in Eu3+ emission intensity until 10.0 mol% concentration of Eu3+ ions under all the excitation wavelengths and no quenching of emission intensity takes place. Moreover, color tunability could be achieved owing to energy transfer between dopant and co-dopant ions by tuning the excitation wavelength and varying the Eu3+ ion concentration, which is described in the forthcoming section (Section 3.4).
Fig. S3† represents the schematic for a partial energy level diagram with various energy levels, radiative and non-radiative energy transitions. The process evinces that when the light is incident onto the Dy3+/Eu3+ bi-activated NCMS phosphors, then the incident energy may be absorbed by Dy3+ ions at the ground state (6H15/2) and excited to the distinct higher (i.e., 6P3/2, 6P7/2, 6P5/2, 4F7/2, 4G11/2, 4I15/2 and 4F9/2) energy levels. Furthermore, the Dy3+ ions at the excited state either relax non-radiatively (shown with zig zag arrow) or may transfer their energy to the nearest levels (5D1 & 5D0) of activator ions (shown with horizontal arrows) along with their radiative emission transitions in the visible region.48 Thus, the transfer of energy in co-doped NCMS:Dy3+/Eu3+ phosphors may occur through higher excited states of Dy3+ ions to Eu3+ ions (sensitizer → activator) via phonon-assisted non-radiative and photon accelerated radiative transition through activator ions to provide integrated emission in the visible region.49
Moreover, non-radiative energy transfer from donor (Dy3+) to the acceptor (Eu3+) ions may be generated by variety of mechanisms, such as exchange interaction or multipole–multipole interactions.50,51 The exchange interaction ensues if the critical distance (RDy–Eu) value should be less than or equal to 5 Å. Using eqn (3), the critical distance can be estimated:52
| |
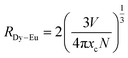 | (3) |
where
V denotes the volume, and
N is the number of cations fixed in the unit cell, respectively. However, for the current matrix
V = 1249.42 Å
3 and
N = 3. To evaluate the critical concentration (
xc), optimum Dy
3+ (5.0 mol%) and Eu
3+ (10.0 mol%) concentrations were added upon which the Dy
3+ ion emission intensity persevered nearly half of its initial value; hence the value of critical concentration is taken as 0.15 mol.
53 Thus, using the above-mentioned parameters in the given formula, the estimated
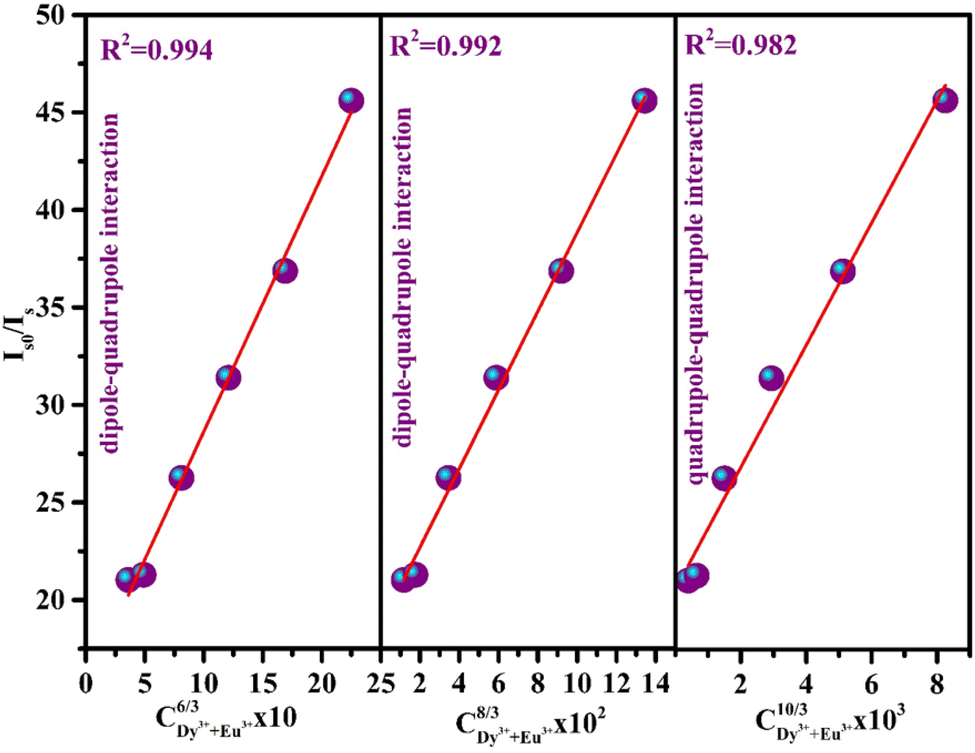
RDy–Eu value comes out to be 17.44 Å and affirms the multipolar–multipolar interaction. Thus, to recognize the type of multipolar interaction, Reisfeld's and Dexter theory can be employed.
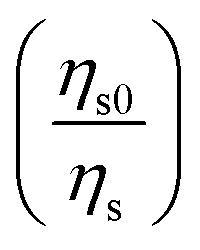
54 This expresses the relation of quantum efficiencies (
ηs0 and
ηs), where
ηs0 is the quantum efficiency of sensitizer (Dy
3+) emission without activator (Eu
3+), and
ηs is quantum efficiency with activator ions, on the summation of sensitizer and activator concentrations (
CDy3++Eu3+):
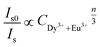
55| |
 | (4) |
where
n designates the type of multipolar interactions, dipole–dipole (d–d) interaction with the value of 6, dipole–quadrupole (d–q) with 8, and quadrupole–quadrupole (q–q) interaction with 10. The value of the quantum efficiency ratio

for Dy
3+ ion emission without and with Eu
3+ ions can be associated with the ratio of emission intensity

:
56| |
 | (5) |
Here,
Is0 and
Is represent the emission intensity of Dy
3+ ions without and with Eu
3+ ions, respectively, under 348 nm excitation wavelength. The plot shown in
Fig. 8 depicts the
explicates the multipolar interaction that takes place in the reported phosphor corresponds to the value of
n to 6, 8, and 10.
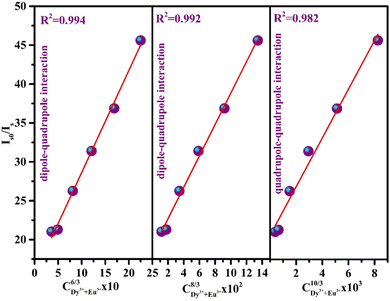 |
| | Fig. 8 Is0/Is versus CDy3+Eu3+n/3 plot to reveal the type of interaction among dopant and co-dopant ions. | |
Among all the values of n, the best linear fit is obtained at 6, indicating the contribution of d–d interaction to elaborate the energy transfer mechanism from Dy3+ to Eu3+ ions. Moreover, the energy transfer efficiency (ηET) of the corresponding donor (Dy3+) to the acceptor (Eu3+) can be evaluated using the below equation:57,58
| |
 | (6) |
The evaluated energy transfer efficiencies for NDE1, NDE2, NDE4, NDE6, NDE8, and NDE10 are listed in Table 2. The utmost efficiency is found to be 97.80% for NDE10 phosphor.
Table 2 Energy transfer efficiency, energy transfer probability rate, and average decay time of Dy3+ activated and Dy3+/Eu3+ co-activated NCMS phosphors
| Sample codes |
ND5 |
NDE1 |
NDE2 |
NDE4 |
NDE6 |
NDE8 |
NDE10 |
| Energy transfer efficiency (ηET in %) |
— |
95.24 |
95.30 |
96.19 |
96.81 |
97.28 |
97.80 |
| Energy transfer probability (P) |
— |
— |
0.31 |
0.36 |
0.41 |
0.62 |
0.73 |
| Average decay time (μs) |
2.22 |
— |
1.30 |
1.22 |
1.15 |
0.93 |
0.84 |
3.4. CIE colorimetry studies
To elucidate the competence of white light emission and versatile color tunable behaviour of NCMS:Dy3+/Eu3+ phosphors, color coordinates have been computed using the emission data and annotated in CIE 1931 chromaticity diagram as expressed in Fig. 9(a)–(f).59 CIE color coordinates of ND5 under 348 nm excitation wavelength and NDE1 under 348, 364, 393, 453, and 464 nm are marked in Fig. 9(a). The color coordinates of NDE1 phosphor under the excitation wavelengths of 348 and 364 nm are found to be in a pure white domain, while under the 453 nm excitation wavelength, the emission color reflects in the yellow region and shows red emission under 393 and 464 nm. Further, the color coordinates from NDE1 to NDE10 phosphor indicate the tunability in color from the white domain to the red region with rising Eu3+ ion concentration under the excitation of 348 and 364 nm (Fig. 9(b) and (c)). The obtained color tunability may be the result of energy transfer from Dy3+ to Eu3+ ions. Furthermore, the chromaticity coordinates instantly shifted to the more prominent red color under the 393 nm excitation wavelength represented in Fig. 9(d). Under 453 nm excitation, the co-doped phosphor manifests a shifting of color from yellow to the red region and exhibits pure red emission under 464 nm excitation wavelength, which confirms that there is no reverse transfer of energy from Eu3+ to Dy3+ in the prepared phosphor, as shown in Fig. 9(e) and (f).
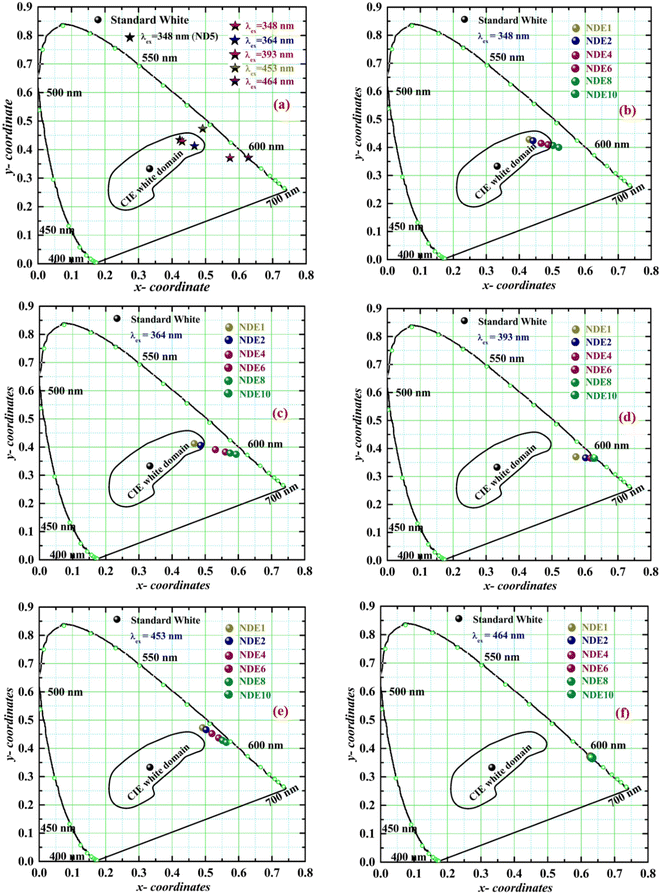 |
| | Fig. 9 (a) CIE chromaticity coordinates of ND5 at 348 nm excitation wavelength and NDE1 at different wavelengths (348, 364, 393, 453, and 464 nm) (b–f) CIE coordinates of NDE1, NDE2, NDE4, NDE6, NDE8, and NDE10 under 348, 364, 393, 453, and 464 nm excitation wavelength, respectively. | |
Moreover, CIE and CCT (correlated color temperature) values of single and bi-activated NCMS phosphors have been evaluated and represented in Table 3 under 348 and 464 nm excitation wavelengths. The CCT values less than 5000 K indicate that the colour of the synthesized phosphors falls in the warm white light region by incorporating Eu3+ ions under the excitation wavelengths of Dy3+. The aforementioned colorimetric behaviour under n-UV/blue LED excitation source of the as-synthesized bi-activated NCMS:Dy3+/Eu3+ phosphors has proved its potential application in w-LEDs and color tunable display devices.
Table 3 CIE chromaticity coordinates and CCT values of singly doped NCMS:Dy3+ and doubly doped NCMS:Dy3+/Eu3+ phosphors under different excitation wavelengths
| Sample codes |
Excitation wavelength (nm) |
CIE chromaticity coordinates (x, y) |
CCT values (K) |
| ND5 |
348 |
(0.42, 0.44) |
3536.11 |
| NDE1 |
348 |
(0.43, 0.43) |
3315.58 |
| 464 |
(0.57, 0.37) |
1732.00 |
| NDE2 |
348 |
(0.44, 0.42) |
3087.09 |
| 464 |
(0.60, 0.37) |
1852.72 |
| NDE4 |
348 |
(0.47, 0.41) |
2648.14 |
| 464 |
(0.62, 0.37) |
1959.64 |
| NDE6 |
348 |
(0.49, 0.41) |
2356.13 |
| 464 |
(0.62, 0.37) |
2011.51 |
| NDE8 |
348 |
(0.50, 0.40) |
2179.36 |
| 464 |
(0.63, 0.37) |
2028.12 |
| NDE10 |
348 |
(0.52, 0.40) |
1984.82 |
| 464 |
(0.63, 0.36) |
2054.13 |
3.5. Decay measurement of NCMS:Dy3+/Eu3+ phosphor
Fig. 10(a) and (b) depicts the luminescence decay measurements, which have been performed under 348 nm excitation wavelength by fixing the emission wavelength at 576 nm. The feasible fitted PL decay profiles of ND5, NDE2, NDE4, NDE6, NDE8, and NDE10 were achieved with the bi-exponential equation:60| |
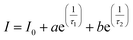 | (7) |
in the above equation, I and I0 imply the emission intensity corresponding to specific time ‘t’ and ‘0’. The parameters, τ1 denotes the slow while τ2 is the fast component of decay time with a and b as fitting constants, respectively. Further, the average decay lifetime (τavg) for all the samples have been evaluated using the below equation:| | |
τavg = (aτ12 + bτ22)/(aτ2 + bτ2)
| (8) |
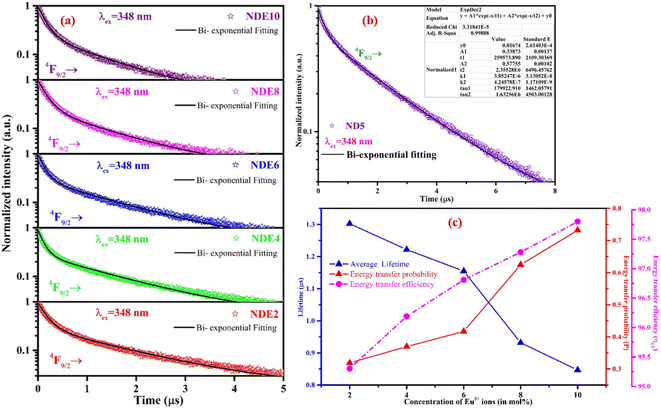 |
| | Fig. 10 (a) Decay plots of NDE2, NDE4, NDE6, NDE8, and NDE10 phosphors for 4F9/2 level under the excitation wavelength of 348 nm (b) decay plot for ND5 phosphor under 348 nm excitation wavelength (c) lifetime, energy transfer efficiency, and energy transfer probability with increasing the concentration of Eu3+ ions at λex = 348 nm and λem = 576 nm. | |
The evaluated lifetime values of bi-activated NCMS:Dy3+/Eu3+ phosphors show the downtrend with an increase in the concentration of activator ion and confirm the energy transfer from sensitizer to activator (Dy3+ to Eu3+) ions. Using decay time values such as τ0 (without Eu3+ ions) and τ (with Eu3+ ions), probability rate (P) for dipole–dipole energy transfer in NCMS:Dy3+/Eu3+ phosphors have been estimated from the equation below:61
The evaluated energy transfer probability rates with varying the activator ion (Eu3+ ions) concentration in NCMS phosphors are mentioned in Table 2. Moreover, Fig. 10(c) epitomizes the plot for the concentration of Eu3+ ions in ND5 phosphor versus decay time values along with the energy transfer efficiency and probability. The energy transfer probability rate and energy transfer efficiency upsurge with increasing the concentration of activator ions in NCMS phosphors.
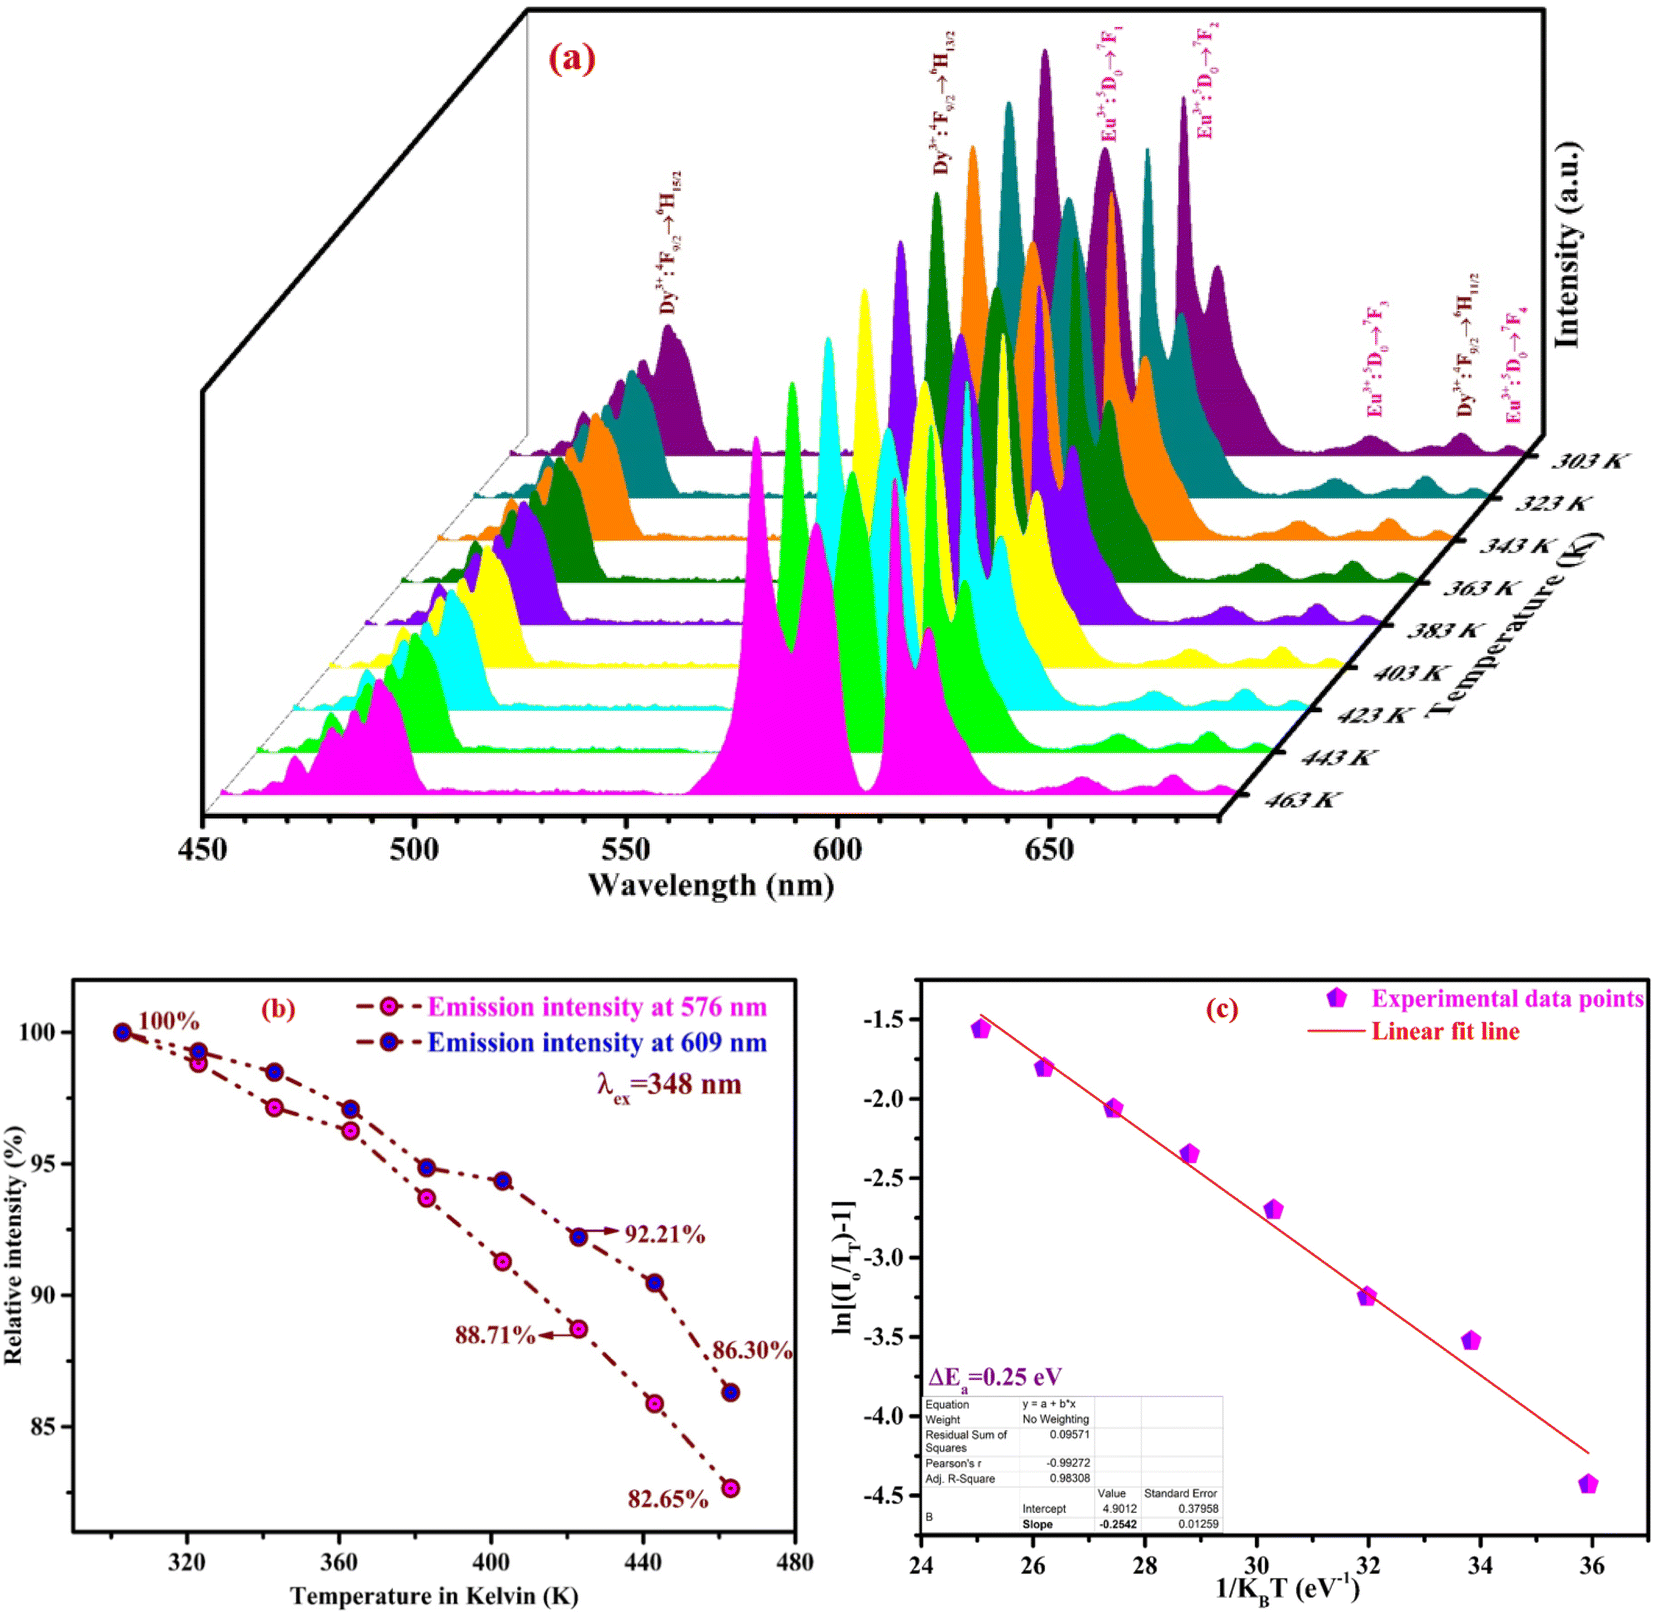
3.6. Thermal stability studies of Dy3+/Eu3+ doped NCMS phosphor
Fig. 11(a) illustrates the thermal stability of the as-prepared phosphor to divulge the performance of material at high temperature, as the working temperature for LEDs approaches 150 °C very frequently. Better thermal stability makes the material suitable for the fabrication of LEDs. Bi-activated NCMS:Dy3+/Eu3+ phosphor (NDE1) under 348 nm excitation reflects a slight drop in the emission intensity with increasing the temperature. The constant increment in temperature in the range from RT to 463 K brings down the emission intensity of NDE1 up to 86.30%. Fig. 11(b) depicts the variation in relative emission intensity with rising temperature. The emission intensity of NDE1 phosphor sustained up to 92.21 and 86.30% at 423 (∼150 °C) and 463 K (∼190 °C), respectively, indicating the superior thermal stability in comparison with the other reported samples.62–64 Moreover, the thermal stability of other sort of materials such as perovskites and metal–organic frameworks (MOFs) possess very less thermal stability.66,67 Furthermore, the activation energy (ΔEa) for thermal quenching has been evaluated using the following equation:65| |
 | (10) |
where I0 is the initial emission intensity whereas IT designates the intensity at a specific temperature, respectively. Additionally, KB is the Boltzmann's constant with the value 8.617 × 10⁻⁵ eV K−1, and A is the Arrhenius constant. The activation energy for thermal quenching of NDE1 phosphor has been estimated using the plot between ln[(I0/IT) − 1] and 1/KBT, as displayed in Fig. 11(c) and found the value as 0.25 eV. The present value is relatively higher than the reported values of other phosphors, as represented in Table 4.
 |
| | Fig. 11 (a) Temperature-dependent PL spectra of NDE1 phosphor under 348 nm excitation wavelength (b) relative intensity vs. temperature plot for emission peak wavelengths at 576 and 609 nm for NDE1 phosphor under 348 nm excitation wavelength (c) plot of ln[(I0/IT) − 1] vs. 1/KBT (eV−1) for NDE1 phosphor. | |
Table 4 Comparison of thermal stability of NCMS:Dy3+/Eu3+ phosphor with other reported results
| Samples |
Activation energy (in eV) |
Thermal quenching at 423 K (in %) |
References |
| Na4Ca4Si6O18:Dy3+/Eu3+ |
0.25 |
92.21 |
Present work |
| Sr3Gd(PO4)3:Dy3+/Eu3+ |
0.188 |
80.0 |
62 |
| SrLaMgTaO6:Dy3+/Eu3+ |
— |
83.34 |
63 |
| Ba2LaV3O11:Dy3+/Eu3+ |
0.23 |
50.0 |
64 |
4. Conclusions
A sequence of NCMS phosphors activated with Dy3+ and Dy3+/Eu3+ ions was synthesized using a solid-state reaction technique. The crystalline hexagonal phase of sodium calcium metasilicate phosphor material has been established via X-ray diffraction, and the diffraction pattern for all samples agreed well with specific JCPDS (card no. 75-1687) data. Morphological analysis has been done via FE-SEM imaging that unveils the agglomerated micro-sized particles with sharp edges of as-synthesized NDE1 phosphor. The optical band gaps of phosphors such as NDE1 and NDE10 are estimated through diffuse reflectance spectra. The emission spectra of the optimized NCMS:Dy3+ phosphor illustrate strong intense peaks in the yellow region and feeble intense peaks in blue and red regions under 348 nm excitation wavelength, whereas optimized Eu3+ doped NCMS phosphor reveals emission in the red region under 393 nm excitation wavelength. The co-doped NCMS:Dy3+/Eu3+ phosphors display color tunability by altering the excitation wavelength and concentration of Eu3+ ions. Moreover, the decay plot under 348 nm excitation expresses the bi-exponential fit with a decrement in the decay time with an increment in the concentration of the activator ion. The Dy3+/Eu3+ doubly doped NCMS (NDE1) phosphor shows outstanding thermal stability with higher activation energy, demonstrating that this phosphor is a promising candidate for w-LEDs and colour tunable devices.
Conflicts of interest
There are no conflicts to declare.
References
- W. P. Lustig, Z. Shen, S. J. Teat, N. Javed, E. Velasco, D. M. O'Carroll and J. Li, Chem. Sci., 2020, 11, 1814–1824 RSC.
- B. Li, G. Annadurai, J. Liang, L. Sun, S. Wang, Q. Sun and X. Huang, RSC Adv., 2018, 8, 33710–33716 RSC.
- Deepali, R. Bisi, Vandana, H. Kaur and M. Jayasimhadri, J. Mater. Sci.: Mater. Electron., 2021, 32, 1650–1658 CrossRef CAS.
- W. Wu, Y. Zhang, Y. Zhang and J. Hu, Dalton Trans., 2021, 50, 5287–5300 RSC.
- A. K. Bedyal, A. K. Kunti, V. Kumar and H. C. Swart, J. Alloys Compd., 2019, 806, 1127–1137 CrossRef CAS.
- S. K. Hussain and J. S. Yu, RSC Adv., 2017, 7, 13281–13288 RSC.
- S. Liu, B. Deng, J. Chen, H. Liu, C. S. Zhou and R. Yu, IOP Conf. Ser.: Earth Environ. Sci., 2019, 295, 4–7 Search PubMed.
- J. Deng, H. Zhang, X. Zhang, M. S. Molokeev, J. Qiu, Y. Liu, B. Lei, L. Ma and X. Wang, J. Mater. Chem. C, 2018, 6, 4077–4086 RSC.
- L. Zhang, Y. Xu, X. Wu, S. Yin and H. You, Mater. Adv., 2022, 3, 2591–2597 RSC.
- Y. L. Yang, J. Y. Yuan, Y. T. Fan, D. Y. Wan, Q. L. Li, J. T. Zhao and Z. J. Zhang, Dalton Trans., 2021, 50, 11130–11136 RSC.
- S. Som, P. Mitra, V. Kumar, V. Kumar, J. J. Terblans, H. C. Swart and S. K. Sharma, Dalton Trans., 2014, 43, 9860–9871 RSC.
- S. K. Hussain and J. S. Yu, J. Lumin., 2017, 183, 39–47 CrossRef CAS.
- K. Mondal and J. Manam, J. Lumin., 2018, 195, 259–270 CrossRef CAS.
- Z. Zhang, Y. Wang and J. Zhang, Mater. Lett., 2008, 62, 846–848 CrossRef CAS.
- X. Guo, J. He, M. Huang, R. Shi, Y. Chen, Y. Huang, J. Zhang and Z. Q. Liu, Mater. Res. Bull., 2019, 118, 110523 CrossRef CAS.
- X. Zhang and H. J. Seo, Mater. Res. Bull., 2012, 47, 2012–2015 CrossRef CAS.
- R. Zhang and J. Yuan, Acc. Chem. Res., 2020, 53, 1316–1329 CrossRef CAS PubMed.
- D. Singh, S. Sheoran, V. Tanwar and S. Bhagwan, J. Mater. Sci.: Mater. Electron., 2017, 28, 3243–3253 CrossRef CAS.
- S. Kaur, A. S. Rao and M. Jayasimhadri, Mater. Res. Bull., 2019, 116, 79–88 CrossRef CAS.
- B. Devakumar, P. Halappa and C. Shivakumara, Dyes Pigm., 2017, 137, 244–255 CrossRef CAS.
- P. Du and J. S. Yu, J. Alloys Compd., 2015, 653, 468–473 CrossRef CAS.
- Deepali and M. Jayasimhadri, J. Mater. Sci.: Mater. Electron., 2022, 33, 19218–19230 CrossRef CAS.
- W. Li, W. Zhang, W. Li, Y. Gan and P. Zhang, J. Mater. Sci.: Mater. Electron., 2019, 30, 658–666 CrossRef CAS.
- A. Kumar and J. Manam, Opt. Mater., 2019, 96, 109373 CrossRef CAS.
- J. S. Revathy, N. S. C. Priya, K. Sandhya and D. N. Rajendran, Bull. Mater. Sci., 2021, 44, 1–8 CrossRef.
- A. M. Khachatourian, F. Golestani-Fard, H. Sarpoolaky, C. Vogt, E. Vasileva, M. Mensi, S. Popov and M. S. Toprak, J. Lumin., 2016, 169, 1–8 CrossRef CAS.
- C. Wang, J. Jiang, S. Xin, Y. Shi and G. Zhu, J. Lumin., 2019, 214, 116521 CrossRef CAS.
- K. M. Girish, S. C. Prashantha, R. Naik, H. Nagabhushana and K. S. Anantharaju, SN Appl. Sci., 2019, 1, 1–9 CAS.
- Y. Deng, S. Yi, J. Huang, J. Xian and W. Zhao, Mater. Res. Bull., 2014, 57, 85–90 CrossRef CAS.
- M. Jiao, Q. Xu, C. Yang and H. You, RSC Adv., 2017, 7, 28647–28654 RSC.
- W. Wang, J. Li, Z. Zhang and Z. Liu, J. Lumin., 2019, 207, 114–122 CrossRef CAS.
- M. A. Mickens and Z. Assefa, J. Lumin., 2014, 145, 498–506 CrossRef CAS.
- M. Manca, A. Cannavale, L. De Marco, A. S. Aricò, R. Cingolani and G. Gigli, Langmuir, 2009, 25, 6357–6362 CrossRef CAS PubMed.
- R. Choudhary, S. Koppala and S. Swamiappan, J. Asian Ceram. Soc., 2015, 3, 173–177 CrossRef.
- Deepali and M. Jayasimhadri, Luminescence, 2022, 37, 1465–1474 CrossRef CAS PubMed.
- Y. Wu, Y. Yang, B. Liu, M. Hu, X. Min, Y. Wu, Z. Liu and L. Yu, Luminescence, 2021, 36, 914–922 CrossRef CAS PubMed.
- J. Li, Y. Liu, W. Cao, Y. Gao, W. Zhang and X. Lai, Integr. Ferroelectr., 2017, 179, 1–9 CrossRef CAS.
- S. Das, A. Amarnath Reddy, S. Surendra Babu and G. Vijaya Prakash, J. Mater. Sci., 2011, 46, 7770–7775 CrossRef CAS.
- L. Jiang, C. Chang and D. Mao, J. Alloys Compd., 2003, 360, 193–197 CrossRef CAS.
- K. Jha, A. K. Vishwakarma, M. Jayasimhadri, D. Haranath and K. Jang, J. Non-Cryst. Solids, 2021, 553, 120516 CrossRef CAS.
- A. N. Meza-Rocha, I. Camarillo, R. Lozada-Morales and U. Caldiño, J. Lumin., 2017, 183, 341–347 CrossRef CAS.
- M. M. Rodríguez-García, J. A. G. Williams and I. R. Evans, J. Mater. Chem. C, 2019, 7, 7779–7787 RSC.
- J. Xiao, C. Wang, X. Min, X. Wu, Y. Liu, Z. Huang and M. Fang, Nanomaterials, 2020, 10, 1249 CrossRef CAS PubMed.
- Y. Il Jeon, L. Krishna Bharat and J. S. Yu, J. Alloys Compd., 2015, 620, 263–268 CrossRef.
- H. Kaur and M. Jayasimhadri, Solid State Sci., 2021, 122, 106776 CrossRef CAS.
- T. Leow, H. Liu, R. Hussin, Z. Ibrahim, K. Deraman, H. O. Lintang and W. N. W. Shamsuri, J. Rare Earths, 2016, 34, 21–29 CrossRef CAS.
- P. Du, S. Wu and J. S. Yu, J. Lumin., 2016, 173, 192–198 CrossRef CAS.
- V. R. Bandi, B. K. Grandhe, H. J. Woo, K. Jang, D. S. Shin, S. S. Yi and J. H. Jeong, J. Alloys Compd., 2012, 538, 85–90 CrossRef CAS.
- T. S. Atabaev, Y. H. Hwang and H. K. Kim, Nanoscale Res. Lett., 2012, 7, 556 CrossRef PubMed.
- Y. Ma, S. Fu, Y. Zhao, C. Liu, L. Li, Z. Wang, H. Suo, D. Wang, J. Zhao and P. Li, RSC Adv., 2021, 12, 420–428 RSC.
- M. Xu, L. Wang, D. Jia and H. Zhao, Phys. Chem. Chem. Phys., 2015, 17, 28802–28808 RSC.
- A. George, S. K. Jose, A. Jose, C. Joseph and P. R. Biju, Opt. Laser Technol., 2022, 151, 108029 CrossRef CAS.
- F. Xu, L. Fang, X. Zhou, H. Xia, J. Zhang, H. Song and B. Chen, Opt. Mater., 2020, 108, 110222 CrossRef CAS.
- X. Y. Sun, T. T. Han, D. L. Wu, F. Xiao, S. L. Zhou, Q. M. Yang and J. P. Zhong, J. Lumin., 2018, 204, 89–94 CrossRef CAS.
- X. Wu, W. Bai, O. Hai, Q. Ren, F. Lin and Y. Jiao, J. Solid State Chem., 2018, 265, 109–116 CrossRef CAS.
- X. Wu, B. Yin, Q. Ren, J. zheng, Y. Ren and O. Hai, J. Alloys Compd., 2020, 822, 153562 CrossRef CAS.
- K. N. Kumar, J. S. Kim, M. Cho, J. Shim, B. K. Gupta and M. Kang, J. Alloys Compd., 2017, 721, 554–562 CrossRef CAS.
- M. Fhoula, T. Koubaa and M. Dammak, Opt. Laser Technol., 2020, 130, 106352 CrossRef CAS.
- R. Vijayakumar, H. Guo and X. Huang, Dyes Pigm., 2018, 156, 8–16 CrossRef CAS.
- Z. Y. Wang, B. L. Shen, K. H. Yu, Z. Yang, R. L. Zheng, E. T. Hu, J. J. Zheng and W. Wei, J. Alloys Compd., 2019, 791, 833–838 CrossRef CAS.
- K. Jha, A. K. Vishwakarma, M. Jayasimhadri and D. Haranath, J. Alloys Compd., 2017, 719, 116–124 CrossRef CAS.
- B. Fan, W. Zhao and L. Han, Appl. Phys. A: Mater. Sci. Process., 2020, 126, 1–10 CrossRef.
- Y. Guo, B. K. Moon, B. C. Choi, J. H. Jeong and J. H. Kim, Mater. Res. Bull., 2017, 88, 166–173 CrossRef CAS.
- H. Patnam, S. K. Hussain, L. K. Bharat and J. S. Yu, Dyes Pigm., 2019, 162, 583–589 CrossRef CAS.
- S. Dutta and T. M. Chen, RSC Adv., 2017, 7, 40914–40921 RSC.
- R. Liu, J. Yang, D. Zhao, W. Liu, G. Li, W. Yan and W. Zhang, Inorg. Chem., 2021, 60, 17878–17888 CrossRef CAS PubMed.
- C. P. Rivera, D. Morett, D. B. Arguelles, P. O. Velasco and D. S. Ibarra, J. Phys.: Energy, 2021, 3, 032014 Search PubMed.
|
| This journal is © The Royal Society of Chemistry 2023 |
Click here to see how this site uses Cookies. View our privacy policy here. 
 Open Access Article
 This Open Access Article is licensed under a Creative Commons Attribution-Non Commercial 3.0 Unported Licence
 *
*


 for Dy3+ ion emission without and with Eu3+ ions can be associated with the ratio of emission intensity
  :56
:56
 explicates the multipolar interaction that takes place in the reported phosphor corresponds to the value of n to 6, 8, and 10.