
 Open Access Article
 This Open Access Article is licensed under a Creative Commons Attribution-Non Commercial 3.0 Unported Licence
Estimation of spectroscopic parameters and TL glow curve analysis of Eu3+-activated CaY2O4 phosphor
Tirath Rama,
Neeraj Vermaa,
Jagjeet Kaura,
Abhishek Kumar Misraa,
Vikas Dubey *b,
Neha Dubeya,
Marta Michalska-Domańska*c,
Janita Sajid and
Ram Sagar Yadave
*b,
Neha Dubeya,
Marta Michalska-Domańska*c,
Janita Sajid and
Ram Sagar Yadave
aDepartment of Physics, Government Vishwanath Yadav Tamaskar Post Graduate Autonomous College, Durg, C.G., India
bDepartment of Physics, North Eastern Hill University (NEHU), Shillong, Meghalaya 493022, India. E-mail: jsvikasdubey@gmail.com
cInstitute of Optoelectronics, Military University of Technology, Kaliskiego 2, 00-908 Warsaw, Mazovia, Poland
dDepartment of Sciences and Humanities, School of Engineering and Technology CHRIST (Deemed to be University), Bangalore, India
eDepartment of Statistics, Institute of Science, Banaras Hindu University, Varanasi, 221005, India
First published on 4th September 2023
Abstract
The solid-state reaction method was utilised to create a down-conversion phosphor in an air environment in CaY2O4:Eu3+ nanocrystalline material. The calcination temperature was set at 1000 °C, and the sintering temperature was set at 1300 °C. Following annealing, confirmation of the crystallinity quality of the phosphor was accomplished by the use of X-ray diffraction analysis. The particle size was predicted to be 43.113 nm using Scherrer's formula. To produce down-conversion luminescence spectra, an excitation wavelength of 247 nm was applied with a fluorescence spectrophotometer. The PL got increasingly intense as the concentration of the dopant increased. The maximum intensity was measured at 2.0 mol% of Eu3+ ion, which gradually decreased as the concentration increased because of concentration quenching. To analyse spectrophotometric peak determinations, the approach developed by the Commission Internationale de l'Éclairage (CIE) was used. Thermoluminescence (TL) glow curve analysis of the CaY2O4:Eu3+-doped phosphor manufactured here revealed a wide TL centred at 225 °C, which comprised of so many peaks that may be extracted by the computerised glow curve deconvolution (CGCD) approach using glow-fit software. The associated kinetic parameters were then determined. The prepared phosphor may be useful for application in various display devices upon excitation by 247 nm; the prominent 613 nm peak of the Eu3+ ion (5D0 → 7F2) electric dipole transition features a red component. CaY2O4:Eu3+ phosphors show promise as materials for potential use in phosphor-converted white LEDs in the field of solid-state lighting technology. The linear connection that the TL glow curve has with UV dose provides evidence for its possible use in dosimetry.
1. Introduction
Phosphorescence, also known as persistent luminescence (PersL) or long-lasting afterglow, refers to a fascinating occurrence of light emission that persists for several minutes or even hours after the cessation of the initial light excitation, whether it be from UV or visible sources.1 Long persistent phosphors (LPPs) continue to provoke researchers' curiosity due to their unexplained optical nature and broad applicability. LPPs have found diverse applications in specialised technical fields, such as road signs, decoration, emergency lighting, security displays, radiation detection, information storage, and imaging displays. These applications have seen increased the utilization of LPPs in recent decades.2–5 Materials that can store energy in this way also go by the name of electron/hole traps.6–9 High-energy radiation (e.g., gamma rays, X-rays, or ultraviolet light) creates either electrons or holes, which are then trapped by lattice defects or impurities. After absorbing phonons or infrared photons,10–14 the bound electrons/holes are slowly freed. Understanding the presence and distribution of these traps presents a significant challenge. It has not been determined yet how charge carriers go from emission centres to traps.3,15 Lattice imperfections are not just trap centres, but may also act as emission sources.P. Tadge et al. studied the downshifting, frequency up-conversion, and intrinsic optical bi-stability in CaY2O4:Ho3+/Yb3+ and CaSc2O4:Ho3+/Yb3+ phosphors that were synthesised by a complex-based precursor solution method. The X-ray powder diffraction confirmed the formation of highly crystalline phosphors with a pure orthorhombic phase. Fourier transform infrared studies showed vibrational bands and diffuse reflectance spectra. The Ho3+/Yb3+ co-doped CaSc2O4 and CaY2O4 phosphors display intense green downshifting emission upon 454 nm excitations. Their decay curves indicated a non-exponential nature, and the energy transfer microscopic parameters were calculated.18
Jeon et al. discussed up-conversion to be an anti-stokes process that converted near-infrared light into visible light. CaY2O4 is a promising host material due to its high chemical and thermal stability, low-phonon energy, and environment friendliness. Er3+ and Yb3+-doped nano-crystalline phosphors were prepared by a sol–gel process that was characterised by X-ray diffraction and scanning electron microscopy. Photoluminescence properties of the powders were measured by exciting them with a 980 nm diode laser at room temperature. Green and red up-conversion emissions were observed at 520–540 nm, 540–570 nm, and 640–680 nm.19
Hwang et al. studied the nanocrystalline CaY2O4:Er3+ up-conversion phosphor prepared by the sol–gel process. A homogeneous precursor sol was heated on a hot plate; the coagulated gel was pre-fired at 300 °C for 4 h under an Ar atmosphere, followed by final annealing at 1200 °C for 4 h. The crystallinity of the powders after annealing was confirmed using an X-ray diffraction analysis. The shape and particle size of the powders were observed by field emission-scanning electron microscope and transmission electron microscope. The particle size of CaY2O4 powder that had been doped (3 mol%) was homogeneous and varied from 100 to 200 nm, according to micrographic pictures. When Er3+ is injected at a 3 mol% doping concentration, up-conversion efficiency is at its maximum. Additionally, the excellent colour purity of the phosphor exhibits colour tunability.20
Because of its remarkable thermoluminescence (TL) capabilities, CaY2O4:Eu3+ phosphor has been widely recognised as a very effective material for radiation dosimetry. This phosphor exhibits remarkable TL intensity and chemical stability, minimal fading rate, and resistance to environmental variations. Many environmental16,17 and personnel monitoring18,19 programs use it. Since the overall energy contained in the phosphor is emitted in a single measurement during the TL readout, any TL reader malfunctioning during measurements would result in a spurious TL readout. TL-grade CaY2O4:Eu3+ was found to present photo-stimulated luminescence that varies with the dosage. This discovery holds significant potential for radiation dosimetry as it enables multiple outputs on a phosphor sample that has been exposed to radiation, without significant loss of stored energy.20 Consequently, this method offers an advantage over the commonly employed TL method, which lacks this capability.
If we can enhance the declining property, a phosphor that is primarily composed of CaY2O4 has the potential to resemble an optimal TL dosimeter material, aside from the issue of tissue equivalence.21,22
The phosphors mentioned in this paper are CaY2O4:Eu3+; these newly synthesised phosphors exhibit minimum fading, while retaining nearly all of the other beneficial properties of CaSO4:Mn. Dosimeters are constructed with these phosphors, and their properties are studied from the perspective of radiation dosimetry.23
The current research focuses on the creation and analysis of a phosphor material that incorporates Eu3+ ions. This synthesised phosphor demonstrates the potential for a wide range of applications, including displays and dosimetry. As the synthesised phosphor features a crystalline quality as per XRD analysis, to study the morphology of the prepared phosphor, SEM analysis was performed; functional group and modes of vibration were studied by FTIR; spectroscopic analysis was performed using PL emission and excitation spectra, while colour optimisation was done through CIE coordinate and trap parameter analysis was conducted using a TL glow curve analysis via the CGCD technique.
2. Experimental
A conventional solid-state reaction method was used to manufacture Eu3+-doped CaY2O4 phosphor. Sigma-Aldrich provided high-purity CaCO3, europium oxide (Eu2O3) (0.1–2.5 mol%), and yttrium oxide (Y2O3) (99.9%). The chemicals that were used as precursors were mixed using flux boric acid (H3BO3). The appropriate quantities of these substances were measured out and finely ground using an agate mortar and pestle. The powdered sample was calcined at 1000 °C for an hour using an alumina crucible and then sintered at 1300 °C for 4 h in a muffle furnace. After each round of heating, the sample was ground. The sample was heated to a high temperature in the same furnace and then cooled to room temperature (Fig. 1).24,35| CaCO3 + Y2O3 → CaY2O4 + CO2 |
| Y2O3 + CaCO3 + Eu2O3 → CaY2O4:Eu3 |
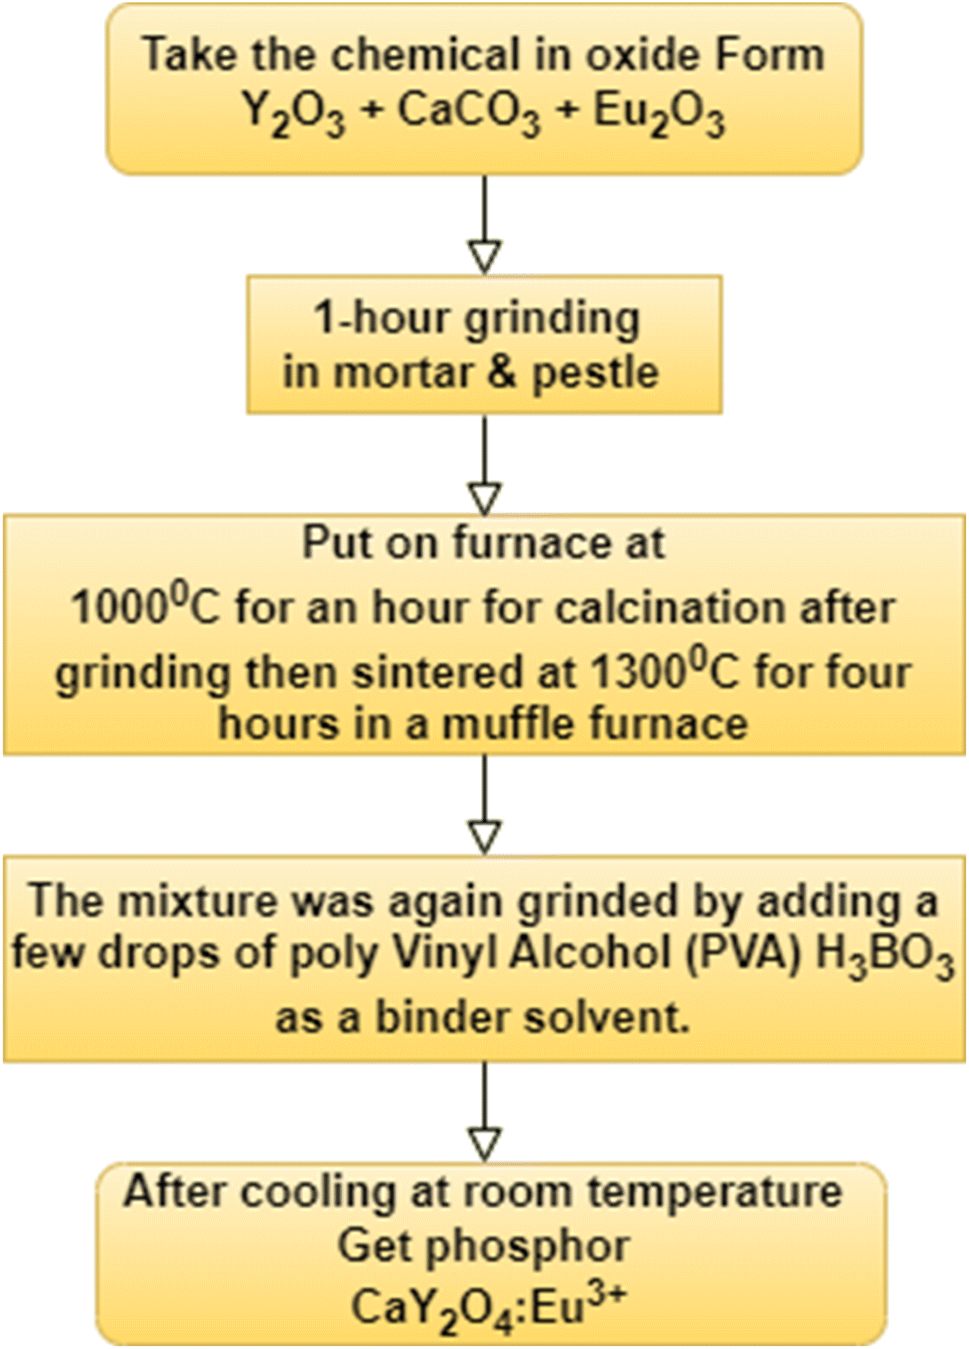 | ||
| Fig. 1 Flow chart of sample preparation. | ||
To determine the crystalline quality of the phosphor and its particle size, X-ray diffraction studies were performed (Advanced Bruker D8 from Germany). We used a CuKα source in an X-ray diffractometer to collect data with X-ray powder diffraction analysis. The X-rays, having a wavelength of 0.154 nm, were produced within a hermetically sealed tube. To detect the X-rays, a high-speed silicon strip technology-based detector known as the Bruker Lynx Eye detector was employed (Bruker made in Germany). To ascertain the molecular structure, FTIR analysis was carried out. A Shimadzu RF-5301 PC spectrofluorophotometer was used to obtain both the emission and excitation spectra of the PL. At room temperature, glow curves of thermally stimulated luminescence (TSL) were recorded using a TLD reader I1009 that was supplied by Nucleonix Sys. Pvt. Ltd in Hyderabad. In the course of the TL test, the phosphor was subjected to UV light coming from a source emitting 254 nm of UV.9,24,25,35
3. Results and discussion
3.1 X-ray diffraction
The crystalline phase considerably affects the probability of both radiative and non-radiative decay processes due to the inter-ionic distance and the role of the crystalline behaviour in energy transfer. The XRD result for nano phosphor CaY2O4:Eu3+ for (0.5–2.5 mol%) is shown in Fig. 2. At different values of 27.077, 31.715, 46.443, 55.526, and 76.488, five different peaks were obtained, which correspond to diffraction at the (111), (200), (220), (222), and (420) planes, respectively. In compliance with (JCPDS/ICDD 01-075-0306 & 00-019-0265), the spectrum indicates the predicted cubic structure crystalline process for the nanopowders. A simple Debye–Scherrer's formula was used to determine a crystallite size that was estimated at 43.113 nm because full width at half maximum (FWHM) of the intense peak; they were matched to the JCPDS card number 01-075-0306.24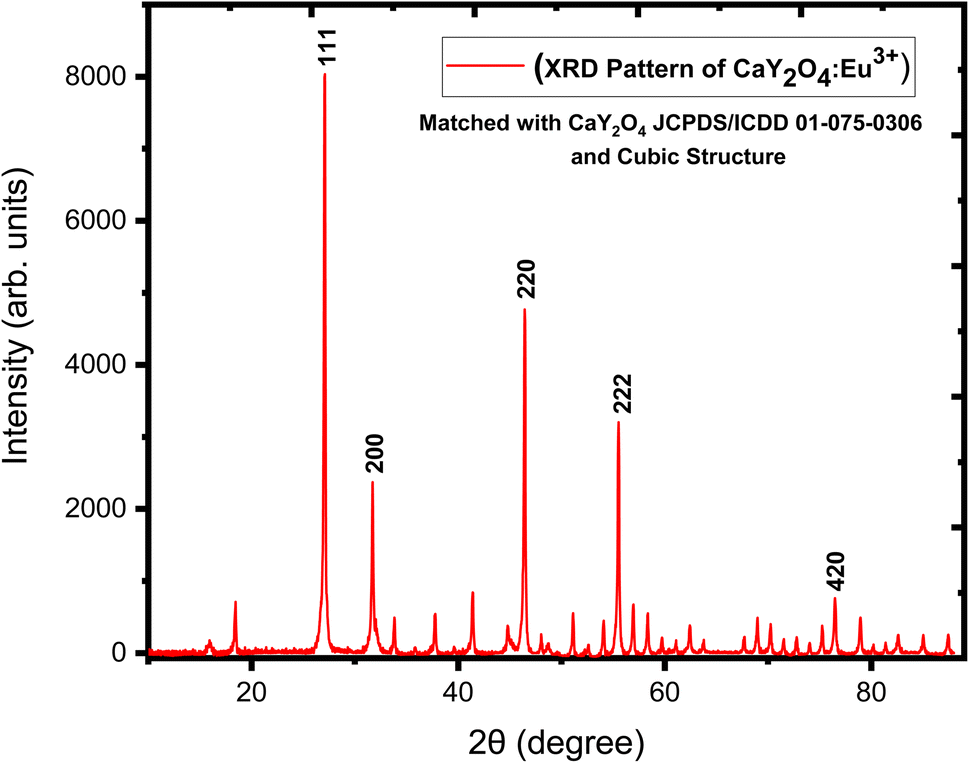 | ||
| Fig. 2 XRD pattern of CaY2O4:Eu3+. | ||
Scherrer's formula for the calculation of crystallite size is as follows:

In this context, the size of the crystallites is represented in this situation by the variable D. The FWHM is represented by the symbol β. The wavelength of the X-ray source is indicated by the symbol λ, while the diffraction angle is shown by the symbol θ. According to Table 1,
| D = (0.9 × 0.15409)/(RADIANS(0.19309) × COS(RADIANS(27.07759)/2)) |
| hkl | Peak position (2θ) | FWHM | Crystallite size D (nm) | Average size D (nm) |
|---|---|---|---|---|
| 111 | 27.07759 | 0.19309 | 42.32714752 | 43.113 |
| 200 | 31.7155 | 0.21663 | 38.1304235 | |
| 220 | 46.44312 | 0.19783 | 43.70569803 | |
| 222 | 55.52602 | 0.19785 | 45.38561618 | |
| 420 | 76.4881 | 0.21986 | 46.01642362 |
The average crystallite size is 43.113 nm.
3.2 Fourier transform-infrared spectroscopy (FTIR) analysis
The FTIR spectra of the Eu3+-doped CaY2O4 phosphor are shown in Fig. 3. It is observed that strong peaks occur at 415–447 cm−1 which are a characteristic of the Y–O vibrations.40 The medium sharp peak at 704 cm−1 corresponds to the O–Y–O deformation bond owing to the enlargement in the lattice of CaY2O4 after calcination. It can be noted that in the presence of O–Y–O, there is a vibration peak at 603 cm−1, Y–O vibration at 531 cm−1, and a stretching vibration at 490 cm−1.41,42 The sample showed a strong peak at 876 cm−1, which was assigned to the formation of CaY2O4.42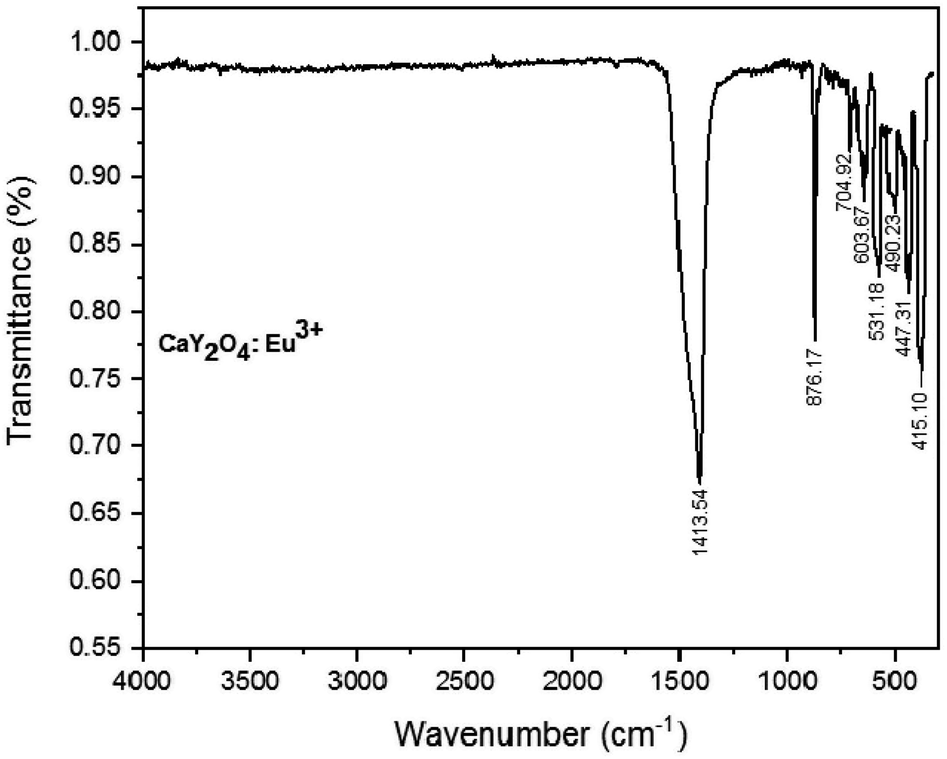 | ||
| Fig. 3 FTIR spectra of CaY2O4:Eu3+. | ||
3.3 SEM analysis
Fig. 4a–d show the SEM images collected under different resolutions of the Eu3+(2.0 mol%)-doped CaY2O4 phosphor. From the images, the shape and size of the synthesised phosphors were studied. The diagram depicts a diverse morphology and noticeably large grain size.23,26 The powders exhibit an uneven surface structure, indicating a propensity for grain growth and agglomeration at elevated temperatures. The distribution of grain sizes was wide, ranging from approximately 1 μm to 100 nm, with an average size falling within this range. Phosphor materials were synthesised at very high temperatures, which led to the formation of aggregates. The efficacy of luminescence may be reduced due to aggregation, which causes considerable dispersion of light. To increase the quality of phosphors and make them appropriate for use in solid-state lighting, a lengthy ball milling process is required to break up the aggregates. Here, at different resolutions of 1500–10![[thin space (1/6-em)]](https://www.rsc.org/images/entities/char_2009.gif) 000×, the morphology of the phosphor exhibited a distinctive cubic structure, providing compelling evidence supporting the structural analysis conducted on the synthesised phosphor using XRD analysis (Fig. 2).
000×, the morphology of the phosphor exhibited a distinctive cubic structure, providing compelling evidence supporting the structural analysis conducted on the synthesised phosphor using XRD analysis (Fig. 2).
 | ||
| Fig. 4 (a–d) SEM images of phosphor CaY2O4-doped with of Eu3+ (2.5 mol%) ion prepared here. | ||
3.4 Energy dispersive X-ray analysis (EDAX)
EDAX analysis can show the formation of elemental analysis in prepared phosphor. Fig. 5 shows an intense Ca (calcium) peak, an intense Y (yttrium) peak, and a peak from O (oxygen) with doping-ion Eu (europium), which confirmed that the phosphor was formed properly.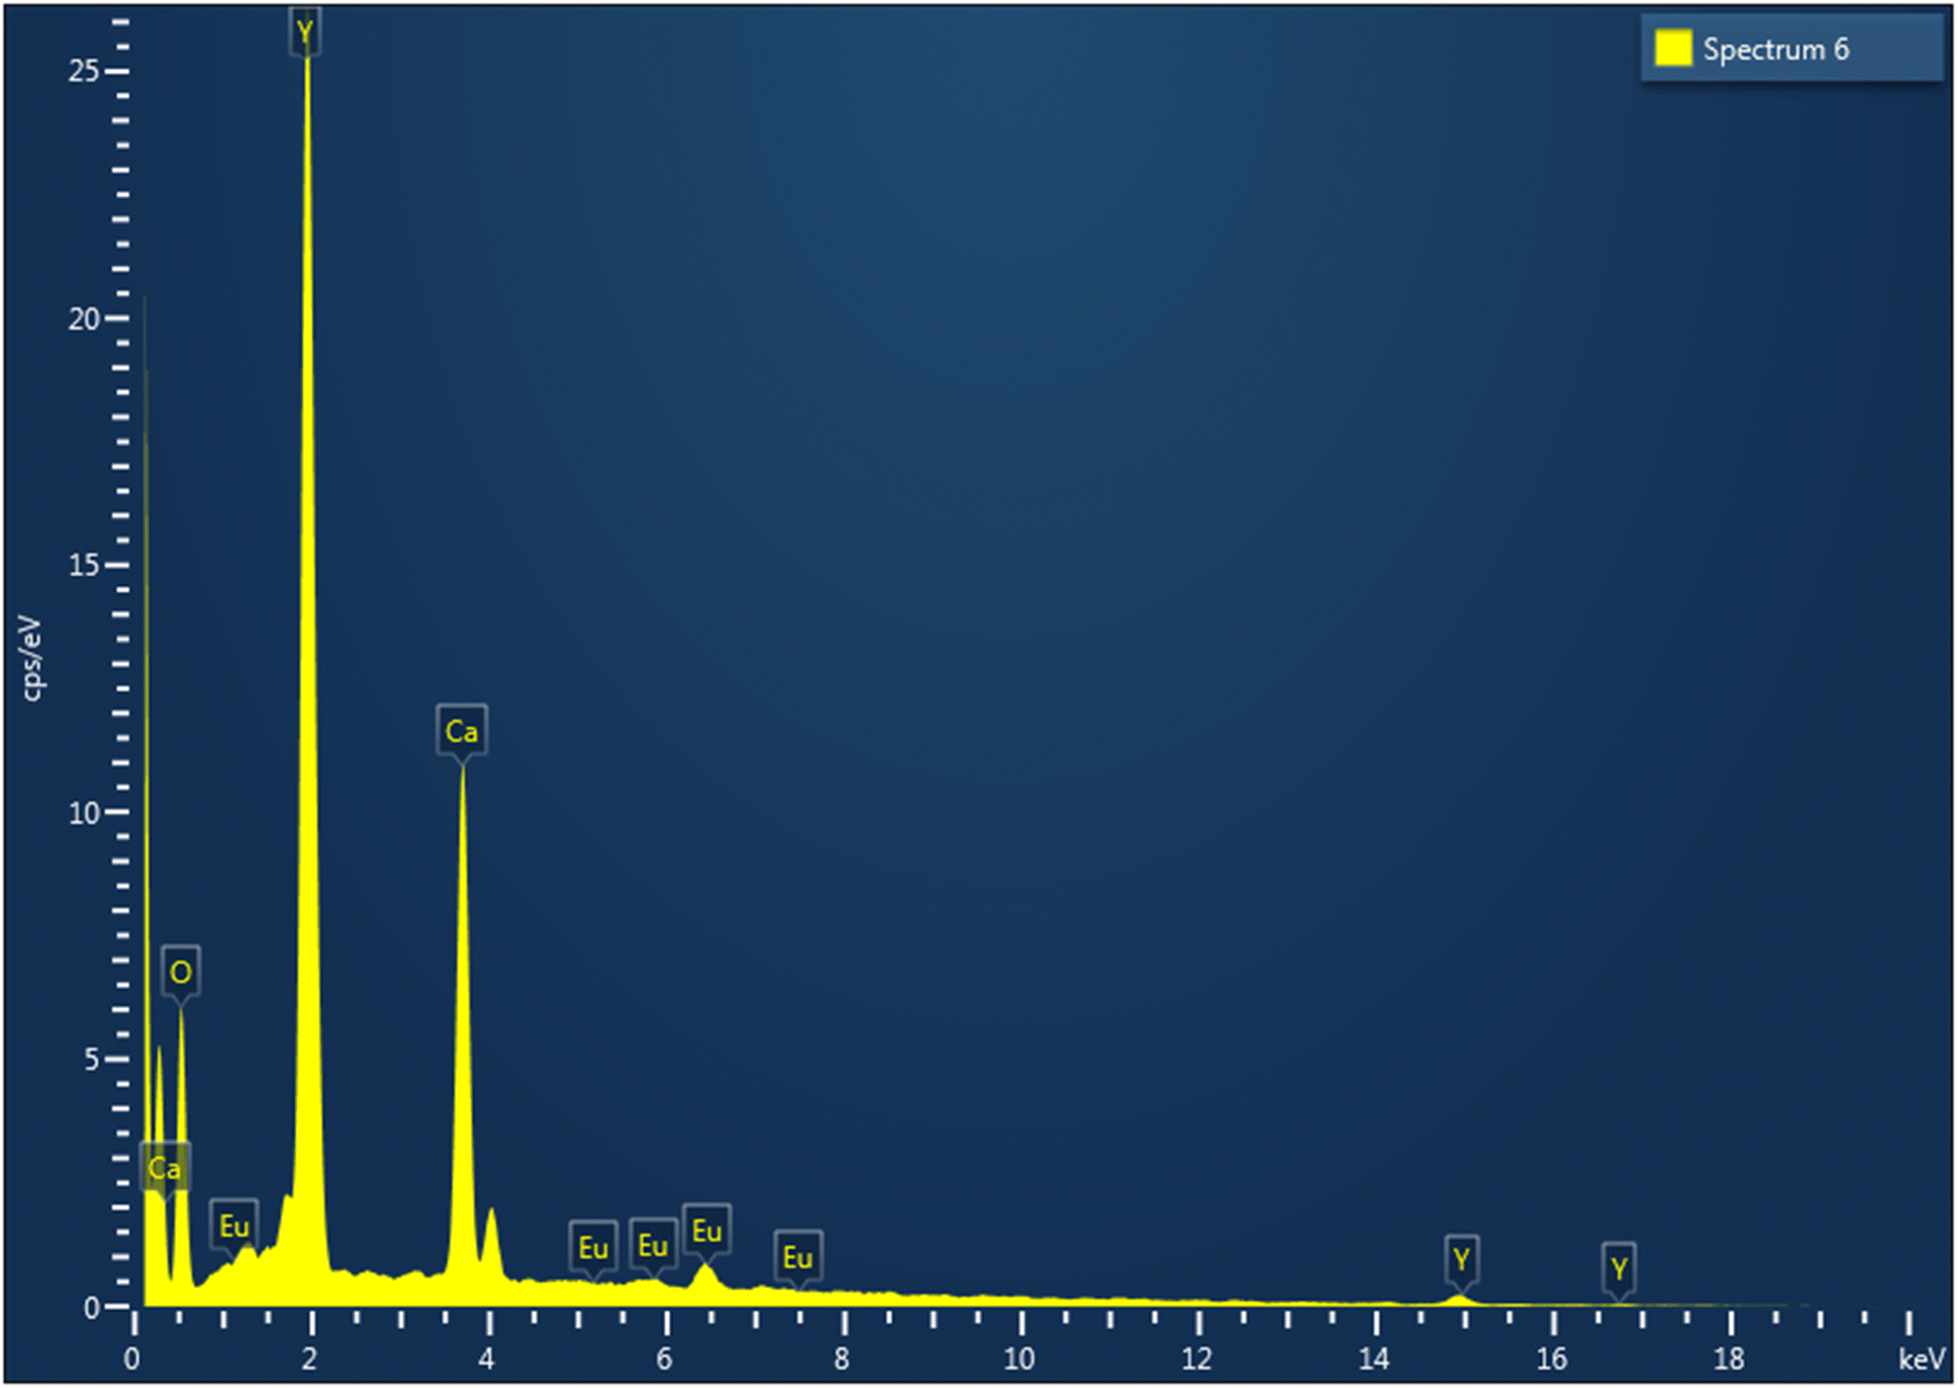 | ||
| Fig. 5 EDAX analysis of the phosphor CaY2O4:Eu3+ prepared here. | ||
3.5 PL studies
The excitation and emission spectra of CaY2O4 phosphor doped with Eu3+ are depicted in Fig. 6a and b, which represent the oxide forms of inorganic elements. An excitation spectrum was observed at 613 nm, with a significant peak at 247 nm. Upon excitation, the phosphor emitted a broad range of wavelengths spanning from 535 to 631 nm, with notable high-intensity peaks at 613 and 631 nm resulting from energy transfers.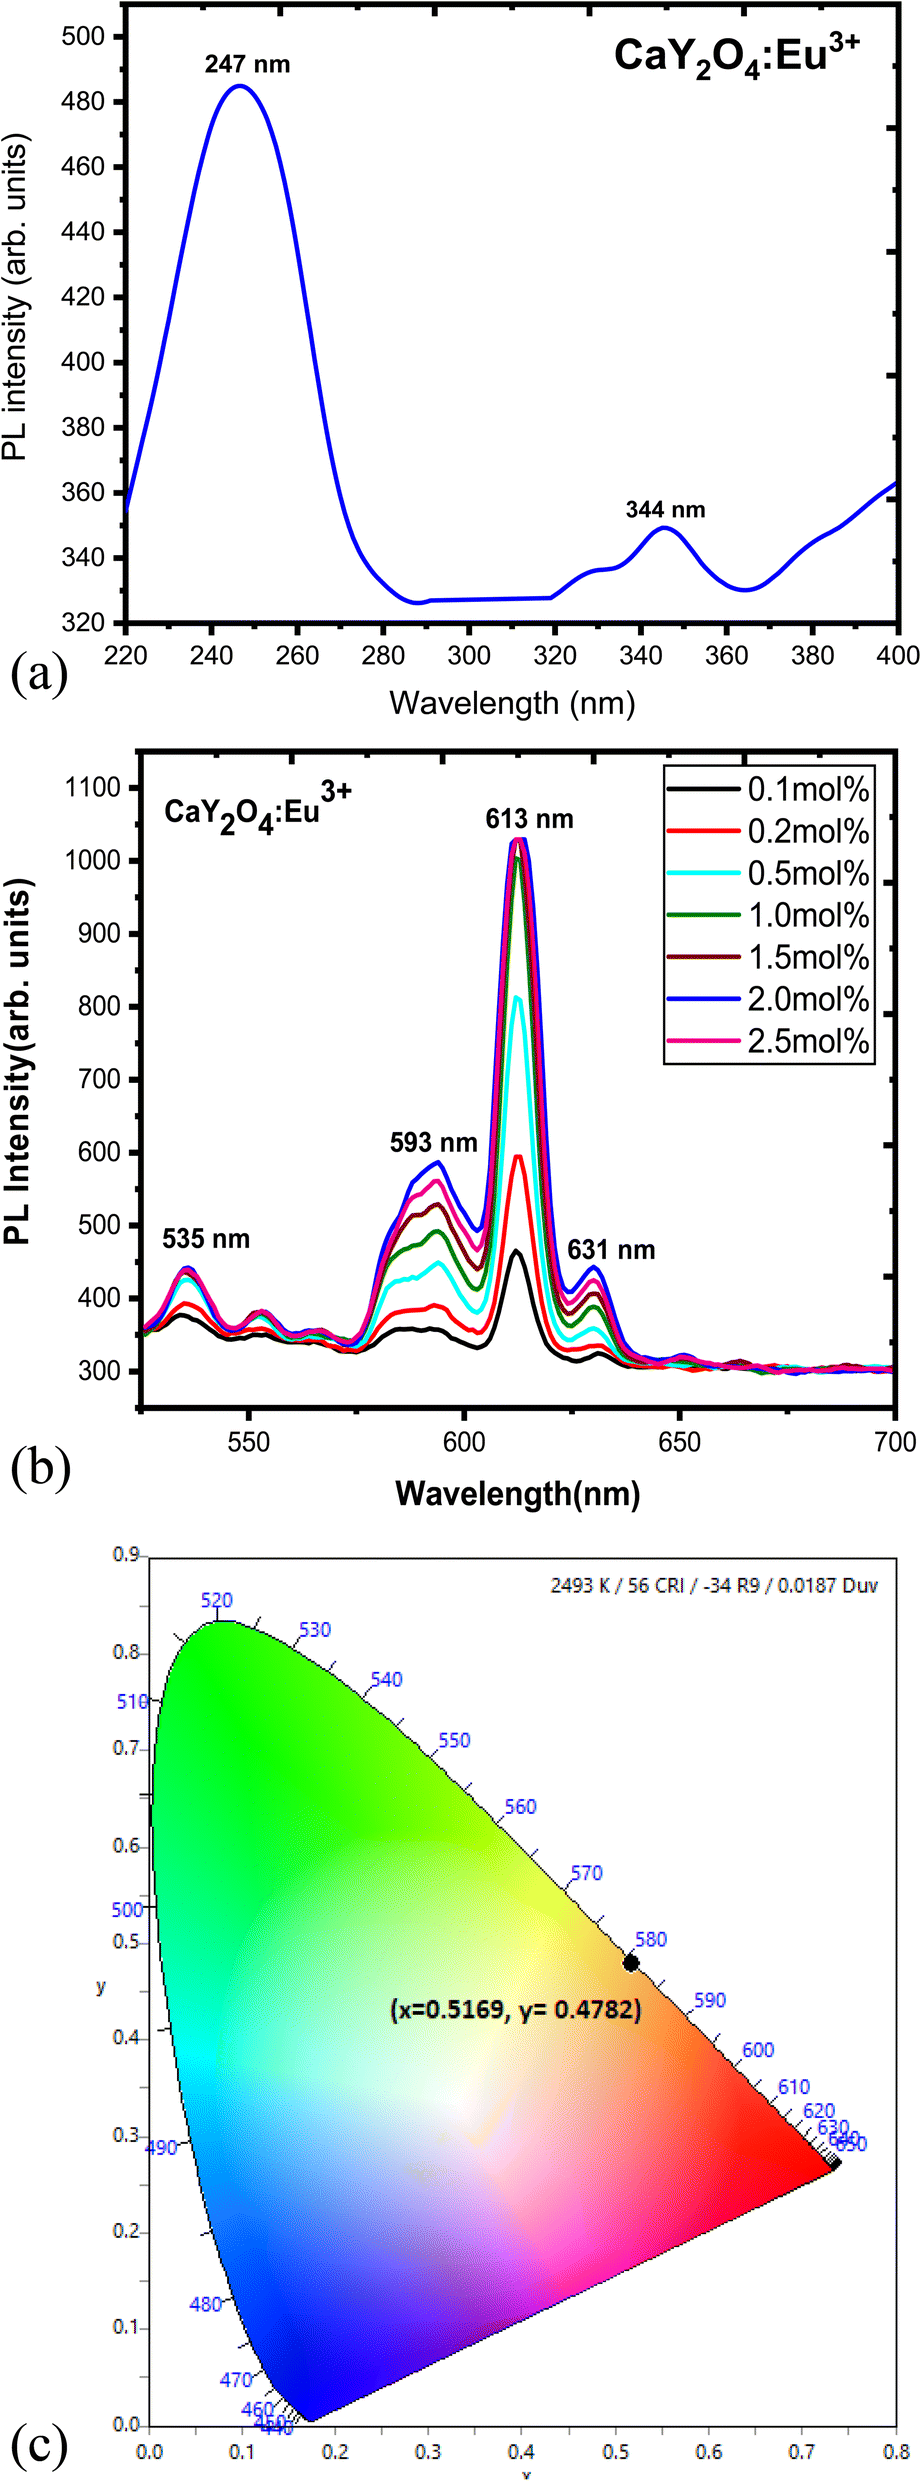 | ||
| Fig. 6 (a) PL excitation spectra of CaY2O4:Eu3+ at 2.0 mol%. (b) PL emission curve of CaY2O4:Eu3+ for (0.1–2.5) mol%. (c) Commission Internationale de I'Eclairage (CIE 1931) of CaY2O4:Eu3+ for 2.5 mol% (x = 0.5169, y = 0.4782). | ||
The excitation spectra of CaY2O4:Eu3+ phosphor were recorded by monitoring the Eu3+ 5D0 → 7F2 transition at 613 nm. A large peak at 247 nm was seen in the excitation spectra, followed by another broad peak at 344 nm due to the 7F0 → 5D4 transition. The maximum absorption intensity was observed at these two wavelengths. The excitation spectra (shown in Fig. 6a) included a prominent wide band with a peak at 247 nm, which is attributed to the charge transfer band (CTB) between Eu3+ and O2− neighbouring ions. Lines owing to the f–f transitions in the Eu3+ 4f6 arrangement were also seen at longer wavelengths.29,30
The emission spectrum of the phosphor was measured by exciting them with 247 nm, and the results are depicted in Fig. 6b. The spectrum comprises 5D0–7FJ (J = 1, 2, and 3) emission lines of Eu3+. When Eu3+ occupies a crystallographic position devoid of inversion symmetry, the red-forced electric-dipole transition 5D0 → 7F2 often dominates the emission spectrum. On the other hand, if the Eu3+ site has an inversion centre, the 5D0 → 7F1 orange emission dominates.31 The transitions from excited 5D0 to the 7FJ (J = 0–3) levels of Eu3+ ions produce distinctive emission lines within the 535–650 nm range. The placement of the Eu3+ ion in the CaY2O4 lattice, in combination with the selection criteria, determines the kind of transition from the emission levels to the terminating levels.32,33,36–39
The prominent peak at 613 nm is due to the electric dipole (ED) transition between the 5D0 and 7F2 levels, whereas the faint emission at 593 nm is due to a forced magnetic dipole (MD) transition process. The emission spectrum of the CaY2O4:Eu3+ sample displays peaks ranging from 535–650 nm, which arise from the 5D0 → 7FJ (J = 1, 2) transitions of Eu3+ ions upon excitation at 247 nm. The 535 nm, 613 nm, and 631 nm peaks are attributed to the ED transition of 5D0 → 7F1 and (5D0 → 7F2), respectively, with the 613 nm peak having twice the intensity of the 593 nm peak. The ratio of the 593 nm peak intensity to the 613 and 631 nm peaks is half, which differs from previous research findings. This suggests that the Eu3+ ions are located at a site with low symmetry in the CaY2O4 host, as the MD transition has a lower intensity than the ED transition. However, at a concentration of 2.0 mol% of Eu3+, concentration quenching occurs as a consequence of energy transfer between Eu3+ ions, and the peak locations of the emission spectra alter. Therefore, the CaY2O4:Eu3+ (2.0 mol%) phosphor could be a promising candidate for use in compact fluorescent lamps (CFLs) with excitation at 247 nm.
3.6 CIE coordinate
The peaks determined in spectrophotometry are put to the test by the CIE (Fig. 6c). Using a spectrophotometric technique and the spectrum energy distribution of the CaY2O4:Eu3+ sample, the CIE coordinates were calculated (Fig. 6). The Eu3+-doped sample has the colour coordinates of x = 0.5169 and y = 0.4782, which are near the orange-red spectrum of visible light. In accordance with the recommendations of the International Commission on Illumination (1931), a cross has been placed in the relevant area in Fig. 6c.27,28,34Fig. 7 shows the energy-level diagram of the Eu3+ ion in terms of the ED transition peak at 613 nm (5D0 → 7F2) and the dominant MD transition peak at 593 nm (5D0 → 7F1).
 | ||
| Fig. 7 Energy level diagram of CaY2O4:Eu3+. | ||
4. TL glow curve analysis
The TL glow curve of the CaY2O4:Eu3+ phosphor illustrates a linear response to UV treatment at a constant heating rate of 6.7 °C s−1 (Fig. 8). A good TL dosimeter peak can be seen at 225 °C as the TL intensity increases with UV exposure time (Fig. 8). This curve can be successfully theoretically and experimentally fitted using the CGCD method.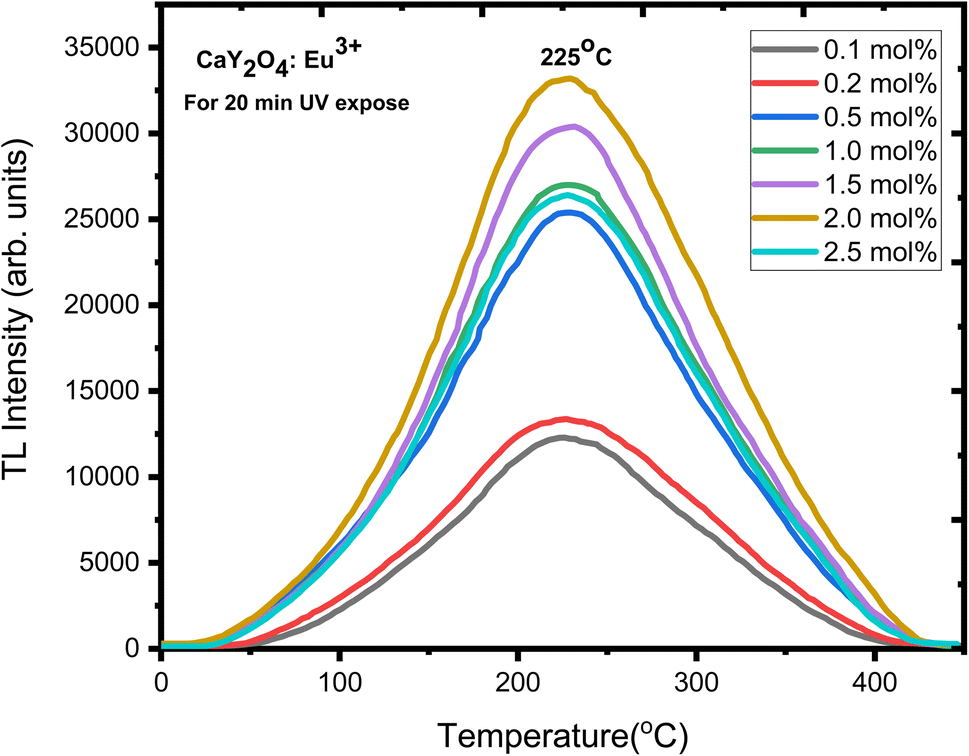 | ||
| Fig. 8 TL glow curve analysis of CaY2O4:Eu3+. | ||
Fig. 8 presents a distinct and wide TL glow curve with its peak centred at 225 °C. The intensity of the TL glow curve demonstrates an upward trend as the concentration of doping ions increases, reaching its highest point at 2 mol%. Concentration quenching caused a loss of intensity after going over the highest point. This particular TL glow curve was obtained after a 20 minute exposure to UV radiation and is considered suitable for dosimetry applications. The concentration versus intensity plot is shown in Fig. 9 for better understanding.
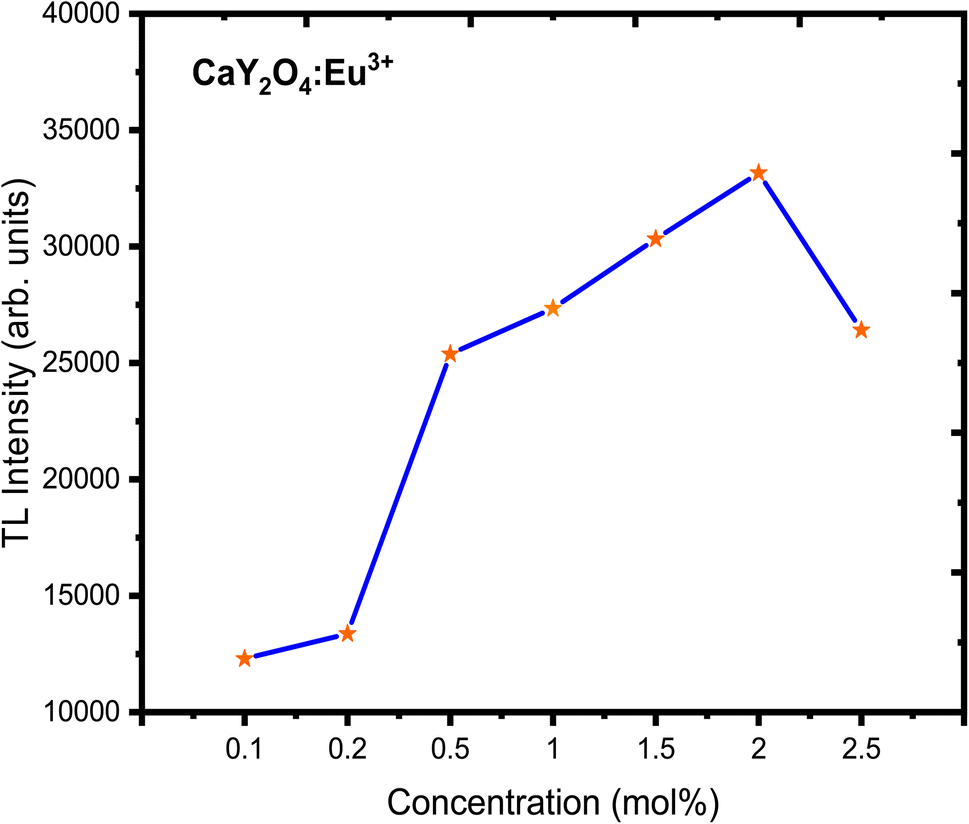 | ||
| Fig. 9 CaY2O4:Eu3+ concentration vs. intensity. | ||
As well-resolved broad TL glow curve was monitored in the dose versus intensity plot with various UV doses and 5–25 min UV exposure time (Fig. 10). Here, the intensity of the glow curve was measured at a fixed (optimised) concentration of 2.0 mol% of doping ion; it increased with increasing UV radiation exposure (Fig. 11). The well-resolved peak showed good linearity with the dose which showed the prepared phosphor could be useful for dosimetric applications.
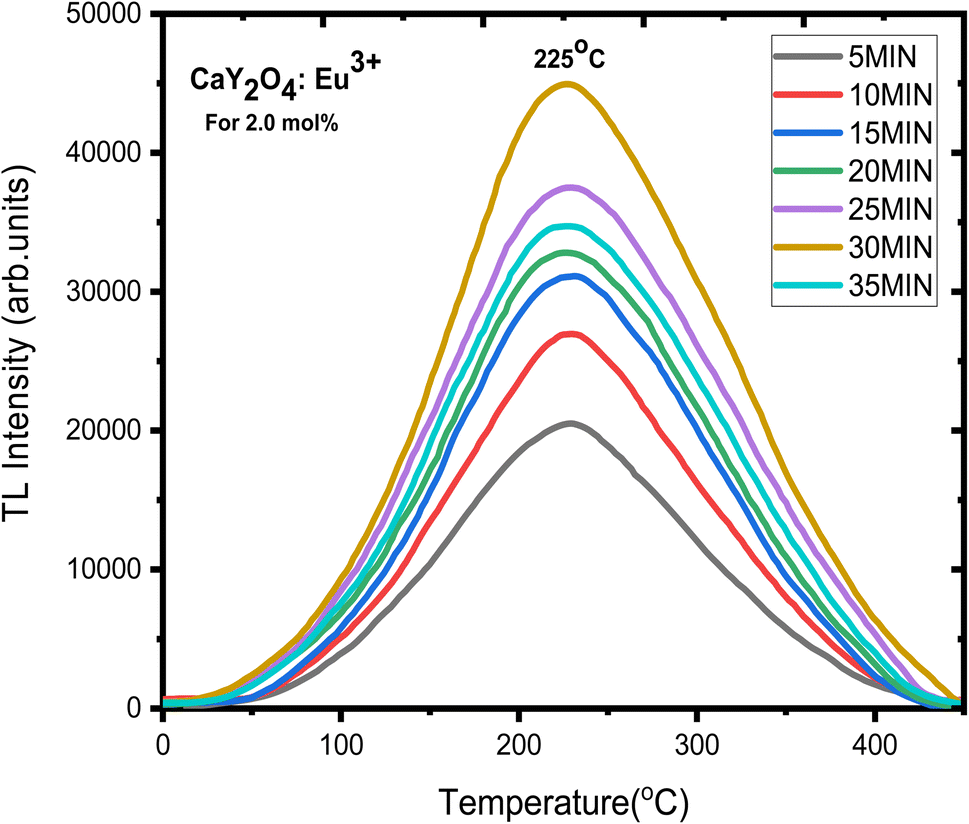 | ||
| Fig. 10 TL glow curve analysis of CaY2O4:Eu3+ for 2.0 mol%. | ||
 | ||
| Fig. 11 CaY2O4:Eu3+ phosphor TL glow curve dose vs. intensity plot. | ||
CGCD-fitted TL glow curves of CaY2O4:Eu3+ phosphor (Fig. 12) that were exposed to UV radiation for 20 minutes are shown in Fig. 10. Table 2 displays a variety of trapping characteristics, including activation energy, order of kinetics, and frequency factors. After being exposed to UV light, the prepared sample's trap depth decreased from 0.5 to 1.0412 eV as shown by the fit, suggesting the creation of shallower traps. Irradiation by the UV rays from a lower energy source would have resulted in the formation of shallow trap levels, where electrons need less energy to tunnel through the barrier and recombine; hence, activation energy is lower for UV-irradiated samples. Fig. 12 shows the CGCD pattern of the optimised concentration (2 mol%) of the dopant with 25 min of UV exposure time; this pattern was composed of five distinct peaks, and Table 2 shows the calculated trap parameters of the CGCD pattern (a value of merit is 1.09%). It shows that the first order of kinetic and activation energies vary from 0.5 to 1.0412 eV, and the frequency factor values are very high, i.e., 4.52 × 10⁸ s−1 for the second fitted peak.
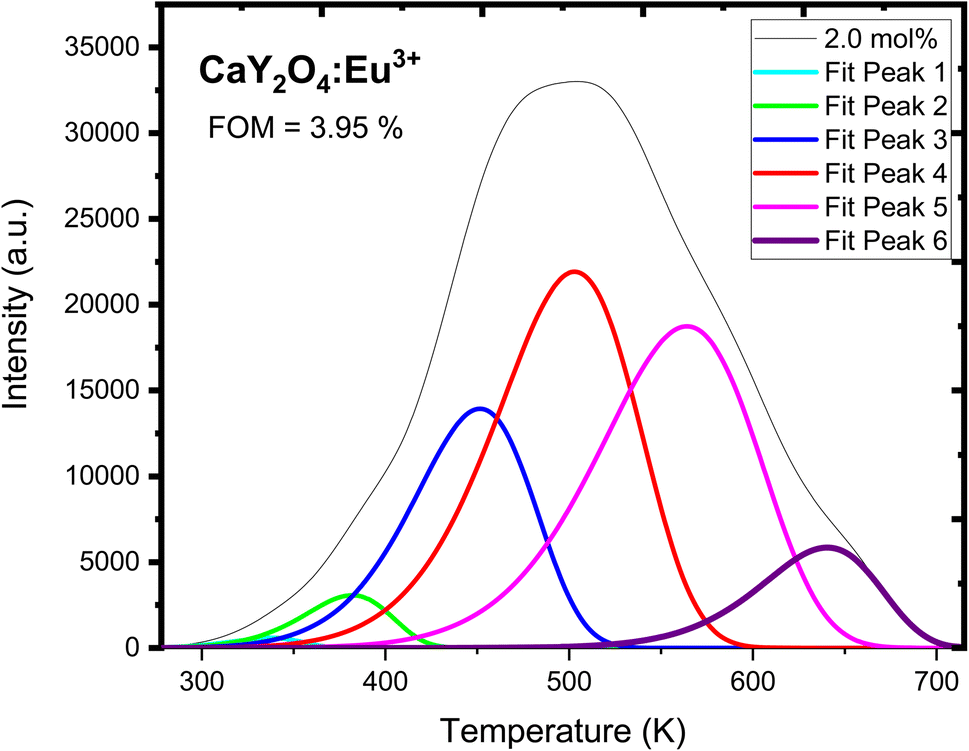 | ||
| Fig. 12 CGCD of UV-induced CaY2O4:Eu3+-doped phosphor for optimised UV dose and 2.0 mol% concentration. | ||
| T1 (K) | Tm (K) | T2 (K) | τ | δ | ω | μ = δ/ω | Activation energy (eV) | Frequency factor (s−1) |
|---|---|---|---|---|---|---|---|---|
| 311 | 338 | 359 | 27 | 21 | 48 | 0.4375 | 0.5 | 2.18 × 10⁸ |
| 350 | 382 | 406 | 32 | 24 | 56 | 0.4285714 | 0.5001 | 2.14 × 10⁸ |
| 406 | 452 | 485 | 46 | 33 | 79 | 0.4177215 | 0.5002 | 2.08 × 10⁸ |
| 452 | 503 | 543 | 51 | 40 | 91 | 0.4395604 | 0.5275 | 2.31 × 10⁸ |
| 505 | 564 | 608 | 59 | 44 | 103 | 0.4271845 | 0.5902 | 2.52 × 10⁸ |
| 597 | 640 | 673 | 43 | 33 | 76 | 0.4342105 | 1.0412 | 4.52 × 10⁸ |
5. Conclusion
CaY2O4:Eu3+ is a newly synthesised phosphor; the XRD analysis confirmed the existence of a single cubic crystalline phase with nanocrystalline behaviour. The surface morphology of the prepared phosphors was fine with a cube-like shape. Some vibration modes of Y–O, Ca–O, and Eu–O were observed in the FTIR spectra. Broad excitation for photoluminescence may be shown in the spectra with maxima at 247 and 344 nm. In the 247 nm-excited emission spectra, peaks at 535 nm, 593 nm, 613 nm, and 631 nm could be seen clearly, and the emission peaks were found to have corresponding transitions at 535 nm (5D0 → 7F0) and 593 nm (5D0 → 7F1), where the strongest peak was observed at 613 nm (5D0 → 7F2) and 631 nm (5D0 → 7F2). As a result, the phosphor exhibits remarkable colour constancy throughout its emission of light in the orange-to-red spectrum. The TL glow curve showed that the intensity of thermoluminescence increases with increasing UV exposure time and peaks at 225 °C, showing a good TL dosimeter peak. The kinetic parameters that were calculated for CaY2O4:Eu3+ phosphor by the CGCD technique were fitted using the CGCD technique, which resulted in a successful theoretical and experimental fit16 (Table 2).Conflicts of interest
There are no conflicts to declare.References
- F. Clabau, X. Rocquefelte, S. Jobic and M. H. Whangbo, et al., Chem. Mater., 2005, 17(15), 3904–3912 CrossRef CAS.
- Y. Li, M. Gecevicius and J. Qiu, Chem. Soc. Rev., 2016, 45(8), 2090–2136 RSC.
- Y. Liu, B. Lei and C. Shi, Chem. Mater., 2005, 17(8), 2108–2113 CrossRef CAS.
- B. Liu, C. Shi and Z. Qi, Appl. Phys. Lett., 2005, 86(19), 191111 CrossRef.
- J. Zhong, J. Chen, Q. Yang, C. Hu, J. Li and R. Duan, Appl. Phys. A: Mater. Sci. Process., 2018, 124 CAS.
- F. Clabau, X. Rocquefelte, T. Le Mercier, P. Deniard, S. Jobic and M. H. Whangbo, Chem. Mater., 2006, 18(14), 3212–3220 CrossRef CAS.
- D. Jia and W. M. Yen, J. Lumin., 2003, 101(1), 115–121 CrossRef CAS.
- J. Kuang, Y. Liu and J. Zhang, J. Solid State Chem., 2006, 179(1), 266–269 CrossRef CAS.
- J. Qiu and K. Hirao, Solid State Commun., 1998, 106(12), 795–798 CrossRef CAS.
- B. Zhang, X. Yu, T. Wang, S. Cheng, J. Qiu and X. Xu, J. Am. Ceram. Soc., 2015, 98(1), 171–177 CrossRef CAS.
- F. Liu, W. Yan, Y.-J. Chuang, Z. Zhen, J. Xie and Z. Pan, Sci. Rep., 2013, 3, 1554 CrossRef PubMed.
- A. S. Pradhan and R. C. Bhatt, Phys. Status Solidi A, 1981, 68(2), 405–411 CrossRef CAS.
- Y. Liu, J. Kuang, B. Lei and C. Shi, J. Mater. Chem., 2005, 15(37), 4025–4031 RSC.
- K. Van den Eeckhout, P. F. Smet and D. Poelman, Materials, 2010, 3(4), 2536–2566 CrossRef CAS.
- T. Wang, J. Gou, X. Xu, D. Zhou, J. Qiu and X. Yu, Opt. Express, 2015, 23(10), 12595–12604 CrossRef CAS PubMed.
- Y. Parganiha, J. Kaur, V. Dubey and K. V. R. Murthy, Mater. Sci. Semicond. Process., 2015, 31, 715–719 CrossRef CAS.
- V. Dubey, J. Kaur, S. Agrawal, N. S. Suryanarayana and K. V. R. Murthy, Superlattices Microstruct., 2014, 67, 156–171 CrossRef CAS.
- P. Tadge, I. R. Martín, S. B. Rai, S. Sapra, T. M. Chen, V. Lavín, R. S. Yadav and S. Ray, J. Lumin., 2022, 252, 119261 CrossRef CAS.
- Y. S. Jeon, S. Hwangbo and K. S. Hwang, J. Nanosci. Nanotechnol., 2019, 19(3), 1709–1713 CrossRef CAS PubMed.
- K. S. Hwang, Y. S. Jeon, S. Hwangbo and J. T. Kim, J. Nanosci. Nanotechnol., 2019, 19(4), 2431–2434 CrossRef CAS PubMed.
- A. R. Krasnaya, B. M. Nosenko, L. S. Revzin and V. Y. Yaskolko, Sov. Atom. Energy, 1962, 10, 625–626 CrossRef.
- B. E. Bjärngard, J.-S. Tsai, R. K. Rice and B. E. Bjarngard, Radiat. Res., 1989, 118, 195 CrossRef.
- T. Yamashita, N. Nada, H. Onishi and S. Kitamura, Health Phys., 1971, 21, 295–300 CrossRef CAS PubMed.
- R. Tamrakar, D. Bisen, K. Upadhyay and N. Bramhe, Superlattices Microstruct., 2015, 81, 34–48 CrossRef CAS.
- S. Ghorpade, R. Hari Krishna, R. Melavanki, V. Dubey and N. Patil, Optik, 2020, 208, 164533 CrossRef CAS.
- J. Kaur, Y. Parganiha, V. Dubey, D. Singh and D. Chandrakar, Superlattices Microstruct., 2014, 73, 38–53 CrossRef CAS.
- V. Dubey and N. S. Suryanarayana, J. Miner. Mater. Charact. Eng., 2010, 9(12), 1101–1111 Search PubMed.
- V. Dubey, J. Kaur, N. S. Suryanarayana and K. V. R. Murthy, Res. Chem. Intermed., 2013, 39, 3689–3697 CrossRef CAS.
- G. R. Dillip, S. J. Dhoble, L. Manoj, C. M. Reddy and B. D. Raju, J. Lumin., 2012, 132, 3072 CrossRef CAS.
- K. N. Shinde, S. J. Dhoble and A. Kumar, J. Rare Earths, 2011, 29, 527 CrossRef CAS.
- K. G. Lee, B.-Y. Yu, C.-H. Pyun and S.-I. Mho, Solid State Commun., 2002, 122, 485–488 CrossRef CAS.
- V. Dubey, J. Kaur, S. Agrawal, N. S. Suryanarayana and K. V. R. Murthy, Superlattices Microstruct., 2014, 67, 156–171 CrossRef CAS.
- M. R. Rao, et al., PL Studies of Eu Doped YPO4 Phosphor, Proc. of NCAPMS, 2013, pp. 212–213 Search PubMed.
- A. N. Yerpude and S. J. Dhoble, Luminescence Properties and Concentration Quenching of Sr5SiO4Cl6:Eu3+ Phosphor, Proc. of NCAPMS, 2013, pp. 157–159 Search PubMed.
- S. Shigeo and M. William, Phosphor Handbook, CRC Press, Washington, D.C., 1998 Search PubMed.
- S. Lu and J. Zhang, J. Lumin., 2007, 122–123, 500–502 CrossRef CAS.
- P. A. M. Berdowski, J. VanKeulen and G. Blasse, J. Solid State Chem., 1986, 63, 86 CrossRef CAS.
- X. Zhang and H. J. Seo, J. Alloys Compd., 2010, 503, L14 CrossRef CAS.
- V. Dubey, J. Kaur and S. Agrawal, Mater. Sci. Semicond. Process., 2015, 31, 27–37 CrossRef CAS.
- P. Apte, H. Burke and H. Pickup, Synthesis of yttrium aluminum garnet by reverse strike precipitation, J. Mater. Res., 1992, 7, 706–711 CrossRef CAS.
- M. Maheshwary, B. P. Singh and R. A. Singh, New J. Chem., 2015, 39, 4494–4507 RSC.
- M. Chroma, J. Pinkas, I. Pakutinskiene, A. Beganskiene and A. Kareiva, Ceram. Int., 2005, 31, 1123–1130 CrossRef CAS.
| This journal is © The Royal Society of Chemistry 2023 |