 Open Access Article
From waste to energy storage: calcinating and carbonizing chicken eggshells into electrode materials for supercapacitors and lithium-ion batteries†
Agnieszka Gabryelczyk *a,
Sudesh Yadav
 b,
Agnieszka Swiderska-Moceka,
Ali Altaeeb and
Grzegorz Lota
 *ac
*ac
aFaculty of Chemical Technology, Institute of Chemistry and Technical Electrochemistry, Poznan University of Technology, Berdychowo 4, 60-965 Poznan, Poland. E-mail: grzegorz.lota@put.poznan.pl; agnieszka.gabryelczyk@put.poznan.pl
bCentre for Green Technology, School of Civil and Environmental Engineering, University of Technology Sydney, 15 Broadway, NSW 2007, Australia
cŁukasiewicz Research Network – Institute of Non-Ferrous Metals Division in Poznan, Central Laboratory of Batteries and Cells, Forteczna 12, 61-362 Poznan, Poland
First published on 11th August 2023
Abstract
The presented study aims to explore the potential sources of common bio-wastes that could be successfully processed without any leftovers into materials for energy conversion and storage devices. We used chicken eggshells as an environmentally friendly precursor for electrode fillers in electrochemical capacitors (calcinated OS600 and OS900) and anode materials in Li-ion batteries (carbonized EM600 and EM900). Both groups of materials were obtained at two different temperatures to investigate the influence of their composition and properties on the electrochemical performance. Electrochemical capacitors with OS600 and OS900 substituted for 10 wt% of commercial activated carbon supplied similar capacitances, with OS600 stabilizing the long-term performance of the device. Also, both obtained anode materials are suitable for operation in Li-ion batteries, supplying a capacity of around 280 mA h g−1. Notably, EM900 is characterized by a well-developed structure, and as an anode, it exhibited better capacity retention of over 84%.
Introduction
Sustainability aims to preserve equal and uninterrupted access to all resources for the present and future generations. This task is not trivial due to the growing demand for food, drinking water, manufactured goods, services, and energy. Energy conversion is one of the main concerns of sustainability since it prevails in technological and scientific development, manufacturing, and daily life. However, most of the energy demand is satisfied by the combustion of fossil fuels, which creates pressure on the natural environment through mining and the generation of harmful gaseous products such as NOx and SOx. Reducing fossil fuel consumption for energy generation has become the focus of modern innovations. A visible result of these actions is a growing number of solar cells for both grid power and individual and the various wind and water-based power plants. Solar radiation, blowing wind, and masses of water accumulate a large amount of energy that can be accessed and converted into electricity without producing harmful byproducts. However, these environmentally friendly energy sources are limited by their periodic availability. Supporting renewable energy sources and power plants by storing surplus energy can overcome this issue.Many devices enable efficient storage and immediate recovery of accumulated energy through electricity. The most important ones are electrochemical capacitors and batteries. These two groups store energy following different working mechanisms. Batteries (e.g., lithium-ion batteries LIBs, lead–acid batteries LABs, nickel–metal hydride batteries, NiMH) alternately convert chemical energy to electricity based on various redox reactions. On the other hand, conventional electrochemical capacitors (ECs), also known as supercapacitors, usually store charged species electrostatically, forming a double layer at the electrode/electrolyte interface.1 Regardless of the working principle, both groups of devices display complementary properties and functions. Generally, batteries exhibit a higher energy density, so they are more suitable for long-term off-grid energy storage and charging/discharging at a moderate rate for a longer time.1,2 On the other hand, electrochemical capacitors (ECs) show high power density and power capability, while their energy density is usually lower.1,3 These characteristics of electrochemical capacitors make them suitable for rapid charging/discharging under demand for high current, as in regenerative braking and supporting battery packs in electric vehicles.1,4
In electrochemical power sources, the electrodes facilitate the transfer of electrons. They can store the charge physically by electrostatic force (EC) or chemically react with charge carriers and change their chemical composition to convert energy (batteries). Some capacitors (e.g., pseudocapacitors and hybrid capacitors) rely on both mechanisms, coupling electrostatic charge storage with faradaic reactions. Electrode materials are indispensable and belong to the most expensive components in electrochemical power sources. Reducing its cost lowers the price of the whole battery or electrochemical capacitor. Electrochemical capacitors and lithium-ion batteries (LIBs) rely on carbon derivatives as some of their electrodes of choice. Activated carbon commonly serves as a negative and positive electrode in EC, while graphite is an anode material in LIBs. The relatively cheap precursor of these electrode materials comes from carbon-rich organic wastes. To date, it has been successfully produced from various plant fibres,5–7 litchi shells,8 spent coffee beans,9 and many more.
Recent studies show that a new widely accessible, inexpensive, and non-toxic source of carbon can be chicken eggshells (EGS).10–15 EG consists of an outer layer of eggshell (OS) and an eggshell membrane (EM). The outer mineral layer comprises calcium carbonate, while the inner layer comprises carbon and heteroatom-rich proteins15 (Fig. 1). Both layers can be efficiently processed and reused: OS by high-temperature calcination producing calcium oxide14 (i), EM by carbonization and subsequent activation16 (ii). Products of these reactions are suitable for application in energy conversion and storage,12,14 membrane purification techniques,17 or even catalysis.18,19 Furthermore, even a non-processed EM is promising for multiple applications. Cleaned EM was used in a biocompatible piezoelectric nanogenerator,13 which could potentially work in small devices measuring heart rate or joint movements. Furthermore, the thinness and the porous free-standing structure of EM make it a potential separator for Li-ion batteries20,21 and supercapacitors based on neutral aqueous electrolytes.22 Calcinated EGS has been used as active anode material in the Li-ion capacitor.12 Furthermore, carbonized EM has served as an active material for electrodes in supercapacitors10 and anodes in both Li–S16 and Li-ion batteries.11
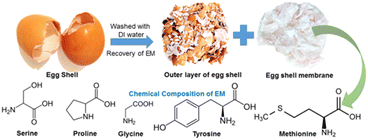 | ||
| Fig. 1 Separation of calcite-rich outer eggshell and inner membrane from the raw eggshell and the chemical composition of EM. | ||
The presented study exploits chicken eggshell-derived products as cheap bio-derived components for electrochemical capacitors and Li-ion batteries. The eggshell layers have been separated and applied in different energy storage devices to create tailored electrodes for each of them, with optimal composition and properties rivalling those of the commercial materials. The aim of such approach is to maximize the utilization of this waste material. The outer layer (OS) has been calcinated and used as a scaffold to increase the efficacy of activated carbon in electrodes for symmetric electrochemical capacitors, which is a novelty in the area of eggshell-based materials. This way, less activated carbon is required to achieve similar performance of an electrochemical capacitor. The carbonized inner layer (EM) has been used as the anode material in Li-ion batteries as a cheaper alternative to graphite. The study aims to explain the production technology of electrode materials from common bio-wastes and compare the physicochemical properties and applicability of the materials obtained under different thermal conditions. Furthermore, discussed results highlight the benefits of using bio-wastes as sustainable precursors of electrode materials for energy conversion and storage.
Results and discussion
Physicochemical characterization
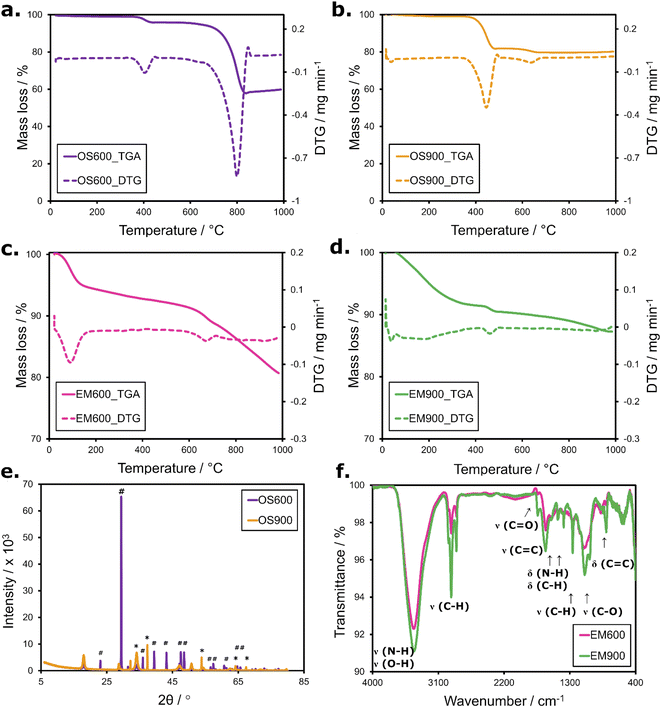
Thermogravimetric analysis (Fig. 2) of the obtained calcinated and carbonized materials consists of thermogravimetric curves (TGA) and derivative thermogravimetric curves (DTG). The measurement aimed to test the stability of the obtained electrode materials.Calcinated outer eggshells OS600 (Fig. 2a) and OS900 (Fig. 2b) undergo two decomposition stages. Both materials experience the first decomposition step at around 380–450 °C. It is attributed to the dehydration of calcium hydroxide Ca(OH)2. Generally, calcium oxide CaO readily absorbs moisture from the air to form Ca(OH)2, which decomposes above 350 °C.23 The measured mass loss is significantly higher for OS900 (mass loss of 25 wt%), which consists almost purely of CaO. The second step for OS600 occurs above 730 °C when calcium carbonate CaCO3 calcinates to CaO generating CO2.2 OS900 displays only a minor second decomposition step at 600 °C, responsible for only 1 wt% loss of the sample.
Carbonized EM600 (Fig. 2c) and EM900 (Fig. 2d) also undergo two visible thermal changes in the nitrogen atmosphere. In the case of EM600, the first process occurs between 70–120 °C and can be attributed to the evaporation of water and highly volatile matter. The second step begins above 640 °C and consumes approx. 10 wt% of the material indicates further carbonization of the remaining organic matter. EM900 undergoes the evaporation of water and volatile species around 50–90 °C, followed by a weak mass loss (around 2 wt%) around 470 °C, which could be related to a degradation of the remaining volatile matter. In both cases, there is a high amount of solid carbon-rich residue of 82 wt% for EM600 and 88 wt% for EM900. The mass loss of EM900 is lower than that of EM600 due to the production conditions of the material. Namely, EM900 reached a higher degree of carbonization during pyrolysis at 900 °C, when the organic substrate was subjected to dehydrogenation (i) and condensation of aromatic structure (ii), whose C–C bonds possess high energy and hence, are stable.24 Since processes (i) and (ii) proceed mostly above 600 °C, EM600 has a less condensed chemical structure, with characterized by aryl compounds losing their side chains.24 The overall residual mass of EM600 and EM900 at 1000 °C is high because it cannot combust in the nitrogen atmosphere. Over 80 wt% of solid residue indicates a high degree of carbonization and acceptable content of volatile organic matter in the obtained electrode materials.
The X-ray diffractogram (Fig. 2e) of OS600 confirms that this material consists primarily of polymorph calcite CaCO3, as the pattern obtained pattern matches the standard.14 Calcite crystals (label # on the diffractogram) grow typically for the compound, clearly favouring the plane (104) at the 2θ = 29.5°.12,14 The peaks are evident but much weaker, indicating the preferred orientation of the calcite crystals. All peaks are narrow, suggesting a regular well-developed crystalline structure. Calcinating the outer chicken eggshell at 900 °C changed the crystal structure and composition of OS900. CaCO3 was mostly converted to calcium oxide CaO (label * on the diffractogram). There is only a weak peak at 29.4° which suggests the presence of the remaining calcite phase. Very weak peaks at 34.2, 47.2, and 50.8° could be attributed to the formation of the Ca(OH)2 phase from CaO due to exposure to moisture from the air.25 The TGA data also support the presence of such a phase.
With the FT-IR spectra (Fig. 2f), we identified the characteristic bonds within the carbonized eggshell membrane EM600 and EM900. Both materials interact similarly with a light beam, resulting in almost overlapping spectra, which indicates their similar chemical structure. The bonding involves carbon, hydrogen, nitrogen, and oxygen. Strong and broad peaks at 3600–3100 cm−1 correspond to the stretching vibration of N–H and O–H bonds. Then follow medium, narrow signals from stretching vibrations of alkyl C–H bonds. Medium-intensity bands at 1628, 1555, and ∼810 cm−1 are related to the aryl C![[double bond, length as m-dash]](https://www.rsc.org/images/entities/char_e001.gif) C stretching mode. Carbon is also identified in other bonds: ketone group C
C stretching mode. Carbon is also identified in other bonds: ketone group C![[double bond, length as m-dash]](https://www.rsc.org/images/entities/char_e001.gif) O at 1738 cm−1 and alkyl C–H bond at 1460/1384 cm−1 (bending mode and stretching mode, respectively). Ma et al.15 and Xie et al.26 reported the presence of these bonds, similarly located in their material derived from the eggshell membrane. As the transmittance of EM900 is slightly lower than that of EM600 at all wavelengths, EM900 contains higher populations of bonds that absorb the incident light. Presumably, the reason lies in the higher carbonization of that bio-waste material.
O at 1738 cm−1 and alkyl C–H bond at 1460/1384 cm−1 (bending mode and stretching mode, respectively). Ma et al.15 and Xie et al.26 reported the presence of these bonds, similarly located in their material derived from the eggshell membrane. As the transmittance of EM900 is slightly lower than that of EM600 at all wavelengths, EM900 contains higher populations of bonds that absorb the incident light. Presumably, the reason lies in the higher carbonization of that bio-waste material.
Elemental analysis (Table 1) determined that the main components of the carbonized inner eggshell membranes EM600 and EM900 are carbon, nitrogen, and hydrogen. This result agrees with the FT-IR data, which detected the presence of functional groups and bonds involving these three elements. The carbon content significantly increases from 73.7 wt% to 81.3 wt% with the pyrolysis temperature because the high-temperature process ensures that organic wastes reach a higher degree of carbonization. However, there was no detectable sulfur or phosphorus in either sample despite the S- and P-rich proteins building the eggshell membranes. Likely, these elements evaporated during the carbonization of eggshell membranes, e.g., hydrogen sulfide H2S, released upon heating proteins above 350 °C.27
| Sample | C (%) | N (%) | H (%) |
|---|---|---|---|
| EM600 | 73.73 | 11.75 | 2.02 |
| EM900 | 81.30 | 6.77 | 1.67 |
Electrochemical performance
![[thin space (1/6-em)]](https://www.rsc.org/images/entities/char_2009.gif) :
:![[thin space (1/6-em)]](https://www.rsc.org/images/entities/char_2009.gif) 9. The tested ECs were labelled OS600+YP80F and OS900+YP80F, respectively. The calculated performance of ECs is summarized in Table S1 of the ESI.†
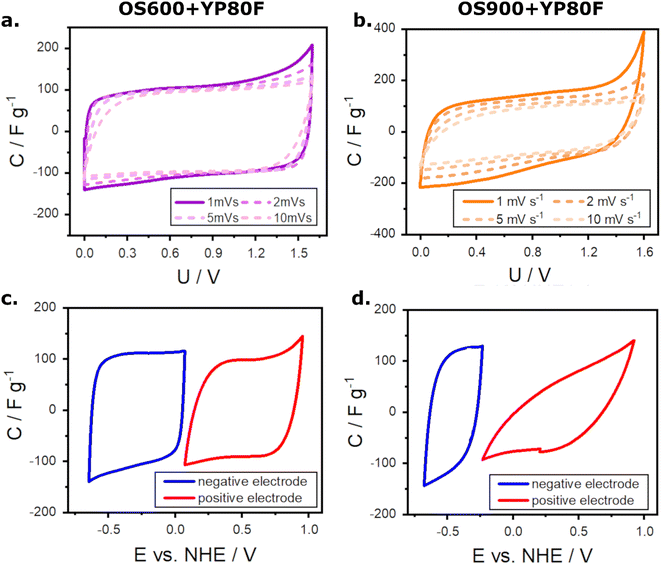
9. The tested ECs were labelled OS600+YP80F and OS900+YP80F, respectively. The calculated performance of ECs is summarized in Table S1 of the ESI.†The first test performed on ECs assessed the capacitance at different CV scan rates (Fig. 3a and b). At a lower scan rate, both supercapacitors exhibit typical capacitance for symmetric ECs with electrodes made of YP-80F in an aqueous electrolyte of 1 M Na2SO4, which falls around 109–125 F g−1.28,29 Comparison of the Fig. 3a and b show that the substitution of 10 wt% of YP-80F with OS600 improves the long-term term and high-scan rate specific capacitance of the ECs, compared to the substitution with OS900. Likely, it is a result of a higher conductivity of CaCO3 (OS600) than CaO (OS900). Although the initial capacitance of OS900+YP80F at 1 and 2 mV s−1 is higher than that of OS600+YP80F (131.4 and 111.7 F g−1 vs. 107.6 and 101.5 F g−1), the tendency changes to the opposite one at higher rates. The capacitance of OS600+YP80F at a scan rate of 5 mV s−1 equals 94 F g−1 while that of OS900+YP80F to 91 F g−1. This discrepancy grows with the increasing scan rate. The values finally drop to 47 and 27 F g−1 at a scan rate of 100 mV s−1, respectively. Moreover, modification with OS600 results in a regular, rectangular shape of CV curves, while OS900 accelerates oxygen evolution above the voltage of 1.3 V. The test showed that the modification with OS600 prevents fast degeneration of the material, reduces the internal resistance, and maintains acceptable capacitance retention at moderate scan rates.
Three-electrode measurements (Fig. 3c and d) indicate that modification of electrode material with OS600 allows for keeping low internal resistance of the electrodes, which can be ascribed to the well-shaped rectangular voltammograms. On the other hand, the presence of OS900 caused a sharp increase in the internal resistance, which is indicated by the shape of the voltammograms. The other visible effect is a shift in the working potential. The negative electrode in the OS900+YP80F supercapacitor works in a narrower area. These observations are related to reduced capacitances of the negative and positive electrodes.
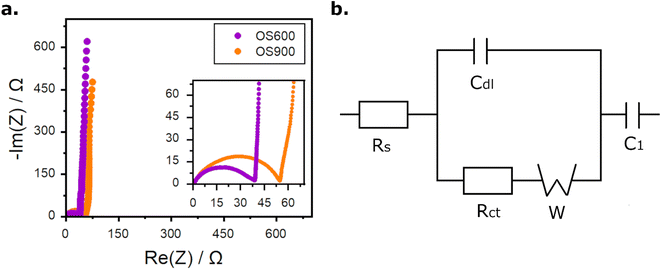
Fig. 4a presents the impedance spectra of both ECs in the form of Nyquist plots. Both plots have a similar shape and consist of two main areas. At high frequencies, there is a half-circle, followed by a short steep slope related to the diffusion of ions in a porous material and a long, nearly vertical line at low frequencies related to the capacitive performance of the ECs. Such plots are typically encountered in the case of ECs.30–32 The most accurate fitting of the impedance spectra was obtained for an equivalent electrical circuit depicted in Fig. 4b. It consists of an element R1, ascribed to the electrolyte and separator resistance (ohmic resistance). The next element, Cdl, refers to the capacitance of the double layer, which forms on the electrolyte/electrode interface. Rct is attributed to the charge transfer resistance through that interface. An element W, the so-called Warburg impedance, is in the intermediary frequencies. It indicates that the process occurring in this area is hindered diffusion through a porous material. However, low values of element W suggest that the resistance of this element is not significantly disturbing the operation of EC. At low frequencies, the diffusion element transits to C1, which is responsible for the capacitive behaviour of the device. The fitting procedure revealed that OS600+YP80F exhibits lower ohmic and charge transfer resistances than OS900+YP80F (0.399 and 36.2 Ω, respectively, for OS600−YP80F; 0.463 and 53.3 Ω for OS900+YP80F). Presumably, the lower resistance of OS600+YP80F result from better wetting of a carbon material modified by hydrophilic calcium carbonate and ionic conductivity of this salt, which is higher than that of calcium oxide. However, the capacitive behavior of the material reflected by C1 is more prominent for OS900+YP80F with 0.355 F, while it equals 0.269 F for OS600+YP80F. This result could be justified by stronger electrostatic interactions found in calcium oxide, the component of OS900.
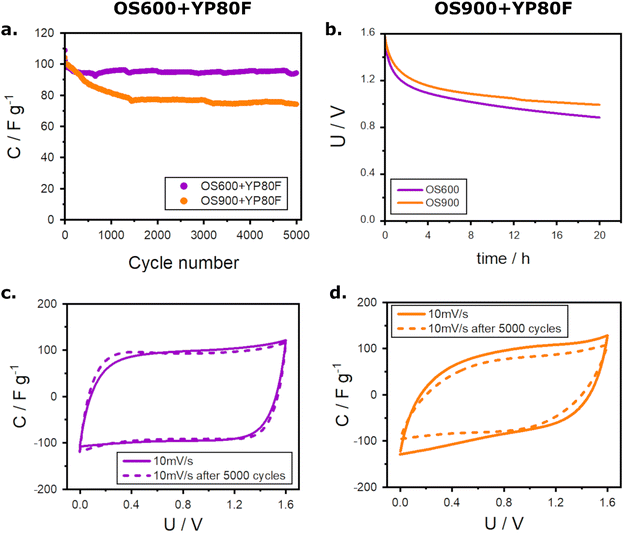
A performance test followed the above-described measurements. It comprised cycling under a load of 1 A g−1 (Fig. 5a), self-discharge of the ECs over the time of 20 h (Fig. 5b), and the comparison of cyclic voltammetry at a scan rate of 10 mV s−1 before and after 5000 cycles at 1 A g−1 (Fig. 5c and d). The cyclic performance of OS600+YP80F is uniform throughout the 5000 cycles, with a high retention of capacitance reaching 87% (initial capacitance ∼ 108 F g−1; the final one ∼ 94 F g−1). The undesired capacitance fading upon cycling is greater in the case of OS900+YP80F. The capacitance of this EC decreases gradually during the first 1500 cycles until the loss reaches 29% (from ∼104 to ∼75 F g−1). Still, it stabilizes afterwards, and this value remains similar for the remaining cycles. The operational stability of the electrochemical capacitors was estimated based on their self-discharge (Fig. 5b). The self-discharge is slightly slower in the presence of OS900 in the electrode material. The values measured for OS900+YP80F dropped from the initial 1.60 V to 1.33 V after 1 h, 1.13 V after 5 h, and 0.99 V after 20 h. In the same time intervals, the self-discharge of the OS600+YP80F capacitor was 1.25 V, 1.07 V, and 0.89 V, respectively. This parameter depends strongly on charge redistribution.33 It is affected by pores size, shape, and distribution and by the adsorption properties of the electrode material.34 Finely powdered OS900 could adjust the pore size of activated carbon and improve the adsorption of the charged species. Furthermore, OS900 composed of CaO is strongly electrostatic, which could improve self-discharge of the EC. Lastly, the final test was to evaluate the integrity of the electrodes after the performance test and the capacitance retention. The cyclic voltammograms show that substituting activated carbon with OS600 (Fig. 5c) prevents performance loss and resistance growth while cycling. Moreover, the CV curve of this EC retains its proper rectangular shape after cycling and almost overlaps with the previous one. On the other hand, modification with OS900 (Fig. 5d) is less beneficial for extensively cycled electrochemical capacitors. It causes a significant ohmic drop, and the capacity loss exceeds 20%.
Table 2 presents the estimated values of the contact angle of aqueous electrolytes on electrodes made of YP80F, OS600+YP80F, and OS900+YP80F. Due to the large content of the commercial activated carbon, binder, and carbon black, all contact angles are similar. Only the presence of OS600 in the electrode material slightly decreased the contact angle of the EC electrolyte on the electrode surface. Since calcite, which constitutes the main component of OS600, is strongly hydrophilic, a drop of water on the surface of the pressed calcite pellets produces low contact angles.35,36 Presumably, a slightly better wettability of OS600+YP80F could be ascribed to the hydrophilic properties of calcite. As the capacitance of OS600+YP80F becomes higher than that of OS900+YP80F at faster scan rates (CV), and at higher loads (GCPL), it could be explained as a result of improved wetting of the porous material (Table S1†).
| Sample | YP80F | OS600+YP80F | OS900+YP80F |
|---|---|---|---|
| Contact angle [°] | 82 ± 2 | 79 ± 2 | 81 ± 2 |
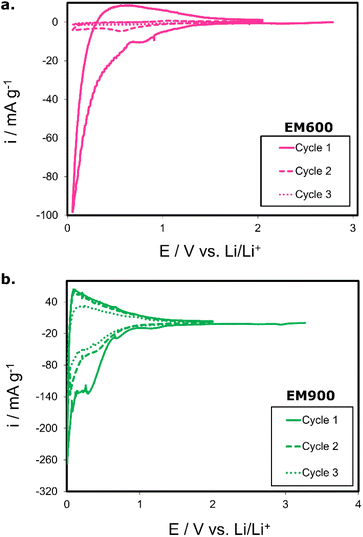
Fig. 6a illustrates voltammograms of the EM600-based electrode. The first charging causes a sharp decrease in the cathodic current (to −100 mA g−1). A small peak at around 0.73 V vs. Li/Li+ is attributed to the solid electrolyte interphase (SEI) formation. The SEI growth is irreversible and leads to the initial consumption of Li+ and some electrolytes. The SEI formation results in a significant irreversible capacity after the first cycle. Afterwards, the cathodic current decreases steadily until the lower potential limit is approached. Comparing the three following cycles reveals that the intercalation process is not fully reversible. Li+ intercalates the bio-derived carbon material during the first cycle, although the lack of distinct intercalation peaks suggests the process is hindered. The latter two cycles do not overlap with the first one, and the low currents indicate a slow kinetics of undergoing processes. A half-cell with EM600 displays a high irreversible capacity resulting from Li+ not being fully removed from the material. It is probably caused by the poorly developed structure of the material without condensed aromatic rings and a moderate degree of carbonization, which were noticed based on the physicochemical analysis of the material. The other material, EM900, is characterized by significantly better stability (Fig. 6b). The current fading after the first cycle is small, indicating quite low irreversible capacity. In the first cycle, a signal indicates the formation of the SEI (a small peak around 0.70 V vs. Li/Li+). Consecutive cycles do not repeat such behaviour, meaning that SEI formation progresses appropriately during the initial phases of the battery operation and consumes only a relatively small fraction of Li+. The peaks attributed to the intercalation process are observed during charging (cathodic process) below 0.30 V vs. Li/Li+, which is typical for carbon-based materials.37 Several peaks at low potentials (around 0.30 V, 0.22, and 0.08 V vs. Li/Li+) suggest a well-developed intercalation progressing in stages. The intercalation process is reversible, which justifies a peak around 0.25 V vs. Li/Li+. Similar behaviour repeats over the second and third cycles.
Moreover, the difference between the voltammetric curves of the second and third cycles is negligible. This electrochemical behaviour describes well-developed active material where Li+ transport undergoes in both directions without unacceptable charge loss. Compared with EM600, EM900 exhibits better stability over cycling with a smaller irreversible capacity after the first cycle and lower current response fading. All listed phenomena warrant reversible intercalation, and thus, they should account for a more stable long-cycling performance. The better intercalation characteristics are related to a higher degree of carbonization and condensation of EM900 resulting from a higher temperature of bio-wastes pyrolysis.
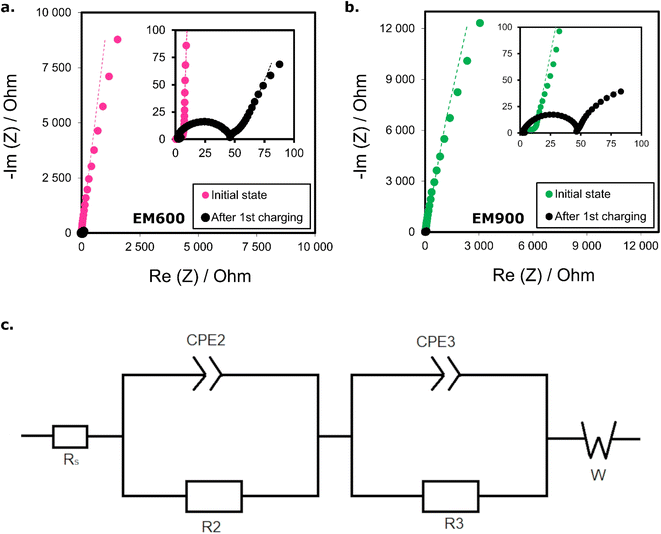
Fig. 7 presents the Nyquist plots of EM600 and EM900 half-cells. The measurement was performed twice for each anode material: on a freshly assembled cell and directly after the first charging. The spectra of anode materials EM600 (Fig. 7a) and EM900 (Fig. 7b) strongly resemble each other in both states. After assembly, the Nyquist spectra consist of a small semi-circle related to the charge transfer process and a long inclined line attributed to the anode's diffusion process and capacitive behaviour. The overall impedance is higher for a freshly assembled EM900 cell. After the EM600 and EM900 half-cells are charged, the resistances of the first semi-circles grow significantly, although the overall cell resistance drops sharply. In the charged (intercalated) state, there is only a slight difference between the shape of the impedance spectra of both cells. The first semi-circle has a similar impedance for both EM600 and EM900.
The Nyquist plots were fitted using the EC-Lab software to an equivalent circuit shown in Fig. 8c. Beginning from the high frequencies, the element Rs is attributed to the resistance of the electrolyte. Its values are generally small, here: close to 2 Ω for both half-cells. Next come the elements R2 and CPE2, which reflect together the first semi-circle. R2 is ascribed to the resistance of the electrical double layer, which forms on the electrolyte/electrode interface. It reaches 1.41 Ω for EM600 and 4.32 Ω for EM900. CPE2 informs of the capacitance of this double layer. Both of them could be attributed to the SEI formation.38 R3 and CPE3 could be attributed to the charge transfer resistance and capacity. R3 values equal 39.97 Ω for EM600 and 37.09 Ω for EM900. The SEI formation and charge transfer process explain the visible enlargement of the first semi-circles in the Nyquist plots after charging. W is a Warburg impedance which here describes a solid-state diffusion of lithium ions through the pores of the materials.
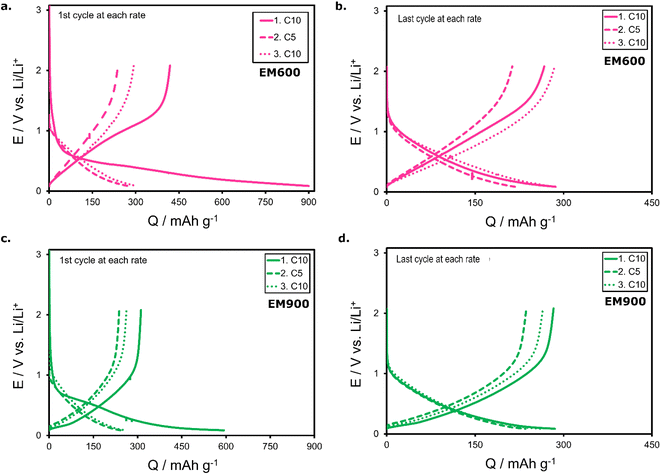 | ||
| Fig. 8 Charging and discharging profiles of the first the tenth cycle of C/10 for EM600-based cells (a and b – respectively) as well as for EM900-based cells (c and d – respectively). | ||
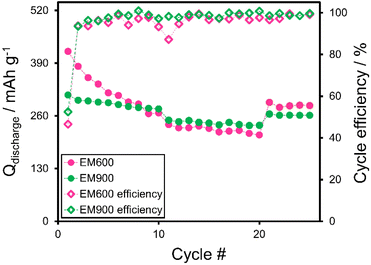
Galvanostatic charge/discharge was carried out to test the performance of both active materials. Initially, the cells were subjected to ten cycles at the current responding to the C/10, followed by ten cycles of twice faster charging and discharging at C/5. Finally, the procedure was finished with five cycles at C/10 to check the capacity retention at the end of cycling. Fig. 8 compares the charging/discharging profiles of the first and the last cycles performed at various C-rates. Fig. 8a and b present EM600 half-cells (first and final cycles at each rate, respectively), while Fig. 9c and d show the profiles for EM900 half-cell (first and final cycles at each rate, respectively). The first significant difference between the EM600 and EM900-based cells is the amount of the consumed charge (Fig. 8a and c). At the first C/10 cycle, EM600 charge capacity reaches 899.7 mA h g−1, but it supplies only 418.9 mA h g−1 upon discharge. The discrepancy is lower for EM900, with 592.8 mA h g−1 (charge) and 311.5 mA h g−1 (discharge). Initially, both cells lose around half the received charge, dissipating mostly on the SEI formation. To a lesser extent, some of the lithium ions may remain captured within the pores of the carbon material. Another difference between EM600 and EM900 is the shape of the first charging/discharging profiles. The curves are steeper in the case of EM600, which implies a faster potential fading of the cell. In all presented cases, the discharge capacity decreases with the increasing C-rate. It occurs because the lithium ions have less time for deintercalation from the electrode's pores. At C/5, the average discharge capacity of EM600 is 225.9 mA h g−1, while 242.3 mA h g−1 for EM900. Likely, the better-developed structure of highly carbonized EM900 opens clearer pathways for Li+ diffusion. Moreover, the cycling test reveals better capacity retention of EM900, as the difference between the first and the last cycles of each cycling step is much lower than for EM600. It proves that the capacity retention of the EM900 is superior to EM600, reaching 84% for the former and only 68% for the latter at the end of the cycling test.
Fig. 9 illustrates the discharge capacities and cycle efficiencies of the EM600 and EM900. The values confirm that EM900 operates with better stability and endures faster rates with less charge loss. EM600 loses around 30% of the initial discharge capacity during the first five cycles at C/10. The discharge capacity drops from 418.9 mA h g−1 to 267.2 mA h g−1 after only 10 cycles at C/10. In the case of EM900, the respective values reach 311.5 mA h g−1 and 277.3 mA h g−1. Moreover, intercalation degree x highlights the superior capacity retention of the EM900, which can be observed in closer-packed curves and smaller values of the cumulative intercalation degree. EM600 is characterized by a high initial charging capacity, which cannot be successfully utilized during the discharge. Furthermore, the discharge capacity of EM600 is lower than that of EM900 at the rate of C/5, which could indicate a worse rate capability. After the first formation cycle, cycle efficiencies, calculated as a quotient of discharge and charge capacities, are high for both half-cells (>85%), with being superior for the more stable EM900 (>94%, average 98.5% from the second to last cycle). Conversely, EM600 consumes more current to become fully charged than during discharging.
Conclusions
In the study, we present the methods to reuse the bio-wastes such as eggshells. This sustainable and plentiful resource was converted into calcinated (outer eggshells) and carbonized (inner membranes) materials for energy storage devices. The first was used as an inert filler/scaffold in supercapacitors to substitute for activated carbon. The resulting electrodes contained less commercial activated carbon without a significant performance loss to the electrochemical capacitor. Furthermore, they were compatible with the salt-based aqueous electrolyte of Na2SO4, which is far more sustainable and less expensive than acid, alkaline, and organic electrolytes. The other material was directly employed for the anode in lithium-ion batteries. Satisfying discharge capacity and relatively stable performance of EM600 and EM900 should be an incentive to pay more attention to the eggshell membrane-based anodes.Additionally, the calcination and carbonization processes were carried out at two different temperatures: 600 and 900 °C, which affected the physicochemical and electrochemical properties of the obtained products. OS600, rich in calcite and manufactured at a lower temperature, stabilized the cyclic performance of electrochemical capacitors and improved capacity retention. On the other hand, more stable performance as an anode in Li-ion batteries exhibited EM900, even though both carbonized anode materials supplied similar capacities at the discharge (EM600: ∼280 mA h g−1 at C/10 and ∼225 mA h g−1 at C/5; EM900: ∼270 mA h g−1 at C/10 and ∼240 mA h g−1 at C/5). The higher temperature of carbonization increases the cost of the material but affects the structure of the material, making it richer in carbon with condensed aromatic rings. Hence, better operation stability of EM900-based Li-ion cell. An unquestionable advantage of waste-derived electrode materials in supercapacitors and Li-ion batteries is their low price and wide availability. Such materials help reduce the amount and volume of waste that restaurants and households inevitably produce. Furthermore, the resulting electrode materials are cheaper than the commercially available activated carbons and graphites due to a cost-effective raw material and moderate thermal conditions of their processing.
Experimental
Fabrication of the active materials
Used raw chicken eggshells (EGS) were collected from local restaurants in Sydney. Initially, the ES was cleansed using tap water to remove the dust. Subsequently, they were washed with distilled water (DI) and soaked in hot DI for 30 minutes to facilitate the separation of the outer layer of eggshell (OS) from the eggshell membranes (EM).13,17 The EM was dried at room temperature for 48 hours.14 Fig. 2 shows the fabrication procedure and chemical composition of the eggshell membrane. Finally, dried EM and OS were processed. EM was carbonized in a pipe oven (at 600 °C and 900 °C for 3 hours, a heating rate of 5 °C min−1) in a nitrogen atmosphere. Samples carbonized at 600 °C and 900 °C were labelled EM600 and EM900, respectively. OS was calcinated in the air (at 600 °C and 900 °C for 3 h, the heating rate of 5 °C min−1) and named accordingly as OS600 and OS900.Physicochemical characterization
Electrode preparation and electrochemical experiments
Carbonized EM600 and EM900, as well as calcinated OS600 and OS900, were ground in an agate mortar to a fine powder and used as active materials in devices for energy storage. The performance of EM600 and EM900 was tested in lithium-ion batteries, while OS600 and OS900 were tested in electrochemical capacitors. The electrochemical performance of all systems was evaluated using a multichannel potentiostat/galvanostat VMP3 (BioLogic, France) with EC-Lab software.Electrode preparation. OS600 and OS900 were added to a commercial steam-activated carbon YP-80F (Kuraray, Japan, with a specific surface area of 2271 cm2 g−1) in a ratio of 1
![[thin space (1/6-em)]](https://www.rsc.org/images/entities/char_2009.gif) :
:![[thin space (1/6-em)]](https://www.rsc.org/images/entities/char_2009.gif) 9 by weight. PTFE (Sigma-Aldrich) was used as a binder while adding carbon black C65 (Imerys) enhanced the conductivity of the active material. All listed materials were mixed in a weight ratio of 85
9 by weight. PTFE (Sigma-Aldrich) was used as a binder while adding carbon black C65 (Imerys) enhanced the conductivity of the active material. All listed materials were mixed in a weight ratio of 85![[thin space (1/6-em)]](https://www.rsc.org/images/entities/char_2009.gif) :
:![[thin space (1/6-em)]](https://www.rsc.org/images/entities/char_2009.gif) 10
10![[thin space (1/6-em)]](https://www.rsc.org/images/entities/char_2009.gif) :
:![[thin space (1/6-em)]](https://www.rsc.org/images/entities/char_2009.gif) 5 and homogenized. Homogenized material was cut into discs (∅ 12 mm) and dried overnight at 55 °C in air. The electrolyte consisted of a 1 M aqueous solution of Na2SO4. Electrochemical measurements were performed in Swagelok-type T-cells in a 2- and 3-electrode configuration. When required (3-electrode configuration), the reference electrode Hg|Hg2SO4 in 0.5 M K2SO4 (0.68 V vs. NHE) was attached.
5 and homogenized. Homogenized material was cut into discs (∅ 12 mm) and dried overnight at 55 °C in air. The electrolyte consisted of a 1 M aqueous solution of Na2SO4. Electrochemical measurements were performed in Swagelok-type T-cells in a 2- and 3-electrode configuration. When required (3-electrode configuration), the reference electrode Hg|Hg2SO4 in 0.5 M K2SO4 (0.68 V vs. NHE) was attached.
Cyclic voltammetry (CV). First, CV was performed in a 2-electrode configuration at different scan rates: 5, 10, 20, and 50 mV s−1, from 0.0 V to 1.6 V. The measurement was repeated after cycling at 10 mV s−1. Next, characteristics of positive and negative electrodes were scanned in a 3-electrode configuration at 5 mV s−1 within their respective potential ranges.
Electrochemical impedance spectroscopy (EIS). Measurements were conducted within a frequency range of 100 kHz to 1 mHz in a 2-electrode configuration.
Galvanostatic charge/discharge. The capacitors were charged and discharged with a load of 100, 200, 500, 1000, and 2000 mA g−1, depending on the capability of the capacitor. Finally, supercapacitors were tested for their long cycling performance (5000 cycles, current load 1 A g−1). Current loads increased when the electrodes responded well.
Electrode preparation. EM600 or EM900 was mixed with a binder and carbon black in the mass ratio of 85
![[thin space (1/6-em)]](https://www.rsc.org/images/entities/char_2009.gif) :
:![[thin space (1/6-em)]](https://www.rsc.org/images/entities/char_2009.gif) 10
10![[thin space (1/6-em)]](https://www.rsc.org/images/entities/char_2009.gif) :
:![[thin space (1/6-em)]](https://www.rsc.org/images/entities/char_2009.gif) 5. The binder in lithium-ion batteries was PVDF (Solef® 5130, Solvay), and carbon black Super C65 (Timcal) was used as a conductive agent. A small amount of NMP (N-methyl-2-pyrrolidone, Sigma-Aldrich) was added to adjust the viscosity of the electrode material in order to create a slurry that was coated on top of a copper foil (thickness 25 μm, battery-grade, Schlenk) using a doctor blade. The coated sheets were dried in air at 55 °C. Afterwards, the electrodes were cut into discs (∅ 12 mm) and dried overnight at 120 °C in a vacuum to remove moisture. The EM600/Li and EM900/Li half-cells were filled with commercially accepted electrolyte, 1 M LiPF6 in EC
5. The binder in lithium-ion batteries was PVDF (Solef® 5130, Solvay), and carbon black Super C65 (Timcal) was used as a conductive agent. A small amount of NMP (N-methyl-2-pyrrolidone, Sigma-Aldrich) was added to adjust the viscosity of the electrode material in order to create a slurry that was coated on top of a copper foil (thickness 25 μm, battery-grade, Schlenk) using a doctor blade. The coated sheets were dried in air at 55 °C. Afterwards, the electrodes were cut into discs (∅ 12 mm) and dried overnight at 120 °C in a vacuum to remove moisture. The EM600/Li and EM900/Li half-cells were filled with commercially accepted electrolyte, 1 M LiPF6 in EC![[thin space (1/6-em)]](https://www.rsc.org/images/entities/char_2009.gif) :
:![[thin space (1/6-em)]](https://www.rsc.org/images/entities/char_2009.gif) DMC 1
DMC 1![[thin space (1/6-em)]](https://www.rsc.org/images/entities/char_2009.gif) :
:![[thin space (1/6-em)]](https://www.rsc.org/images/entities/char_2009.gif) 1 by volume (Sigma-Aldrich). Lithium metal (Sigma-Aldrich) was used as a counter and reference electrode.
1 by volume (Sigma-Aldrich). Lithium metal (Sigma-Aldrich) was used as a counter and reference electrode.All measurements of Li-ion half-cells were performed in a 3-electrode configuration in Swagelok-type T-cells to assess the performance of the newly obtained electrode material. The cells were assembled in a glove box (Jacomex, France) under an argon atmosphere.
Cyclic voltammetry. The measurements were carried out within the potential range of 0.05–2.0 V vs. Li/Li+ at 0.01 V s−1 and repeated 4 times.
Electrochemical impedance spectroscopy (EIS). EIS measurements were carried out between the frequencies of 100 kHz and 10 mHz, with 10 points per decade. One measurement was performed after the cell assembly and another after a single charge.
Galvanostatic charge/discharge. The measurements were performed 10 times with the current density analogous to C/10, followed by 5 times at C/5, and finally, 5 cycles at C/10. Potential range 0.05–2.0 V vs. Li/Li+.
Wettability
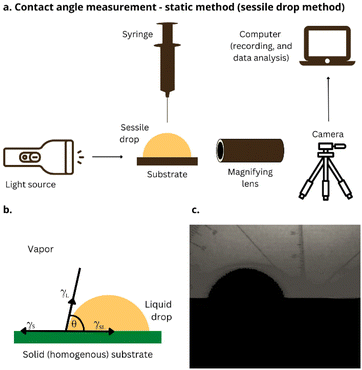
Wettability is the ability of a liquid to adhere to a solid substrate. Typically, the measure of wettability is the contact angle θ that forms at the liquid–solid–gas boundary. The contact angle below 90° indicates that a liquid wets the tested substrate well (the smaller θ, the better wetting). In comparison, a contact angle above 90° means poor wetting, which vanishes completely at 180°. The contact angle of the 1 M aqueous solution of Na2SO4 on the electrodes' surface was determined based on the sessile drop method (Fig. 10a).39 An electrode was placed on an even glass table, and a single drop of electrolyte (V = 10 μL) was placed in the middle of the electrode (Fig. 10b and c). The wetting angle was measured using Fiji software (ImageJ). In the study, we present and discuss the average values of static contact angles obtained from two measurements for each material, using a new electrode each time.Author contributions
Agnieszka Gabryelczyk: conceptualization, methodology, investigation, writing – original draft, writing – review & editing, visualization. Sudesh Yadav: conceptualization, methodology, resources, visualization. Agnieszka Swiderska-Mocek: investigation, writing – original draft, writing – review & editing. Ali Altaee: resources, writing – review & editing. Grzegorz Lota: conceptualization, methodology, writing – review & editing, resources.Conflicts of interest
There are no conflicts to declare.Acknowledgements
This work was supported by the National Science Centre, Poland, grant number 2018/31/B/ST8/01619. Furthermore, the paper was created thanks to participation in program PROM of the Polish National Agency for Academic Exchange (Narodowa Agencja Wymiany Akademickiej (NAWA)) project no. POWR.03.03.00-00-PN13/18.References
- R. Kötz and M. Carlen, Electrochim. Acta, 2020, 45, 2483 CrossRef.
- D. Parra and M. K. Patel, Appl. Energy, 2019, 239, 1343 CrossRef.
- S. Sagadevan, A. R. Marlinda, Z. Z. Chowdhury, Y. B. A. Wahab, N. A. Hamizi, M. M. Shahid, F. Mohammad, J. Podder and M. R. Johan, in Advances in Supercapacitor and Supercapattery. An Innovation Toward Energy Storage Devices, Elsevier, Amsterdam, 2021, pp. 27–43 Search PubMed.
- B. E. Conway, Electrochemical Supercapacitors. Scientific Fundamentals and Technological Applications, Kluwer Academic/Plenum Publishers, New York, 1999 Search PubMed.
- N. H. Phan, S. Rio, C. Faur, L. Le Coq, P. Le Cloirec and T. H. Nguyen, Carbon, 2006, 44, 2569 CrossRef CAS.
- M. Dizbay-Onat, U. K. Vaidya, J. A. G. Balanay and C. T. Lungu, Adsorpt. Sci. Technol., 2018, 36, 441 CrossRef CAS.
- L. Zhang, L. Tu, Y. Liang, Q. Chen, Z. Li, C. Li, Z. Wanga and W. Li, RSC Adv., 2018, 8, 42280 RSC.
- S. Zhang, M. Zheng, Z. Lin, N. Li, Y. Liu, B. Zhao, H. Pang, J. Cao, P. He and Y. Shi, J. Mater. Chem. A, 2014, 2, 15889 RSC.
- M. Graś, Ł. Kolanowski, Z. Chen, K. Lota, K. Jurak, J. Ryl, B.-J. Ni and G. Lota, Sustainable Energy Fuels, 2021, 5, 4401 RSC.
- Z. Li, L. Zhang, B. S. Amirkhiz, X. Tan, Z. Xu, H. Wang, B. C. Olsen, C. M. B. Holt and D. Mitlin, Adv. Energy Mater., 2021, 2, 431 CrossRef.
- S. Park, K. S. Choi, D. Lee, D. Kim, K. T. Li, K. H. Lee, H. Seonwoo and J. Kim, Biosyst. Eng., 2016, 151, 446 CrossRef.
- M. Minakshi, H. Visbal, D. R. G. Mitchell and M. Fichtner, Dalton Trans., 2018, 47, 16828 RSC.
- S. K. Karan, S. Maiti, S. Paria, A. Maitra, S. K. Si, J. K. Kim and B. B. Khatua, Mater. Today Energy, 2018, 9, 114 CrossRef.
- M. Minakshi, S. Higley, C. Baur, D. R. G. Mitchell, R. T. Jones and M. Fichtner, RSC Adv., 2019, 9, 26981 RSC.
- L. Ma, M. Cao, C. S. Zhao, S. Huang, J. Ding, J. Chen and Y. Zhou, Ceram. Int., 2021, 47, 9118 CrossRef CAS.
- S. H. Chung and A. Manthiram, Adv. Mater., 2014, 26, 1360 CrossRef CAS PubMed.
- M. Jyothi, S. Yadav and G. Balakrishna, J. Membr. Sci., 2018, 549, 227 CrossRef CAS.
- Z. Wei, C. Xu and B. Li, Bioresour. Technol., 2009, 100, 2883 CrossRef CAS PubMed.
- P. Kamkum, N. Atiwongsangthong, R. Muanghlua and N. Vittayakorn, Ceram. Int., 2015, 41, S69 CrossRef CAS.
- X. Li, J. Liang, Z. Hou, Y. Zhu and Y. Qian, RSC Adv., 2014, 4, 50950 RSC.
- V. H. Nguyen, D. H. Lee, S. Y. Baek and Y. H. Kim, Mater. Lett., 2018, 228, 504 CrossRef CAS.
- H. Yu, Q. Tang, J. Wu, Y. Lin, L. Fan, M. Huang, J. Lin, Y. Li and F. Yu, J. Power Sources, 2012, 206, 463 CrossRef CAS.
- G. Giammaria and L. Lefferts, J. CO2 Util., 2019, 33, 341 CrossRef CAS.
- Q. Q. Lv, Y. S. Tian, J. L. Zhou, H. W. Ren and G. H. Wang, PLoS One, 2020, 16, e0245124 CrossRef PubMed.
- R. Mohadi, K. Anggraini, F. Riyanti and A. Lesbani, Sri. J. Env., 2016, 1, 32 CrossRef.
- Y. Xie, J. Yin, J. Zheng, L. Wang, J. Wu, M. Dresselhaus and X. Zhang, ACS Appl. Mater. Interfaces, 2019, 11, 32244 CrossRef CAS PubMed.
- J. Zhao, J. A. Syed, X. Wen, H. Lu and X. Meng, J. Alloys Compd., 2019, 777, 974 CrossRef CAS.
- Q. Gao, J. Energy Chem., 2019, 38, 219 CrossRef.
- S. Znaniecki, K. Szwabińska, J. Wojciechowski, A. Skrzypczak and G. Lota, ChemElectroChem, 2021, 8, 3685 CrossRef CAS.
- Y. Lu, X. Liu, W. Wang, J. Cheng, H. Yan, C. Tang, J.-K. Kim and Y. Luo, Sci. Rep., 2015, 5, 16584 CrossRef CAS PubMed.
- Y. Song, T. Liu, M. Li, B. Yao, T. Kou, D. Feng, F. Wang, Y. Tong, X.-X. Liu and Y. Li, Adv. Energy Mater., 2018, 8, 1801784 CrossRef.
- T. Purkait, G. Singh, D. Kumar, M. Singh and R. S. Dey, Sci. Rep., 2018, 8, 640 CrossRef PubMed.
- A. Turguła, M. Graś, A. Gabryelczyk, G. Lota and J. Pernak, ChemPlusChem, 2020, 85, 2679 CrossRef PubMed.
- W. Shang, W. Yu, X. Xiao, Y. Ma, Y. He, Z. Zhao and P. Tan, Advanced Powder Materials, 2023, 2, 100075 CrossRef.
- S. Bargir, S. Dunn, B. Jefferson, J. Macadam and S. Parsons, Appl. Surf. Sci., 2009, 255, 4873 CrossRef CAS.
- C. Wang, C. Piao, X. Zhai, F. N. Hickman and J. Li, Powder Technol., 2010, 198, 131 CrossRef CAS.
- D. Di Lecce, V. Gancitano and J. Hassoun, ACS Sustainable Chem. Eng., 2020, 8, 278 CrossRef CAS.
- A. Gabryelczyk, H. Smogór and A. Swiderska-Mocek, Electrochim. Acta, 2023, 439, 141645 CrossRef CAS.
- J. M. Schuster, C. E. Schvezov and M. R. Rosenberg, Procedia Mater. Sci., 2015, 8, 742 CrossRef CAS.
Footnote |
| † Electronic supplementary information (ESI) available. See DOI: https://doi.org/10.1039/d3ra03037g |
| This journal is © The Royal Society of Chemistry 2023 |

