
 Open Access Article
 This Open Access Article is licensed under a Creative Commons Attribution-Non Commercial 3.0 Unported Licence
Synthesis by adding CTAB and characterization of Ag@CuO@rGO nanocomposite with a novel core–shell crystal sugar structure and its application in supercapacitors
Yuxin Zhang
a,
Yong Li
*a,
Pengchong Yin
 a and
Weizhong Han
ab
a and
Weizhong Han
ab
aSchool of Materials Science and Engineering, North China University of Water Resources and Electric Power, Zhengzhou 450045, China. E-mail: lionghuashui2020@gmail.com
bSchool of Materials Science and Engineering, Xi'an Jiaotong University, Xi'an 710049, China
First published on 3rd July 2023
Abstract
In this study, we successfully synthesized Ag@CuO@rGO (rGO wrapped around Ag/CuO) nanocomposites using AgNO3, Cu(NO)32, and NaOH as raw materials and particularly treated CTAB as a template by chemical precipitation, hydrothermal synthesis, and subsequent high-temperature calcination processes. In addition, transmission electron microscopy (TEM) images revealed that the prepared products appeared to have a mixed structure. The results indicated that the best choice was CuO wrapped around Ag nanoparticles to form a core–shell crystal structure, and the crystal particles were arranged similarly to form an icing sugar block structure and were tightly wrapped by rGO. Moreover, the electrochemical test results demonstrated that Ag@CuO@rGO composite electrode material exhibited high pseudocapacitance performance; the material had a high specific capacity of 1453 F g−1 at a current density of 2.5 mA cm−2, and the charging and discharging cycles remained constant up to 2000 times, indicating that the introduction of Ag improved the cycling stability and reversibility of the CuO@rGO electrode material and increased its specific capacitance, leading to the increase in the specific capacitance of supercapacitors. Therefore, the above results strongly support the application of Ag@CuO@rGO in optotronic devices.
 Yuxin Zhang | Yuxin Zhang (PhD, Lecturer) is engaged in the controllable preparation of polymetallic modified electrode materials and the detection of their electrochemical properties and has published more than 8 SCI papers. |
 Yong Li | Yong Li (PhD, Associate Professor) is a reviewer of Analytical Methods, Journal of Non-Crystalline Solids, China Foundry and other journals. |
 Pengchong Yin | Pengchong Yin, Masters, engaged in the development and research of electrochemical sensors and supercapacitor electrode materials and carried out the preparation of modified clicks and the detection of their electrochemical properties. |
 Weizhong Han | Weizhong Han (Professor and Doctoral Supervisor). He has published more than 30 high-level papers in PRL, Nano Lett., Adv. Mater., Acta Mater., etc. |
1 Introduction
The capacitive performance of supercapacitors depends on the selection of electrode materials.1,2 Although the focus is on transition metal oxides, such as NiO, Co3O4, and Fe2O3,3–5 their practical applications are limited owing to their high cost, high toxicity, and low catalytic activity. Further, it is particularly important to investigate a low-cost electrode material with high electrochemical activity and a large specific surface area.Compared to other metal oxides, copper oxide belongs to a p-type transition metal oxide with a low band gap energy of only 1.2 eV.6 Additionally, copper oxide has the advantages of low cost, easy preparation, excellent electrochemical activity, large specific surface area, and the ability to promote electron transfer at low overpotential, which makes it an ideal raw material for super electric electrodes.7,8 However, copper oxide has comparatively low self-conductivity and is highly susceptible to agglomeration of nanoparticles during the preparation process, which can seriously affect the capacitance performance of the dielectric material.
The most effective way to solve the deficiency is to modify the surface of bare copper oxide materials, which can improve the capacitive property of supercapacitors by combining noble metal monomers, metal oxides, or carbon materials. It was found that they can forcefully connect with each other and manifest new functions in the nanocomposite system composed of copper oxide and noble metals, as a result of the difference in their properties, which in turn breaks the limitation of the single component of copper oxide.9 Among them, silver (Ag) has electrophilic, nucleophilic, and special selectivity for the reaction, and is also the noble metal with the best electrical conductivity and low cost, so it is considered an intensely ideal doping material.10,11 Another way is the combination of copper oxide and conductive carrier carbon material-graphene loaded together to synthesize a composite with a special structure. Namely, graphene has excellent physical and chemical properties, such as excellent mechanical properties, extremely stable load-bearing capacity, great specific surface area, and strong electron transport capacity;12,13 there is especially no energy band gap but rather outstanding biocompatibility.14
Further studies demonstrated that the combination of CuO and rGO could exhibit better multiplicative performance, superior charging and discharging efficiency, and more stable cycling.15 Therefore, rGO was used as the conductive carrier, and CuO was doped and modified with the advantage of nano-Ag to study the electrochemical properties of the electrode constructed by the three substances.16–18 The experiments were carried out by chemical precipitation-hydrothermal synthesis and subsequent high-temperature calcination processes to synthesize Ag@CuO@rGO with the ternary nanostructure. Eventually, structural and electrochemical characterization was carried out, details involved the effects of different molar ratios of Cu and Ag and the surfactant on the morphology, also including the influence on the specific capacitance.
2 Experiments
2.1 Materials and methods
Graphene was purchased from Shenzhen Yuechuang Technology Co., Ltd, and cupric acetate (Cu(Ac)2), DMF (AR, 99.5%), ammonium hydroxide (NH3·H2O, 25–28%), acetone, hydrochloric acid (HCL, 36–38%) and cetyltrimethylammonium bromide (CTAB) were obtained from Sinopharm Chemical Reagent Co., Ltd. Flexible conductive carbon cloth was purchased from Shanghai Hesen Electric Co., Ltd (SCRC, China). Potassium hydroxide (KOH), sodium hydroxide (NaOH), PVA, and anhydrous ethanol (C2H6O) were purchased from Macklin. Acetylene black and activated carbon (AC) were purchased from Cabot Corporation, USA. The chemical reagents were all analytical grade (AR) and the deionized water was prepared by a laboratory water purification system.All reagents were analytically pure, including graphene, copper nitrate trihydrate, silver nitrate, CTAB, sodium hydroxide, potassium hydroxide, anhydrous ethanol, and deionized water (lab-made). In this work, a three-electrode system was used for the electrochemical experiments, i.e., platinum sheet electrode, saturated glycerol electrode, and nickel foam coated with electrode material as the reference electrode, auxiliary electrode, and working electrode, respectively, connected with alligator clips and fixed in a 50 mL beaker, then to select the electrochemical test technique, and set the parameters.
First of all, a working electrode was prepared before the electrochemical experiment, next, 1 mol L−1 KOH of the alkaline electrolyte solution was added to the test mixture and activated at a sweep rate of 10 mV s−1 at −1 to 1 V to determine the specific potential window. Afterwards, a cyclic voltammetric scan was performed on the nickel foam electrode to analyze the effect of the sweep rate on the entire medium. In the end, constant current charge and discharge tests were performed to obtain the capacitance at different sweep rates.
2.2 Synthesis of Ag@CuO@rGO
Certain weights of silver nitrate (AgNO3) and copper nitrate trihydrate (Cu(NO)32·3H2O) were taken in different molar ratios (Cu![[thin space (1/6-em)]](https://www.rsc.org/images/entities/char_2009.gif) :Ag = 1:1, 1:2, 1:3), and labeled as I1-Cu, respectively, I2-Cu, I I3-Cu and I1-Ag, I I2-Ag, I I3-Ag. After weighing three sets of monolayer graphene of the same mass 0.1 g, labeled rG1, rG2, rG3, the same operation to obtain three sets of cetyltrimethylammonium bromide (CTAB) of the same mass 0.2 g, labeled CT1, CT2, CT3.
:Ag = 1:1, 1:2, 1:3), and labeled as I1-Cu, respectively, I2-Cu, I I3-Cu and I1-Ag, I I2-Ag, I I3-Ag. After weighing three sets of monolayer graphene of the same mass 0.1 g, labeled rG1, rG2, rG3, the same operation to obtain three sets of cetyltrimethylammonium bromide (CTAB) of the same mass 0.2 g, labeled CT1, CT2, CT3.
Next, the graphene weighed above was firstly placed in beakers (150 mL), and 20 mL of deionized water was added to it and placed in the ultrasonic apparatus at 50 °C. In step two, three different masses of AgNO3 and Cu(NO)32·3H2O were placed in a 50 mL beaker, and 10 mL of deionized water was added to each beaker and stirred for 5 min, then the two solutions were mixed and stirred for 5 min. In step three, the surfactant CTAB was slowly added to the above three groups of solutions. Thereby, mixed solutions at 40 °C in the fourth step, graphene dispersion was added to the third step drop by drop and stirred and sonicated for 2 h at room temperature. In step five, 6.0 g of NaOH was weighed in a 100 mL beaker and 50 mL of deionized water was added and stirred magnetically for 10 min. In the end, 10 mL of NaOH solution was added drop by drop to the fourth step. The NaOH solution was added drop by drop to the mixed solution in the fourth step and stirred magnetically for 1 h to complete the precipitation reaction.
The following procedure involved hydrothermal reaction and high-temperature calcination. Firstly, the three groups of mixed solutions were transferred to an autoclave set at 180 °C for 10 h. After the hydrothermal reaction, the product was washed repeatedly with anhydrous ethanol and deionized water and then dried in a vacuum drying oven at 80 °C for 24 h. Eventually, the dried precursors were placed in a tube furnace at a heating rate of 4 °C min−1 to 400 °C, and held for 4 h. That is, the final products were obtained from different molar ratios (Cu:Ag = 1:1, 1:2, 1:3) to label as rGO-I1, rGO-I2, and rGO-I3, respectively. Simultaneously, in this experiment, parallel comparisons were also performed. Under the same conditions, the molar ratio of Cu:Ag = 1:1 was used as the reference, hence the sample without CTAB was labeled rGO-I4, and the sample was labeled rGO-I5 in the case of calcination at 500 °C.
2.3 Fabrication of working electrode
In order to prepare the working electrode using the coating method, the study took nickel foam as a fluid collector and then configured the electrode material. For the Cuo@rGo composite, acetylene black and polytetrafluoroethylene emulsion (PTFE) were mixed well in the weight ratio of 75:15:10 and made into a paste. Subsequently, it was evenly coated on nickel foam pretreated with acetone, hydrochloric acid, and deionized water, using an area of 10 mm2. Subsequently, it was dried under a vacuum at 80 °C for 10 h. Finally, it was pressed into the electrodes at a pressure of 10 Mpa.
3 Results and discussion
3.1 Structural and morphology of Ag@CuO@rGO
X-ray diffraction was performed to analyze the structure and components of silver–copper oxide/graphene nanocomposites (rGO-I1, rGO-I2, rGO-I3, rGO-I4, and rGO-I5) (Fig. 1), the diffraction peak positions of the samples were consistent, which indicated that the main substances of the composites are essentially the same with five different molar ratios, as well as different temperatures and with or without active agents. | ||
| Fig. 1 XRD pattern of Ag@CuO@rGO nanocomposites. (a) Different molar ratios (Cu:Ag = 1:1, 1:2, 1:3, respectively correspond to rGO-I1, rGO-I2, rGO-I3) and (b) varying temperatures and without surfactant. | ||
The diffraction peaks at 2θ angles at 32.5, 35.4, 38.7, 48.7, 53.5, 58.3, 61.5, 66.4, 68.1, 72.4, and 75.2, were ascribed to CuO(110), (11−1), (111), (20−2), (020), (202), (11−3), (310), and (310), respectively. (310), (220), (311), and (22−2) of the peaks of the crystalline surface (JCPDS No. 48-1548). The 2θ located at 38.1, 44.2, 64.4, 77.3, and 82.3, corresponded to the characteristic peaks of the Ag crystal plane (111), (200), (220), (311), and (222), respectively (JCPDS No. 87-0597). Fig. 1a shows that the sample rGO-I1 had a diffraction peak located at 2θ = 15.5°, which is attributed to the crystal plane-diffraction (002) of graphene oxide, indicating the successful introduction of oxygen-containing groups into the graphene structure. Compared to the other samples, the diffraction peak at 2θ = 15.5°, which indicated that a small amount of unoxidized graphene was still present in the compound.
The samples rGO-I2 and rGO-I3 showed a clear broad peak at 2θ = 23.5° (002), revealing a further reduction in graphene oxide.19 Fig. 1b illustrates the peak at (002) the crystal plane peaks of the rGO-I4 and rGO-I5 of the reduced graphene oxide could not be observed, suggesting that the aggregation of graphene lamellae was effectively suppressed, while the graphite was completely exfoliated, resulting in damage to the regular stacking structure of graphite, whose characteristic diffraction peaks would be weakened or even disappeared.20 However, relative to the samples rGO-I4 and rGO-I5, the samples rGO-I1 showed an extremely intensive crystalline diffraction peak of CuO(110), which is due to the high crystal strength and large mass share of the Ag@CuO, so the graphene diffraction peak was compressed behind the background peak of the compound.21 Finally, a test was carried out in a surfactant (CTAB) using a molar ratio of Cu:Ag = 1:1.
Fig. 2 shows the morphology and characteristics of Ag@CuO@rGO using TEM analysis. The rGO-I1 samples of Ag@CuO were uniformly distributed on the inner side of the rGO layer, displayed in (Fig. 2a and c), its overall structure consisted of individual crystals stacked in an icing sugar block-like structure. Moreover, the RGO owns a typical carbon layer, if a transparent and wrinkled silk yarn was folded together, and coated on the inner side of Ag@CuO. In addition, the rGO-loaded Ag@CuO shows ideal crystallinity and a smooth surface, Fig. 2b. The particle size was about 100 nm, which is more rewarding for charge and ion transport, especially without clumping.
 | ||
| Fig. 2 TEM images of Ag@CuO@rGO nanoparticles with different molar ratio ((a)–(c): rGO-I1. (d)–(f): rGO-I2. (g)–(i): rGO-I3. (j)–(l): rGO-I4. (m)–(o): rGO-I5) and FETEM plots ((p)–(r): rGO-I1). | ||
With the addition of silver nitrate, rGO-I2 will generate a small amount of agglomeration, as shown in Fig. 2d–f. The images (Fig. 2g–i) revealed that rGO-I3 had an irregular mixed structure (pea-like and icing sugar lump-like) by rGO encapsulated on the outside of Ag@CuO, and also addresses a small amount of the agglomerated state. The reason is the amount of an increase in silver nitrate, which leads to a gradual increase in the particle size of Ag@CuO, and the adsorption capacity between ions will exceed the optimal strength, this will make the particles exhibit different degrees of agglomeration, and decrease in the electron transport capacity.22
In particular, without the addition of surfactant (CTAB), the rGO-I4 showed a small amount of agglomeration using the molar ratio of Cu:Ag = 1:1, which causes the Ag@CuO to break away from the rGO, as well as a change in the structure from partially lumpy to capsule-like, Fig. 2j–l, since the addition of surfactant CTAB plays an overwhelmingly important role in regulating the microstructure and surface morphology of Ag@CuO@rGO.23 Conversely, the addition of CTAB in the right amount will enhance the dispersion of individual component, and promote the close bonding of Ag@CuO and rGO. If the concentration of the added CTAB is too large, the number of micelles in the solution will increase dramatically, and then the agglomeration of the material with CTAB will occur.24 Fig. 2m–o shows that the Ag@CuO@rGO are more stable in the icing sugar bulk structure with the increase in calcination temperature, but the agglomeration is more serious. Then, the results further demonstrated that the agglomeration decreased the ability of the surface chemistry and reduced the specific capacity.25,26
Fig. 2p shows the FETEM of Ag@CuO@rGO; its average diameter was about 103 nm consistent with TEM, and the linear scan of part of Ag@CuO@rGO swept along the direction of the yellow arrow in the red box area. In the meantime, Cu and Ag elements appeared sequentially, and there was the highest intensity of Cu elements at the center of the particle, so as to encapsulate the Ag nanoparticles to form the core–shell structure. Additionally, the C elements were mainly distributed in the core–shell structure Ag@CuO overall particles at various places, which further proved that the Ag@CuO@rGO is a novel core–shell icing block structure. In summary, the hydrothermal synthesis reaction mechanism is shown in Fig. 3. It was demonstrated that the unique structure can significantly improve the electrochemical performance of supercapacitors as an electrode material.27,28 Thus, the sample rGO-I1 is the best choice for the subsequent experiment, and the XRD detection also verified the result.
 | ||
| Fig. 3 Formation mechanism of Ag@CuO@rGO. | ||
As displayed in (Fig. 4a), the nitrogen adsorption/desorption isotherm of Ag@CuO@rGO was collected. When the relative pressure was in the range of 0–0.5, the adsorption isotherms coincided with the desorption isotherms, which indicated the presence of micropores in Ag@CuO@rGO according to the IUPAC classification.29 Moreover, in the pressure range is 0.5–0.8, there was a significant hysteresis back loop, this represented the existence of mesopores in Ag@CuO@rGO. Furthermore, when the relative pressure was up to 0.8–1.0, the tailing up can be seen, which is due to the formation of larger pores by particle accumulation. Finally, the specific surface area of Ag@CuO@rGO was approximately 236 m2 g−1 using the BET method, and the average pore size was tested to be 4 nm, Fig. 4b. That is, the electrolyte can penetrate it better during the charging process of the supercapacitor, resulting in the increase of the reactive sites and the increase of the specific capacitance.
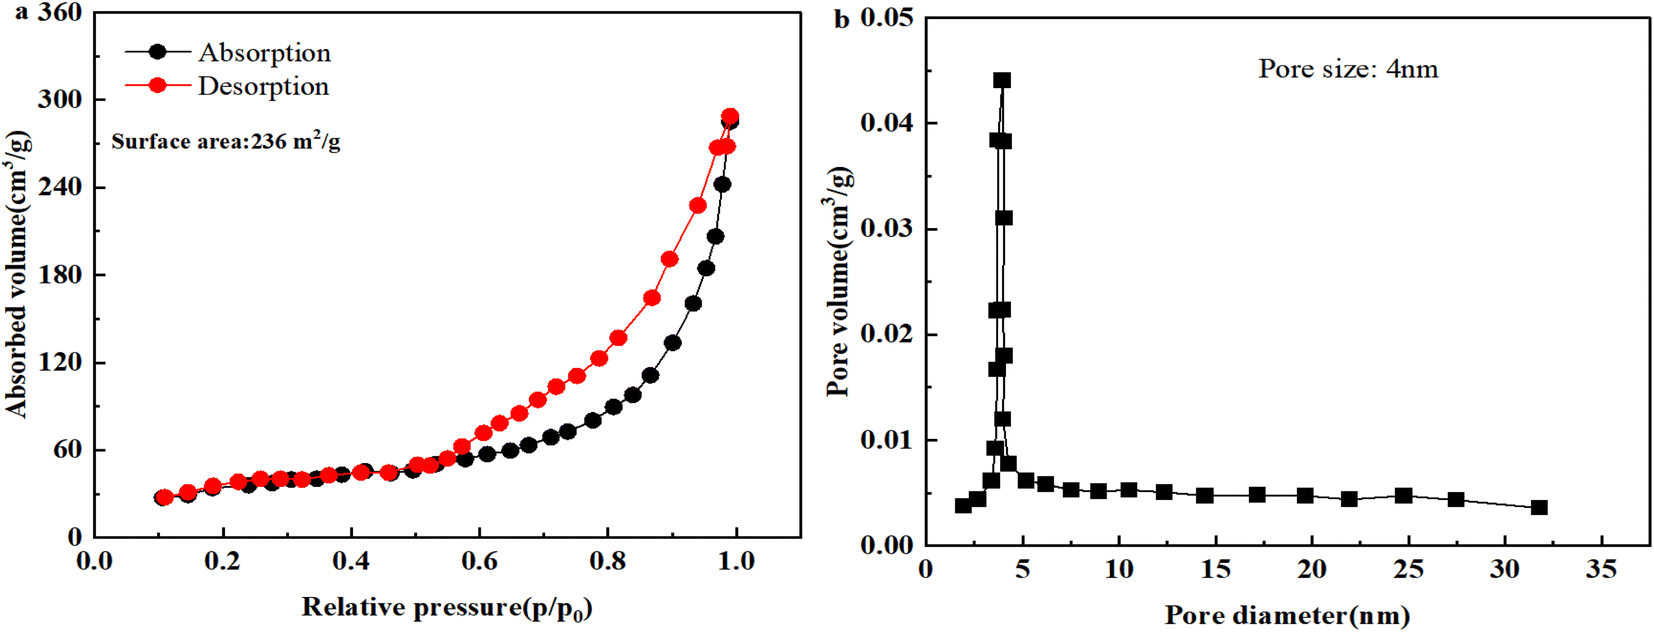 | ||
| Fig. 4 (a) Adsorption–desorption patterns and (b) pore size distribution of Ag@CuO@rGO of sample rGO-I1. | ||
3.2 Electrochemical characterization of Ag@CuO@rGO
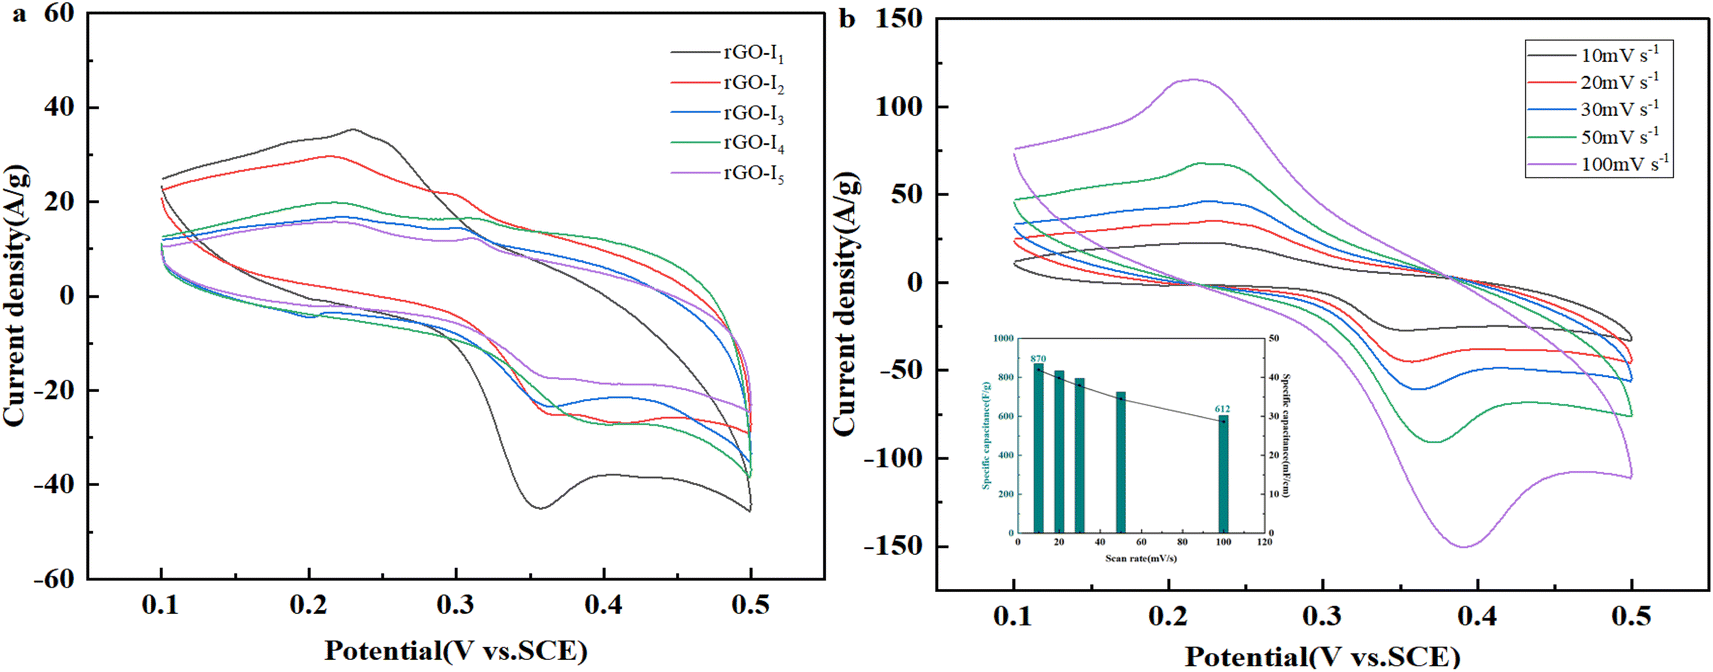 | ||
| Fig. 5 (a) CVs of rGO-Ii (i = 1–5) complex in a 1 mol L−1 KOH electrolyte with a scanning rate of 20 mV s−1; (b) CV of sample rGO-I1 at different sweep speeds, the inset is the specific capacitance of rGO-I1 and the relationship between capacitance retention at different scan rates. | ||
The CV curve showed that the reaction was highly reversible, accordingly Cu2+ and Cu+ will interconvert, the reactions are as follows.30
| 1/2Cu2O + OH− ↔ CuO + 1/2H2O + e− | (1) |
| 1/2Cu2O + 1/2H2O + OH− ↔ Cu(OH)2 + e− | (2) |
| CuOH + OH− ↔ CuO + H2O + e− | (3) |
| CuOH + OH− ↔ Cu(OH)2 + e− | (4) |
The molar amount of the added Ag can cause the increase or decrease of the redox peaks in the overall alkaline medium, it is accompanied by a redox reaction of Ag on the Ag@CuO electrode.31 Because of alkaline electrolytes, the reaction mechanism is postulated as follows: Ag loses electrons and is oxidized to Ag2O and while being oxidized, the product Ag+ will further combine with Cu+ ions to react following eqn (5) and (6):
| 2Ag − 2e− + 2OH− → Ag2O + H2O | (5) |
| 2Ag+ + 2Cu+ + 1/2O2 ↔ 2Ag+(Cu+) + 2Cu2+ + O2− | (6) |
As the molar ratio of Cu and Ag increases, there is a tendency for the oxidation peak curve to shift negatively and the reduction peak to shift positively Fig. 5. Consequently, the peak difference is further increased, indicating that a Faraday reaction with a high degree of reversibility occurs at the Ag@CuO electrode,32 and the doped nano Ag enhanced the reversibility of the electrode reaction. At the same scan rate, the positions of the redox peaks and the shapes of the CV cycling curves of the five samples are the same, and the areas enclosed by them can approximately represent the capacitance size.28 Since the area size of the cyclic voltammetric are in the order rGO-I1 > rGO-I2 > rGO-I4 > rGO-I5 > rGO-I3 the specific capacitance of rGO-I1 is the largest. Besides, the pseudocapacitance formed by Ag@CuO, a mixed-valence complex that has two redox pairs (Ag0/Ag+ and Cu+/Cu2+).
In consideration of the high conductivity of Ag and rGO, the dispersion property of CTAB, and the high load-bearing property of rGO, CuO doped with Ag and CTAB can enhance its conductivity, and also effectively inhibit the aggregation of nanoparticles and graphene. Therefore, the combination of Ag@CuO and rGO provides better electrochemical performance.33 However, when the hydrothermal reaction is followed by the higher temperature calcination, it will make the grains larger and they will accumulate on the inside and outside of rGO, so as to block the mesh of rGO and reduce the specific surface area, thus leading to a less specific electric capacity of the material.
Fig. 5b displays the CV curves of Ag@CuO@rGO at different sweep rates, that reflect favorable capacitive properties of samples rGO-I1. With the increase of the scan rate, the oxidation peak and reduction peak tend to move in the positive or negative directions, respectively, and the potential difference increases between the anode and cathode. In addition, the CV curves at different scan rates are completely uniform, this may be on account of enhanced electron polarization at high scan rates, the increased degree of irreversibility,34 and the issues of mass transfer and charge transfer within the composite.35
When electrode compounds are prepared with the addition of surfactant (CTAB) in the molar ratio Cu:Ag = 1:1, they have better Faraday pseudocapacitance characteristics. The illustration shows the CV curves calculated from the sample rGO-I1 and represents the relationship of the specific capacitance, capacitance retention, and different scan rates. The specific capacitance reaches 870 F g−1 at a scan rate of 10 mV s−1. Afterward, the scan rate is increased 10 times, the specific capacitance is 612 F g−1 and the capacity still reaches more than 70% of the maximum value, which indicates that the Ag@CuO@rGO electrode also has excellent capacitive stability with the increase of scan rate.
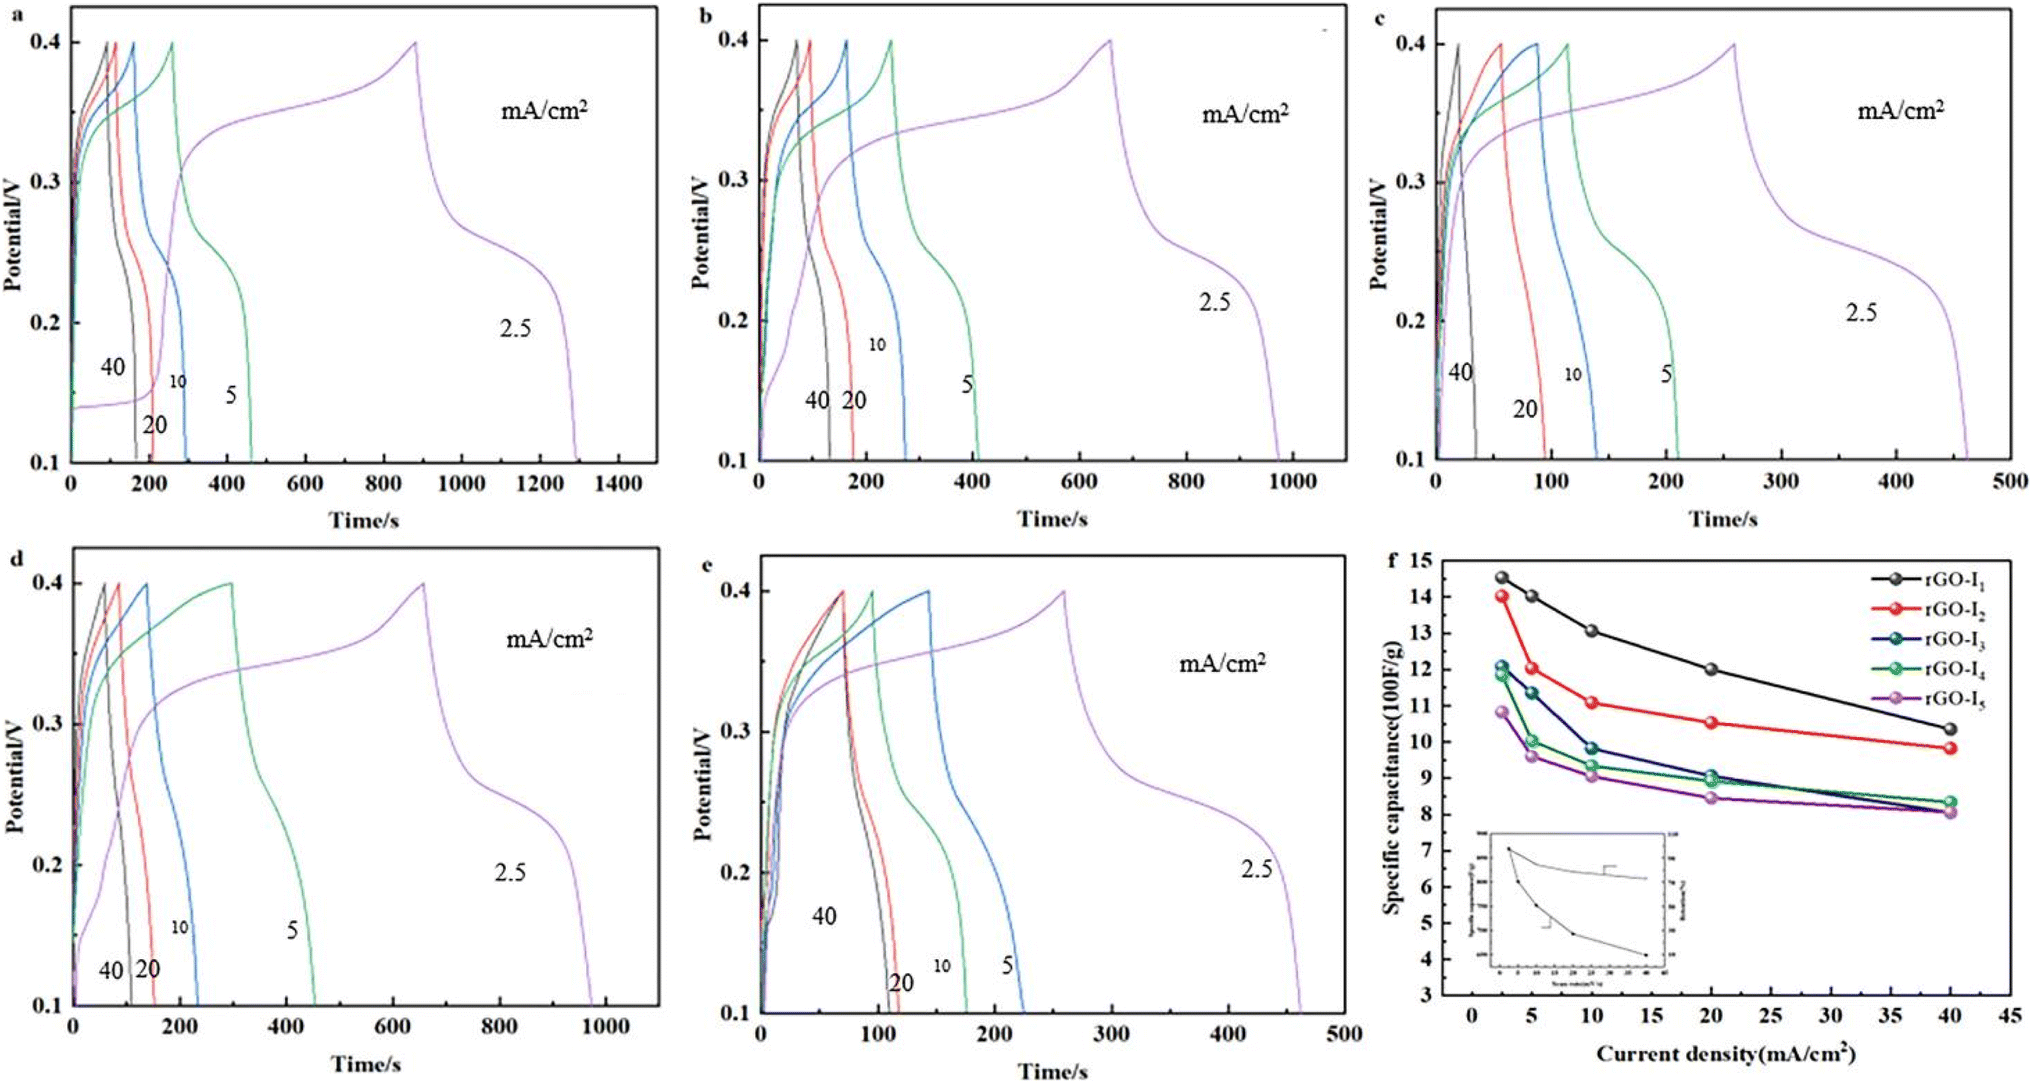 | ||
| Fig. 6 Constant current charge/discharge curve ((a) rGO-I1, (b) rGO-I2, (c) rGO-I3, (d) rGO-I4, (e) rGO-I5) and (f) rGO-Ii (i = 1–5) composite rate plots, the inset is the relationship of the specific capacitance (●) and capacitance retention ratio (○) and current density of the sample rGO-I1. | ||
Again, the specific capacitance decreased with the amount of Ag gradually increased as a consequence of mass incorporation of Ag@CuO particles formed when excess silver nitrate was added. In this regard, the tremendous increase of agglomerated composite particles is concentrated in the pores of rGO, resulting in a decrease in the specific surface area and a low specific capacitance. As to preparing the samples of rGO-I4, its specific capacitance is higher than rGO-I5, which is because the high calcination temperature produces a large particle size resulting in the accumulation of a large number of particles together.
Fig. 6f shows the plots of the multiplicity curves when the current density is reduced from 40–2.5 mA cm−2, the specific capacity preservation remains directly more than 70%, which indicates that Ag@CuO@rGO still has superior multiplicative performance as the current density increases. Moreover, the specific capacitance still has excellent storage capacitance performance using low-current discharge, and it can still meet the current conditions possessed by the electrodes of supercapacitors.
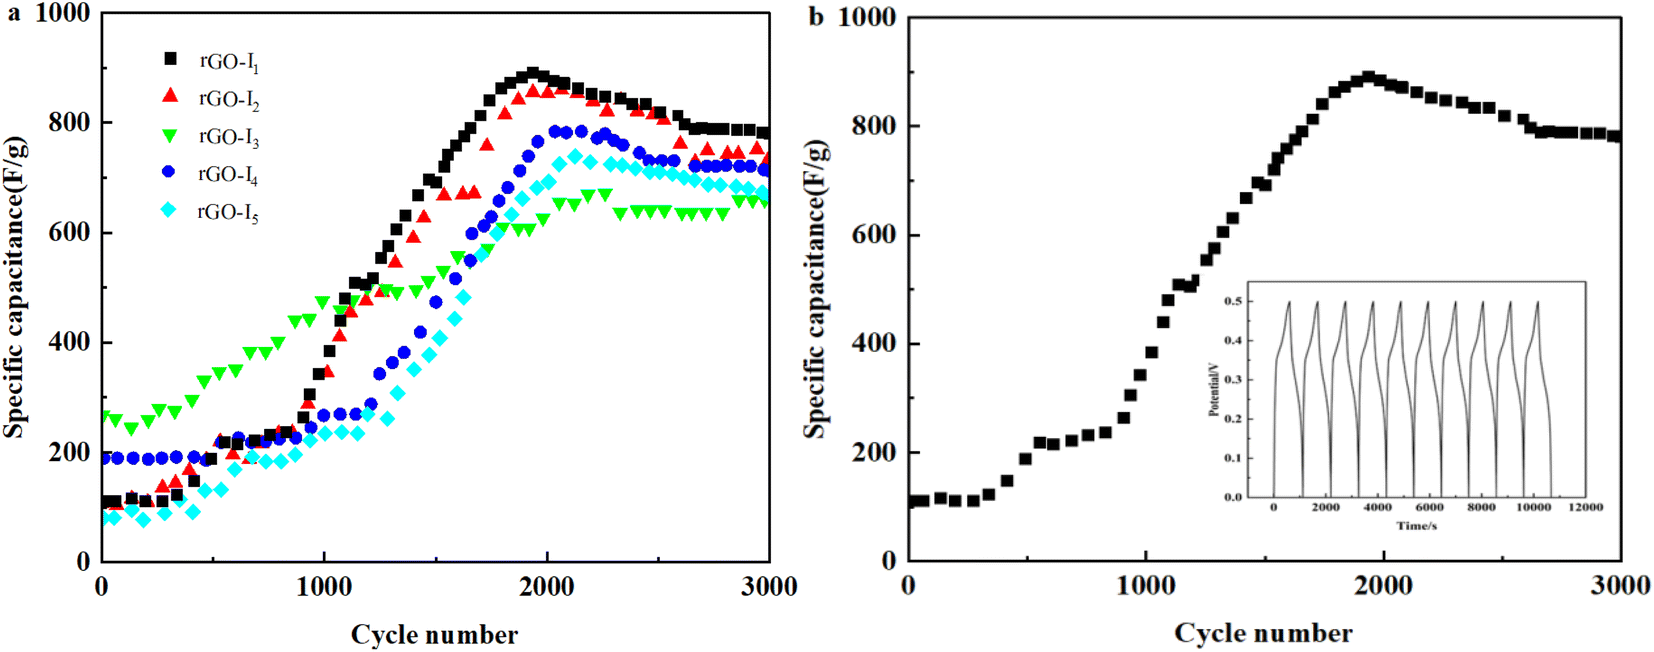 | ||
| Fig. 7 (a) Cycle curve of each sample at current density of 30 mA cm−2, (b) cycle life diagram of the sample rGO-I1. | ||
Fig. 7b shows the cycle stability of the samples and rGO-I1 cannot enter the branch quickly, and the inset is the charge–discharge cycle graph. With the increase of the charge/discharge cycles, there is no capacitance attenuation, and the Coulomb efficiency was close to 100%. The results suggest that the cycling stability of Ag@CuO@rGO obtained from the sample rGO-I1 has certain cycle stability, and will be used as a high-performance pseudocapacitor material.
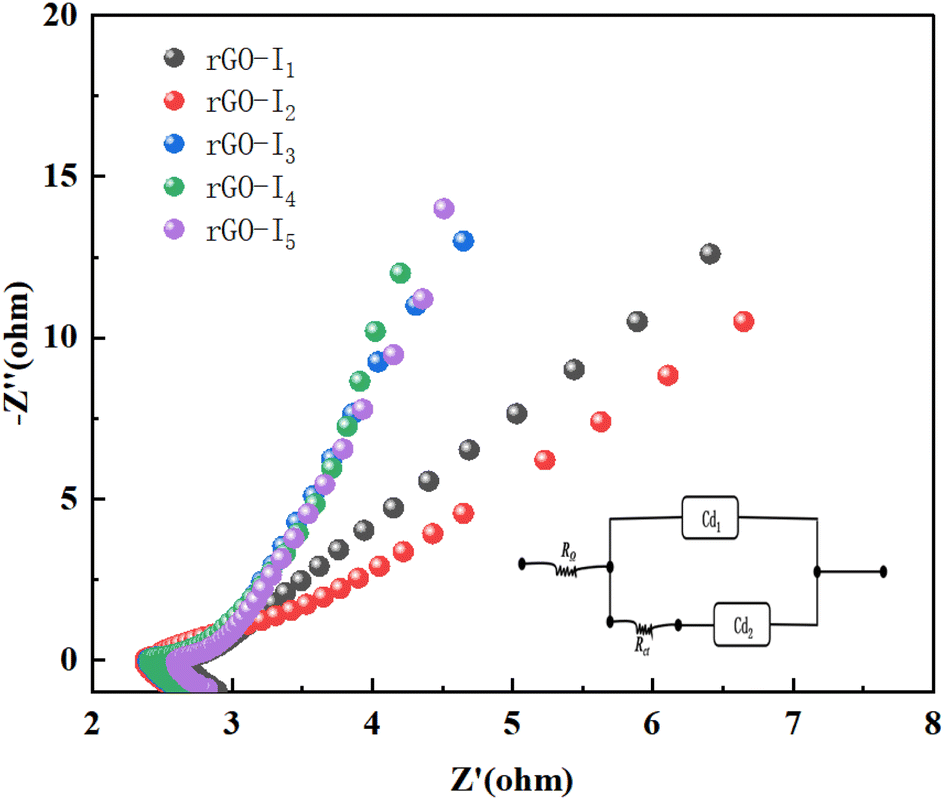 | ||
| Fig. 8 AC impedance diagram of the sample rGO-Ii (i = 1–5), and the inset is equivalent circuit of electrode. | ||
The impedance profile curve has an approximate semicircular shape in the high-frequency region and a straight line in the low-frequency region. Comparing the five curves, the resistance of charge transfer on the Ag@CuO@rGO product has a tendency to get bigger. As the mole ratio of Cu and Ag increased gradually, all of them can still exhibit excellent electrochemical reaction kinetic performance. The low-frequency region represents the diffusion impedance of OH− ions in the electrolyte around the electrode material, where the magnitude of the slope represents the degree of capacitive properties of the electrode modification material.36
Comparing the other three groups of samples, the slope of rGO-I1 and rGO-I2 in the low-frequency region is closer to 1.0, indicating a stronger capacitive property.32 The diameter in the high-frequency region of rGO-I1 is smaller than that of rGO-I2, indicating that rGO-I1 has a smaller charge transfer resistance. In contrast, rGO-I1 was significantly better than the sample without surfactant rGO-I4, because the micelles formed by the added surfactant CTAB molecules provided a growth template for the electrode material, and could further promote the close contact between rGO and Ag@CuO, thus its performance in terms of diffusion impedance of electrolyte ions is better than that rGO-I4.
Furthermore, the impedance performances of GO-I1 and rGO-I2 were significantly better than that of rGO-I5, and the kinetic response of the electrochemical reaction shows the phenomenon of decreasing with the rise in temperature. In conclusion, the sample rGO-I1 prepared by the ratios have more reliable capacitive performance than the electrode materials.
4 Conclusion
In this study, Ag@CuO nanocomposites consisting of rGO wrapped in icing sugar nucleophile structure were synthesized successfully using various methods, and morphology analysis and subsequent electrochemical characterization tests were performed. Furthermore, we analyzed the influence between the electrochemical properties and different morphologies.The composites prepared with a molar ratio of Cu:Ag = 1:1 have good dispersion and homogeneity and exhibit excellent electrochemical performance as electrode modification materials in supercapacitors. Compared to the other composites, the results indicate that it has a high specific capacitance of 1453 F g−1 at a current density of 2.5 mA cm−2, and the charge–discharge cycle test of the material showed that the sample rGO-I1. Importantly, it is proved that the Ag@CuO@rGO nano-composite could be applied to supercapacitors on account of charge/discharge efficiency and multiplicity performance.
Conflicts of interest
There are no conflicts to declare.References
- Z. S. Iro, C. Subramani and S. S. Dash, A brief review on electrode materials for supercapacitor, Int. J. Electrochem. Sci., 2016, 11(12), 10628–10643 CrossRef CAS.
- A. Burke, Ultracapacitors: why, how, and where is the technology, J. Power Sources, 2000, 91(1), 37–50 CrossRef CAS.
- R. Liang, Y. Du, P. Xiao, J. Cheng, S. Yuan, Y. Chen and J. Chen, Transition metal oxide electrode materials for supercapacitors: a review of recent developments, Nanomaterials, 2021, 11(5), 1248 CrossRef CAS PubMed.
- S. Jin, H. Lee and S. Yim, Enhanced capacitive properties of all-metal-oxide-nanoparticle-based asymmetric supercapacitors, RSC Adv., 2019, 9(55), 31846–31852 RSC.
- R. R. Bi, X. L. Wu, F. F. Cao, L. Y. Jiang, Y. G. Guo and L. J. Wan, Highly dispersed RuO2 nanoparticles on carbon nanotubes: facile synthesis and enhanced supercapacitance performance, J. Phys. Chem. C, 2010, 114(6), 2448–2451 CrossRef CAS.
- C. Kong, W. Lu, J. Zong, F. Pu, X. Hu, X. Zhang and H. Jin, Template-assisted synthesis of CuO hollow nanotubes constructed by ultrathin nanosheets for lithium-ion battery applications, J. Alloys Compd., 2020, 849, 156635 CrossRef CAS.
- C. Batchelor-McAuley, Y. Du, G. G. Wildgoose and R. G. Compton, The use of copper (II) oxide nanorod bundles for the non-enzymatic voltammetric sensing of carbohydrates and hydrogen peroxide, Sens. Actuators, B, 2008, 135(1), 230–235 CrossRef CAS.
- E. Reitz, W. Jia, M. Gentile, Y. Wang and Y. Lei, CuO nanospheres based nonenzymatic glucose sensor, Electroanalysis, 2008, 20(22), 2482–2486 CrossRef CAS.
- M. R. Mahmoudian, W. J. Basirun and Y. Alias, Synthesis of 3D hierarchical Ag/CuO nano-structures in the presence of l-histidine and their application, J. Alloys Compd., 2017, 699, 803–811 CrossRef CAS.
- L. H. Mendoza-Huizar, M. Palomar-Pardave and J. Robles, A theoretical quantum study on the distribution of electrophilic and nucleophilic active sites on the Au (100) surface modeled as finite clusters, J. Mol. Struct.: THEOCHEM, 2004, 679(3), 187–194 CrossRef CAS.
- Y. Li, P. C. Yin, Y. X. Zhang and R. Z. Zhang, Synthesis of honeycomb Ag@CuO nanoparticles and its application as a highly sensitive and electrocatalytically active hydrogen peroxide sensor material, Anal. Methods, 2022, 14, 4842–4850 RSC.
- D. D. Zhi, T. Li, J. Z. Li, H. S. Ren and F. B. Meng, A review of three-dimensional graphene-based aerogels: synthesis, structure and application for microwave absorption, Composites, Part B, 2021, 211, 108642 CrossRef CAS.
- W. Wang, J. Meng, Y. Hu, J. Wang, Q. Li and J. Yang, Thgraphene: a novel two-dimensional carbon allotrope as a potential multifunctional material for electrochemical water splitting and potassium-ion batteries, J. Mater. Chem. A, 2022, 10(18), 9848–9857 RSC.
- Y. Liu, Y. Ying, Y. Mao, L. Gu, Y. Wang and X. Peng, CuO nanosheets/rGO hybrid lamellar films with enhanced capacitance, Nanoscale, 2013, 5(19), 9134–9140 RSC.
- B. Wang, X. L. Wu, C. Y. Shu, Y. G. Guo and C. R. Wang, Synthesis of CuO/graphene nanocomposite as a high-performance anode material for lithium-ion batteries, J. Mater. Chem., 2010, 20(47), 10661–10664 RSC.
- D. A. Kospa, A. I. Ahmed, S. E. Samra and A. A. Ibrahim, High efficiency solar desalination and dye retention of plasmonic/reduced graphene oxide based copper oxide nanocomposites, RSC Adv., 2021, 11(25), 15184–15194 RSC.
- P. Viswanathan, K. Wang, J. Li and J. D. Hong, Multicore–shell Ag–CuO networked with CuO nanorods for enhanced non-enzymatic glucose detection, Colloids Surf., A, 2020, 598, 124816 CrossRef CAS.
- D. J. Joshi, J. R. Koduru, N. I. Malek and C. M. Hussain, Surface modifications and analytical applications of graphene oxide: a review, TrAC, Trends Anal. Chem., 2021, 144, 116448 CrossRef CAS.
- H. M. Hassan, V. Abdelsayed, S. K. Abd El Rahman, K. M. AbouZeid, J. Terner, M. S. El-Shall and A. A. El-Azhary, Microwave synthesis of graphene sheets supporting metal nanocrystals in aqueous and organic media, J. Mater. Chem., 2009, 19(23), 3832–3837 RSC.
- C. Nethravathi, T. Nisha, N. Ravishankar, C. Shivakumara and M. Rajamathi, Graphene-nanocrystalline metal sulphide composites produced by a one-pot reaction starting from graphite oxide, Carbon, 2009, 47(8), 2054–2059 CrossRef CAS.
- Y. Li, C. N. Duan, Z. Jiang, X. B Zhou and Y. Wang, CuO/rGO nanocomposite as an anode material for high-performance lithium-ion batteries, Mater. Res. Express, 2021, 8(5), 055505 CrossRef CAS.
- M. D. Adams, The mechanism of adsorption of aurocyanide onto activated carbon, 1. Relation between the effects of oxygen and ionic strength, Hydrometallurgy, 2010, 29(6), 997–1003 Search PubMed.
- N. Begletsova, E. Selifonova, A. Chumakov, A. Al-Alwani, A. Zakharevich, R. Chernova and E. Glukhovskoy, Chemical synthesis of copper nanoparticles in aqueous solutions in the presence of anionic surfactant sodium dodecyl sulfate, Colloids Surf., A, 2018, 552, 75–80 CrossRef CAS.
- E. Kurowska, A. Brzózka, M. Jarosz, G. D. Sulka and M. Jaskuła, Silver nanowire array sensor for sensitive and rapid detection of H2O2, Electrochim. Acta, 2013, 104, 439–447 CrossRef CAS.
- A. A. Khaleed, A. Bello, J. K. Dangbegnonc, M. J. Madito, O. Olaniyan, F. Barzegar and N. Manyala, Solvothermal synthesis of surfactant free spherical nickel hydroxide/graphene oxide composite for supercapacitor application, J. Alloys Compd., 2017, 721, 80–91 CrossRef CAS.
- D. D. Zhao, S. J. Bao, W. J. Zhou and H. L. Lic, Preparation of hexagonal nanoporous nickel hydroxide film and its application for electrochemical capacitor, Electrochem. Commun., 2007, 9(5), 869–874 CrossRef CAS.
- X. Zhang, J. Ma, W. Yang, Z. Gao, J. Wang, Q. Liu, J. Liu, J. Y. Liu and X. Y. Jing, Manganese dioxide core–shell nanowires in situ grown on carbon spheres for supercapacitor application, CrystEngComm, 2014, 16(19), 4016–4022 RSC.
- Y. Qiu, J. Yu, G. Fang, H. Shi, X. Zhou and X. Bai, Synthesis of carbon/carbon core/shell nanotubes with a high specific surface area, J. Phys. Chem. C, 2009, 113(1), 61–68 CrossRef CAS.
- J. Rouquerol and F. Rouquerol, Adsorption by powders and porous solids: principles, methodology and applications, Academic Press, US, 2013 Search PubMed.
- C. Zhu, S. Guo, Y. Zhai and S. Dong, Layer-by-layer self-assembly for constructing a graphene/platinum nanoparticle three-dimensional hybrid nanostructure using ionic liquid as a linker, Langmuir, 2010, 26(10), 7614–7618 CrossRef CAS PubMed.
- K. Kuratani, T. Kiyobayashi and N. Kuriyama, Influence of the mesoporous structure on capacitance of the RuO2 electrode, J. Power Sources, 2009, 189(2), 1284–1291 CrossRef CAS.
- C. Barbero, G. A. Planes and M. C. Miras, A novel microarray chemiluminescence method based on chromium oxide nanoparticles catalysis for indirect determination of the explosive triacetone triperoxide at the scene, Electrochem. Commun., 2001, 3(3), 113–116 CrossRef CAS.
- Y. Zhang, X. P. Xiao, Y. J. Sun, Y. Shi, H. C. Dai, P. J. Ni, J. T. Hu, Z. Li, Y. H. Song and L. Wang, Electrochemical deposition of nickel nano-particles on reduced graphene oxide film for nonenzymatic glucose sensing, Electroanalysis, 2013, 25(4), 959–966 CrossRef CAS.
- S. B. Yang, X. L. Wu, C. L. Chen, H. L. Dong, W. P. Hu and X. K. Wang, Spherical a-Ni(OH)2 nanoarchitecture grown on graphene as advanced electrochemical pseudocapacitor materials, Chem. Commun., 2012, 48, 2773–2775 RSC.
- M. Aghazadeh, M. Hosseinifard, B. Sabour and S. Dalvand, Pulse electrochemical synthesis of capsule-like nanostructures of Co3O4 and investigation of their capacitive performance, Appl. Surf. Sci., 2013, 287, 187–194 CrossRef CAS.
- H. Xu, J. Zhuang, Y. Chen, J. Wu and J. Zhang, Preparation and performance of Co3O4-NiO composite electrode material for supercapacitors, RSC Adv., 2014, 4(30), 15511–15517 RSC.
| This journal is © The Royal Society of Chemistry 2023 |